Article

Effect of Hot Spot within Combustion Liner on YSZ Crack Propagation Mode

1
Tianjin Key Laboratory of Civil Aircraft Airworthiness and Maintenance, Civil Aviation University of China, Tianjin 300300, China
2
China Southern Technic Branch, Guangzhou 510405, China
3
Guangzhou Aircraft Maintenance Engineering Company Limited, Guangzhou 510470, China
*
Author to whom correspondence should be addressed.
These authors contributed equally to this work.
Coatings 2023, 13(6), 1056; https://doi.org/10.3390/coatings13061056
Submission received: 25 April 2023 / Revised: 31 May 2023 / Accepted: 2 June 2023 / Published: 7 June 2023

Abstract

:
On the aero-engine combustor liner, a phenomenon of overheating resembling a hot spot exists, accompanied by a preferential peeling of the YSZ thermal barrier coating that will negatively affect the service life of the component. The hot spot temperatures will affect the ineffectiveness of YSZ, so in this paper, the morphological and property changes of YSZ sintering is investigated experimentally, and a coupled analysis of the YSZ crack propagation mode under the hot spot is performed using ABAQUS. The results show that the pore fractal size D of YSZ increases by 15%. Inside the hot spot region, the coating has a shear stress of 75 MPa. By inserting cohesive units globally in the FEM to simulate the random crack initiation and propagation, unlike the thinning of YSZ layered peeling caused by uniform superheating, the hot spot will cause the crack initiation at the tip of the pores inside the coating and the oblique propagation, eventually forming an oblique crack connection through the pores. When the temperature gradient reaches 30 K/mm, the crack propagation is 40% greater than in a uniform temperature field; consequently, the YSZ in the hot spot boundary region with a greater temperature gradient results in more severe bulk peeling.

1. Introduction

Thermal barrier coatings systems (TBCs) are utilized to increase the operating temperatures of advanced gas turbine engines and the thermal protection capacity of the engine’s hot section components [1]. TBCs are made up of three layers: a ceramic top layer (TC), a metal bonding layer (BC), and a metal substrate (SUB), with the TC made of YSZ (usually 6%–8% Y2O3 partially stabilized ZrO2), which forms a porous structure by atmospheric plasma spraying (APS) and is utilized to separate portions of the temperature transfer. BC is employed as an oxygen permeation barrier and to alleviate the thermal expansion mismatch between the TC ceramic material and the metal substrate [2,3]. TBCs on the surfaces of combustion chamber components significantly minimize heat flow and thus allow metallic components to endure high temperatures above their limit, enhancing gas turbine efficiency. The principle is to isolate a portion of the temperature transmission via porous YSZ (primarily 6%–8% Y2O3 partially stabilized by ZrO2). However, TBCs will have a shorter lifespan in environments with elevated temperatures. Statistical analysis of a particular type of aero-engine combustion chamber hole probe images reveals that there is preferential shedding of thermal barrier coating between the cooling holes of the flame barrel wall insulation tiles, accompanied by the ablation point phenomenon, and that it is one of the primary causes of wall failure [4,5,6]. The analysis of the temperature field of the combustion chamber of the aero-engine and the flow field around the cooling holes reveals that, due to the admixture of hot gas and cooling gas, the temperature can reach 1573 K in some areas and there is a large temperature gradient, a temperature gradient of more than 10 °C/mm, referred to as the hot spot, which has an effect on the stress distribution and failure law of the coating [7,8,9].
Several factors, such as thermal growth oxide (TGO) and morphology at the interface, sintering of TC layers, creep, and plasticity, interact to cause the failure of TBCs due to high temperature, and for the hot spot high-temperature region, the sintering effect of the coating is more pronounced [10,11]. The strain difference caused by the disparity in thermal expansion of the layers under temperature loading as a result of the change in material toughness brought about by coating sintering must be compensated for by crack propagation within the coating [12,13]. SiKyaw et al. concluded that the increased elastic modulus of YSZ due to sintering would result in a stress increase of approximately twofold, which contributes to crack propagation [14]. Wei et al. concluded that the emergence of coating fractures is closely related to the alteration of the material’s properties caused by high temperature. The sintering of the coating promotes the accumulation of strain energy at the fracture tip of the TC layer, thereby facilitating crack initiation and propagation [15], and as a result of the lower fracture toughness and pore morphology, coating cracking occurs primarily within the ceramic layer and extends along the path of pores and brittle plate boundaries [16,17]. A.G. Evans et al. discovered that the longitudinal temperature gradient within the coating will produce a corresponding stress gradient. In addition, the temperature gradient distribution of the hot spot has an influence on the coating failure [18]. Yang et al. came to the conclusion that fractures within the ceramic layer are more likely to appear in regions with a greater temperature gradient [19]. It can be inferred that the sintering action of YSZ under the influence of high temperature will alter the structure and properties of the original coating, and that the temperature gradient distribution will generate new stress concentration points and crack propagation patterns; however, the transverse temperature gradient of the hot spot is not considered in the current study [20,21,22]. Therefore, the original life prediction method based on interfacial fracture is no longer used in environments where hot spots are heated. Therefore, it is necessary to study the effect of hot spots on crack extension under sintered morphology and evaluate the relationship between thermal concentration and crack patterns.
In investigation methods on cracking, the finite element method (FEM) is commonly used to simulate the formation and growth of cracks. Kadam and Koushali et al. used the finite element method to perform failure analysis in the context of YSZ and concluded that the internal stresses causing coating cracking are typically interlayer positive stresses and shear forces, which correspond to type I and type II fracture modes, respectively [23,24]. Using the finite element method, Zhi-Y et al. explained the YSZ coating peel fractures as the connection between the interface peak and the cracks within the YSZ [25]. Kai et al. came to the conclusion that the connection of the fractures within the YSZ would result in a rupture region later in the coating’s lifetime, thereby accelerating the coating’s peeling [26]. Consequently, the crack extension and connection problem will be a significant factor in coating failure; however, previous studies on thermal barrier coatings focused on the analysis of internal stress and interface morphology of the coating, concentrating on the TBC failure mode and the corresponding failure mechanism, while simplifying or ignoring the effect of the morphology of the porous YSZ on crack extension. Xie et al., for instance, utilized the residual stress equation related to thermal mismatch to explain that a change in thermal load will lead to a difference in thermal expansion of the coating, resulting in tensile stresses that cause microcracks in the TC [27]. However, the effect of the actual morphology of the sparse and porous APS TBC on the stress distribution of the coating cannot be captured. Therefore, it is necessary to create a finite element model (FEM) using the actual coating morphology, which can explain the failure mechanism more thoroughly.
Due to internal defects and sintering, hot barrier coatings will have more complex stress states in hot spot environments and will generate new crack propagation patterns. Through experimental and simulated methods, this study studies the process of expansion of new cracks in TBCs with combustion characteristics under hot spot heating, compensating for the study of the effects of horizontal temperature gradients on the failure of YSZ, providing a basis for the prediction of heat barrier coating life under complex temperature conditions. By preparing TBCs specimens and obtaining YSZ samples with varying degrees of sintering, we summarize the changes of coating morphology and properties caused by sintering, extract typical sintering morphology features to establish an FEM of the coating with real pores, analyze the stress distribution within the coating under hot spot loading, and simulate the random cracking process under temperature cycling by inserting cohesive units globally, comparing with the actual thermal barrier coating morphology of the combustion liner to validate the hot-spot-influenced crack propagation process.

2. Materials and Methods

In this paper, the sintering behavior of YSZ is investigated using an experimental method, and a numerical method is used to simulate the crack extension behavior of YSZ under the influence of hot spot.

2.1. Experimental Procedure

Sandblasting was used to prepare the hastelloy X specimens prior to the deposition of a 150 μm NiCoCrAlY bond coat and a 300 μm YSZ top coat using a Praxair 3710 atmospheric plasma spraying (APS) system and an SG100 spray gun. Table 1 outlines the deposition parameters.
TBCs have significant sintering behavior above 1000 °C [28]. According to the wall temperature of Figure 1, it can be seen that the super 1100 °C region can account for up to 37% and contains the ablation region. To understand the morphology and property transformation process under the sintering behavior of YSZ, the TBCs samples were treated at 1373 K (1100 °C) in 10 h, 20 h, 50 h, 100 h, and 150 h cycles. This method employs a high-temperature furnace with a heating rate of 350 K/h and a cooling rate of less than 90 K/h to inhibit the propagation of YSZ fractures. Comparatively, another specimen with the same holding duration at 1423 K (1150 °C) was collected.
The layers were investigated using an OLYMPUS LASER and TESCAN MIRA LMS electron scanning microscope. The effect of sintering behavior on pore variation was described by applying fractal theory to the processing of pore morphology using image software. The fractal dimension D of the pores was correlated as follows with the individual pore areas S and perimeters L [29]:
L = A S D 2 ,
log L = D 2 log S + log A ,
where L is the pore diameter in microns, S is the pore area in micrometer squared, and A and D are dimensionless. Using Equations (1) and (2), the fractal dimension distribution of the pores in each sintered morphology was inputted, and a linear regression equation was fitted. The value of D ranges from 1 to 2 and is dependent on the morphology of the pores; the flatter the morphology of the pores, the greater the fractal dimension D [30].
The YSZ elastic modulus was measured with a holding duration, and the indentation method was chosen due to its ease of use and small sample size requirement, as well as its extensive use in measuring the performance of TC layers. The diamond indenter indentation process was used, utilizing constant load rate method, a loading load of 50 N, and loading time of 15 s. To eliminate the effect of creep, the set load retention time was 10 s, and sink speed was 0.10 nm/s. The load–displacement relationship was obtained using Formulas (3) and (4) to calculate the elastic modulus [31].
E r = π 2 S A ,
Where Er is the equivalent elastic modulus, S is the stiffness, which can be obtained by unloading the load to the depth by derivation, and A is dimensionless. The elastic modulus of the material under test is calculated by Equation (4):
1 E r = 1 v 2 E + 1 v i 2 E i ,
Where Ei, νi is the indenter elastic modulus and Poisson’s ratio, taking the value of 1140 GPa and 0.07, and assuming the Poisson’s ratio of YSZ is constant at 0.2 for calculation.
As seen on the image of the combustor liner borescope, there are areas of concentrated ablation between the cooling openings (Figure 2a red circle), along with preferential peeling of the TBCs (Figure 2a yellow circle). Using a confocal microscope to produce cross-sectional 3D morphology to characterize the cracks, the cross-sectional position of the ablated part was determined as depicted in Figure 2b.

2.2. Finite Element Model

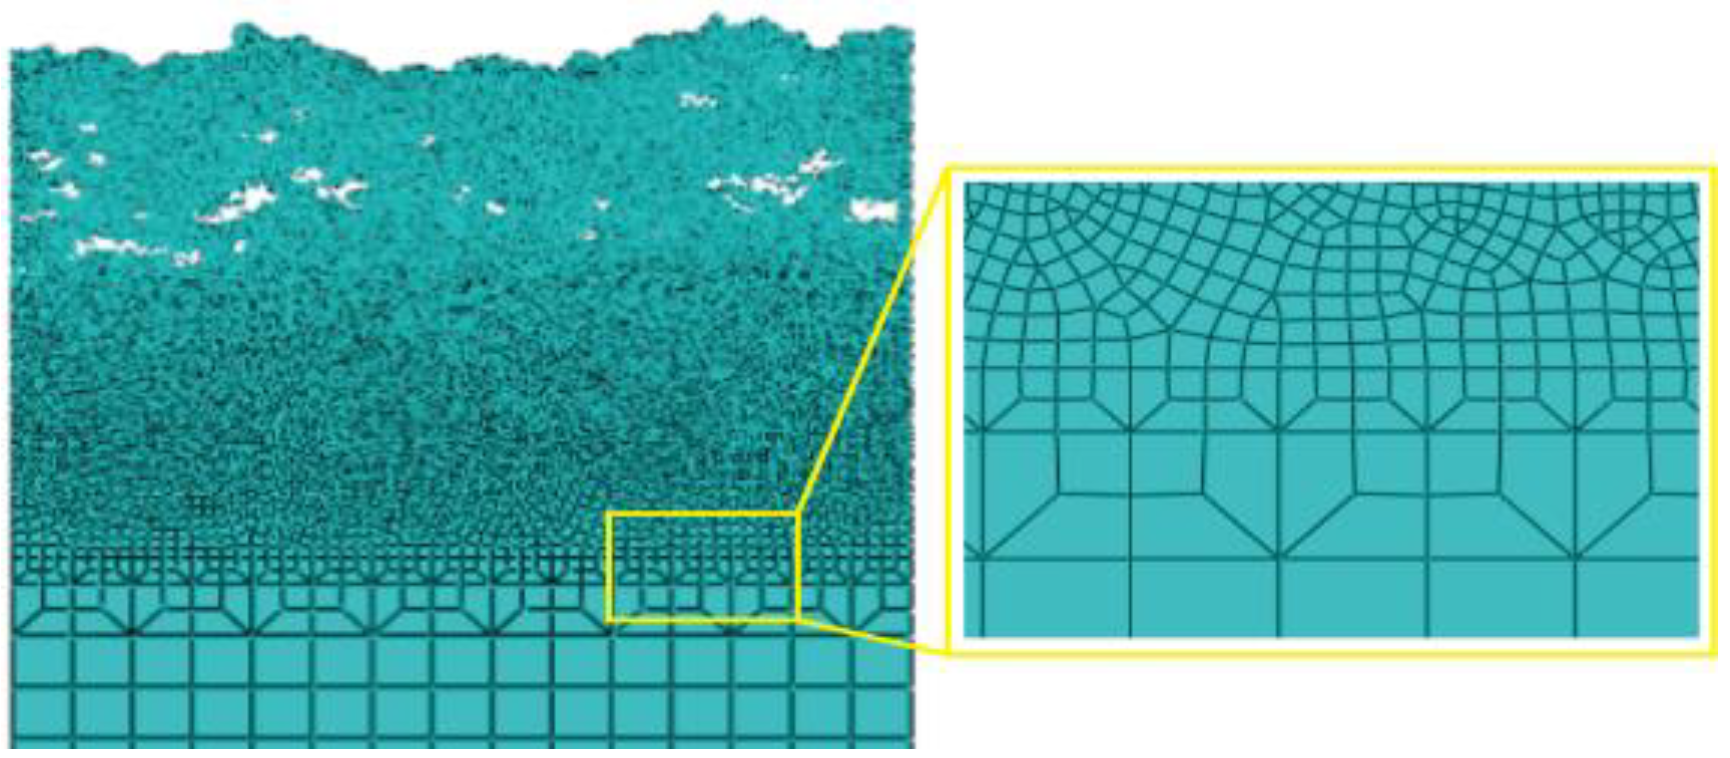
2.2.1. FEM Development

The simulation FEM of the thermal barrier coating system was performed using the ABAQUS finite element software. Because the TBCs structure and hot spots are repetitive and symmetrical, and the simulation focuses on understanding the crack expansion patterns caused by sintering and heat, the coating structure was simplified to a 2D axisymmetric FEM with pore characteristics, which allows for simple calculations [32]. As depicted in Figure 3, the cross-sectional micrographs of the experimental specimens were binarized and the characteristic parameters of the pore morphology were extracted by the graphics processing software and DXF files were generated, which were sent to ABAQUS to establish TBCs (a). Since the purpose of this paper is to examine the effect of ceramic layer sintering on the internal crack pattern of ceramic layer, and previous research indicates that the coating is dominated by sintering failure in high temperature environments, the impact of interfacial TGO was disregarded [10,33]. The FEM was 1 mm long, the TC layer was about 0.3 mm thick, and the BC layer was about 0.15 mm. The TC layer was configured with a finite element (FE) mesh that was encrypted. Given that the volume of pores is significantly greater than that of microcracks, only the pore effect was considered in the modeling, and micrographs with a complete TC layer were chosen to more accurately model the effect of pore changes on the YSZ elastic modulus, while directly characterizing the macroscopic condition of the coating represented by the pores.
In order to verify the validity of the actual FEM, the YSZ grid cell density was set to 220 GPa to reflect the degree of sintering caused by the real pore morphology [34]. The YSZ elastic modulus was computed using the steady-state mechanical simulation (Equation (5)), and the comparison to real-world measurements is depicted in Figure 4. The simulation value is higher than the experimental value because FEM border conditions were simplified to fix the left border, the right border added additional load, and the 1 μm or lower gap was ignored due to the calculation limitation. However, the difference between the modulus E obtained by simulation and experimental methods is less than 6% of the measured value, demonstrating that the image-based FEM captures the main microstructural features contributing to the variation of the YSZ elastic modulus, and that ignoring finer cracks and pores is acceptable.
Here, E is the elastic modulus, P is the applied load, A is the cross-sectional area, and ε is the strain.
E = P A 1 ε
In the FEM cell, we set the TC layer as a triangular mesh with approximate mesh size of 0.003 mm to improve the calculation accuracy, because triangular mesh has constant strain across the element. Mesh refinements for pore boundaries are of more concern to us; when the mesh is dense enough, the crack extension results are not affected by the mesh size [35]. The BC layer was set as quadrilateral mesh with approximate size of 0.006 mm. SUB was set as quadrilateral mesh and we divided 0.006~0.04 mm mesh size over to improve the calculation speed. The adoption of regular meshing, as shown in Figure 5, has no effect on the FEM convergence. We used the FEM mesh property CPS4T and inserted cohesive cell mesh property COH2D4T for temperature and stress transfer.

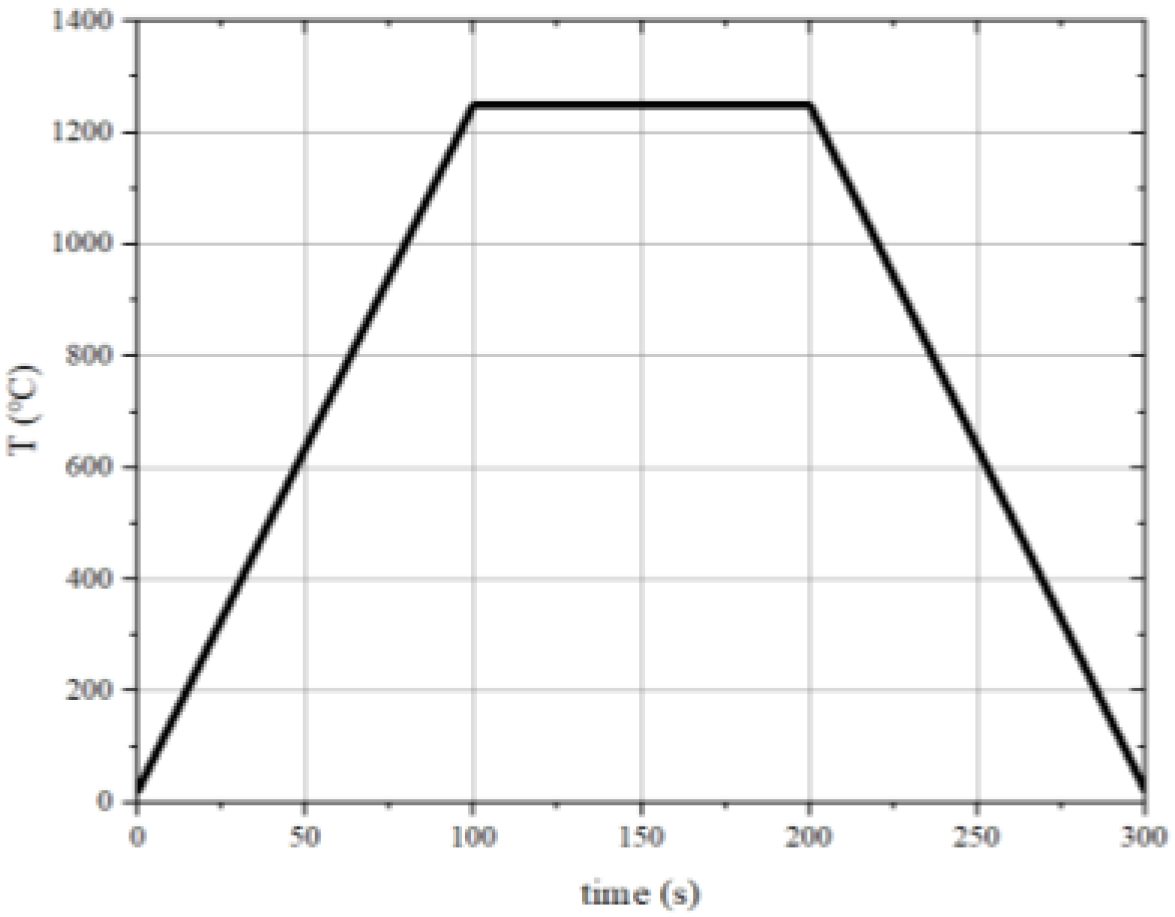
2.2.2. Materials and Boundary Conditions

The material property parameters are shown in Table 2 based on the results of previous measurements [36]. As calculated by the combustion chamber flow field simulation method in the prior study, the wall tile hot spot temperature can reach 1583 K (1310 °C), as depicted in Figure 1, and the maximum temperature gradient in the hot spot edge region can reach 60 °C/mm, so the heat condition is determined as the FEM upper-surface-applied 1523~1463 K hot spot gradient heat load, and the loading temperature variation with time is depicted in Figure 6 [8].
In addition, surface convective heat transfer at room temperature was applied to the FEM’s top and bottom surfaces, and the convective heat transfer coefficient was calculated using Newton’s cooling equation [37]. To simulate the coating degrees of freedom, periodic boundary conditions were applied to the remaining three edges except the surface, with the left boundary having 0 degrees of freedom along the x-axis; coupling constraints were applied to the right boundary to ensure that all nodes had the same x-displacement; and the bottom boundary had 0 degrees of freedom along the y-axis to simulate frictionless support. Self-contact was set for the pores to prevent cell penetration when heated, and the characteristics are longitudinal firm contact and tangential frictionlessness.
q = α Δ T ,
where ΔT is the temperature difference between the solid and the room, and the reference experimental parameters can be derived from the convective heat transfer coefficients of 125 W/(m2K) on the coating surface and 75 W/(m2K) on the rear of the substrate.

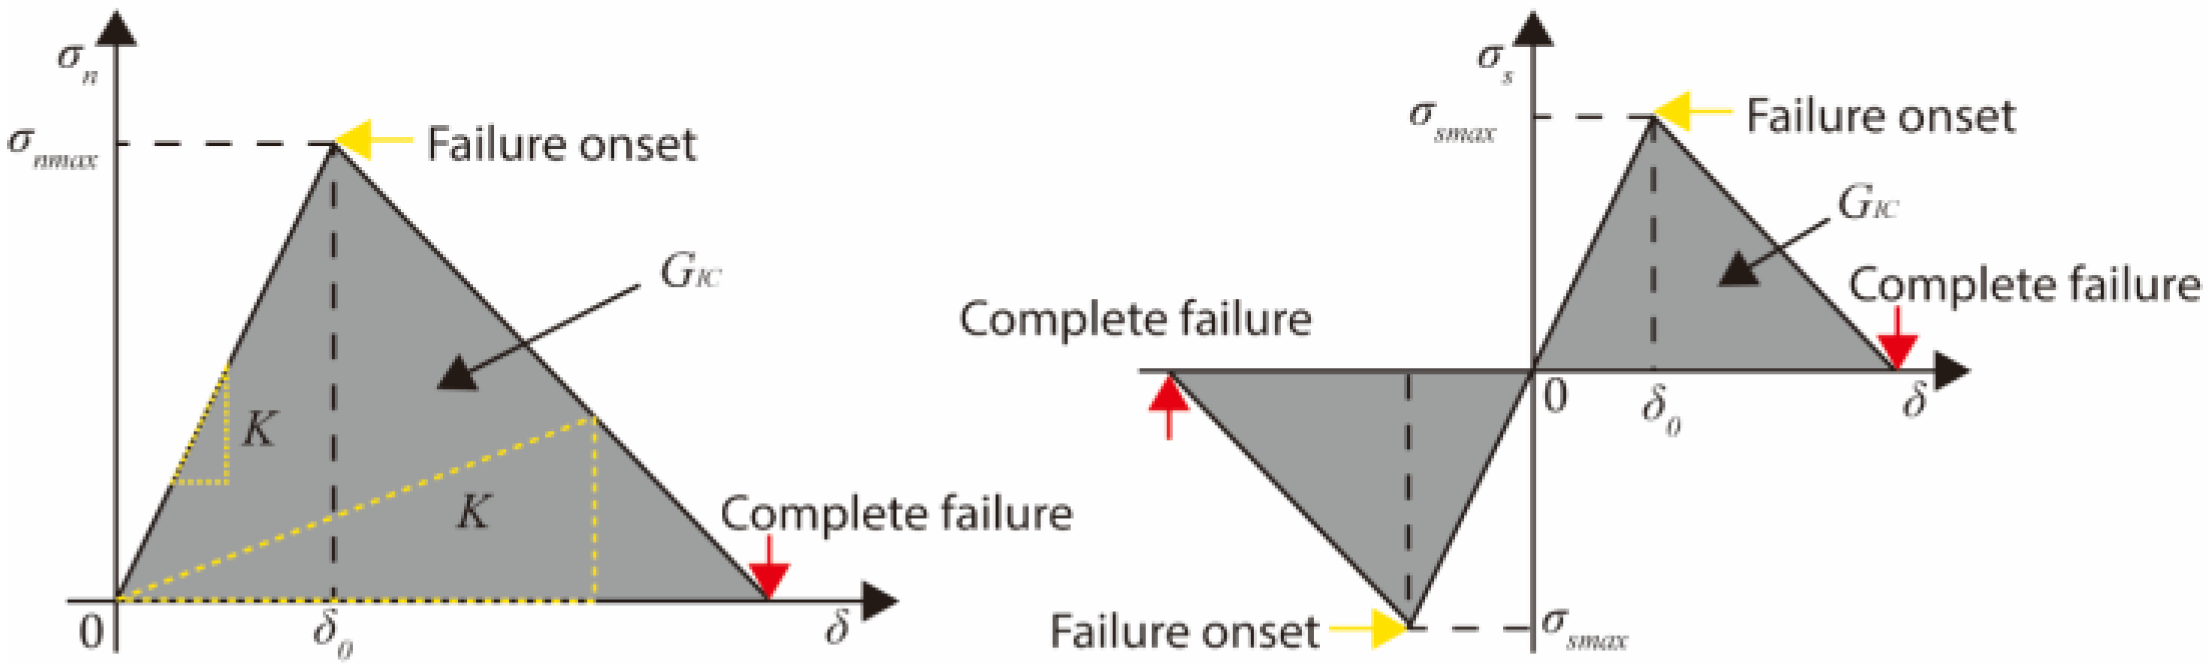
2.2.3. Crack Propagation Simulation

Cohesiveness is based on the premise that there is a small fracture process area at the fissure tip. As the tension between the crack surfaces increases, the material reaches its cohesion strength value and then begins to lose stiffness. Fissure propagation occurs when the distance between fissure surfaces increases to the point where the fracture energy (GIc) is satisfied. By inserting the cohesive cell globally in the TC layer (Figure 3b), it is possible to simulate the crack propagation characteristics of the TC layer under the influence of a hot spot by simulating the random initiation and propagation of cracks. As shown in Figure 7, the relationship between the traction force and displacement of the cohesive cell is governed by a bilinear law.
Crack propagation is usually divided into two stages: damage initiation and damage evolution. In the first stage, i.e., δ < δ0, the quadratic stress criterion is used as the damage criterion, as shown in Equation (7), where only normal and tangential stresses are considered in the 2D FEM. The material stiffness K is the ratio of the hardening factor En to the effective thickness heff, as shown in Equation (8):
σ n σ n max 2 + σ s σ s max 2 = 1 ,
K = E n h e f f ,
In this paper, heff takes the value of 0.01 mm and δ0 takes the value of 0.2 × 10⁻⁶ mm. As the load increases, the normal stress σn and tangential stress σs on the surface of the cohesive unit reach the damage criterion, respectively. With reference to the previous toughness measurements of YSZ, the cohesive strength σnmax and σsmax of the cohesive unit of YSZ were taken to be 50 MPa with a fracture energy (GIc) of 20 J/m2. The normal cohesive strength σnmax of the interfacial cohesive unit was taken to be 200 MPa with a fracture energy (GIc) of 20 J/m2, and the tangential cohesive strength σsmax was taken to be 100 MPa with a fracture energy (GIc) of 60 J/m2 [24~25]. After the starting criterion is reached, δ0 < δ, the material stiffness K begins to degrade, expressed using the damage evolution criterion as follows:
K = K 1 d δ > δ 0 K δ < δ 0 ,
where d is the total material damage, an initial value of 0 indicates that no damage has occurred, and its monotonic increase to 1 after the onset of damage indicates that the unit has failed completely.

3. Results

3.1. Thermal Insulation Experiment Results

Figure 8 depicts the morphology of the APS TBC ceramic layer at 1373 K (1100 °C) with varying holding times. Figure 8a depicts the initial morphology of the coating layer, which consists of narrow microcracks with spherical pores of 1~5 μm in diameter, with some pores intersecting with the fractures. Figure 8b demonstrates that after 10 h of holding, healing occurs in the middle of the microcracks, and the crack length and density diminish, while the spherical pores remain essentially unchanged. After 20 h, as depicted in Figure 8c, the microcracks healed and the number of spherical apertures diminished. Figure 8d demonstrates that after 50 h of heat preservation, crack propagation occurs in the TC layer, and the crack width and length are significantly larger than the microcracks in the initial morphology of Figure 8a. Figure 8e,f reveal that after 100 h of heat preservation, the crack propagation and pores are connected, and the morphological characteristics are essentially fixed.
Figure 9 illustrates the morphological alterations of APS TBC during heat treatment. In its initial configuration, the TC layer has a large number of microporous openings and fissures. As shown in Figure 10, the fragmentation theory is used to quantitatively characterize the form of the gap. It is known that the concentration of the loop in its initial form is distributed in the region logL < 2.0, logS < 2.5. The linear regression equation for the distribution point of the gap is established, and the fragmentary dimension D is 1.10, indicating that the inner permeable gap in the TC layer is currently a smaller circle. After 10 h at 1373 K (1100 °C), the radius of the opening in the shape depicted in Figure 9b increased. In conjunction with Figure 8b, it is known that the microcracks heal swiftly, the spherical cavity is maintained, and the cavity concentration is distributed in the region logL < 2.5, logS < 3.0. The fractal dimension D is 1.29, indicating that the 10 h thermal treatment widened the gap while making it flatter. In the shape of Figure 9c, temperature 50 h, observed in the midst of the TC layer and the interface, the gap larger than 10 μm in diameter is linked to horizontal and vertical cracks, and a portion of the gap has logL > 2.5, logS > 3.0. The fractal dimension D is 1.24, which indicates that when the heating time is increased to 50 h, the degree of foaming of the gap is delayed and the size of the loop, with the exception of a few gap connections, remains relatively constant. Figure 9d depicts the coating’s morphology after 100 h of warming, with the gap remaining essentially unchanged. The fractal dimension of D is 1.20, and when combined with the YSZ module in Figure 8 and the known changes in the heat retention time, the microcracks of the early coating heal rapidly. At this time, the growth rate of the module is higher, but as the duration of the thermal retention increases, the growth rate of the modulus decreases. When the insulation duration reaches 50 h, the gap’s size and flatness are essentially fixed.
Observably, the higher temperature causes the modulus E value to rise more rapidly, but the modulus E difference is only 1.4% of the measured value after 50 h of insulation. Since the temperature difference is only 60 K, the hot spot temperature gradient is disregarded for the ceramic layer properties and structure, the 50 h coating morphology with stable sintering characteristics is selected in Figure 9c, and the morphological features are extracted to develop the numerical geometric FEM.

3.2. Numerical Simulation Results

3.2.1. Stress Distribution

Failure of the TC layer to spall originates from the internal crack propagation, and the type I and type II crack extensions present in the TC layer are influenced by the principal stresses and shear stresses. Therefore, the analysis of transverse stress parallel to the interface σxx (S11), normal positive stress perpendicular to the interface direction σyy (S22), and shear direction stress τxy (S12) can serve as a guide for locating the critical zone and predicting fractures.
The stress analysis of YSZ is carried out by taking the stress cloud map at the early stage of cooling, as shown in Figure 11a. Due to the large number of pore defects existing in the real morphology of TC layer affecting the stress distribution, the positive stress S11 has a concentrated stress distribution at the bottom of the pore, and the stress gradient between the 2 μm radius zone can reach 90 MPa. As shown in Figure 11b, the positive stress S22 is tensile in the TC layer, and is concentrated at the interface valley with TC layer defects on both sides; the stress value on the side away from the hot spot is greater than that on the side near the hot spot, the stress gradient is less than S11, and the stress gradient between the radius 8 μm zone is 50 MPa. Shear stress S12 is distributed as shown in Figure 11c, and is affected by the hot spot in the interface crest, which near the hot spot side (left side) is positive, and away from the hot spot side (right side) is negative, and the shear stress is distributed around the defects in the TC layer. However, there is a larger stress area in the interface region at the edge of the hot spot, but the shear stress S12 gradient is less compared to the positive stress, and it is known from simulation results that the maximum shear stress can reach 75 MPa during the initial stage of insulation.
The stress concentration point at the apex of the pore causes coating damage, and the stresses that dominate the damage vary depending on the location of the pore. As depicted in Figure 12, the S11 direction stress profile at the bottom point A of the defect is greater than the remainder of the stress, with a maximum value of 145 MPa, causing the crack to grow along the vertical interface direction. The S22 stress at the right point B of the defect is greater than the remainder of the stress, with a maximum of 79 MPa, causing the crack to expand laterally. In addition, the entire process of temperature cycling is accompanied by shear stress S12, which will affect the crack propagation angle.
The stress magnitude at the interface is also sufficient to induce interfacial damage, as shown in Figure 13a, where the variation law of each stress with the interface can be seen. The tip of the crest is accompanied by a concentrated distribution of positive stress S11, and constant for the tensile effect, which is the same as the simulation results of the simplified FEM with the cosine as the interface, and the stress magnitude decreases with the increase in the distance from the interface [38]. The maximal peak of S12 exists on the side of the interface wave crest away from the hot spot in the edge region of the hot spot, i.e., at an x-coordinate of 0.17 mm. There is a concentrated distribution of positive stress S22 at the trough, and the magnitude of the stress is dependent on the amplitude of the interface; the larger the amplitude, the greater the value of S22 in the trough distribution.
The stress distribution pattern of the surface is depicted in Figure 12b, where the positive stress is predominantly compressive and the shear stress S12 is concentrated at the surface trough, with a maximum value of 32 MPa at the edge of the hot spot, or 0.24 mm at the x-coordinate, indicating that the transverse temperature gradient of the hot spot and the undulating shape of the surface jointly affect the stress distribution of the coating surface, causing the surface trough. At the boundary of the hot area, the surface valley is subject to a substantial shearing effect.

3.2.2. Crack Propagation Simulation Results

As Figure 14a depicts the crack budding stage under hot spot heating, it can be observed that cracks are preferentially budded at the pores within the TC layer, and when combined with the stress law in Figure 11, it can be observed that the pore cracks are deflected and expanded obliquely toward the surface and interface due to shear force. Figure 14b depicts the crack extension stage. During this stage, the crack extends from the previous pore crack to the connection between the pores and continues to expand after passing through the pores. Furthermore, due to the concentration of shear stress S12, crack initiation occurs at the surface groove and extends along the oblique direction. Figure 14c depicts the failure stage of the fracture, which occurs when pores sprouting from the middle of the coating connect to other pores, the crest of the interface, and the trough of the surface, resulting in a severe crack connection phenomenon that leads to the bulk peeling of YSZ. Bulk peeling occurs at the boundary of the hot region because it has a high temperature gradient.
In a uniformly heated environment at 1473 K (1200 °C), Figure 15a depicts the crack initiation process of the TC layer, and when combined with Figure 13b, it is clear that the high temperature will cause shear stress at the surface valley, and that crack initiation occurs at all valleys with a large surface amplitude due to the uniform heat. In addition, the interior of the TC layer lacks crack initiation, which is a result of the absence of shear tension within the TC layer. Unlike the shear stresses within the coating caused by hot areas, YSZ exhibits greater resistance to positive stresses than shear stresses. Figure 15b depicts the crack extension stage, in which surface cracks extend toward the interface and new cracks sprout in the remaining surface troughs. In comparison to the hot spot results at the same loading time, the TC layer has a greater number of surface cracks, but the extension depth is limited and does not reach the peel crack length.
In conclusion, under hot spot heating, cracks sprouted in the TC layer in the order of pore, surface, and interface, eventually forming oblique severe connection failure cracks in the hot spot’s edge region. In contrast, under uniform heating, multiple cracks sprouted at the surface trough of the TC layer, and a comparison of the results with the same loading time of the hot spot reveals that the number of cracks that sprouted under uniform heating was greater, but the propagation depth of a single crack was limited, and it was unable to peel off YSZ.

3.3. Combustion Chamber Ablation Part Shape

The cross-sectional coating morphology of the hot spot ablation area on the real aero-engine combustor liner is shown in Figure 16.
Comparatively, the pore length in the TC layer of Figure 16e can reach 1 mm, which is greater than the pore length of 0.40 mm in Figure 16d. Combined with the morphological change law of the TC layer in the insulation sintering experiment, it can be concluded that the region in Figure 16e between the two cooling holes of the tile has more severe sintering characteristics, which is related to the higher temperature experienced in the center of the hot spot during the service process, and the hot spot area is consistent with the one observed in Figure 2a. The area of concentrated ablation observed in Figure 2 coincides with the hot spot region (a). Taking the coating morphology of the hot spot edge area as shown in Figure 16a, cracks inside the YSZ are observed, and the cracks start from the pores in the middle of the TC layer and expand obliquely to the coating surface and the interface at an angle of 30~45° with the interface direction, which demonstrates that this area is accompanied by a large temperature gradient and is consistent with the internal crack budding process illustrated in Figure 14. In the center of the hot spot, as depicted in Figure 16b, multiple surface cracks are observed to sprout, and the crack location and propagation direction are consistent with the uniform superheat simulation process depicted in Figure 15, indicating that the center of the hot spot is more uniformly distributed, although the temperature is higher, and the coating is affected by uniform superheat during the service process.

4. Discussion

By comparing the above numerical simulation of the hot barrier coating with the real ablated part morphology, it can be concluded that the schematic diagram of YSZ crack propagation under hot spot heating is depicted in Figure 17. Due to the influence of the APS process, there are a large number of pore defects in the initial coating morphology, as depicted in Figure 17a, primarily spherical pores with a cross-sectional area of 300 m2 or less. The lateral temperature gradient of the hot spot causes the YSZ beneath the hot spot to exhibit more pronounced sintering characteristics, as depicted in Figure 17b, which demonstrates an increase in the volume and uniformity of the pores. Referring to the thermal insulation experiments, the fractal dimension D value of the pores increases by 13% due to the effect of sintering, which causes the pore tips to accumulate more tension. Since the pores redistribute stresses within the coating, local sintering of the coating will promote local stress concentration, which contributes to the initiation and growth of macroscopic cracks under the influence of cyclic thermal stresses. As a result of thermal expansion, a concentration of shear tension exists in the valley region of the coating’s surface, leading to the emergence of cracks. As depicted in Figure 17c, the emergence of cracks occurs most frequently at the flattened, relatively large, apertures in the center of the TC layer and at the surface trough of the hot spot region, where the temperature is higher. Due to the shear tension in the coating caused by the transverse temperature gradient of the hot spot, the transverse and longitudinal cracks initiation at the tip of the pore are deflected in the propagation direction due to the shear effect. The crack propagation path is approximately 30~45° from the horizontal angle, as determined by simulation and comparison to the actual shape. As depicted in Figure 17d, once the cracks have penetrated the remaining pore defects within the coating along the oblique direction, they connect with the cracks at the surface and interface, thereby promoting the bulk spalling of the TC layer; and the central region of the hot spot with a small temperature gradient will instigate multiple surface cracks and cause crack connections, which will manifest as laminar spalling.
The studies on the splitting form of YSZ are divided into two forms: layered peeling and partial peeling. Among these two forms, partial peeling with a larger extension depth will be the predominant form causing the rapid failure of YSZ. The law of temperature gradient and crack extension depth for the same loading time are shown in Figure 18, which demonstrates that the depth of crack extension due to the mismatch of thermal expansion coefficient between layers of the coating decreases monotonically with the temperature gradient, and that the temperature gradient accelerates crack propagation and connection along the coating thickness direction. Therefore, the influence of the hot spot on YSZ failure is manifested primarily as bulk peeling caused by crack extension in the edge region of the hot spot. In the life prediction of combustion chamber components, the failure of TBCs is associated not only with temperature, but also with temperature gradient values. The larger the temperature grade at the same temperature, the more severe the functional deficiency of the TBC.

5. Conclusions

In this paper, an FEM of TBCs is devised to describe the distribution of complex stresses within the YSZ and the crack extension process under hot spot heating. The advantage of this model is that the realistic morphology of YSZ sintering is taken into account in the FEM, allowing for the random initiation and propagation of multiple cracks within the TBC. The following is a summary of the research on the pattern of crack propagation under hot spot heating.
(a)
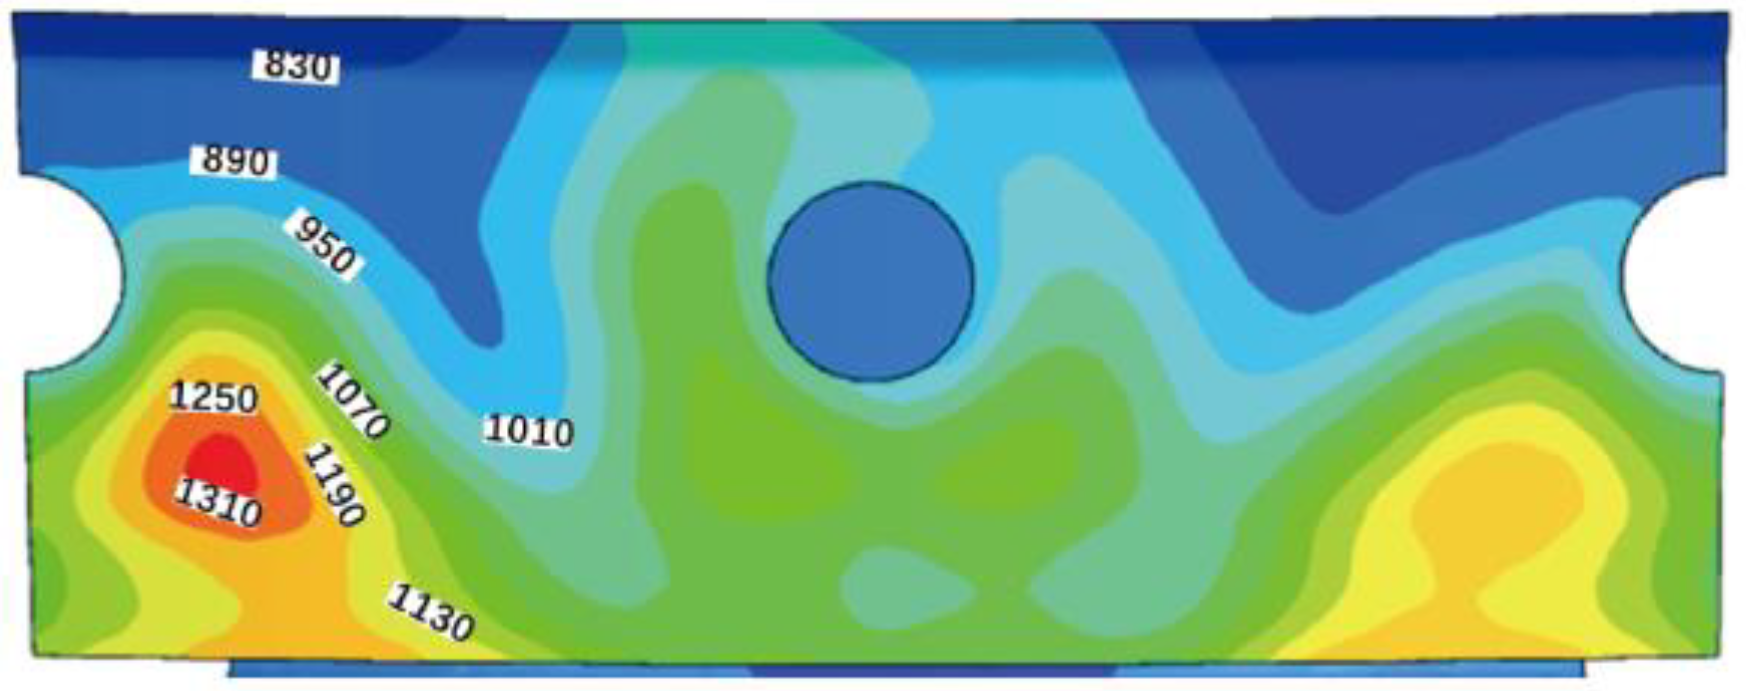
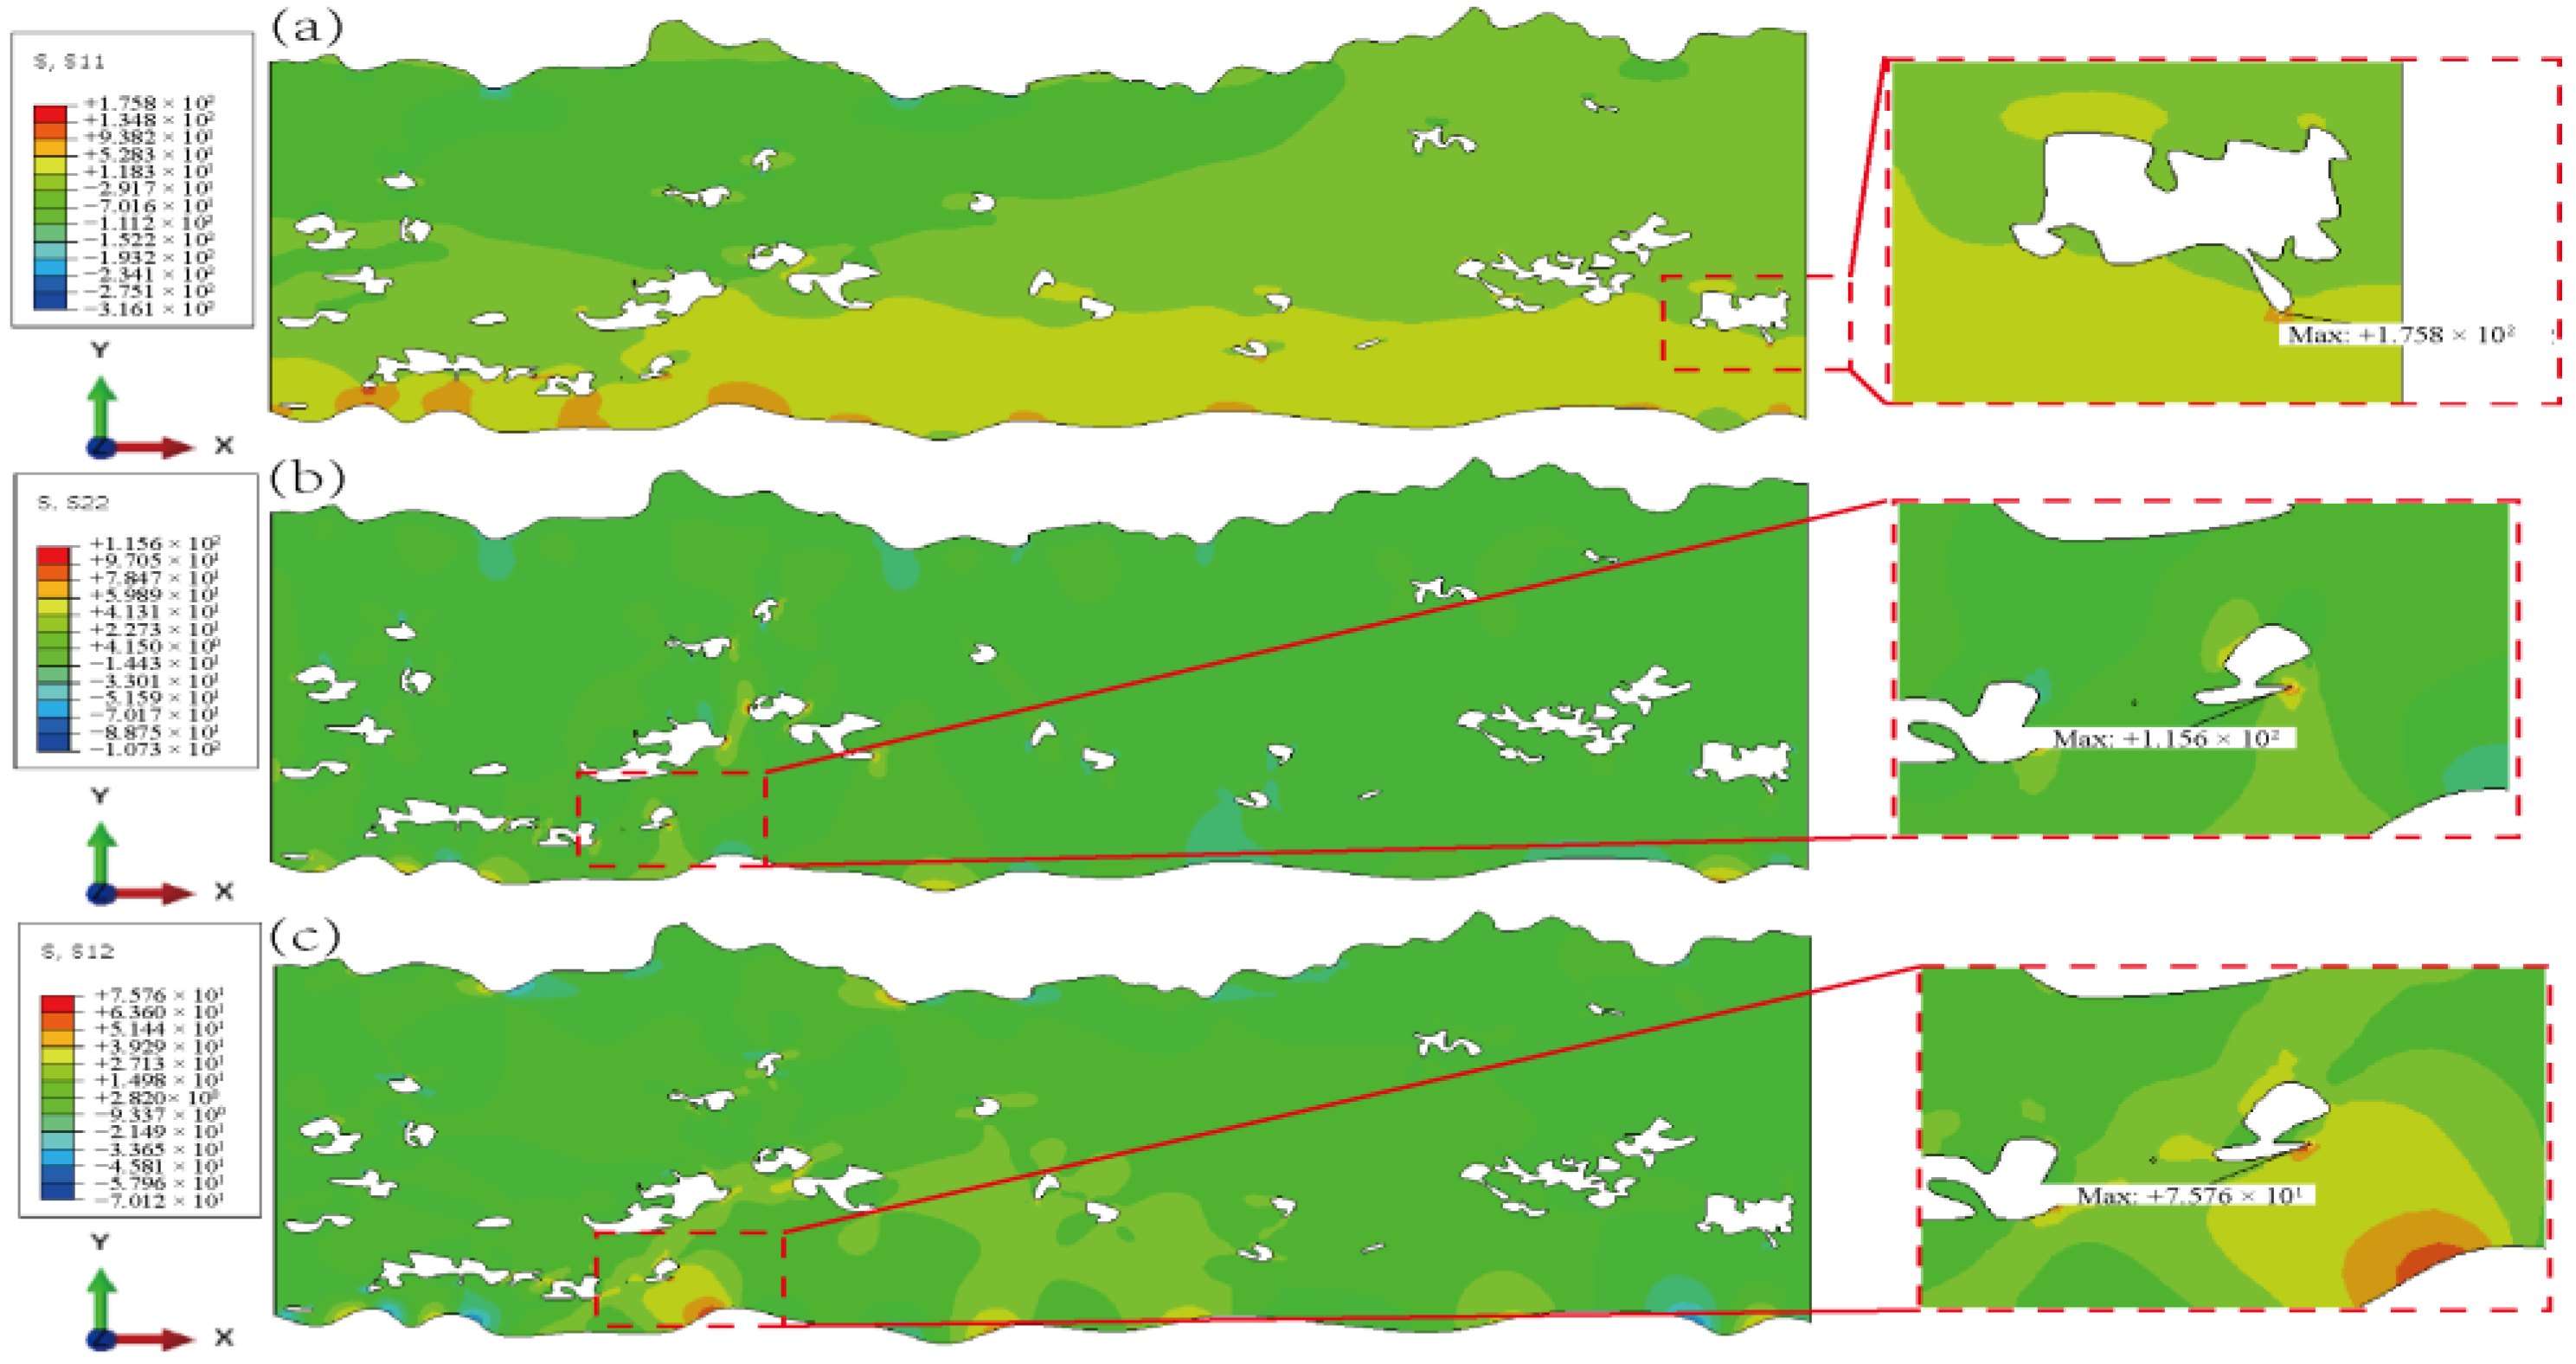
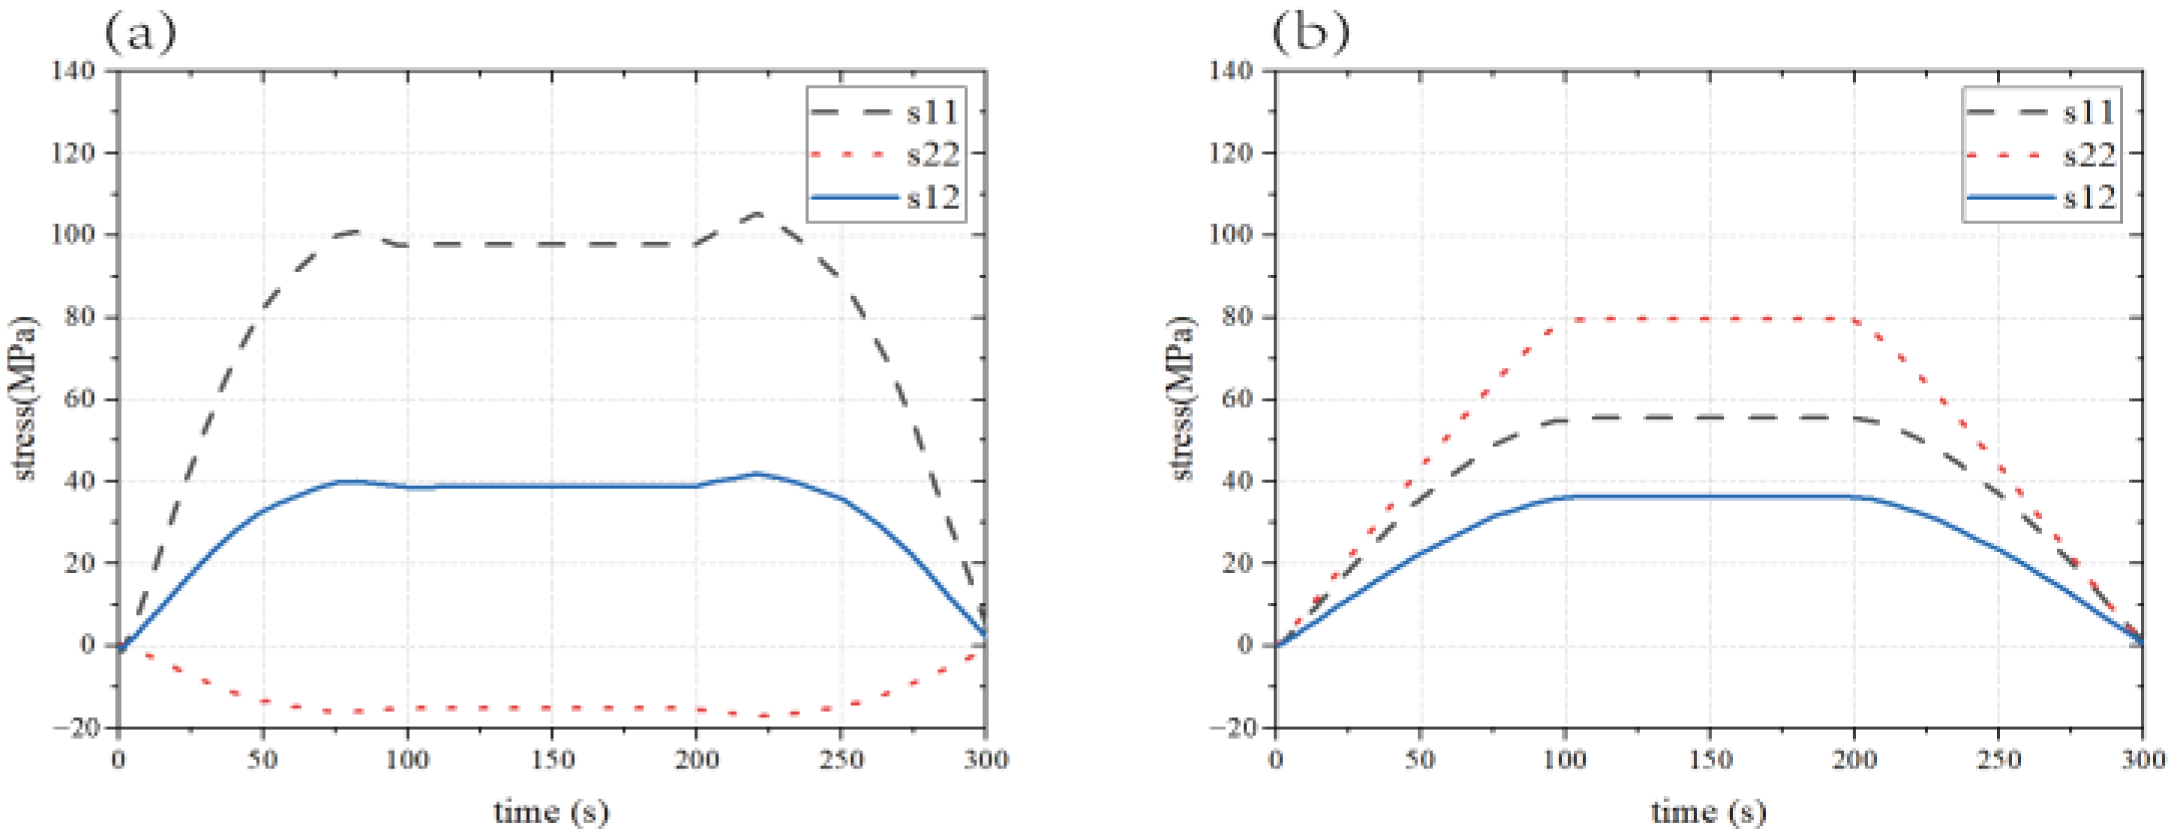
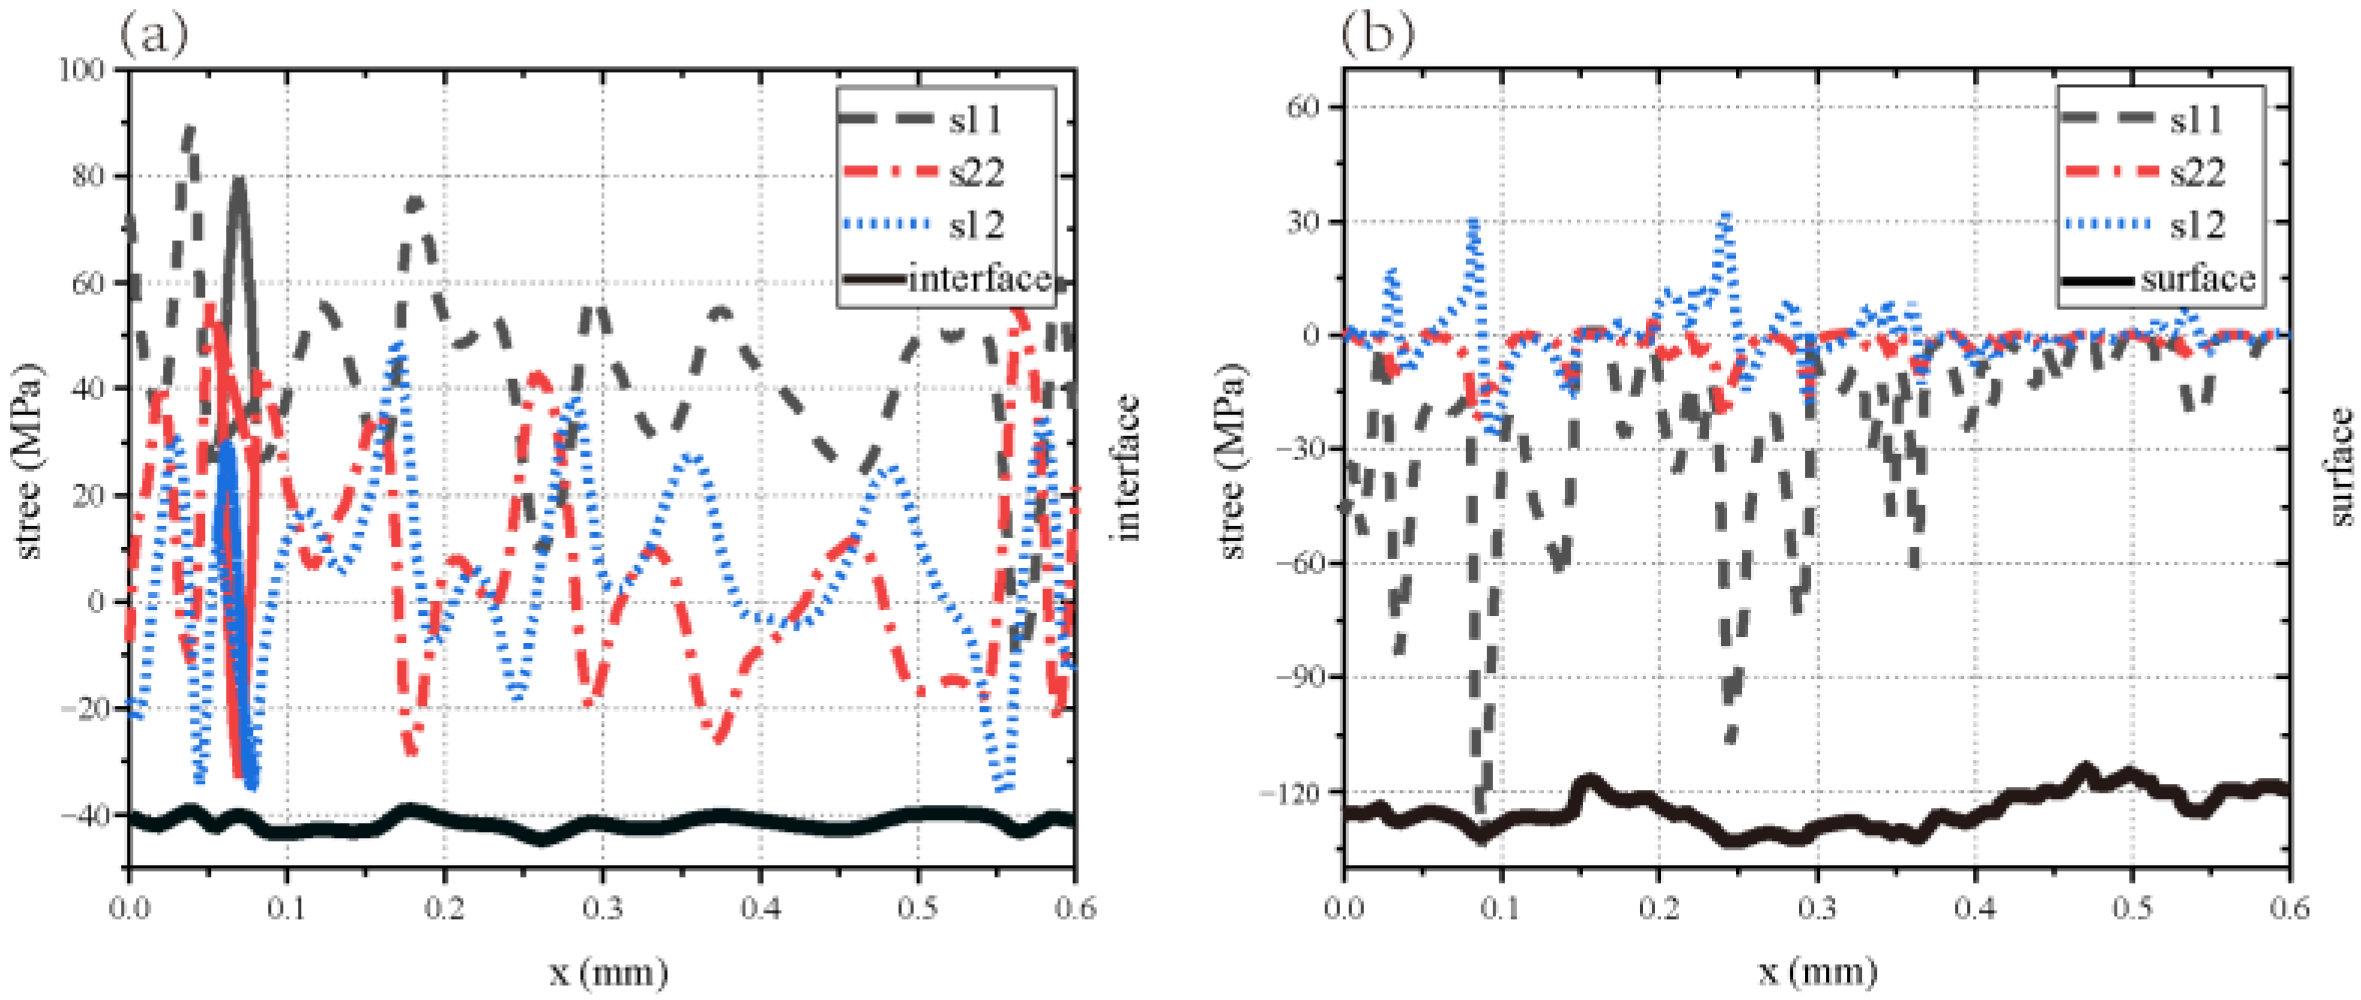
In addition to the longitudinal temperature gradient, the hot spot has a transverse temperature gradient, which results in a more complex stress distribution inside the YSZ. The pore morphology inside the YSZ also has an effect on each stress inside the coating, as demonstrated by the shear stress of 75 MPa inside the coating at the edge region of the hot spot with the largest temperature gradient under hot spot heating, which is concentrated at the protruding tip of the hot spot.
(b)
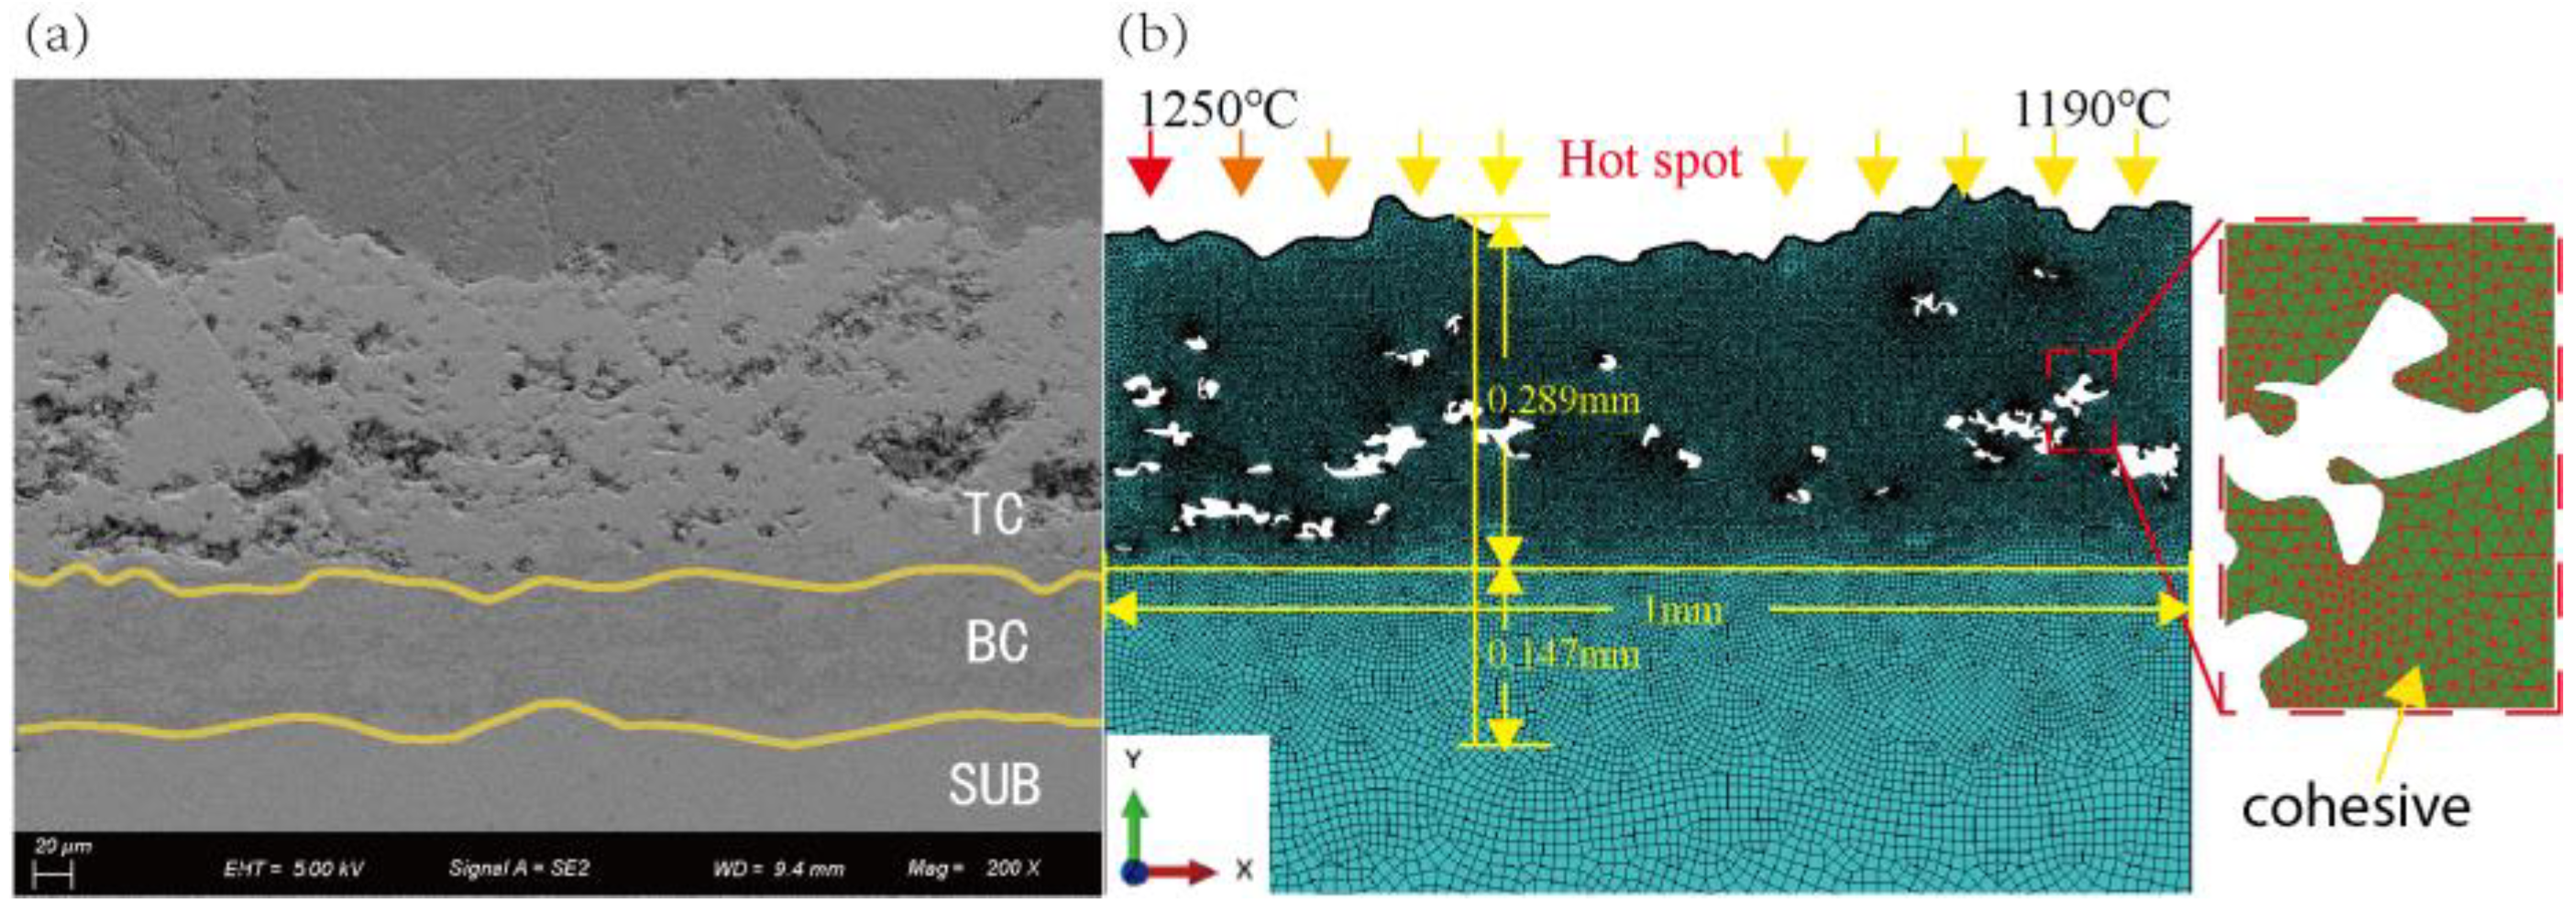
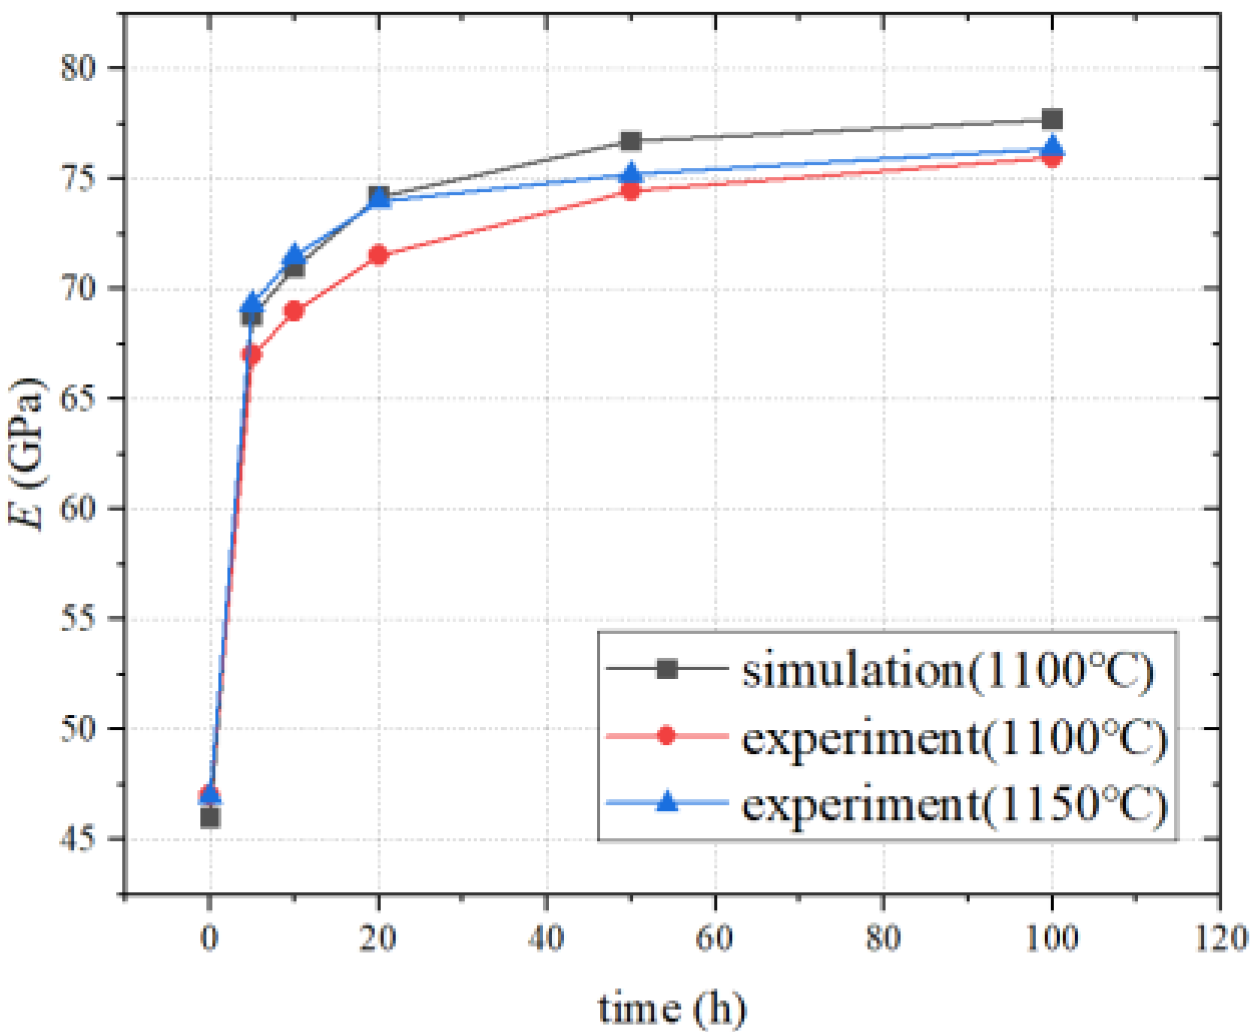
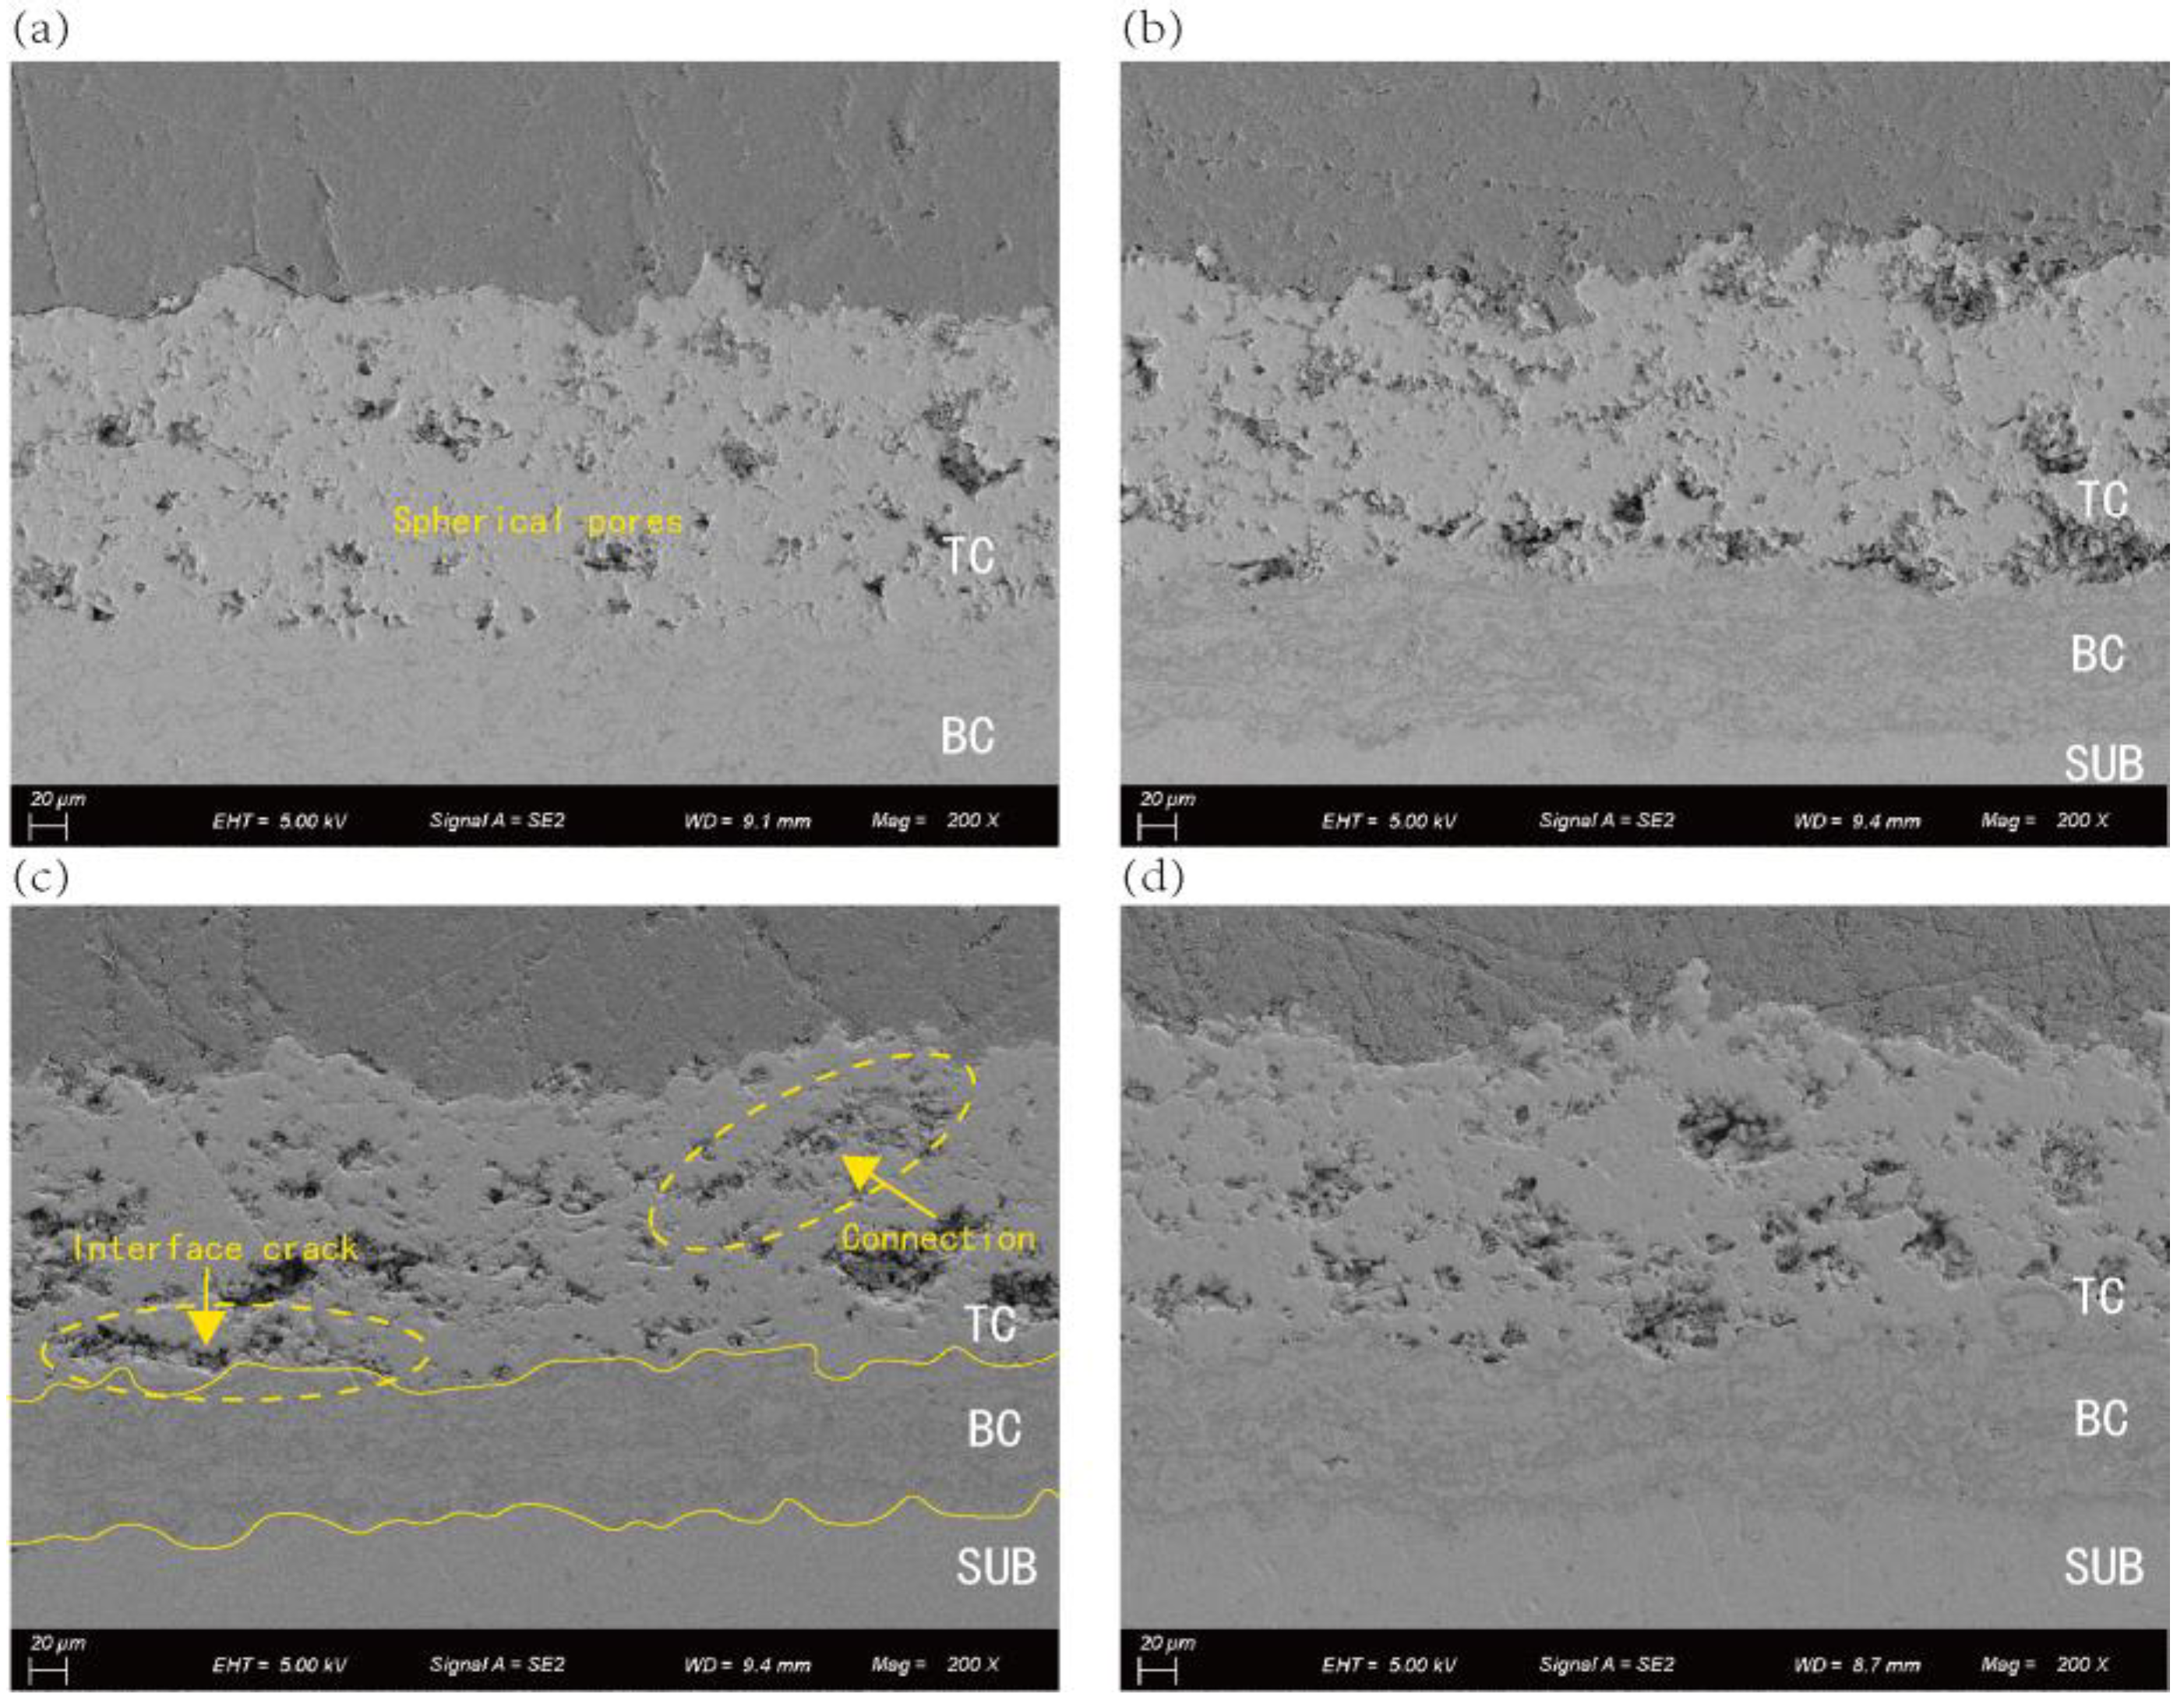
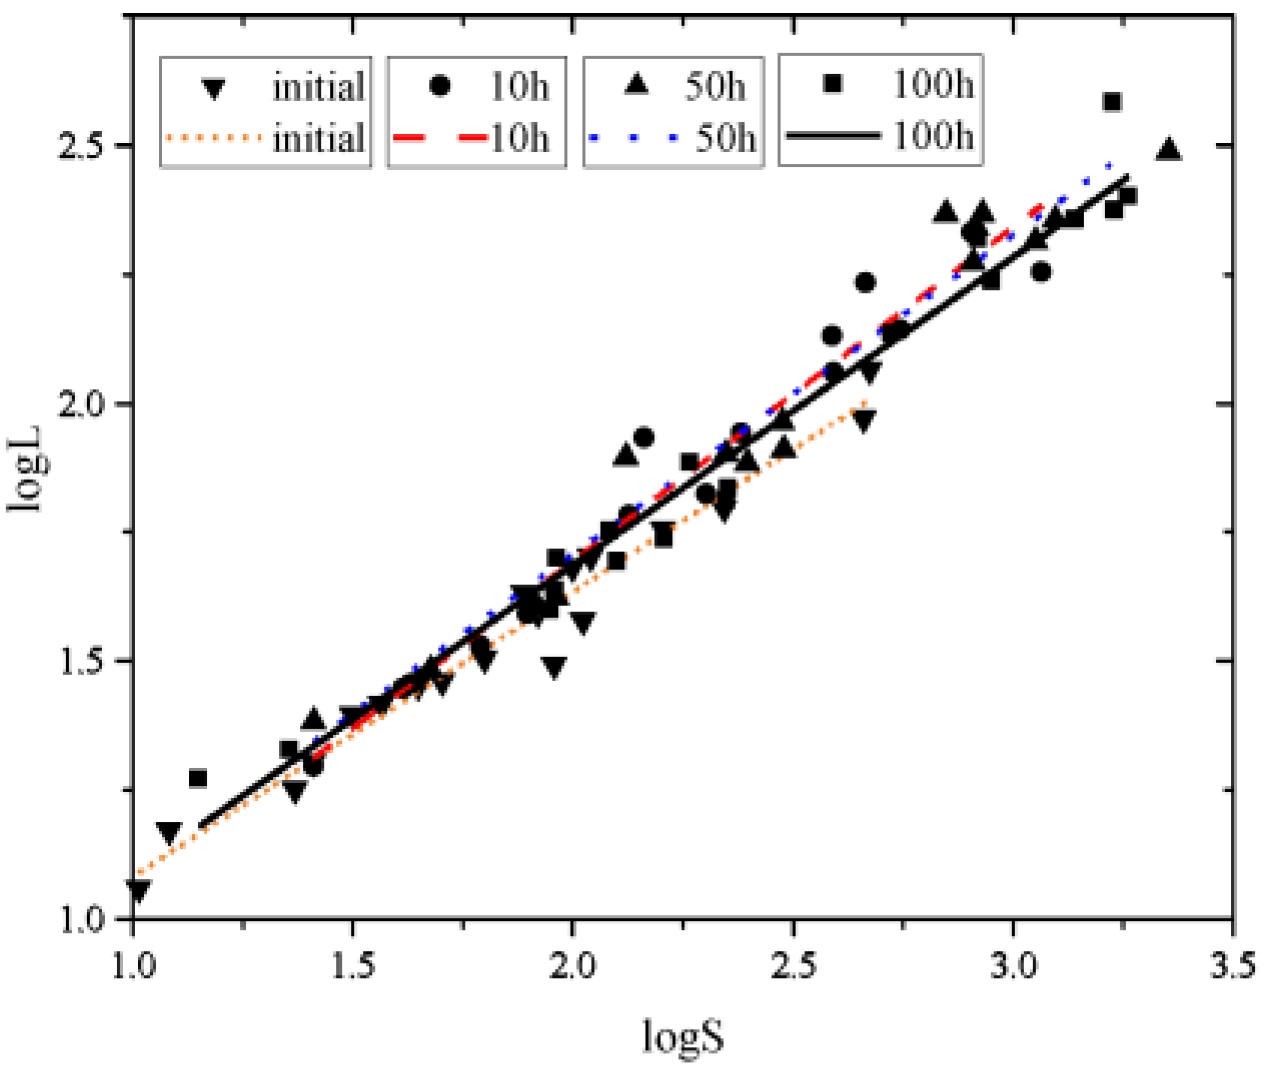
The concentrated hyperthermia of the hot spot imparts sintering characteristics to the internal YSZ, with the sintering degree being greater in the central region of the hot spot than in the non-hot-spot region. In conjunction with the insulation experiments, it is known that the fractal dimension of the pores D within the YSZ increases by 13% under the influence of sintering, which increases the stress concentration at the tip of the pores and makes the pores in the local sintering area affected by the hot spot a hazardous point.
(c)
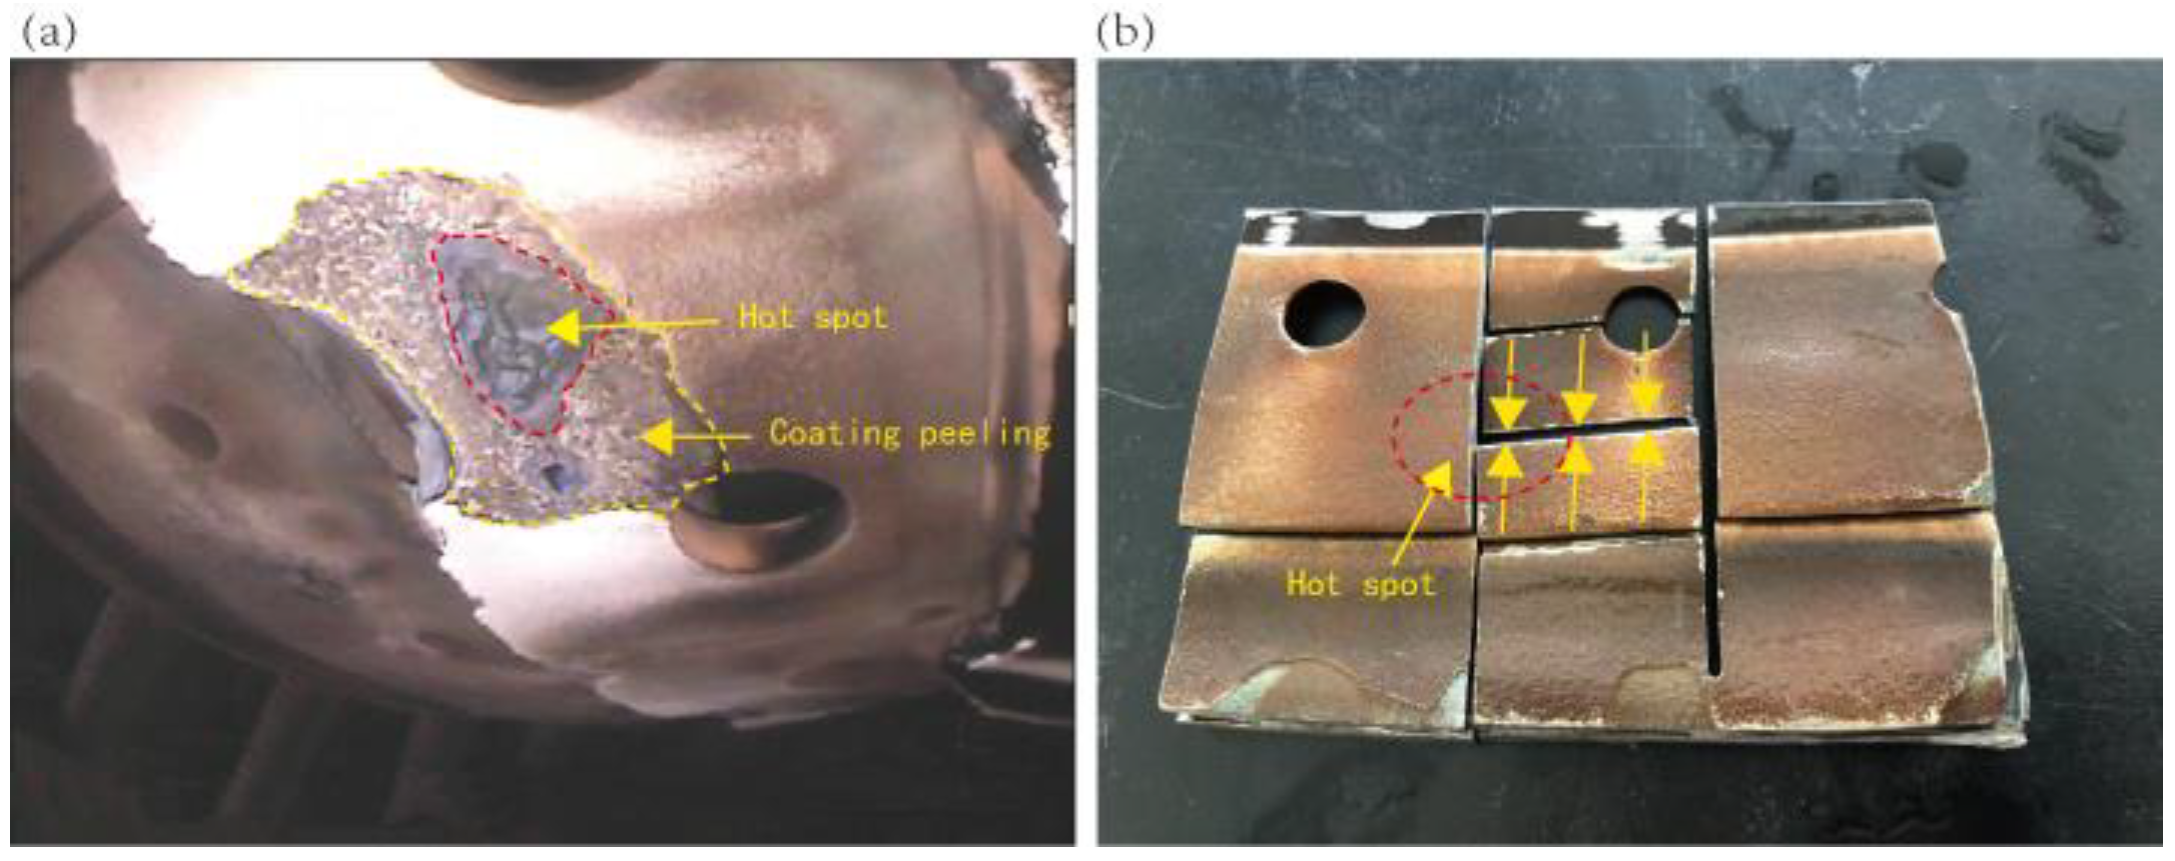
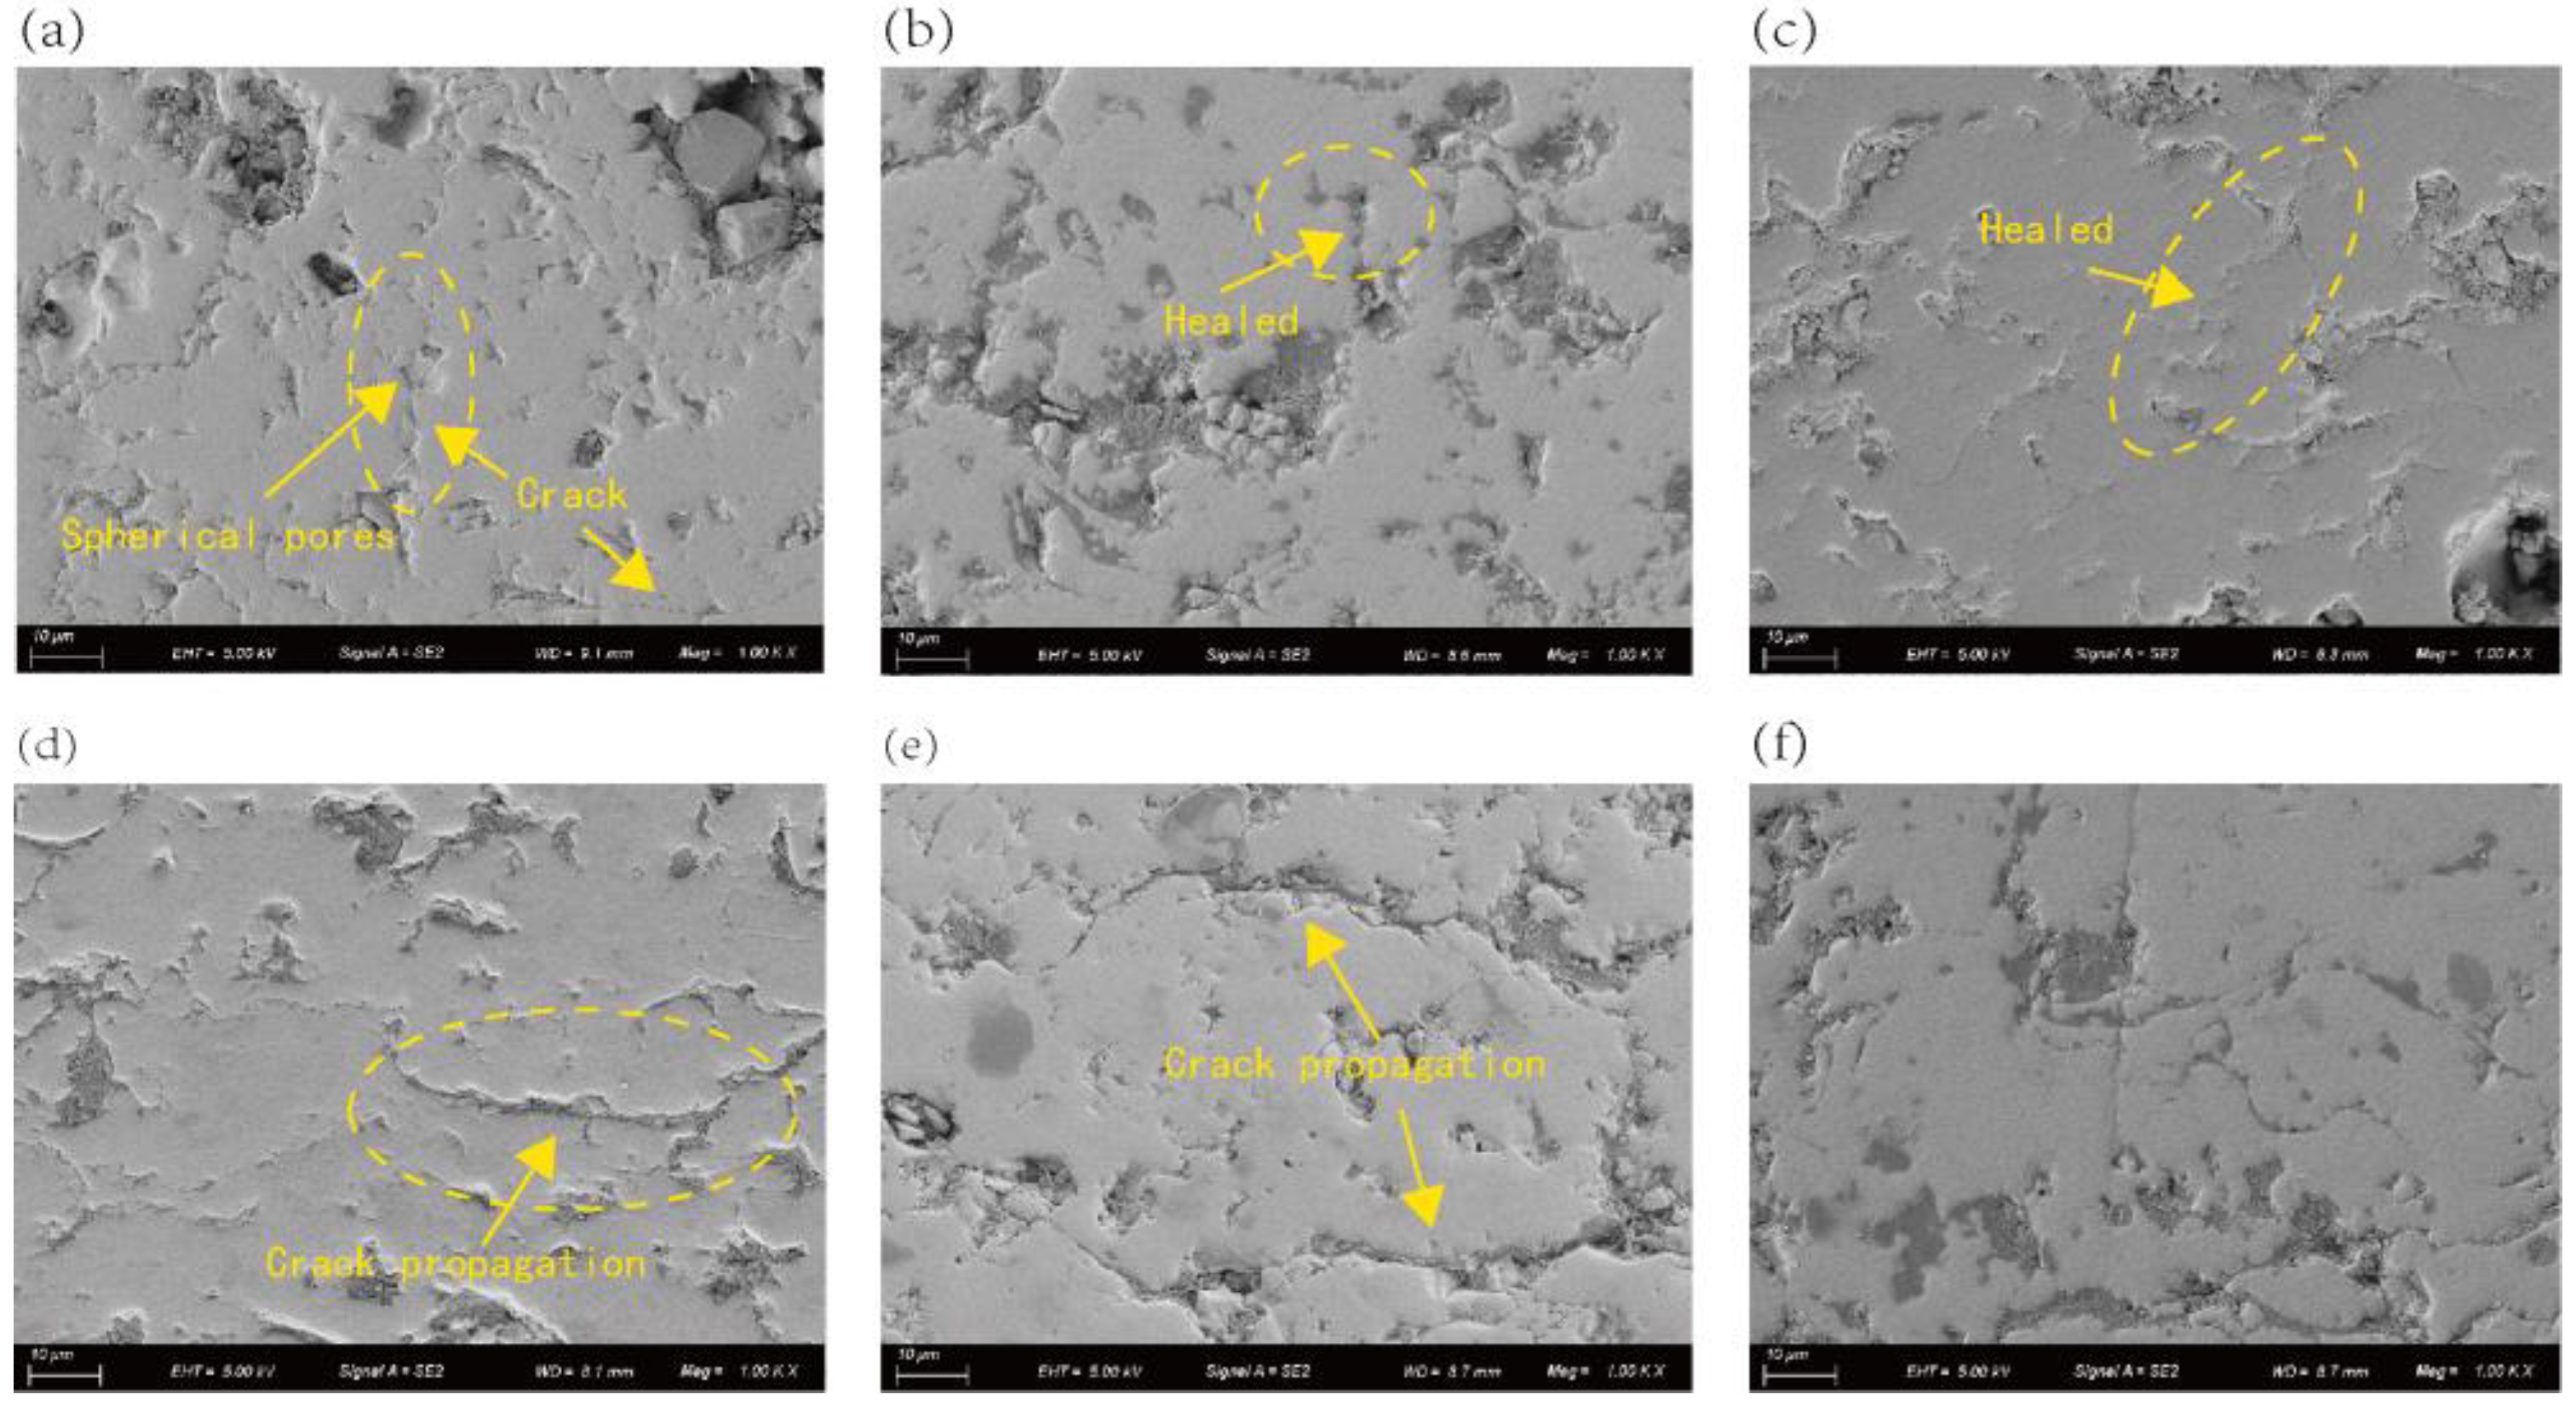
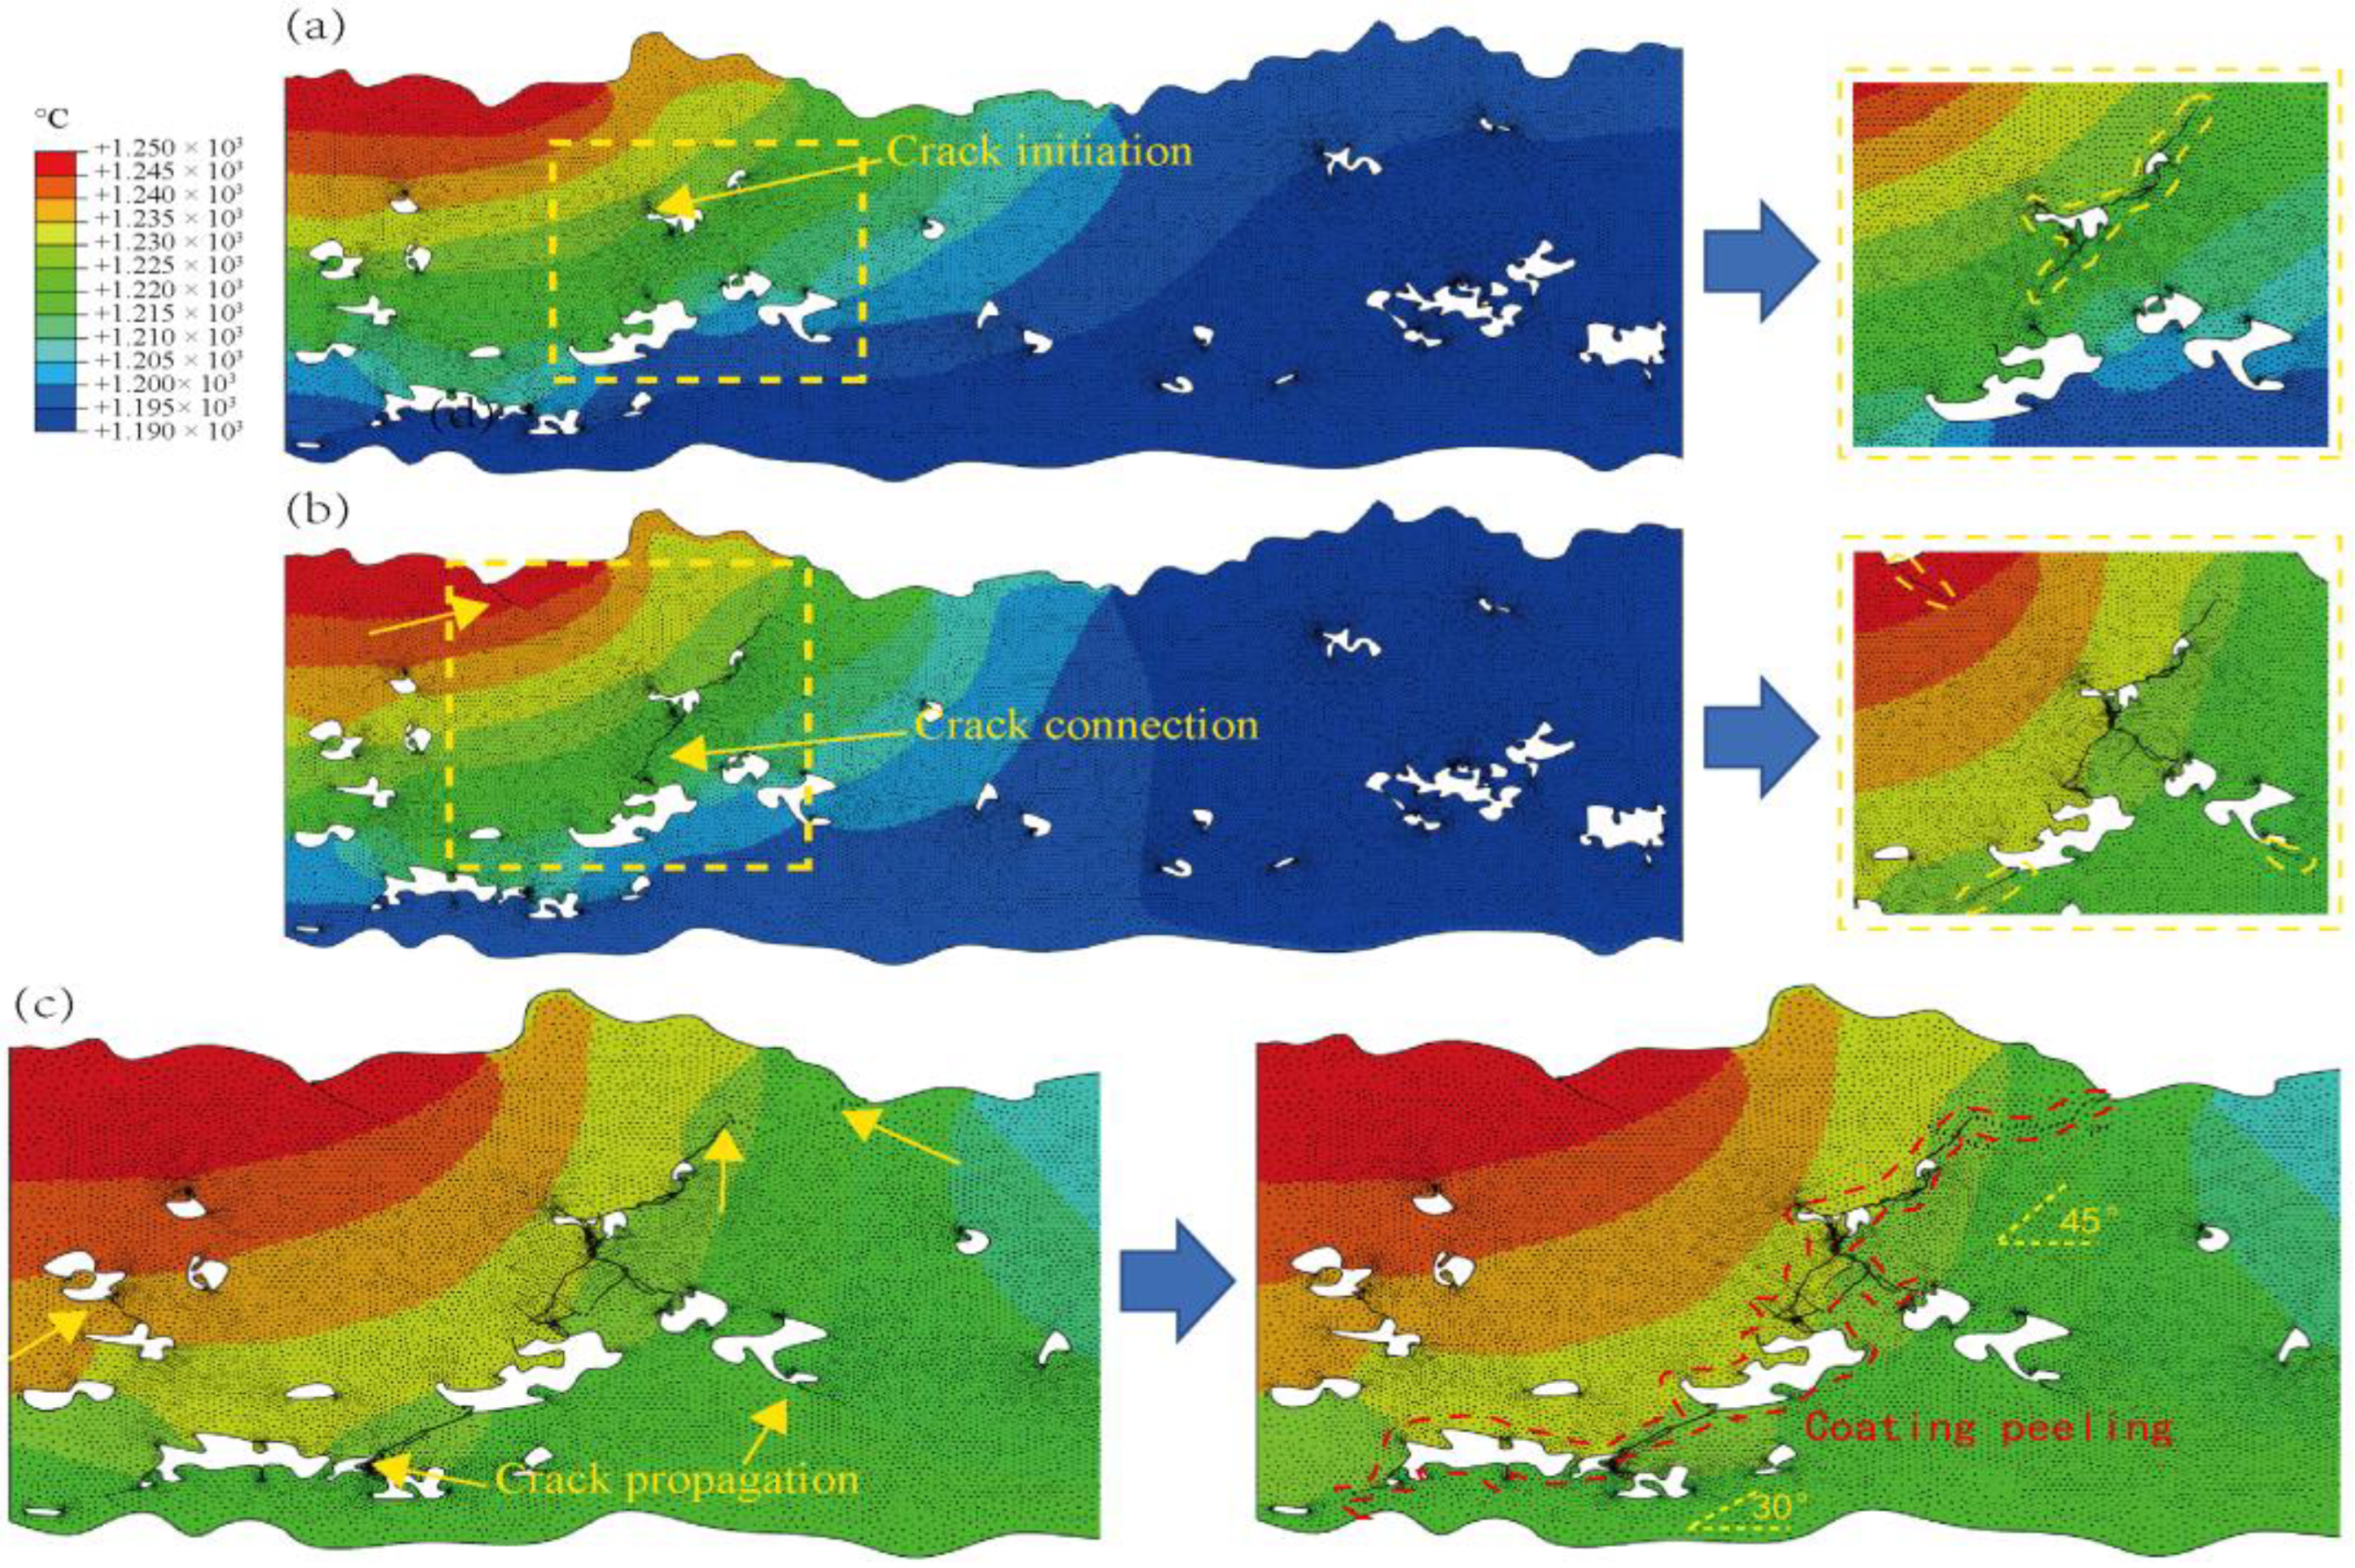
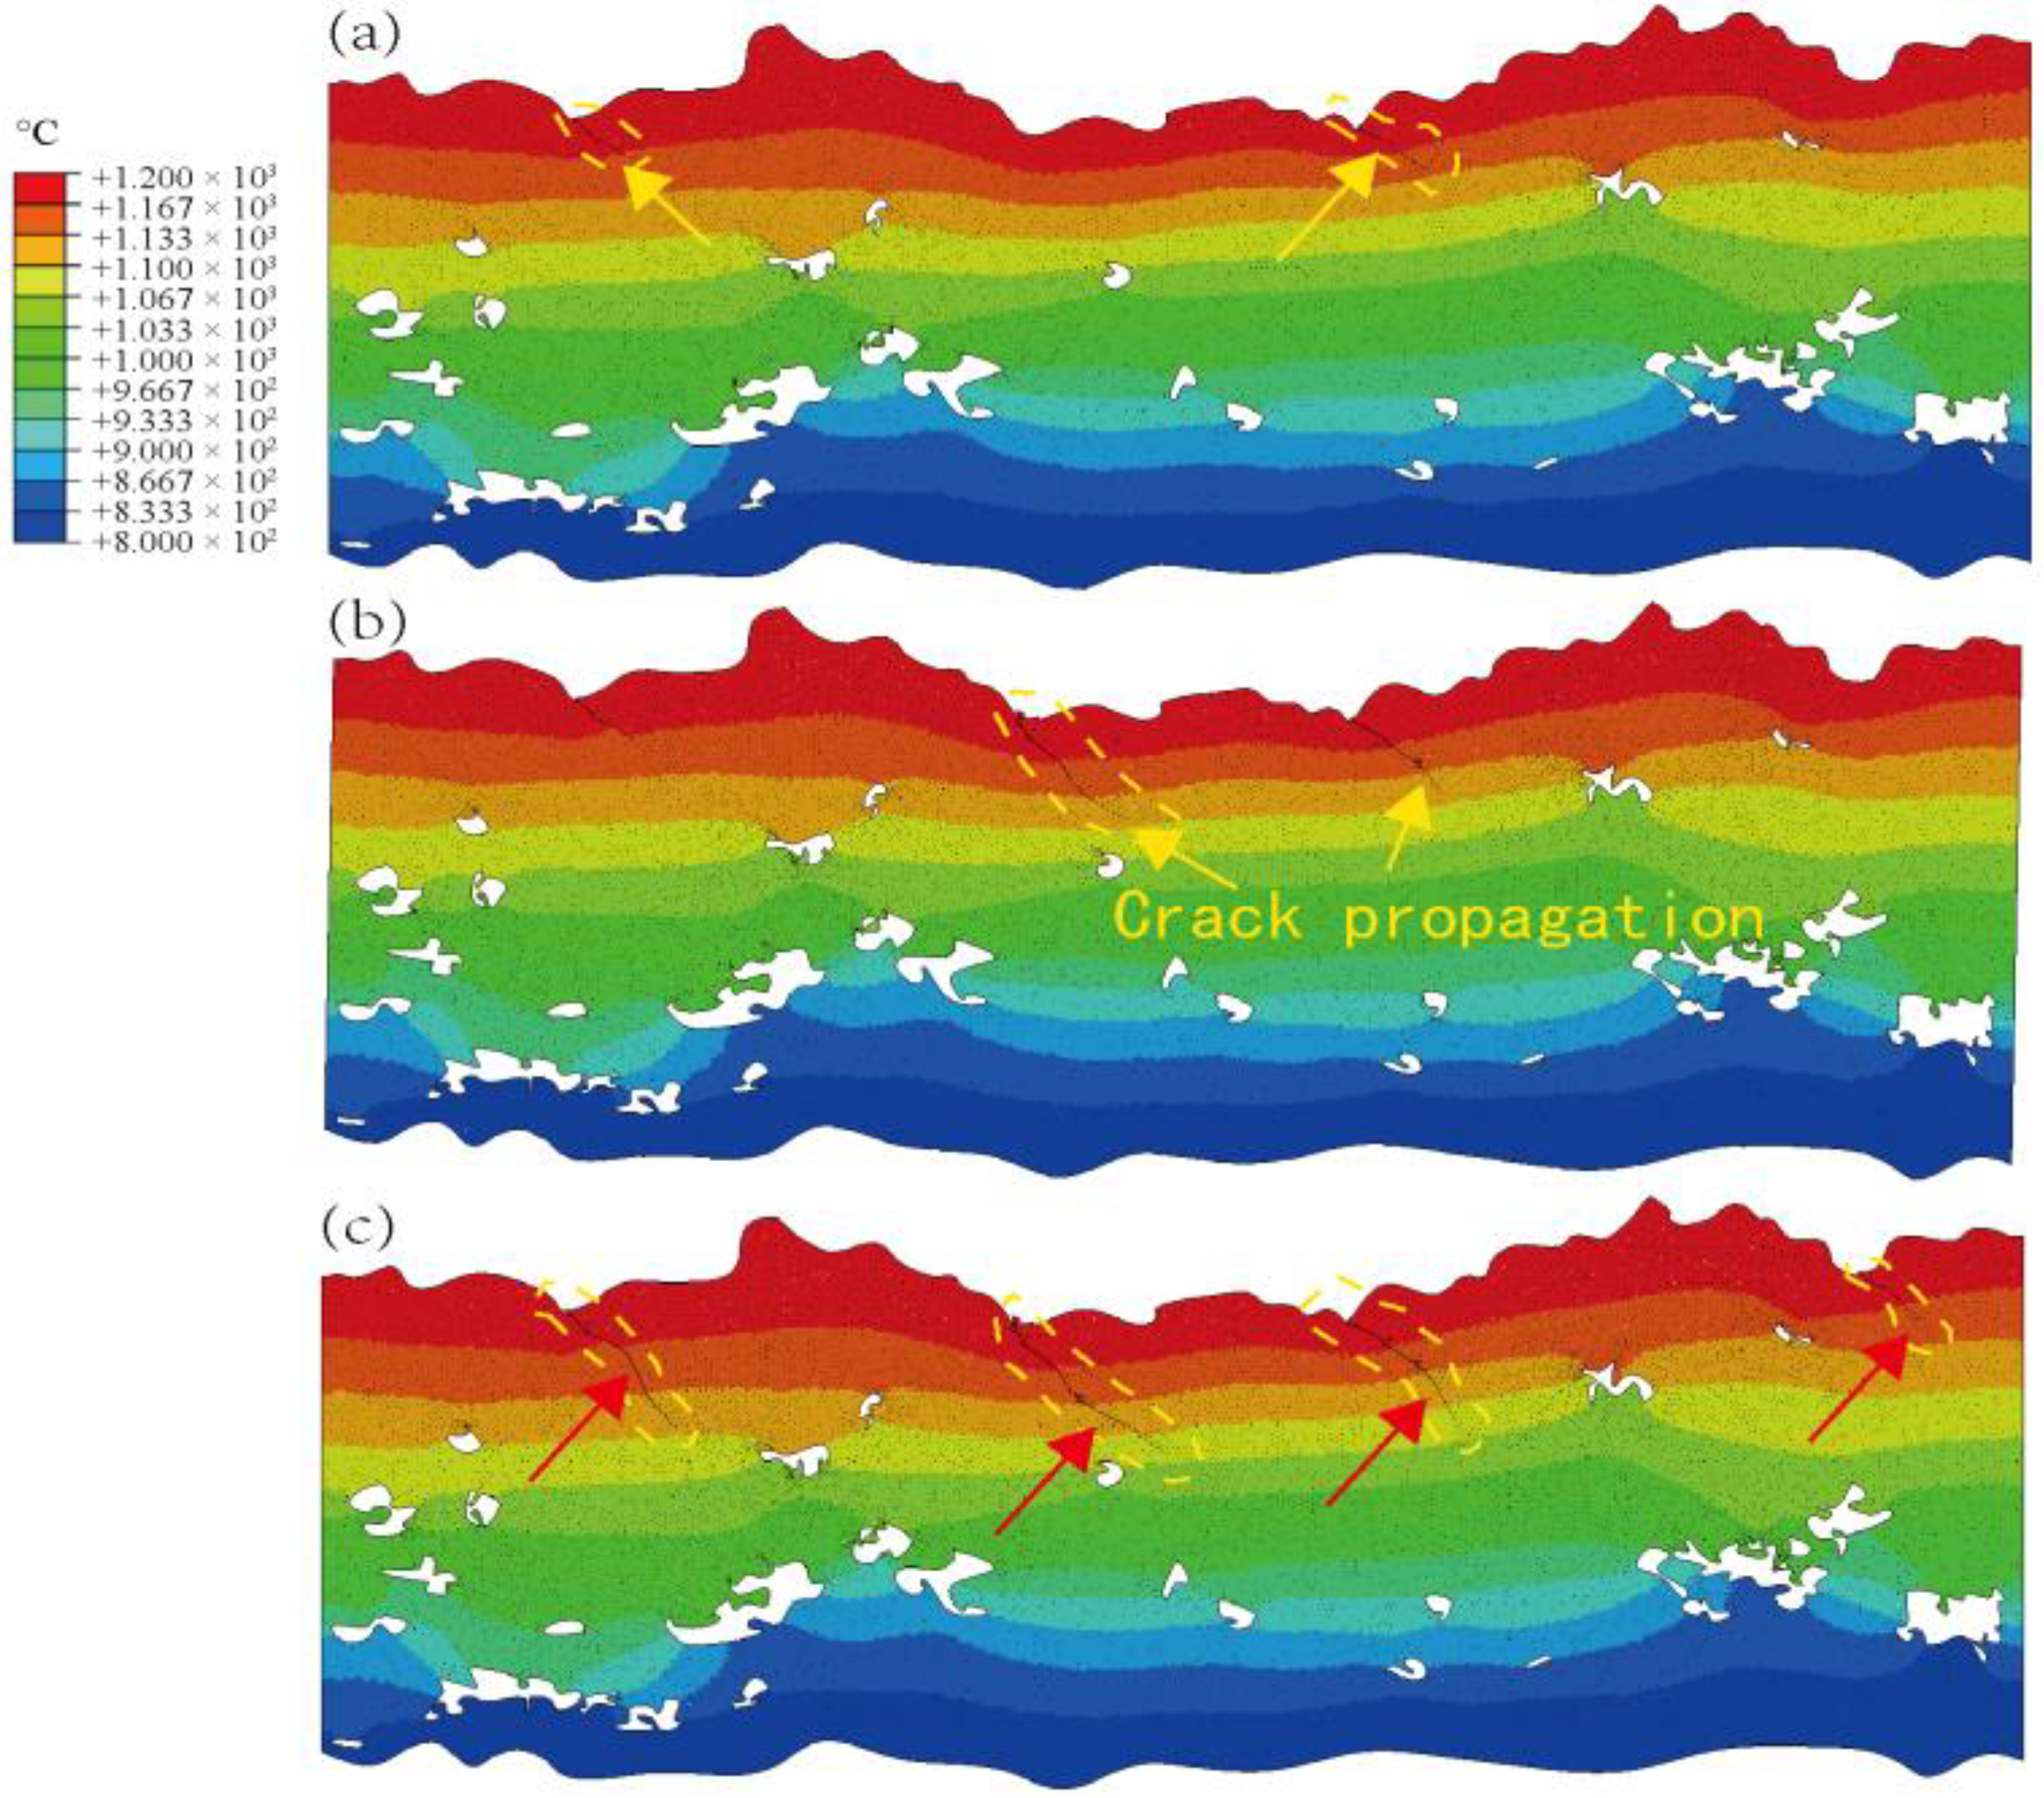
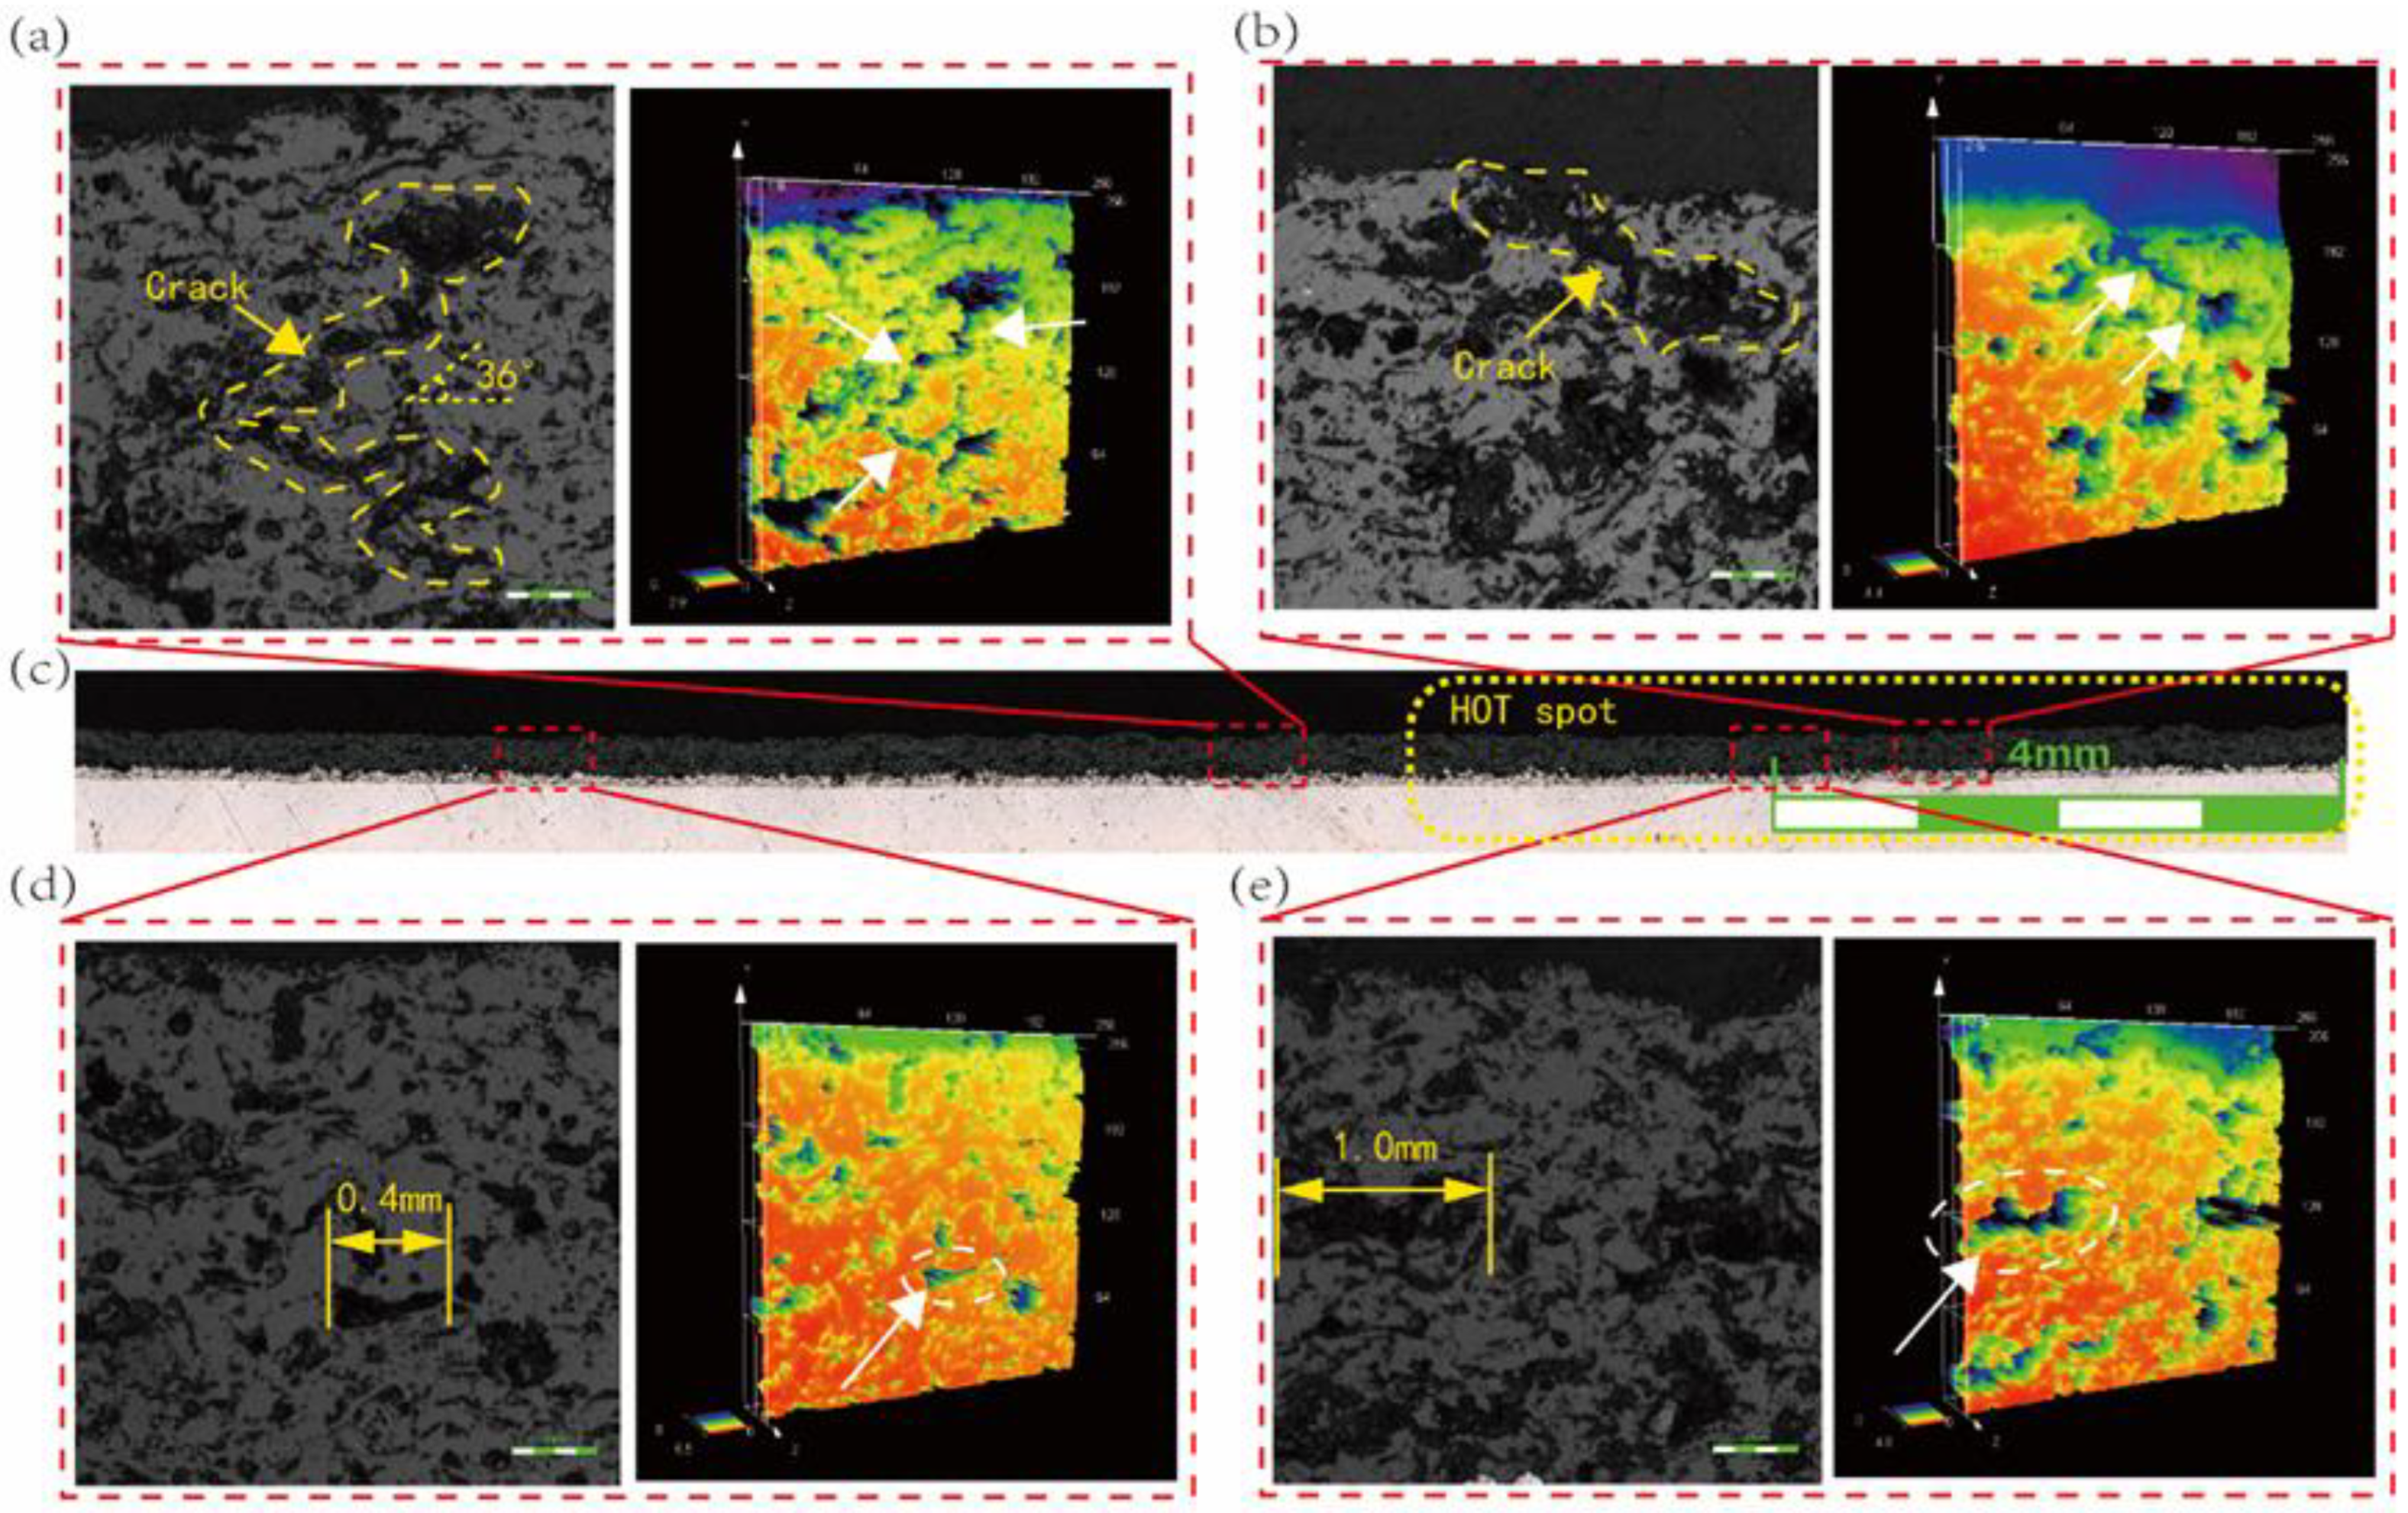
Unlike the layered peeling caused by multiple surface cracks due to uniform heating, the YSZ coating failure caused by hot spot heating will be most severe in the hot spot edge region due to bulk peeling. In addition to surface cracks, the cracks take the internal pores of YSZ as the sprouting point, penetrate the remaining pores along the direction of 30~45° angle with the interface, and expand in the thickness direction. Compared to a uniform temperature field, and when the temperature gradient reaches 30 K/mm, the cracks expand more than 40% along the thickness direction. Therefore, in the calculation of TBCs life, in addition to the temperature value parameters, the consideration of the horizontal temperature gradient should be added.

Author Contributions

Conceptualization, K.D.; methodology, W.G.; validation, C.S.; formal analysis, J.C.; investigation, G.H.; resources, J.W.; data curation, W.Z.; writing—original draft preparation, W.G.; writing—review and editing, K.D.; visualization, W.G.; supervision, K.D.; project administration, C.S.; funding acquisition, J.W. All authors have read and agreed to the published version of the manuscript.

Funding

This research received no external funding.

Institutional Review Board Statement

Not applicable.

Informed Consent Statement

Informed consent was obtained from all subjects involved in the study.

Data Availability Statement

Not applicable.

Conflicts of Interest

The authors declare no conflict of interest.

References

  1. Padture, N.P. Advanced structural ceramics in aerospace propulsion. Nat. Mater. 2016, 15, 804–809. [Google Scholar] [CrossRef]
  2. Clarke, D.R.; Oechsner, M.; Padture, N.P. Thermal-barrier coatings for more efficient gas-turbine engines. MRS Bull. 2012, 37, 891–898. [Google Scholar] [CrossRef] [Green Version]
  3. Schlichting, K.W.; Padture, N.P.; Jordan, E.H.; Gell, M. Failure modes in plasma-sprayed thermal barrier coatings. Mater. Sci. Eng. A 2003, 342, 120–130. [Google Scholar] [CrossRef]
  4. Lv, F.; Li, Q.; Fu, G. Failure analysis of an aero-engine combustor liner. Eng. Fail. Anal. 2010, 17, 1094–1101. [Google Scholar] [CrossRef]
  5. Mondal, K.; Nuñez III, L.; Downey, C.M.; van Rooyen, I.J. Recent advances in the thermal barrier coatings for extreme environments. Mater. Sci. Energy Technol. 2021, 4, 208–210. [Google Scholar] [CrossRef]
  6. Mishra, R.K. Life Enhancement of Gas Turbine Combustor Liner through Thermal Barrier Coating. J. Fail. Anal. Prev. 2017, 17, 914–918. [Google Scholar] [CrossRef]
  7. Jiang, J.; Jiang, L.; Cai, Z.; Wang, W.; Zhao, X.; Liu, Y.; Cao, Z. Numerical stress analysis of the TBC-film cooling system under operating conditions considering the effects of thermal gradient and TGO growth. Surf. Coat. Technol. 2019, 357, 433–444. [Google Scholar] [CrossRef]
  8. Zhang, J.; Dai, H.; Lin, J.; Yuan, Y.; Liu, Z.; Sun, Y.; Ding, K. Cracking analysis of an aero-engine combustor. Eng. Fail. Anal. 2020, 115, 104640. [Google Scholar] [CrossRef]
  9. Kim, K.M.; Shin, S.; Lee, D.H.; Cho, H.H. Influence of material properties on temperature and thermal stress of thermal barrier coating near a normal cooling hole. Int. J. Heat Mass Transf. 2011, 54, 5192–5199. [Google Scholar] [CrossRef]
  10. Xiao, B.; Huang, X.; Robertson, T.; Tang, Z.; Kearsey, R. Sintering resistance of suspension plasma sprayed 7YSZ TBC under isothermal and cyclic oxidation. J. Eur. Ceram. Soc. 2020, 40, 2030–2041. [Google Scholar] [CrossRef]
  11. Li, G.R.; Yang, G.J.; Li, C.X.; Li, C.J. Sintering characteristics of plasma-sprayed TBCs: Experimental analysis and an overall modelling. Ceram. Int. 2018, 44, 2982–2990. [Google Scholar] [CrossRef]
  12. Cheng, B.; Wang, Y.; Zhang, X.; An, G.; Chu, Q.; Zhang, X.; He, D.; Zhai, H.; Li, W. Sintering governing the cracking behaviors of different La2Zr2O7/YSZ ceramic layer combination TBCs at 1150 °C. Surf. Coat. Technol. 2021, 428, 127910. [Google Scholar] [CrossRef]
  13. Huang, J.; Wang, W.; Li, Y.; Fang, H.; Ye, D.; Zhang, X.; Tu, S. Improve durability of plasma-splayed thermal barrier coatings by decreasing sintering-induced stiffening in ceramic coatings. J. Eur. Ceram. Soc. 2020, 40, 1433–1442. [Google Scholar] [CrossRef]
  14. Kyaw, S.; Jones, A.; Hyde, T. Predicting failure within TBC system: Finite element simulation of stress within TBC system as affected by sintering of APS TBC, geometry of substrate and creep of TGO. Eng. Fail. Anal. 2013, 27, 150–164. [Google Scholar] [CrossRef]
  15. Wei, Z.Y.; Cai, H.N.; Zhao, S.D.; Li, G.R.; Zhang, W.W.; Tahir, A. Dynamic multi-crack evolution and coupling TBC failure together induced by continuous TGO growth and ceramic sintering. Ceram. Int. 2022, 48, 15913–15924. [Google Scholar] [CrossRef]
  16. Wei, Z.Y.; Dong, X.X.; Cai, H.N.; Zhao, S.D. Influences of the near-spherical 3D pore on failure mechanism of atmospheric plasma spraying TBCs using a macro-micro integrated model. Surf. Coat. Technol. 2022, 437, 128375. [Google Scholar] [CrossRef]
  17. Weng, W.X.; Zheng, Z.H.; Li, Q. Cracking evolution of atmospheric plasma-sprayed YSZ thermal barrier coatings subjected to isothermal heat treatment. Surf. Coat. Technol. 2020, 402, 125924. [Google Scholar] [CrossRef]
  18. Evans, A.G.; Hutchinson, J.W. The mechanics of coating delamination in thermal gradients. Surf. Coat. Technol. 2007, 201, 7905–7916. [Google Scholar] [CrossRef]
  19. Yang, J.; Wang, L.; Li, D.; Zhong, X.; Zhao, H.; Tao, S. Stress analysis and failure mechanisms of plasma-sprayed thermal barrier coatings. J. Therm. Spray Technol. 2017, 26, 890–901. [Google Scholar] [CrossRef]
  20. Erk, K.A.; Deschaseaux, C.; Trice, R.W. Grain-boundary grooving of plasma-sprayed yttria-stabilized zirconia thermal barrier coatings. J. Am. Ceram. Soc. 2006, 89, 1673–1678. [Google Scholar] [CrossRef]
  21. Cipitria, A.; Golosnoy, I.O.; Clyne, T.W. A sintering model for plasma-sprayed zirconia TBCs. Part I: Free-standing coatings. Acta Mater. 2009, 57, 980–992. [Google Scholar] [CrossRef]
  22. Cocks, A.C.F.; Fleck, N.A. Constrained sintering of an air-plasma-sprayed thermal barrier coating. Acta Mater. 2010, 58, 4233–4244. [Google Scholar] [CrossRef]
  23. Kadam, P.J.; Damale, A.; Kadam, N. Fracture analysis of Pre-cracked 8YSZ TBCs with edge and internal cracks under Thermo-mechanical load: A numerical approach. Mater. Today Proc. 2022, 59, 1839–1845. [Google Scholar] [CrossRef]
  24. Koushali, A.G.; Sameezadeh, M.; Vaseghi, M.; Safarpour, P. Modeling and simulation of thermal fatigue crack in EB-PVD TBCs under non-uniform temperature. Ceram. Int. 2017, 43, 13140–13145. [Google Scholar] [CrossRef]
  25. Wei, Z.Y.; Cai, H.N.; Li, C.J. Comprehensive dynamic failure mechanism of thermal barrier coatings based on a novel crack propagation and TGO growth coupling model. Ceram. Int. 2018, 44, 22556–22566. [Google Scholar] [CrossRef]
  26. Yan, K.; Xiang, Y.; Yu, H.; Li, Z.; Wu, Y.; Sun, J. Effect of irregular microcracks on the hot corrosion behavior and thermal shock resistance of YSZ thermal barrier coatings. Surf. Coat. Technol. 2022, 431, 128038. [Google Scholar] [CrossRef]
  27. Xie, L.; Dorfman, M.; Cipitria, A.; Paul, S.; Golosnoy, I.; Clyne, T. Properties and performance of high-purity thermal barrier coatings. J. Therm. Spray Technol. 2007, 16, 804–808. [Google Scholar] [CrossRef] [Green Version]
  28. Chi, W.; Sampath, S.; Wang, H. Microstructure–thermal conductivity relationships for plasma-sprayed yttria-stabilized zirconia coatings. J. Am. Ceram. Soc. 2008, 91, 2636–2645. [Google Scholar] [CrossRef]
  29. Wang, Y.; Ma, C.; Liu, Y.; Wang, D.; Liu, J. A model for the effective thermal conductivity of moist porous building materials based on fractal theory. Int. J. Heat Mass Transf. 2018, 125, 387–399. [Google Scholar] [CrossRef]
  30. Nayak, S.R.; Mishra, J.; Khandual, A.; Palai, G. Fractal dimension of RGB color images. Optik 2018, 162, 196–205. [Google Scholar] [CrossRef]
  31. WOliver, C.; Pharr, G.M. Measurement of hardness and elastic modulus by instrumented indentation: Advances in understanding and refinements to methodology. J. Mater. Res. 2004, 19, 3–20. [Google Scholar] [CrossRef]
  32. Bäker, M.; Seiler, P. A guide to finite element simulations of thermal barrier coatings. Therm. Spray Technol. 2017, 26, 1146–1160. [Google Scholar] [CrossRef] [Green Version]
  33. Dai, H.; Zhang, J.; Ren, Y.; Liu, N.; Wu, B.; Ding, K.; Lin, J. Failure mechanism of thermal barrier coatings of an ex-service aero-engine combustor. Surf. Coat. Technol. 2019, 380, 125030. [Google Scholar] [CrossRef]
  34. Ma, K.; Zhu, J.; Xie, H.; Wang, H. Effect of porous microstructure on the elastic modulus of plasma-sprayed thermal barrier coatings: Experiment and numerical analysis. Surf. Coat. Technol. 2013, 235, 589–595. [Google Scholar] [CrossRef]
  35. Wang, L.-S.; Song, J.-B.; Dong, H.; Yao, J.-T. Sintering-Induced Failure Mechanism of Thermal Barrier Coatings and Sintering-Resistant Design. Coatings 2022, 12, 1083. [Google Scholar] [CrossRef]
  36. Li, Z.; Yu, J.; Li, Q. Finite element simulation of ceramic layer/TGO interfacial crack on thermal barrier coating. Surf. Technol. 2017, 46, 70–76. [Google Scholar]
  37. Li, Z.Y.; Bao, R.; Zhang, J.Y. Effect of different heat transfer coefficients on the performance of thermal barrier coatings under thermo-mechanical couple process. J. Aerosp. Power 2008, 23, 5946–5951. [Google Scholar]
  38. Song, J.; Li, S.; Yang, X.; Shi, D.; Qi, H. Numerical study on the competitive cracking behavior in TC and interface for thermal barrier coatings under thermal cycle fatigue loading. Surf. Coat. Technol. 2019, 358, 850–857. [Google Scholar] [CrossRef]
Figure 1. Temperature cloud of combustion liner.
Coatings 13 01056 g001
Figure 2. Ablation of combustion liner: (a) borehole exploration photos; (b) ablative specimen.
Coatings 13 01056 g002
Figure 3. Establishment of FEM. (a) Cross-section of the TBCs; (b) grid of numerical geometric FEM.
Coatings 13 01056 g003
Figure 4. Variation pattern of coating elastic modulus with heat treatment time.
Coatings 13 01056 g004
Figure 5. FEM cell meshing.
Coatings 13 01056 g005
Figure 6. Thermal load over time.
Coatings 13 01056 g006
Figure 7. Cohesive element constitutive model.
Coatings 13 01056 g007
Figure 8. Micromorphology of YSZ sintering at 1100 °C: (a) 0 h; (b) 10 h; (c) 20 h; (d) 50 h; (e) 100 h; (f) 150 h.
Coatings 13 01056 g008
Figure 9. Sintering morphology of TBCs at 1100 °C: (a) 0 h; (b) 10 h; (c) 50 h; (d) 100 h.
Coatings 13 01056 g009
Figure 10. D calculated by power low method.
Coatings 13 01056 g010
Figure 11. Stress distribution under the action of hot spot: (a) S11; (b) S22; (c) S12.
Coatings 13 01056 g011
Figure 12. Stress variation over time: (a) point A; (b) point B.
Coatings 13 01056 g012
Figure 13. Stress distribution law during cooling: (a) interface; (b) surface.
Coatings 13 01056 g013
Figure 14. Crack propagation under hot spot load: (a) crack initiation; (b) crack propagation; (c) failure crack.
Coatings 13 01056 g014
Figure 15. Crack growth under uniform thermal load: (a) crack initiation; (b) crack propagation; (c) end of cycle.
Coatings 13 01056 g015
Figure 16. Cross-section morphology of ablated parts: (a) cracks at the edge of hot spot; (b) cracks at hot spot; (c) complete morphology of coating in ablated area; (d) morphology of coating in non-hot-spot area; (e) morphology of coating in hot spot area.
Coatings 13 01056 g016
Figure 17. Schematic diagram of hot spot crack propagation: (a) initial morphology; (b) sintering morphology; (c) crack initiation; (d) crack propagation.
Coatings 13 01056 g017
Figure 18. Relationship between temperature gradient of the hot spot and crack propagation depth.
Coatings 13 01056 g018
Table 1. Process parameters of atmospheric plasma spraying thermal barrier coating.
CoatU/VI/AL/mmArgon Flow
QAr/(L/min)
Helium Flow
QHe/(L/min)
Nitrogen Flow
QN/(L/min)
Top coat37.9845856011040
Bond coat3885072663030
Table 2. Material properties of each layer.
MaterialDensity (kg/m3)Thermal Conductivity (W/m K)Specific Heat (J/kg K)Thermal Expansion Coefficient (10–6/K)Poisson’s RatioYoung’s Modulus (GPa)
Top coat5.28 × 1031.764010.90.2220
Bond coat8.10 × 10310.278112.50.3117.5
Substrate8.15 × 10310.269614.00.3318.5
Disclaimer/Publisher’s Note: The statements, opinions and data contained in all publications are solely those of the individual author(s) and contributor(s) and not of MDPI and/or the editor(s). MDPI and/or the editor(s) disclaim responsibility for any injury to people or property resulting from any ideas, methods, instructions or products referred to in the content.

