Article

Preparation and Performance of a Self-Produced High-Molecular-Weight Waterborne Epoxy–Acrylic Emulsion

College of Resources, Environment and Materials, Guangxi University, Nanning 530000, China
*
Author to whom correspondence should be addressed.
Coatings 2023, 13(3), 595; https://doi.org/10.3390/coatings13030595
Submission received: 2 February 2023 / Revised: 26 February 2023 / Accepted: 7 March 2023 / Published: 10 March 2023
(This article belongs to the Topic Corrosion and Protection of Metallic Materials)

Abstract

:
To improve the stability of waterborne epoxy–acrylic emulsions and their comprehensive properties, such as the chemical resistance of coatings, a new research idea is proposed in this paper. First, a series of high-molecular-weight epoxy resins were synthesized with epoxy resin E-51 and bisphenol A (BPA) using benzyl triphenyl phosphine bromide as the catalyst. Then, free-radical graft copolymerization was carried out between the epoxy resin and methacrylic acid (MAA), styrene (ST), and butyl acrylate (BA) using benzoyl peroxide (BPO) as the initiator. This method ensured that the epoxy groups were retained. Finally, the carboxylic acid groups were neutralized with N,N-dimethylethanolamine (DMEA), and a stable aqueous epoxy–acrylic emulsion was obtained by high-speed dispersion in deionized water. The effects of key factors such as temperature, time, the molecular weight and dosage of epoxy resin, the dosage of MAA, the dosage of BPO, and the neutralization degree of the synthesis of emulsions and coating film properties were mainly discussed. The molecular weight and molecular weight distribution of the epoxy resin were determined by gel permeation chromatography (GPC). The epoxy resin and its graft copolymer were analyzed and characterized by Fourier-transform infrared (FTIR) spectroscopy, differential scanning calorimetry (DSC), and thermogravimetric analysis (TGA). The particle size and distribution of the emulsions were tested by laser particle size analysis. The morphology of the emulsion particles was observed by transmission electron microscopy. The results showed that the acrylic monomers (MAA, ST, and BA) were grafted onto the epoxy resin. The graft copolymers showed higher glass transition temperatures compared with those of the pure epoxy resin. TGA showed that the graft copolymer started to decompose at a high temperature before the pure epoxy resin did, and the thermal stability was slightly reduced. The prepared emulsions with a particle size of 160 nm had a storage stability of more than one year and showed excellent dilution stability, mechanical stability, and freeze–thaw stability. The emulsions were coated and cured at 150 °C for 1 h with a pencil hardness of 5 H, an adhesion of grade 1, and a flexibility of 1 mm. The water resistance was >60 days, the salt water resistance was >30 days, the acid resistance was >10 days, and the alkali resistance was >5 days.

1. Introduction

Solvent-based coatings still occupy a large market share, but they need to be dissolved in organic solvents to be painted on the surface of substrates. Volatile organic compounds (VOCs) are released into the air during paint drying and pollute the environment and pose health risks [1]. To prevent environmental pollution, countries around the world have introduced environmental regulations to limit the emissions of VOCs from paints, taking into account their development status [2,3,4]. Therefore, environmentally friendly coatings have become a major development direction [5]. Among them, water-based coatings replace organic solvents with water, an economical and non-polluting resource, which meets the environmental requirements, saves resources, and reduces the costs. Although water has become a widely studied coating material, some water-based coatings show worse performances than those of the solvent-based coatings. By complementing the advantages of the resins, the comprehensive performance of the coatings can be improved [5,6].
Epoxy resins and acrylic resins are the two most commonly used types of resins. Epoxy resins have excellent adhesion, corrosion resistance, and chemical resistance properties and are one of the most important resins used for anti-corrosion coatings for metals, FRPs, and composites [7,8,9,10]. Epoxy resins alone have a hard and brittle texture, poor impact resistance, and poor weatherability [11,12,13,14]. In contrast, acrylic resins have a light color, high transparency, good gloss, and good weather resistance [15,16,17,18], but they are brittle at low temperatures and sticky at high temperatures. They also have problems such as high film-forming temperatures, insufficient water resistance, and peeling when they are exposed to moisture. They also show low film hardness [19,20], poor staining resistance, poor solvent resistance [21], and have high costs [22]. Therefore, the covalent combination of the two resins [23] can give full play to the advantages of both [24,25,26], so that epoxy–acrylic resins can be widely used in various machinery, automobiles, anti-corrosion primers for steel structures, interior coatings for food cans, oil storage tanks, and ship holds, as well as architectural coatings [27,28]. In recent decades, epoxy–acrylic composites were usually prepared by two methods. One is simple physical blending, and the other one is chemical modification by esterification or grafting reactions [23,29]. Although the physical blending method is simple and less expensive, the emulsions have larger particle sizes, are prone to coalescence, have poor storage stability, and delaminate soon after coating. By using the graft polymerization of epoxy resins and acrylic monomers, the epoxy groups do not participate in the reaction, which maximally retains the characteristics of epoxy resins. This approach combines the advantages of epoxy resins and acrylic resins. J. Woo [23,30] and others first suggested that the α-H atoms on the neighboring carbon and the H atoms on the tertiary carbon atoms of epoxy resins were relatively reactive and could form radicals under the action of an initiator. This can be exploited to trigger graft copolymerization reactions. At the same time, a hydrophilic monomer carboxylic acid (-COOH) can be introduced during the preparation of an epoxy–acrylic acid graft copolymer. After neutralization, a self-emulsifying water emulsion can be obtained by adding water for dispersion. In recent years, many scholars have obtained emulsions with small particle sizes and high stability using acrylic monomer-grafted epoxy resins without consuming epoxy resin and hydroxyl groups. The emulsion not only has a high modulus and high strength values and excellent chemical and corrosion resistance of epoxy resin, but it also has the characteristics of acrylic resin gloss, fullness, good weather resistance, etc. Zafar et al. [31] prepared obtained waterborne epoxy acrylic aqueous dispersion with homemade melamine urea-formaldehyde resin as curing agent, and the resulting coating film has good hardness, impact resistance, and thermal stability, etc. However, the chemical resistance performance was not very good, and it resisted water, acid, and alkali for no more than 12 h. K. Zhang et al. [32] synthesized epoxy–acrylic acid graft composite resin on the basis of which a new process was introduced silicone, that is, after the reaction, the temperature was lowered to 50 °C, and the silicone with amino group and the epoxy group in the composite resin were used to react. Finally, in this water dispersion system, this modified composite resin played the role of a solubilizer between benzene propylene resin and epoxy resin with a particle size of 200–500 nm, and the resulting coating resisted water and a chemical for no more than 48 h. Kawaham et al. [27] prepared two different fine emulsion polymerization processes to obtain epoxy and acrylate composite emulsions, respectively. The results showed that the fine emulsions obtained were stable, and the polymerization process was stable when the size of the monomer bead drops was less than 500 nm. Guo, W. et al. [33] prepared aqueous fluorinated epoxy emulsions using hexafluorobutyl methacrylate, styrene, and acrylate monomers copolymerized with epoxy resin. The particle size of the emulsions was measured to be around 165 nm, and the emulsions had good storage stability and mechanical stability. The waterborne fluorine-containing epoxy coating obtained after curing the emulsion-prepared coating film was tested to show that it had good corrosion resistance by immersion in 0.5% CaCl2 solution for 48 h without significant changes.
Most previous researchers use low-molecular-weight epoxy resins E-51 and E-44 or medium molecular weight E-20 as the grafting body. Graft polymerization with acrylic monomers, followed by amine neutralization and high-speed dispersion with water, is used to prepare emulsions. The disadvantage of these emulsions was that the storage stability is poor, generally around 1–3 months. The reason for this is that if the epoxy resin has a low molecular weight, there are a few -CH and -CH2 grafting sites next to the main chain ether bond, resulting in a low grafting ratio, poor compatibility of the reacted resin, and poor storage stability. Using a low-molecular-weight epoxy resin results in more epoxy groups in the system, so the reaction between epoxy, carboxylic acid, and other reactive groups will occur slowly during storage [34]. These reactions will also reduce the storage stability.
In this study, self-emulsifying emulsions were obtained by the self-production of high-molecular-weight epoxy resins with different molecular weights through a chain extension reaction, followed by free-radical graft polymerization with acrylic monomers. Finally, neutralization was performed by DMEA, and the polymer was dispersed at high speed with water. The optimal reaction conditions for the preparation of the emulsions were investigated. The novelty lies in the self-production of a high-molecular-weight epoxy resin by chain extension. The preparation of the emulsion with a high-molecular-weight epoxy resin had a storage stability of more than one year, and the coating film prepared using this emulsion exhibited excellent mechanical and chemical resistance. The research method in this paper provides a new idea for the synthesis and application of high-molecular-weight epoxy resins and paves the way for the development of other waterborne-epoxy acrylic coatings.

2. Materials and Methods

2.1. Materials

We used Bisphenol A epoxy resin E-51, industrial grade, Baling Petrochemical, China (Yueyang); Bisphenol A (BPA), industrial grade, China Tianjin Zhonghe Shengtai Chemical Co., Ltd.; Benzyl triphenyl phosphine bromide, Analysys Pure, Shanghai Maclin Biochemical Technology Co., Ltd., China; Ethylene glycol monobutyl ether, which was analytically pure, Guangdong Wengjiang Chemical Reagent Co., Ltd. (Shaoguan, China); N-butanol, industrial grade, China Guangzhou Zhongye Chemical Co., Ltd.; Methacrylic acid (MAA), industrial grade, China Guangzhou Zhongye Chemical Co., Ltd. Styrene, industrial grade, China Shandong Chenyu Chemical Co., Ltd. (Jinan); Butyl acrylate, industrial grade, China Guangzhou Zhongye Chemical Co., Ltd. Benzoyl peroxide (BPO), which was chemically pure, Wuxi Prospect Chemical Reagent Co., Ltd. (China); N,N-dimethylethanolamine (DMEA), industrial grade, China Guangzhou Qingchen Biotechnology Co., Ltd.
Commercially available butyl acrylate and styrene often contain traces of the polymerization inhibitor hydroquinone, which can be removed by neutralization reaction with an alkali agent. Butyl acrylate and styrene were subjected to alkali washing to remove the polymerization inhibitor. For alkali washing process, we took an appropriate amount of monomer in the parting funnel, added 5% NaOH solution, and washed it 2–3 times. Then, we washed it with water until the monomer solution pH was neutral. After the alkali washing, we added anhydrous CaCl2 to the monomer and dried it overnight, and then put it aside. Methacrylic acid was easily neutralized with alkali to form a salt. Thus, methacrylic acid could not be removed from hydroquinone by alkali washing and was removed by reduced-pressure distillation.
Benzoyl peroxide partially decomposes due to long-term preservation, so it needs to be refined before use. This was accomplished by recrystallization: we dissolved 5 g benzoyl peroxide in 20 mL chloroform, then poured it into 50 mL ice methanol. The solution was allowed to stand until white needle-like precipitates formed. A bush funnel was used for filtration, and the filtered benzoyl peroxide was placed in a vacuum oven, dried for 24 h, and then taken out and stored at a low temperature. The filtered benzoyl peroxide was placed in a vacuum drying oven, dried for 24 h, then removed and stored at a low temperature.

2.2. Preparation of Waterborne Epoxy–Acrylic Emulsion

Chain extension reaction: The epoxy resin E-51 and bisphenol A were weighed according to the amounts designated in Table 1. First, we added epoxy resin E-51 to the three-mouth flask and began stirring, while raising the temperature. We added Bisphenol A when the temperature reached about 70 °C. After Bisphenol A was completely dissolved, we added the catalyst. When the temperature reached 130 °C, we heated it slowly or stopped heating it. The reaction released a large amount of heat under the action of the catalyst, and this gradually rose to about 180 °C. This temperature should be maintained until the end of the reaction. When the epoxy equivalent reaches the designated value, the heating should be stopped, and the material should be discharged. The schematic diagram of the synthesis is shown in Figure 1.
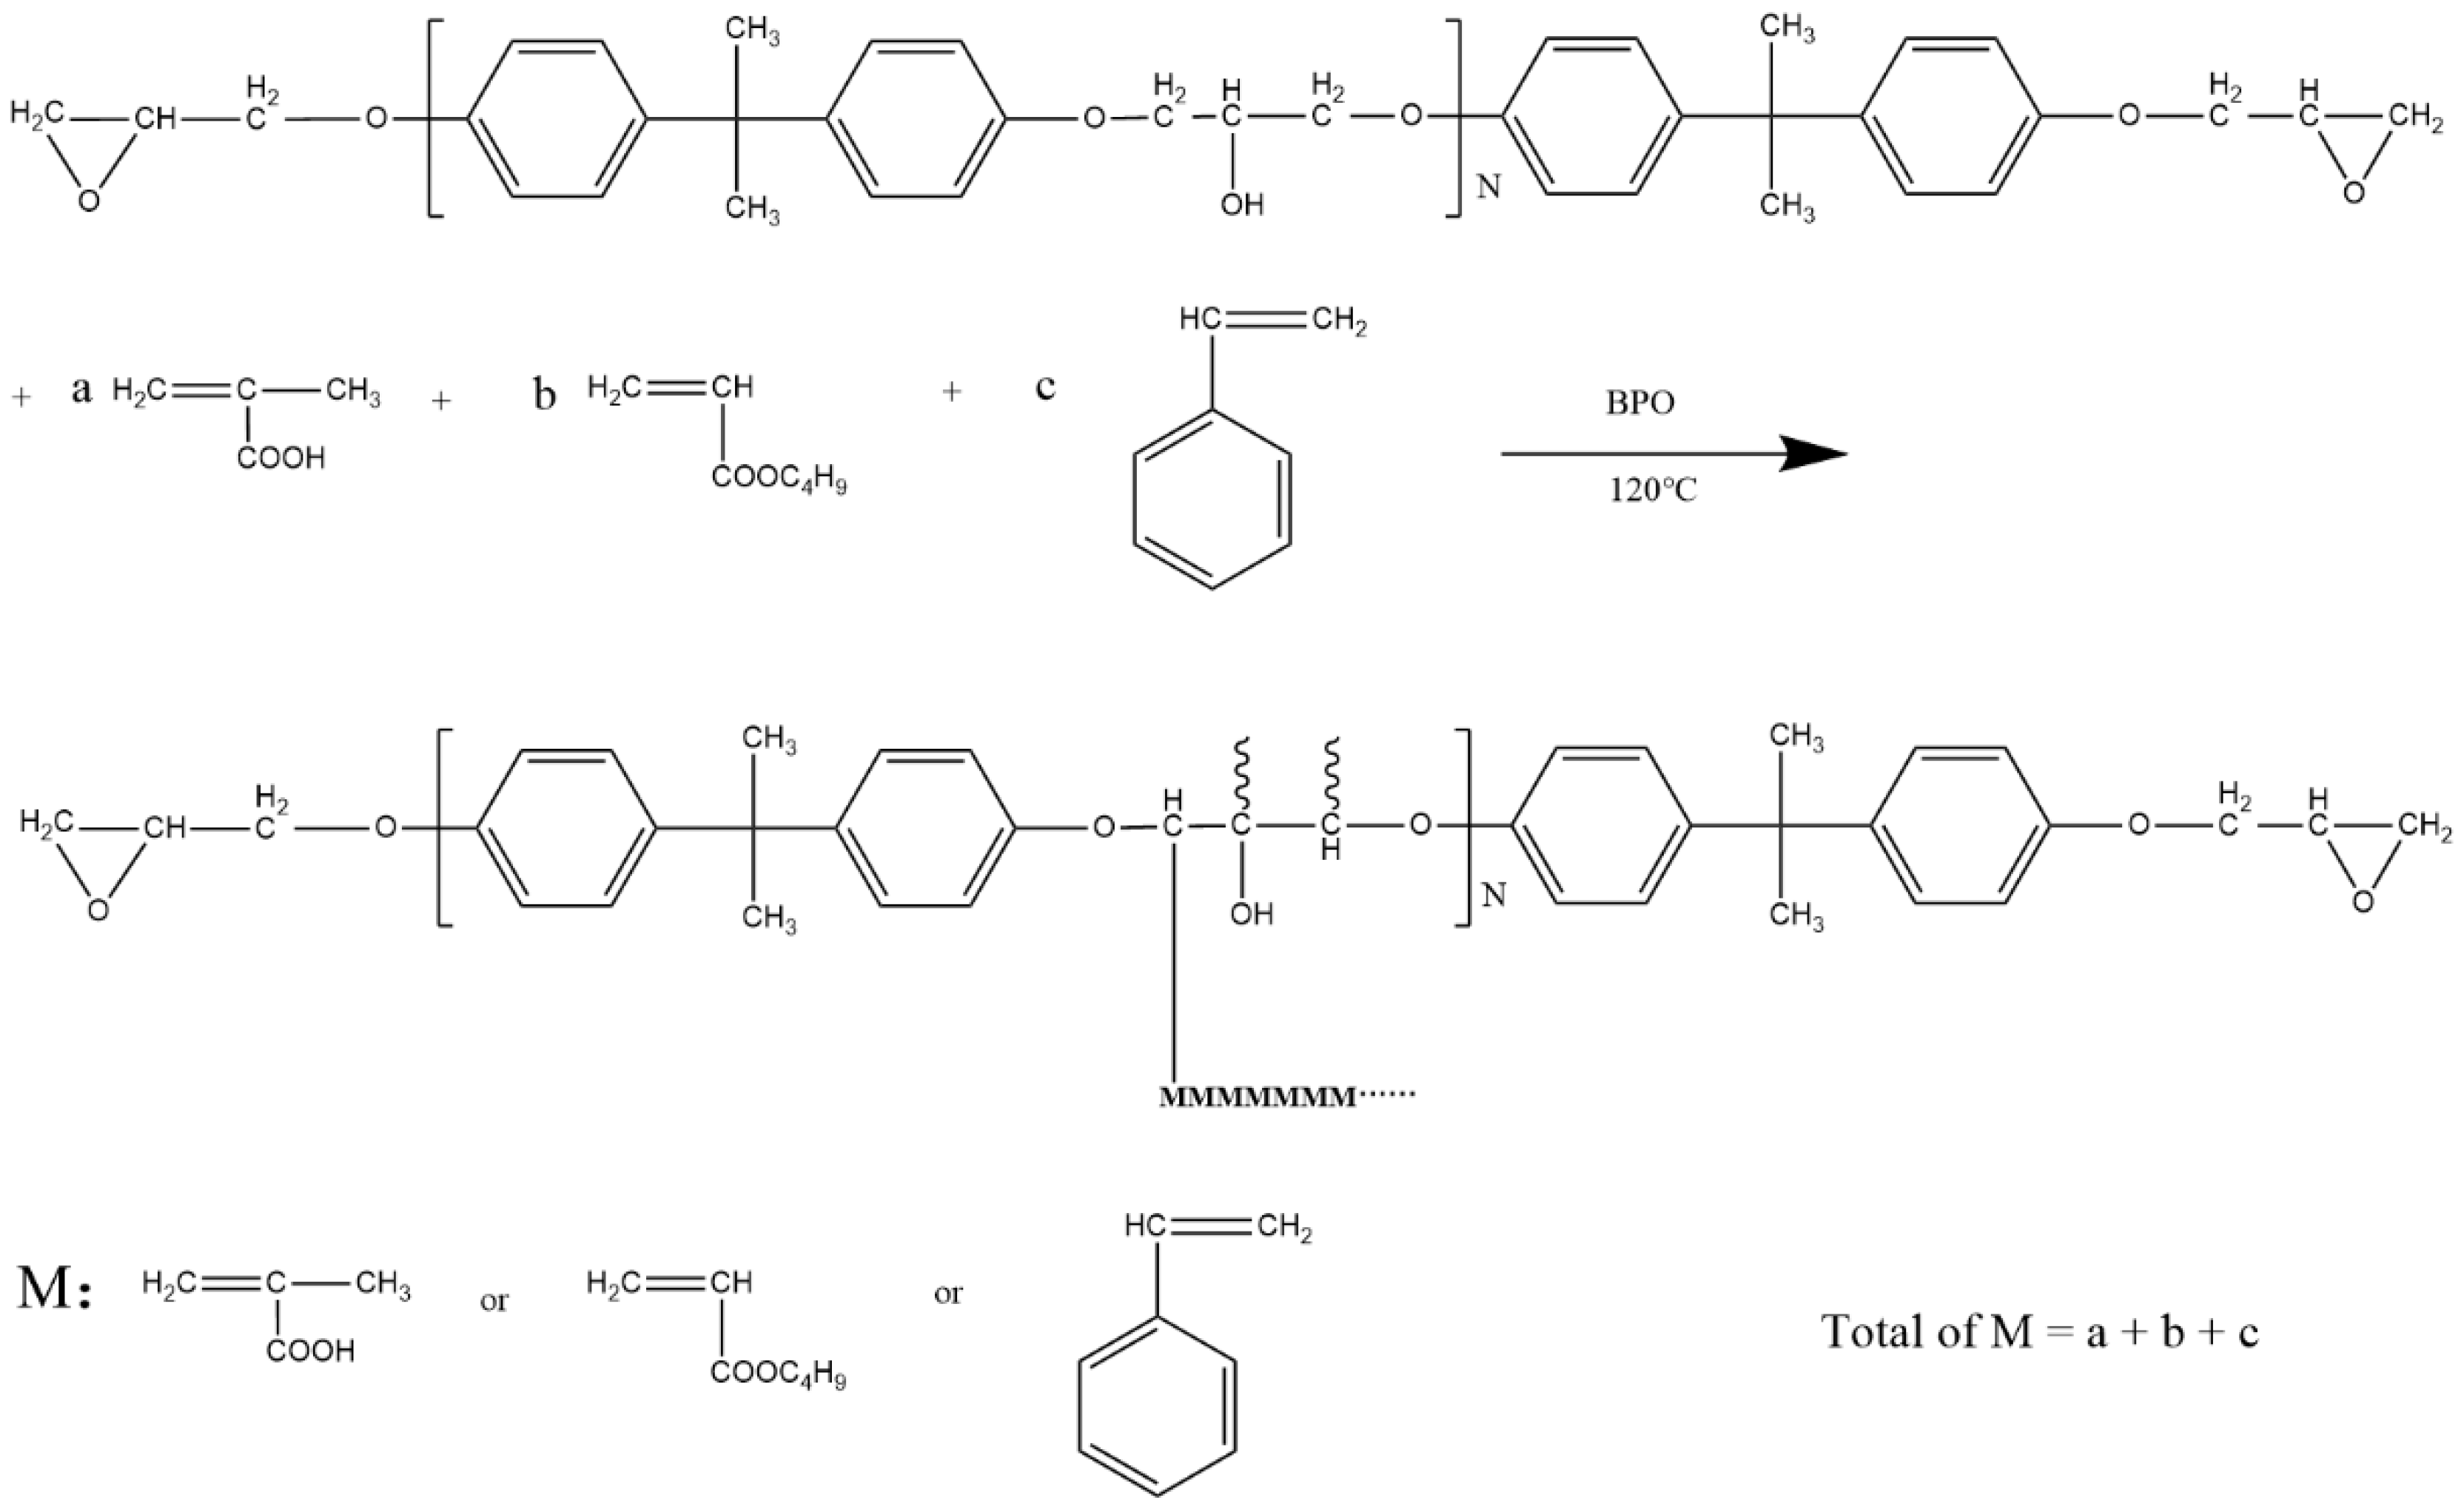
Grafting reaction: 48 g of the expanded epoxy resin, 10 g of ethylene glycol monobutyl ether, and 15 g of n-butanol mixed solvent were added to a four-necked flask and heated until the epoxy resin was dissolved. The temperature was adjusted to about 120 °C. Then, 8 g of methacrylic acid (MAA), 6 g of styrene (ST), 6 g of butyl acrylate (BA), 3.8 g of n-butanol, and 1.6 g of benzoyl peroxide (BPO) were added to the mixed solution in a beaker. BPO was completely dissolved by magnetic stirring. When the temperature in the flask was about 120 °C, the above-mixed solution was added dropwise via a peristaltic pump over 2 h, and the reaction was continued for 3 h afterward. The schematic diagram of the grafting reaction is shown in Figure 2.
Neutralization reaction: The product was cooled to 50 °C after the grafting reaction, then 6.4 g of N,N-dimethylethanolamine, and 3.7 g of a mixed solution of ethylene glycol monobutyl ether were added to neutralize the product into salts. The reaction mixture was kept warm for half an hour. Finally, 140 g of water was added and stirred at a high speed for preliminary dispersion, then transferred to the disperser for one hour of high-speed dispersion to obtain an aqueous epoxy–acrylic emulsion.
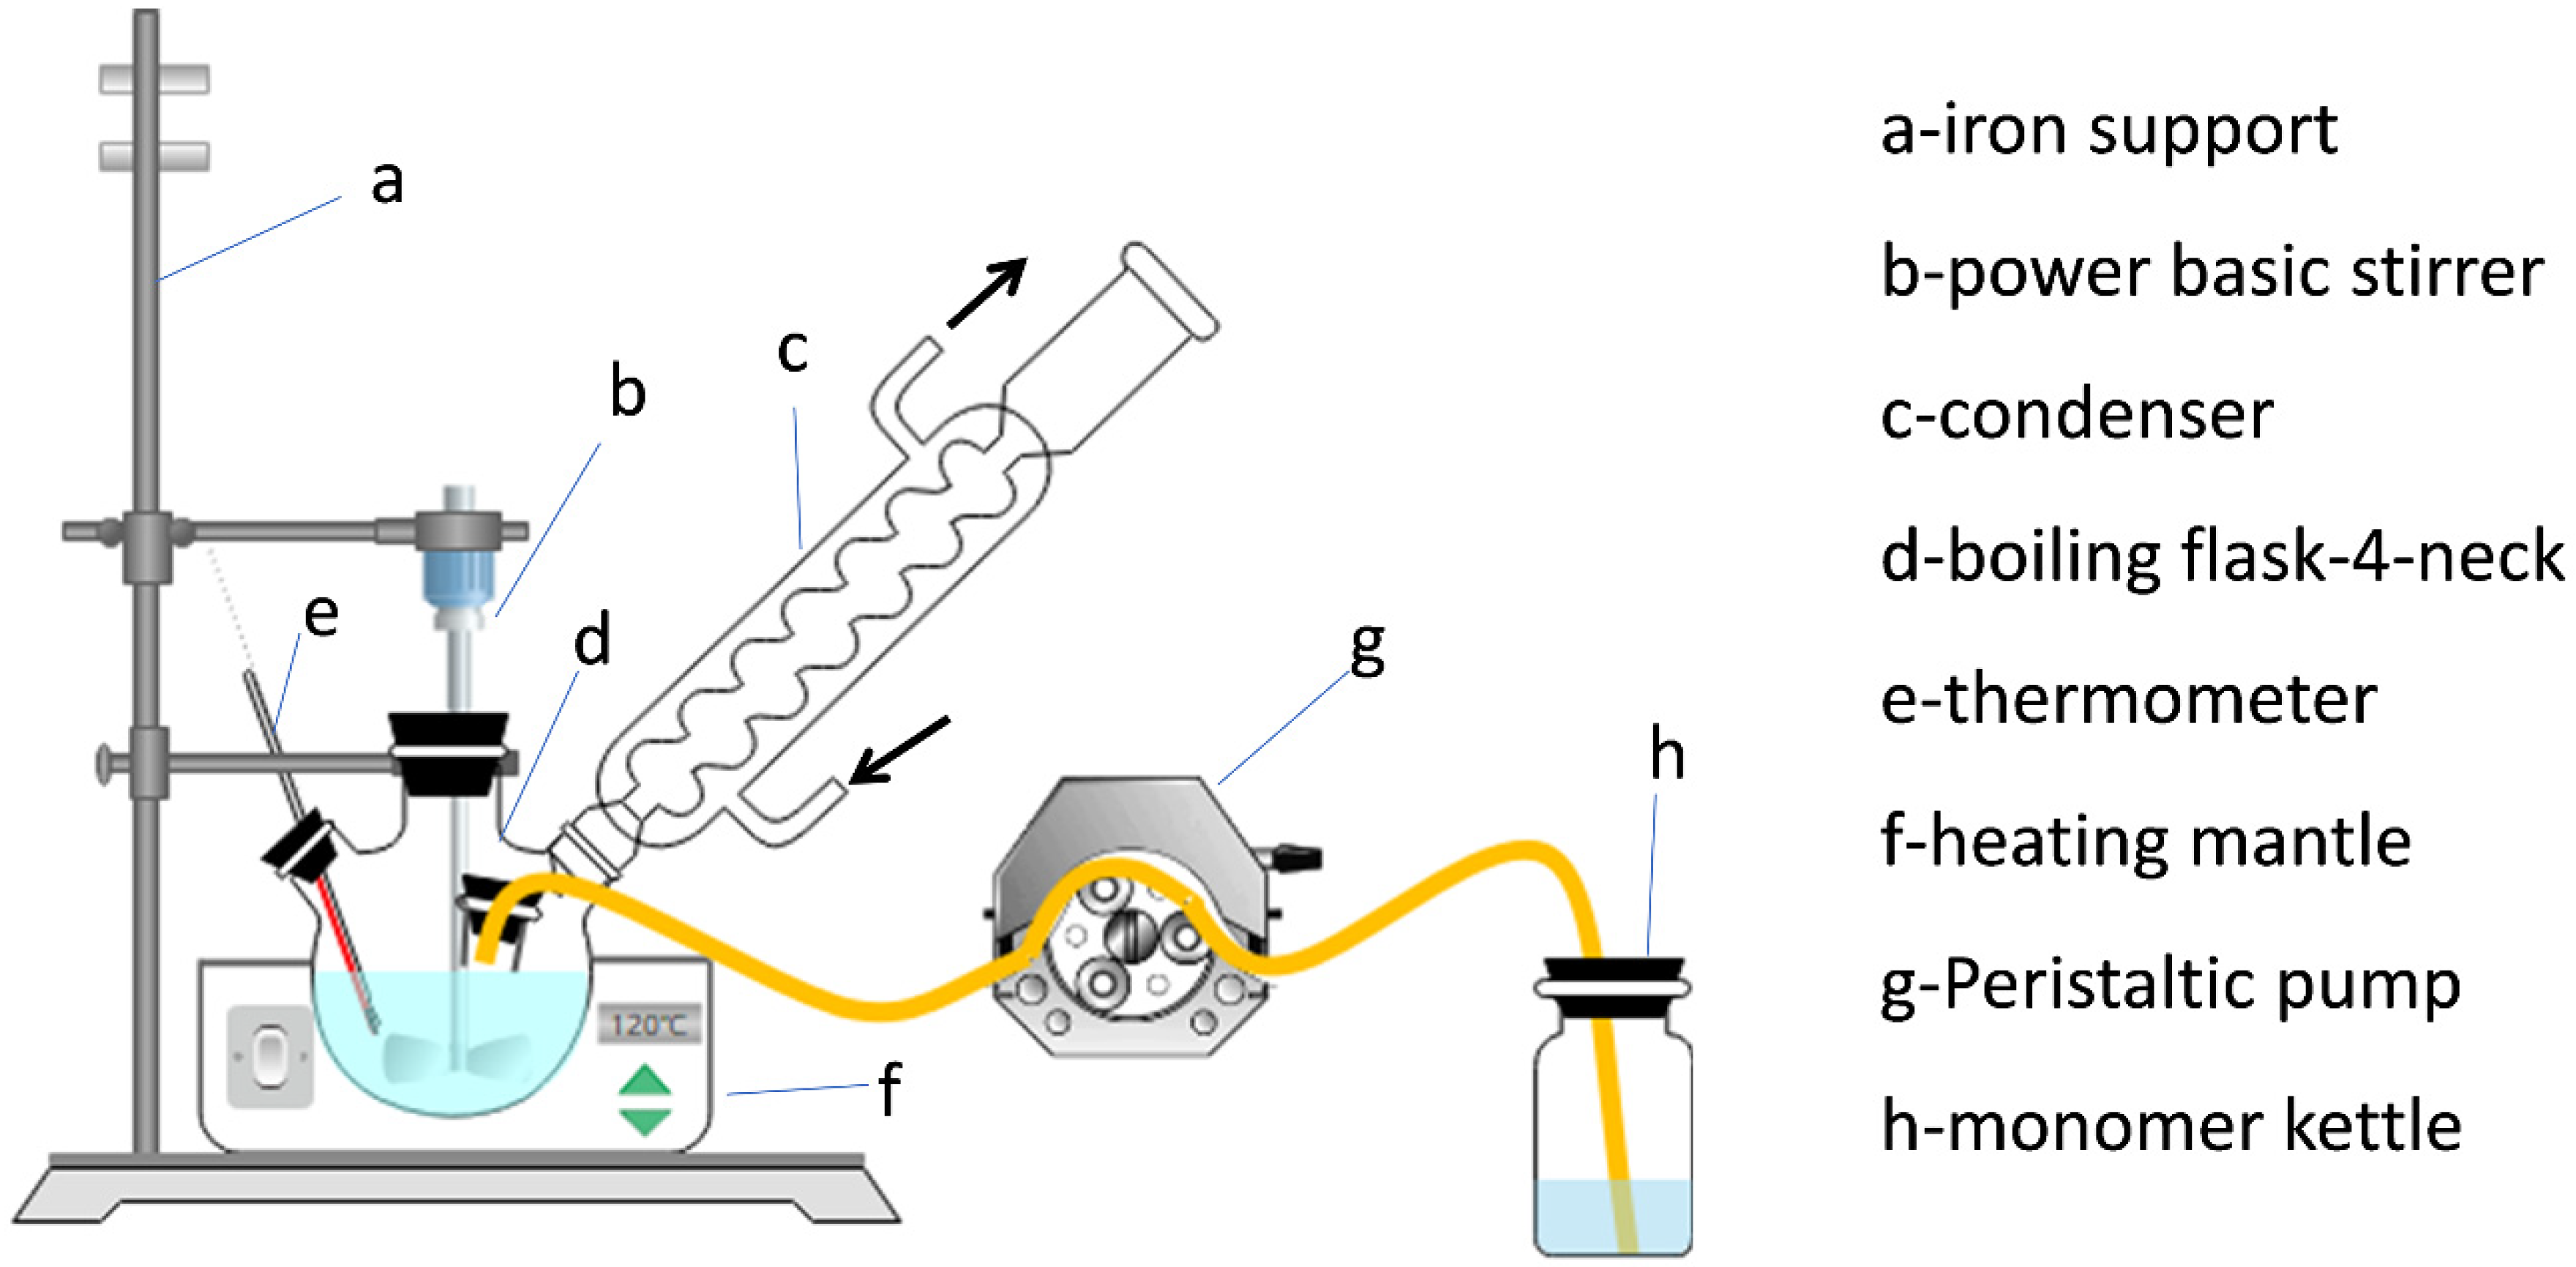
The experimental setup is shown in Figure 3, and the formulations of the prepared emulsions are shown in Table 1.

2.3. Characterization

The high-molecular-weight epoxy resin was prepared by a two-step method. The addition amounts of E-51 and BPA were calculated using the following formula [35].
W = Q E V 1 E V 2 0.8771 + E V 2
In the formula, EV1 represents the epoxy value of the low-molecular-weight epoxy resin, mol/100 g; EV2 represents the epoxy value of the high-molecular-weight epoxy resin, mol/100 g; W represents the feed amount of BPA, g; Q represents the feed quantity of low-molecular-weight epoxy resin, g.
The relationship between molecular weight, epoxy equivalent, and epoxy value is as follows:
Molecular weight = 2 × epoxy equivalent
Epoxy equivalent = 100/Epoxy value
Epoxy value = 100/Epoxy equivalent
The epoxy value of the epoxy resin was determined by the hydrochloric acid-acetone method, in which 1 mL of hydrochloric acid was dissolved in 40 mL of acetone, and then mixed well to prepare a hydrochloric acid-acetone solution. The appropriate amount of sample was weighed accurately to 0.1 mg, then placed into a stoppered conical flask. Twenty mL of acetone-hydrochloric acid solution was added via pipette, covered, and shaken well to dissolve it completely. Then, we added 3 drops of methyl red indicator solution and used 0.1 mol/L NaOH standard solution to titrate the endpoint from red to yellow. A blank experiment was performed at the same time. The epoxy value was calculated using the following formula [36].
Epoxy EPV = V 0 V C 10 W
where V is the volume of standard sodium hydroxide solution consumed by the sample, mL; V0 is the volume of standard sodium hydroxide solution consumed during the blank experiment, mL; C is the equivalent concentration of sodium hydroxide standard solution, mol/L; W is the mass of the specimen, g.
Calculation of grafting ratio: The synthetic aqueous resin emulsion was precipitated using petroleum ether, and the obtained precipitate was washed several times with deionized water, and then placed into a vacuum drying oven for one week at room temperature. Afterwards, the sample was weighed with a mass of M1 (g). The dried latex was wrapped with filter paper and put into a Soxhlet extractor for 24 h. A solvent mixture of ethanol and cyclohexane (1:1 by mass) was used to extract the polymerization products from the acrylic monomers. Finally, the un-grafted epoxy resin was extracted three times with acetone to obtain propionic acid-grafted epoxy resin. The sample was dried at 40–50 °C under vacuum for 24 h, and the mass was weighed as M2 (g). The grafting ratio was calculated using the following equation [37]:
ω = M2/M1 × 100%
where ω is the monomer grafting ratio (%).
The molecular weights of epoxy resins and their molecular weight distributions were verified by gel permeation chromatography (GPC; Waters e2695 Separations Module) using the polystyrene (PS) standards. An appropriate amount of the sample to be measured was dissolved in THF and heated at room temperature (or 30–50 °C) to dissolve the sample. An appropriate amount of the extracted dissolved sample was injected into the inlet port of the GPC.
The epoxy resins and their graft copolymers were characterized by FTIR spectroscopy (Nicolet IS 50, Thermo Fisher, Waltham, MA, USA). Solid potassium bromide pellets were created. The resolution was 4 cm−1, the scanning time was 20, and the wavenumber range was 4000–500 cm−1.
Differential scanning calorimetry (DSC; 200 F3 Maia, Netzsch, Selb, Germany) was used for the thermal analysis of the epoxy resins and graft copolymers. The heating rate was 20 °C/min, and the temperature range was from 20 °C to 200 °C.
Thermogravimetric analysis (TGA) was performed using a thermogravimetric analyzer (STA-499 F5, Netzsch) using a temperature increase rate of 10 °C/min under a nitrogen atmosphere and a scan range of 30–800 °C.
The emulsion particle size and distribution were tested with a laser particle size meter (Omax LS-POP (9), Omax, Zhuhai, China). An appropriate amount of sample was diluted several times until it was easy to measure, and then the instrument was used to measure the emulsion particle size and distribution.
The particle morphology of the emulsions was observed by transmission electron microscopy (JEOL-JEM 2100plus, Tokyo, Japan). The emulsion samples were diluted with deionized water and dipped on a copper grid that was dried at room temperature before being used to observe the emulsion particle morphology.
Viscosity measurement: The emulsion viscosity was tested using a digital rotational viscometer (BGD152/1, Biuged, Guangzhou, China). The approximate viscosity of the sample was predicted, and a suitable rotor was selected. The prepared epoxy–acrylic emulsion was poured into the container so that the emulsion was submerged over the entire length of the rotor. The appropriate range and rotational speed for the measurement were selected. Generally, the number displayed on the screen was within 30–60% of the range, and this number was taken as the viscosity.
Preparation of coating film: An appropriate amount of emulsion was evenly coated on a tinplate sheet, baked at 150 °C for 1 h, and then set aside for later to test the pencil hardness, adhesion, flexibility, water resistance, and media resistance.
Pencil hardness: Pencil hardness is defined as the resistance to scratches or other defects when the sample pushed across the surface of a paint film with pencil lead of a specified size, shape, and hardness. According to ISO 15184:1998, the hardness of the paint film was determined by a B-3084 pen durometer using the pencil method. Parallel tests were performed twice, and if two test results were inconsistent, the test was performed again. The hardness of the selected pencils from low to high was 9B–8B–7B–6B–5B–4B–3B–2B–B–HB–F–H–2H–3H–4H–5H–6H–7H–8H–9H, of which 9B was the softest one and 9H was the hardest one.
Adhesion grade: According to the standard ISO 2409:2020, the adhesion of the paint film was evaluated by using a QFH-type paint film scribe. According to the test result grading table, the adhesion grade was evaluated according to the size of the peeled area of the coating film in the grid. The test results were divided into grades 0–5, where a smaller number indicates better adhesion.
Flexibility: The flexibility of the paint films was determined using a QTX-type paint film elasticity tester according to the standard GB/T 1731-2020. Flexibility is defined as the ability of a paint or putty film to deform along with its substrate without breaking. The film flexibility tester consisted of seven axial rods of different diameters or radii of curvature fixed to the base, with diameters of 15 mm, 10 mm, 5 mm, 4 mm, 3 mm, 2 mm, and 1 mm. The results were expressed as the smallest axial rod diameter (mm), for which no net cracking or flaking was observed in at least two tests. A smaller axial diameter indicates better flexibility.
Water resistance: The room temperature immersion test was performed according to the standard GB/T 1733-1993. Distilled water or deionized water was added to a glass tank, and the water temperature was adjusted to 23 ± 2 °C and maintained throughout the test. Three test panels (tinplate sheets) were created, and 2/3 of each test panel was immersed in water for a specified time. After removal, it was blotted dry with filter paper to assess whether there was a loss of light, discoloration, blistering, wrinkling, shedding, rusting, or other phenomena. At least two of the three test plates should meet the provisions of the product standards.
Dielectric resistance: According to the standard GB/T 9274-1988, the immersion method was tested. The test was carried out at 23 ± 2 °C, and a sufficient amount of test solution was poured into a suitable container to completely or partially (2/3) submerge the specified test plate (tinplate sheet). A suitable stand was used so that the test piece was immersed in a nearly vertical position. The times when the defects such as discoloration, wrinkling, blistering, rusting, etc., appeared were recorded. The concentration (mass fraction) of the selected reagents were 5% NaCl solution, 5% H2SO4 solution, and 5% KOH solution.

3. Results and Discussion

3.1. Chain Extension Reaction

3.1.1. Selection of Optimal Molecular Weight

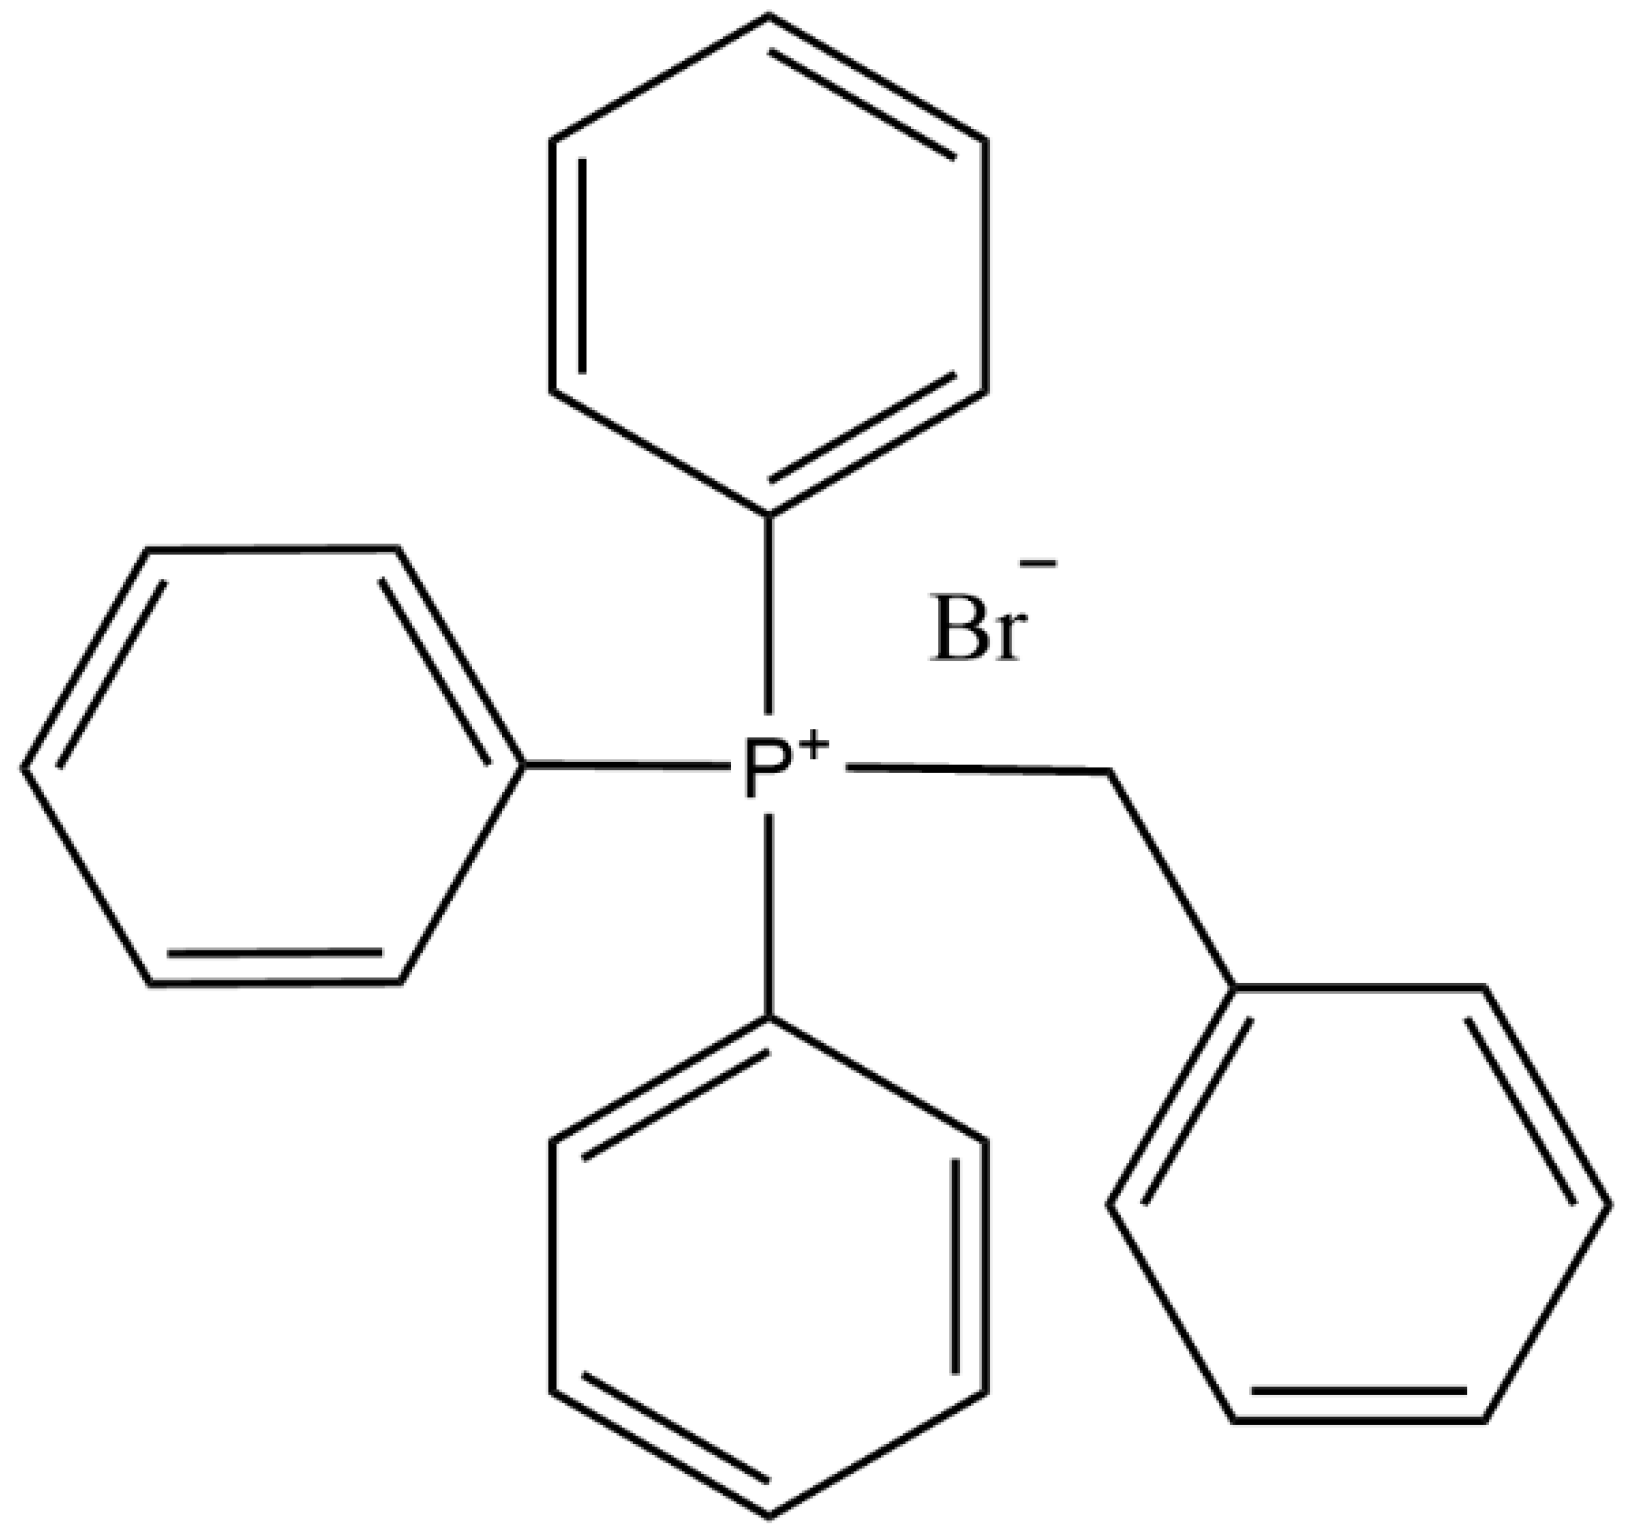
In this experiment, a high-molecular-weight epoxy resin was prepared by a two-step method. The requirements for a low-molecular-weight liquid epoxy resin are strict: the epoxy value cannot be low or the molecular weight distribution of the generated high-molecular-weight resin will be broad, causing the measured epoxy value of the obtained resin to deviate from the theoretical value. As we assumed an economic point of view, liquid epoxy resin E-51 was used in this experiment. The catalyst selected was benzyl triphenyl phosphine bromide, which stably reacts, has easy temperature control, and undergoes only a few side reactions. The structure of benzyl triphenyl phosphine bromide is shown in Figure 4.
Through several experiments, it was shown that the conversion rate of the chain extension reaction remained at about 95% throughout the synthesis of the epoxy resins with different molecular weights. Therefore, we can predict the molecular weight of the product more accurately and can adjust the molecular weight of the product by adjusting the amount of BPA. The actual dosage of BPA was the theoretical dosage divided by 95%. By using this above formula and the conversion rate, the epoxy resins with molecular weights of 4000, 5000, 6000, 7000, and 8000 were designed and labeled as a, b, c, d, and e. A chain extension was performed according to the conditions described in Section 2.2. The gel permeation chromatograms, molecular weights, and molecular weight distributions are shown in Figure 5A and Table 2.
Figure 5A shows the gel permeation chromatograms of the synthesized epoxy resins with different molecular weights, and Table 2 shows the molecular weights and molecular weight distributions. From Figure 5A and Table 2, it can be seen that the molecular weights of the products did not differ much from their designed molecular weights, the distribution index was small, and the molecular weight distribution was uniform. The produced emulsions were evenly coated on the tinplate and cured. The effect of the molecular weight of the epoxy resin on the performance of the coating film is shown in Table 3. The brine was the 5% NaCl solution, the acid was the 5% H2SO4 solution, and the base was the 5% KOH solution.
As can be seen in Table 3, the epoxy resins with five different molecular weights were made into emulsions, and the coating films were cured. The hardest pencil hardness was obtained by epoxy resins c and e. In terms of adhesion grade, flexibility, and water resistance, the five epoxy resins performed the same. The salt water resistance was better for c, d, and e. Film c had the best acid resistance and alkali resistance. This may be because when the molecular weight of epoxy resin is too large, the grafting of acrylic monomers on the side chain leads to the poor mobility of the chain segments. During the curing process, the poor fluidity of the chain segment will make the intermolecular gap larger, and the coating film is not dense enough, so the acid and alkali resistance of d and e is slightly poor. Epoxy resin c had the best comprehensive performance. Therefore, subsequent experimental factors were explored using epoxy resin c (6000 g/mol) as the raw material.

3.1.2. Determination of Catalyst Dosage

Keeping other process conditions unchanged and using benzyl triphenyl phosphine bromide as the catalyst, the relationships between different catalyst dosages and epoxy equivalents are shown in Figure 5B. The value 0.06% represents a catalyst dosage of 0.06% with respect to the mass of epoxy resin E-51, and so on. From Figure 5B, it can be seen that the lower the catalyst dosage is, the longer the reaction time is, and the greater the energy consumption is to achieve the same epoxy equivalent. When the reaction time was the same, a higher catalyst loading resulted in a greater epoxy equivalent in the product. This is because an increase in the amount of catalyst increased the reaction rate. When the amount of catalyst was too high, the reaction rate was too fast, and the system rapidly released a large amount of heat, resulting in an uncontrollable temperature increase. After many repeated experiments, too much of the catalyst may have led to local overheating, which increased the number of side reactions, causing the products to turn brown. Therefore, a catalyst dosage of 0.18% of the epoxy resin was most suitable option.

3.1.3. Reaction Temperature and Reaction Time

When the amount of reactants and catalyst is fixed, a higher reaction temperature will usually result in a shorter reaction time to reach the same epoxy value of the products. The temperature and time of the reaction followed an approximately inverse relationship. This is the time–temperature equivalence that is often observed for polymers. The relationship between the reaction temperature and time when the amounts of epoxy resin E-51, bisphenol A, and the catalyst were fixed is shown in Figure 5C.
This synthesis reaction has strict requirements for the reaction temperature of the system, and one lasting for about 2 h at 180 °C was the best choice. This was because if the temperature was too high, the reaction rate would be too fast, and the time required to reach the target epoxy value would be too short. This may result in thermal runaway or side reactions that deepen the product color. On the contrary, if the reaction temperature was too low, the reaction time would be longer, the reaction would be insufficient, and the energy consumption would be higher.

3.2. Grafting Reaction

3.2.1. Determination of the Optimal Grafting Reaction Temperature

There are two main free radical reactions between the epoxy resin and acrylic monomers: one is a graft polymerization reaction, in which acrylic monomers are grafted onto the epoxy resin, and the other is the self-polymerization reaction between the acrylic monomers. There is a competitive relationship between these two types of reactions, which have different temperatures, different reaction rates, and different final products. The prepared grafting products include the un-grafted epoxy resin, grafted epoxy resin, a homopolymer of methacrylic acid and styrene, etc. Therefore, it is necessary to separate the grafting products and study which reaction was dominant by testing the grafting ratio at different temperatures. If the grafting reaction of acrylic monomer to epoxy resin was dominant, grafting to the epoxy resin should produce more carboxylic acid groups (-COOH), increase the hydrophilicity, and produce a more stable emulsion. On the contrary, if the acrylic monomer self-polymerization was dominant and there were fewer grafted carboxylic acid groups (-COOH), the stability of the resulting emulsion should be significantly reduced.
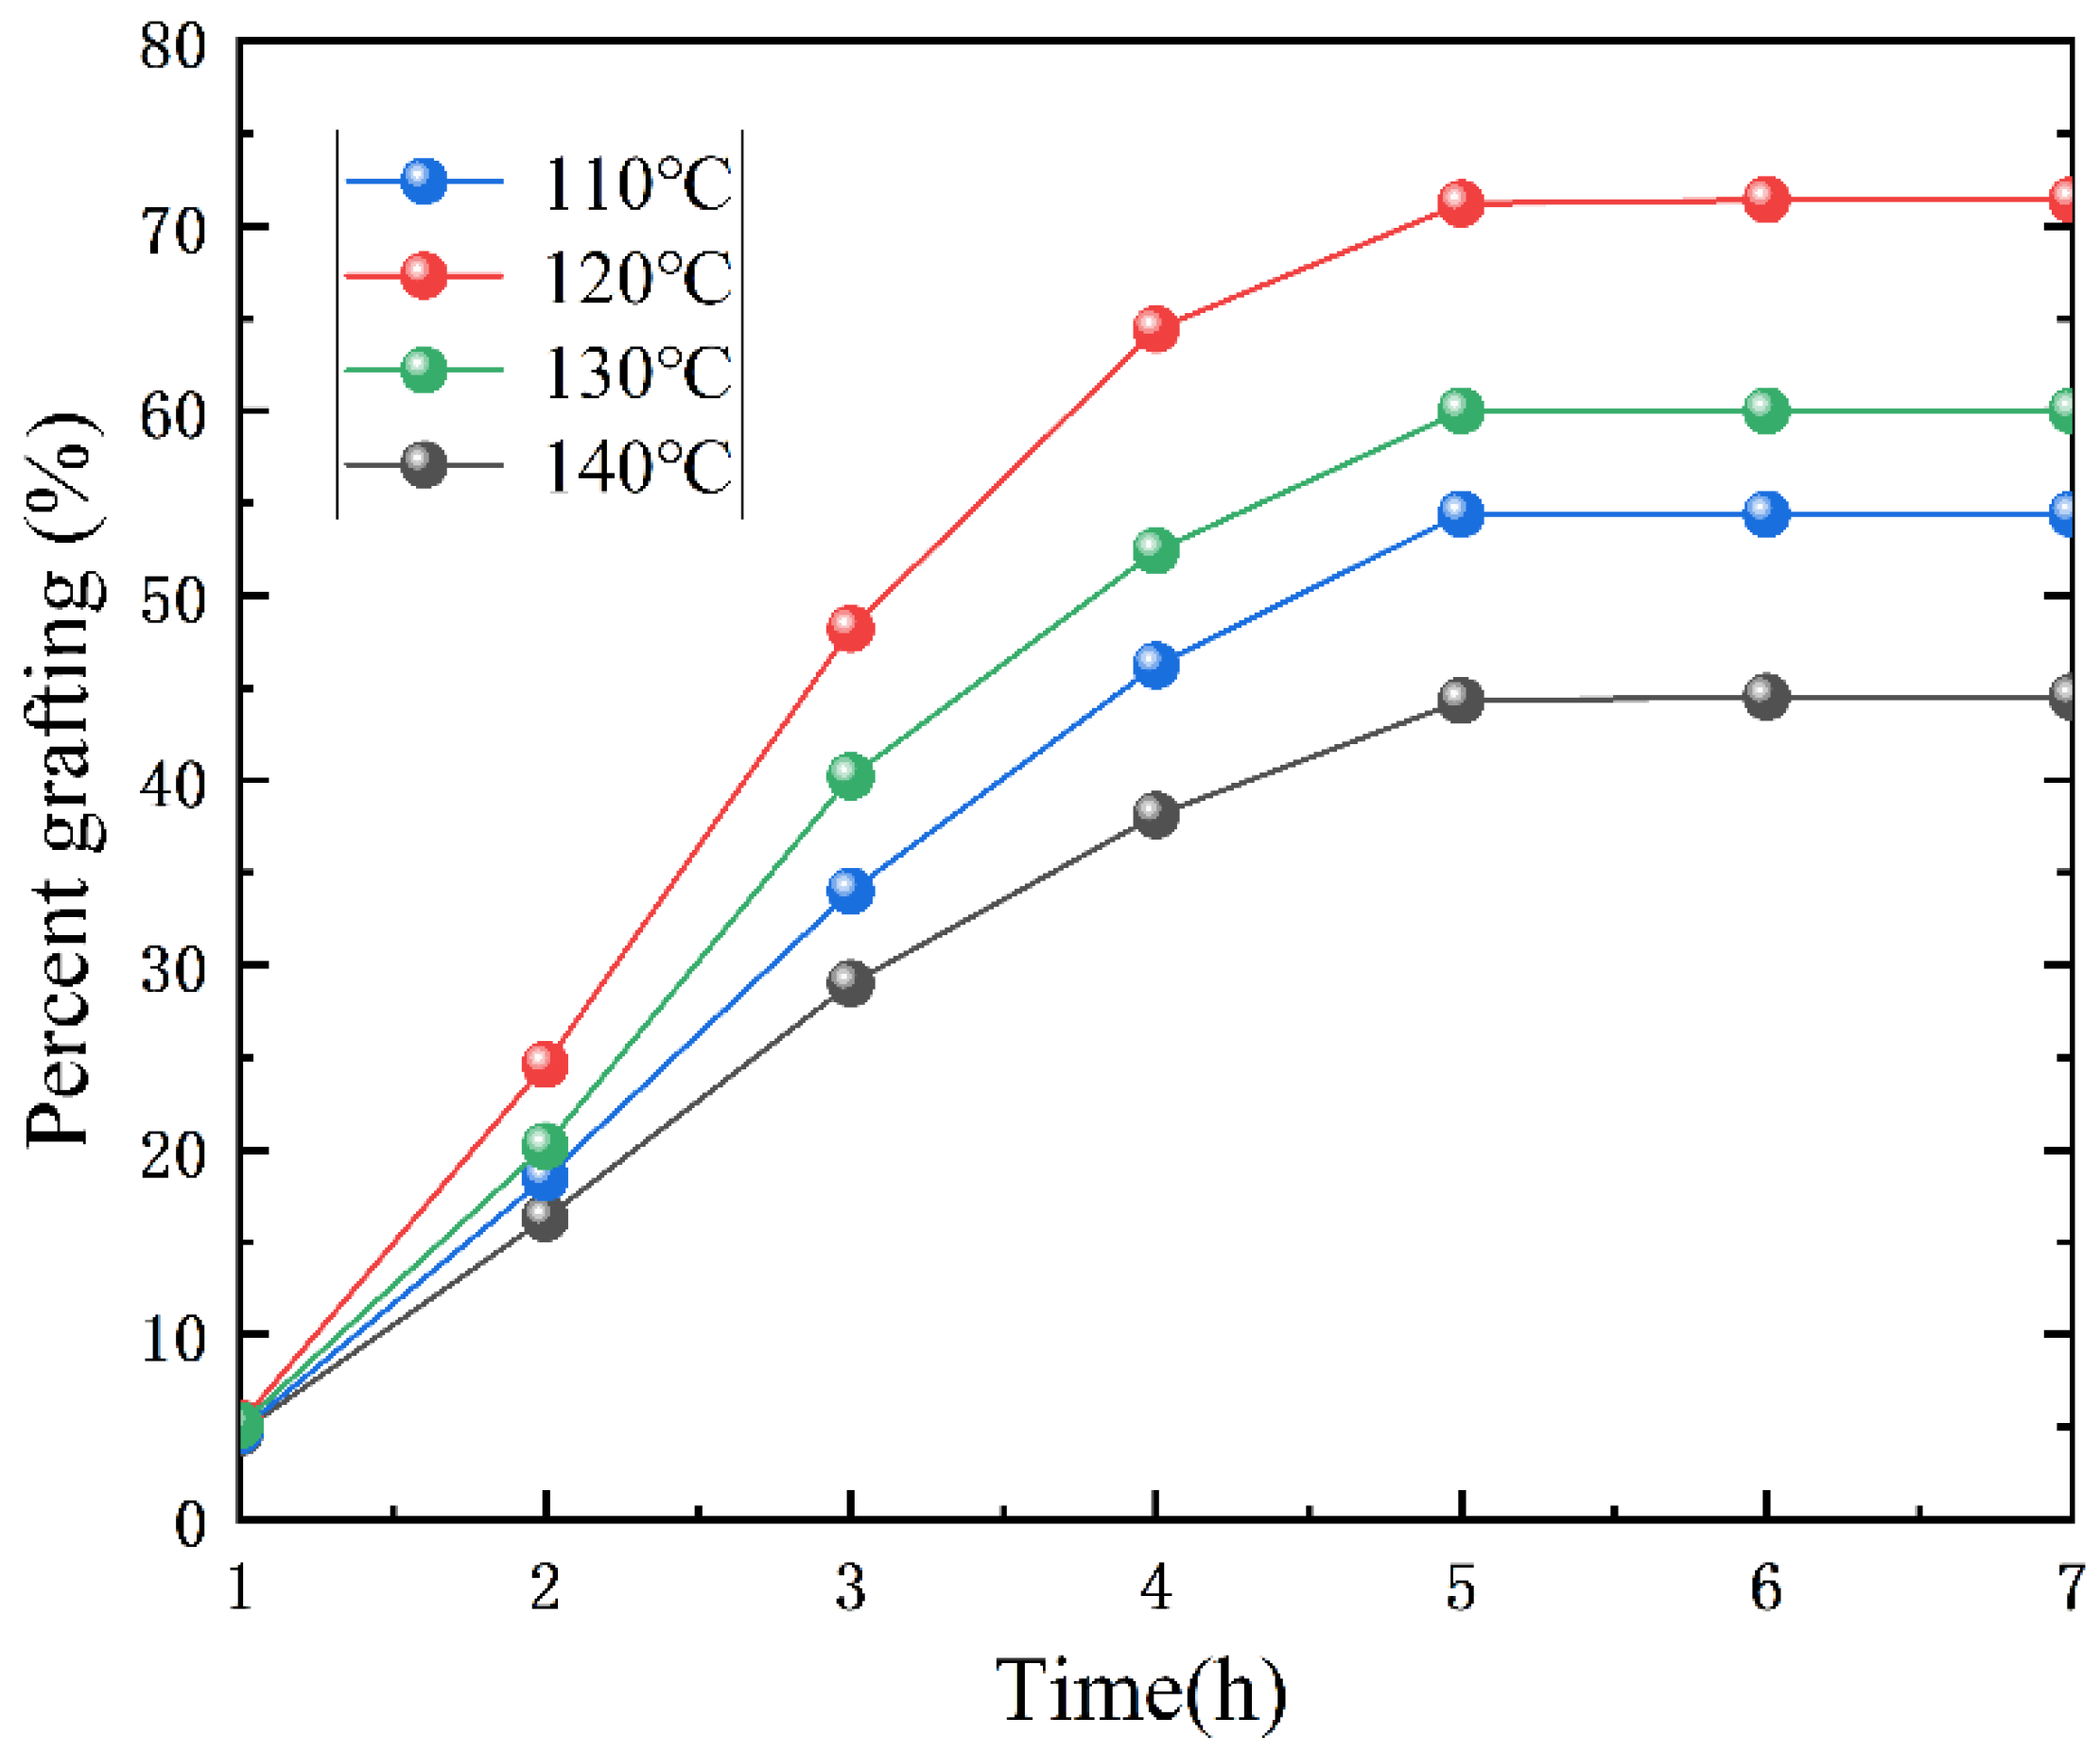
The effect of different grafting temperatures on the grafting ratio is shown in Figure 6, and the effect of different temperatures on the resin water dispersion is shown in Table 4. The amount of epoxy resin was 18%, the amount of MAA was 3%, the amount of BPO was 8% of the total mass of acrylic monomer, and other conditions remained unchanged.
By combining the data in Figure 6 and Table 4, it can be seen that when the temperature was 110 °C, the grafting ratio of the monomer was relatively low (~53%), the resin water dispersion was poor, the stability of the emulsion was poor, the coating easily delaminated, and a small amount of light yellow precipitate appeared after standing. This occurred because the initiator radicals required energy to abstract the hydrogen atoms from the epoxy resin’s methylene groups. When the reaction temperature is low, the energy of the reaction system is low, and the active center formed on the main chain of epoxy resin is smaller, which is not conducive to the grafting reaction, the reaction is mainly the polymerization reaction between acrylic monomers, and the obtained reaction is mainly the physical blending system of acrylic polymer and epoxy resin, and the emulsion stability is poor. As the reaction temperature increases, the decomposition rate of BPO becomes faster, more active centers are formed on the main chain of epoxy resin, the more favorable the grafting reaction is, more acrylic monomers are introduced on the epoxy resin, the better the water dispersion of the epoxy resin is, and thus the stability of the emulsion is improved. When the temperature was 120 °C, the grafting ratio was the highest, and a stable emulsion was obtained. When the temperature reached 130 and 140 °C, the grafting ratio decreased. This was because the decomposition rate of the initiator (BPO) was too fast, which decreased the initiation efficiency, and the number of grafting sites triggered by free radicals decreased. The grafting ratio of monomer was reduced. When the temperature was too high, although the self-reaction between monomers was inhibited, the carboxylic acids and epoxy groups were more reactive. This increased the number of carboxyl and epoxy group ring-opening reactions, which increased the cross-linking degree. Adhesion and gelling occurred at rest, which caused the number of side reactions to increase, which was not conducive to the graft polymerization reaction, and the color of the precipitate darkened. Therefore, the grafting reaction temperature of 120 °C was optimal.

3.2.2. Effect of Initiator (BPO) Dosage on the Grafting Ratio

Grafting occurs via a free radical reaction, so the activity of the radical generated after initiator cleavage is crucial to the formation of graft sites. The stronger the radical activity is, the greater the ability is for it to capture hydrogen atoms, and the greater the chance of grafting is. Commonly used initiators for free-radical polymerization include peroxides and azides, among which benzoyl peroxide (BPO) and azo diisobutyronitrile (AIBN) are the most commonly used. AIBN is most suitable at 45 to 65 °C, as it violently decomposes at 80 °C, releasing toxic organic nitriles. AIBN does not easily abstract the hydrogen from macromolecular chains, so it is unsuitable for this kind of grafting reaction. The free radical generated by BPO has a stronger hydrogen abstraction ability and a wider range of applicable temperatures. Therefore, BPO was chosen as the initiator for the grafting reaction.
As can be seen from Figure 7, when the amount of BPO was less than 8% of the total monomer amount, the grafting ratio was relatively low because fewer free radicals were generated during the chain initiation stage. This decreased the number of active grafting sites on the epoxy resin, so there were many water-insoluble un-grafted epoxy resins in the system, resulting in poor stability. Upon increasing the BPO dosage, the grafting ratio also increased. Increasing the BPO concentration in the system more quickly abstracted the hydrogen atoms from the epoxy resin molecular chain and formed many free radicals. When the amount of BPO was 8% of the total monomer amount, the grafting ratio was the highest, and the emulsion was the most stable. When the amount of BPO exceeded 8%, excess BPO promoted the self-polymerization of acrylic monomers and reduced the number of reactions between the epoxy resin and monomers. In addition, the larger self-polymerized monomers hindered the free radical reaction of the epoxy resin due to steric effects. Therefore, excess BPO did not continually increase the water solubility of the grafted copolymer. In contrast, the self-polymerizing macromolecule decreased the stability of the emulsion. Excess BPO generated many free radicals that self-terminated. Therefore, 8% BPO with respect to the total monomer was the most appropriate choice. Figure 6 and Figure 7 show that the reaction ended when the grafting reaction time was 5 h. That is, the monomer was added dropwise for 2 h, and the reaction was performed for 3 h.

3.2.3. Influence of Epoxy Resin Dosage on the Coating Film Performance

During graft copolymerization between the epoxy resin and acrylic monomer, the grafting ratio cannot reach 100% because of the self-polymerization of the acrylic monomers. The products were generally composed of three parts: the epoxy–acrylic acid graft copolymer, the un-grafted epoxy resin, and the self-polymerized acrylic monomers. Therefore, the amount of epoxy resin added influences the reaction. The effect of the amount of epoxy resin on the performance of the coating film is shown in Table 5. The amount of MAA was 3% of the total formulation, the amount of BPO was 8% of the total monomer amount, the reaction time was 5 h, the neutralization temperature was 50 °C, the neutralization degree was 80%, the curing temperature of the coated film was 150 °C, the curing time was 1 h, and the other conditions remained unchanged.
As shown in Table 5, when the amount of epoxy resin was less than 18%, the performance of the coating film greatly improved upon increasing the amount of epoxy resin. The hardness and adhesion were significantly improved. When the amount of epoxy resin was 18%, the performance was the best. When the dosage exceeded 18%, the pencil hardness and flexibility slightly decreased, possibly due to the presence of a rigid benzene ring on the epoxy resin. As the epoxy resin dosage increased, the benzene ring amount also increased, which reduced the flexibility of the paint film. The amount of epoxy resin was too higher, too much epoxy resin was not involved in the reaction, and there were epoxy resin and grafting products in the product. This greatly reduced the compatibility, which affected the hardness and flexibility. Therefore, the amount of epoxy resin was set at 18%.

3.2.4. Determination of MAA Dosage

MAA was chosen as the functional monomer because it contains carboxylic acid groups that provide hydrophilic groups to the grafting products. These groups greatly influence the water dispersibility of copolymers and the stability of emulsions. At the same time, the carboxylic acid groups can also participate in the cross-linking reaction during the curing of the coating film. A suitable amount can greatly improve the coating film properties. The effect of the amount of MAA on the performance of the coating film is shown in Table 6. The amount of epoxy resin was 18% of the total formulation, the amount of BPO was 8% of the total monomer, the reaction time was 5 h, the grafting temperature was 120 °C, the neutralization temperature was 50 °C, the neutralization degree was 80%, the curing temperature of the coating film was 150 °C, the curing time was 1 h, and the other conditions remained unchanged.
As can be seen from Table 6, when the content of MAA was low (<3%), the amount of carboxyl group grafted on it was small, the dispersion did not have enough water solubility, and the insoluble material precipitated slowly to the bottom, leading to the delamination of the emulsion, poor stability, and the coating film performance was correspondingly poor, or even unable to form a film. When the content of MAA increased to 3%, the water solubility of the system increased, and the film was denser, so the performance of the coating film was better. Upon further increasing the content of MAA (>3%), the water solubility of the dispersion had a negligible effect on film formation, and the pencil hardness, adhesion, flexibility, and water resistance of the coating film decreased. This was because the carboxylic acid groups were hydrophilic and reactive. If too many carboxylic acid groups were introduced, the crosslinking density would be too high after curing the film, which would produce a brittle coating, with strong tension, poor flexibility, poor adhesion, and even a tendency to crack and peel. Upon increasing the amount of MAA, the degree of self-polymerization also increased. Polymethacrylic acid itself is a transparent and brittle solid, and increasing its content will affect the performance of the coating film. Therefore, 3% MAA provided the best comprehensive performance of the coating film.

3.2.5. Infrared Spectral Analysis of Graft Copolymers

As mentioned above, the grafted products included the un-grafted epoxy resin, grafted epoxy resin, homopolymers of methacrylic acid and styrene, etc. Therefore, it is necessary to separate and purify the grafted products to determine whether the monomers were grafted onto the epoxy resin. The separation method was the same as that used for grafting ratio measurements. The FTIR spectra of the epoxy resin (a) and the purified graft copolymer (b) are shown in Figure 8.
Figure 8a shows the FTIR spectrum of the pure epoxy resin, and b shows the FTIR spectrum after grafting. The absorption peak of the hydroxyl group of the epoxy appeared at 3382.1 cm−1; the absorption peak of the epoxy group at the end of the epoxy appeared at 915.0 cm−1. Spectrum b shows an enhanced absorption peak at 3382.1 cm−1 compared with that of line a, which was due to the hydroxyl absorption peak of methacrylic acid. The absorption peak of the C=O bond at 1713.0 cm−1, the absorption peak of the monosubstituted benzene ring at 730.3 cm−1, and the characteristic absorption peak of the epoxide group at 915.0 cm−1 remained almost unchanged. This indicates that in reaction b, the graft copolymerization of the epoxy resin with the acrylic monomer occurred, indicating the successful grafting of the monomer onto the epoxy resin. There was no evidence of ring-opening esterification of the epoxy groups and carboxylic acid group of methacrylic acid.

3.2.6. DSC Analysis of Graft Copolymers

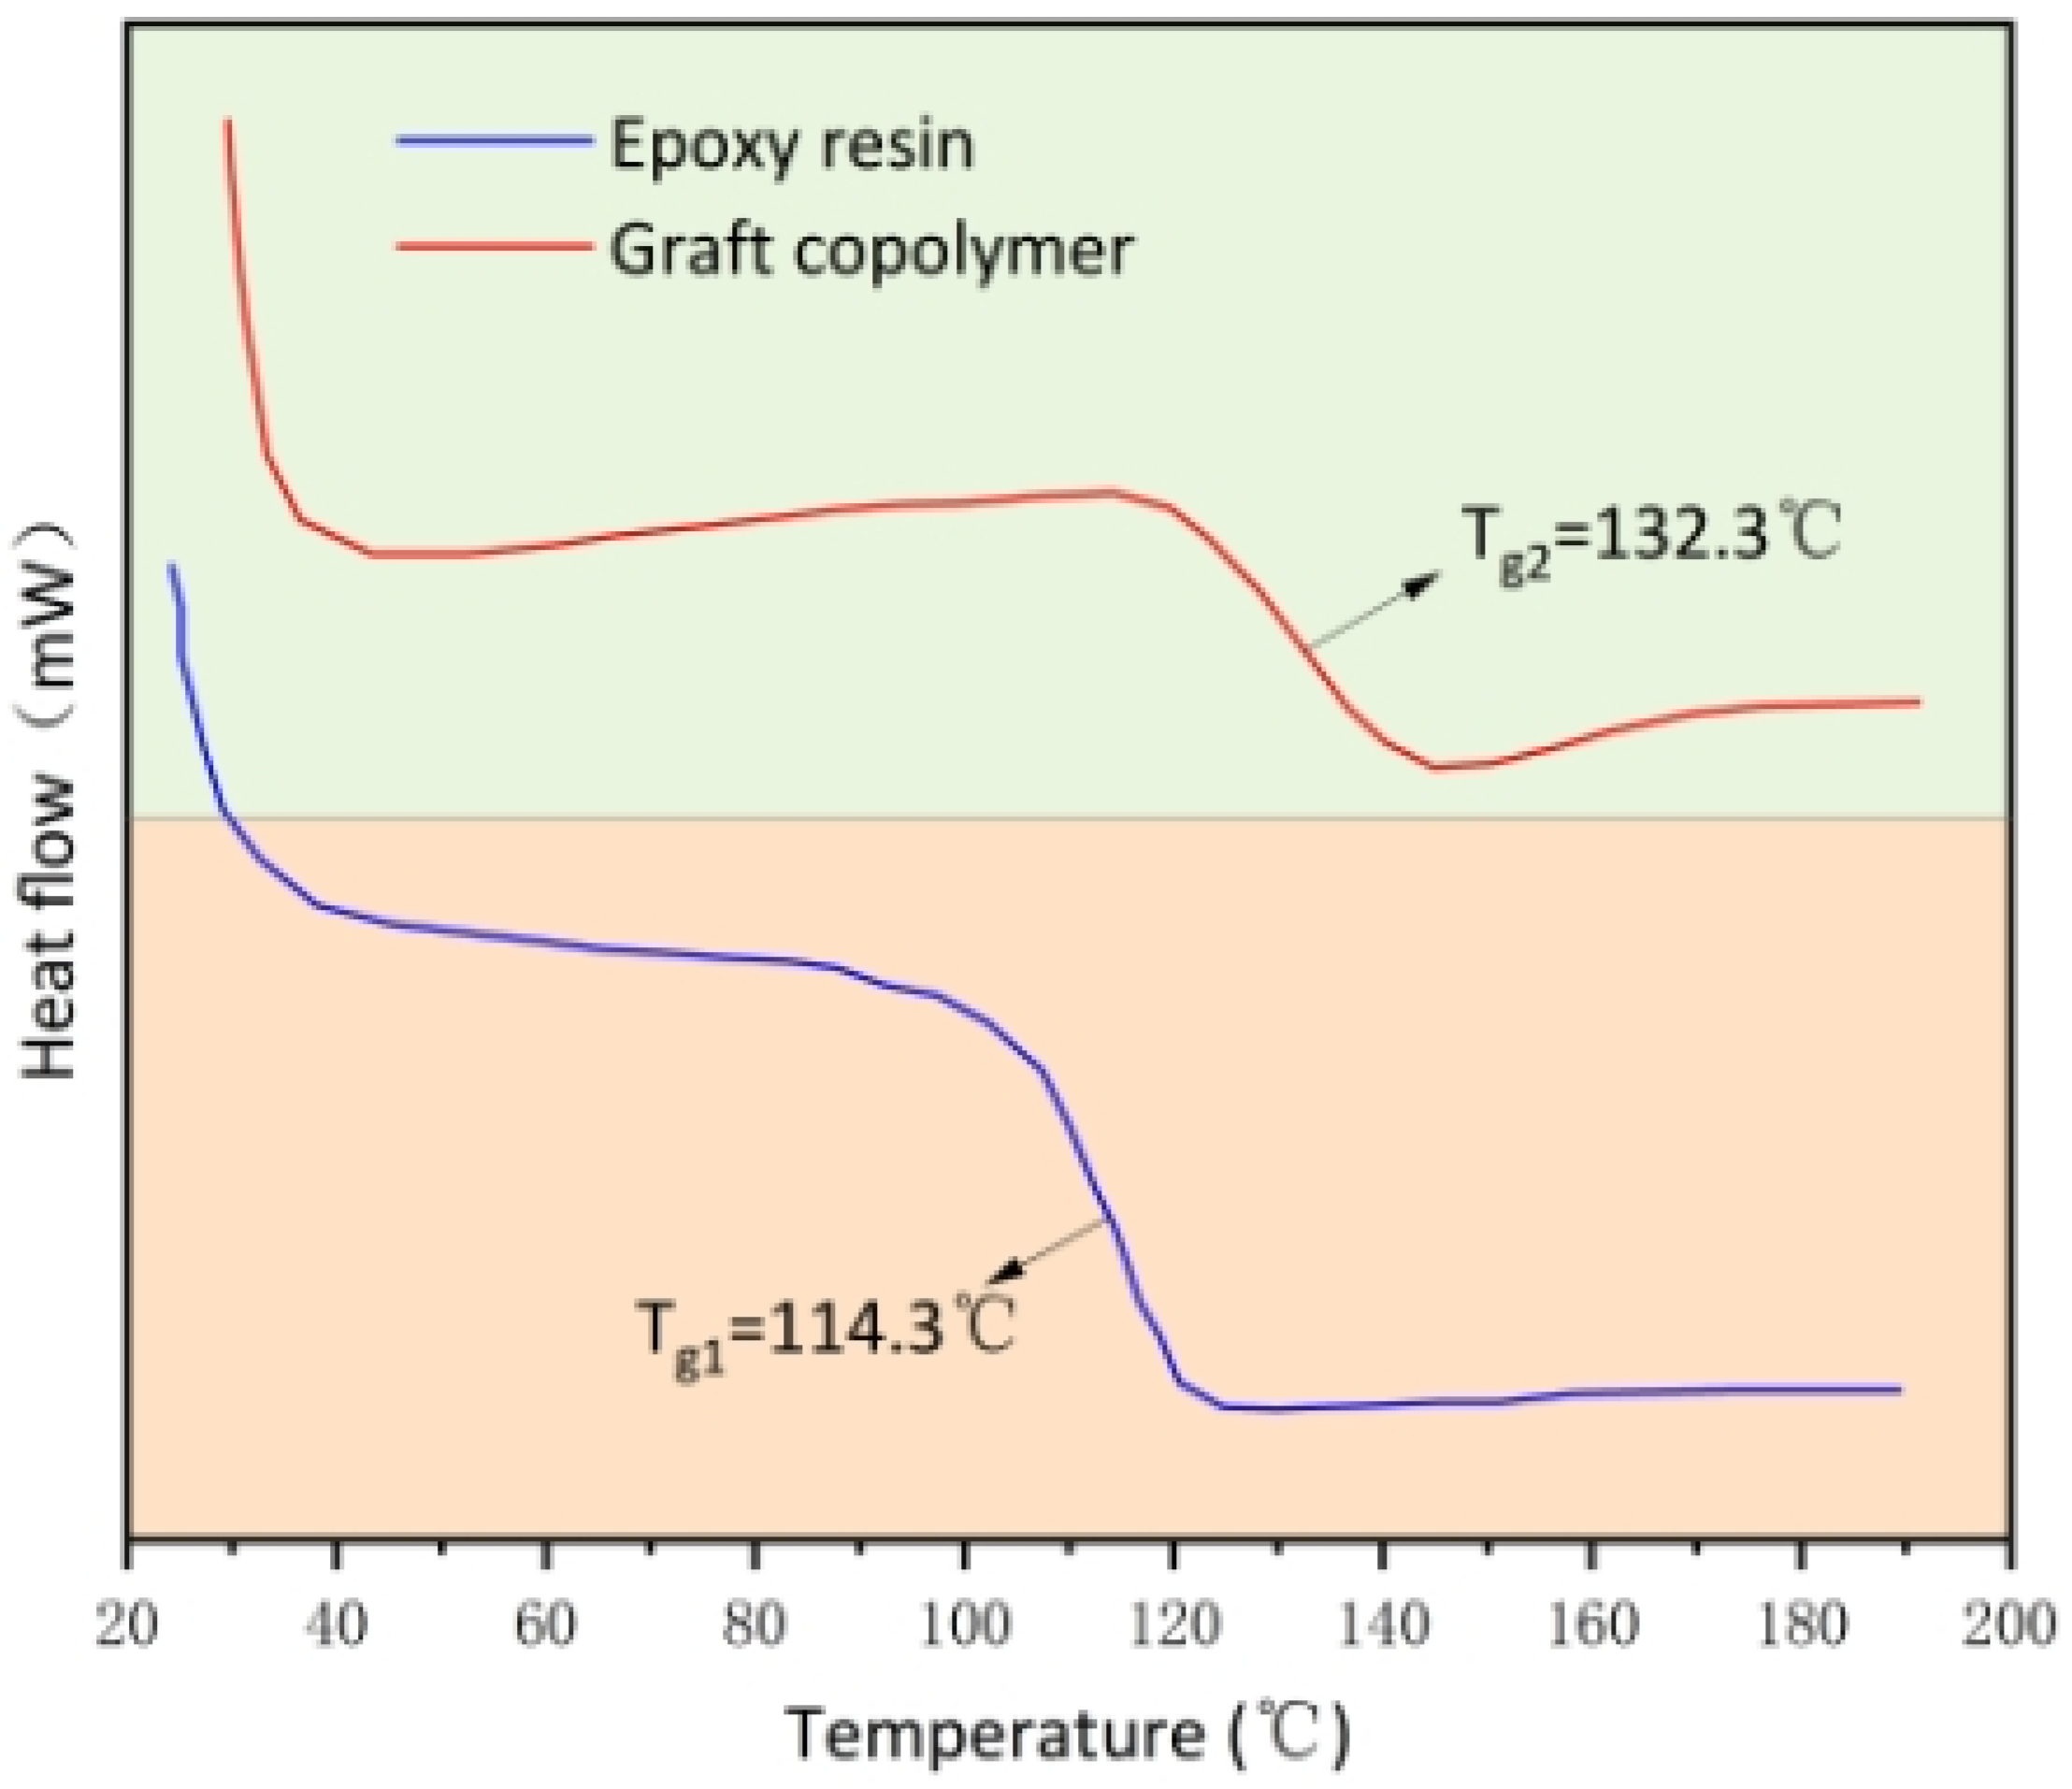
DSC analysis was performed on the epoxy resin and the purified graft copolymer, and the results are shown in Figure 7.
As seen in Figure 9, the glass transition temperature of the epoxy resin was 114.3 °C, while the glass transition temperature of the epoxy–acrylic acid graft copolymer was 132.3 °C. The glass transition temperature of the graft copolymer was 18.0 °C higher than that of the pure epoxy resin. This may be because the side chains were introduced into the epoxy resin molecules through grafting, which improved the rigidity of the epoxy resin molecular chains, meanwhile, the glass transition temperature of the epoxy resin was increased and the heat resistance was also improved because the side chains contained hard chain segments such as copolymers or homopolymers of MAA, ST, and BA.

3.2.7. TGA of Graft Copolymers

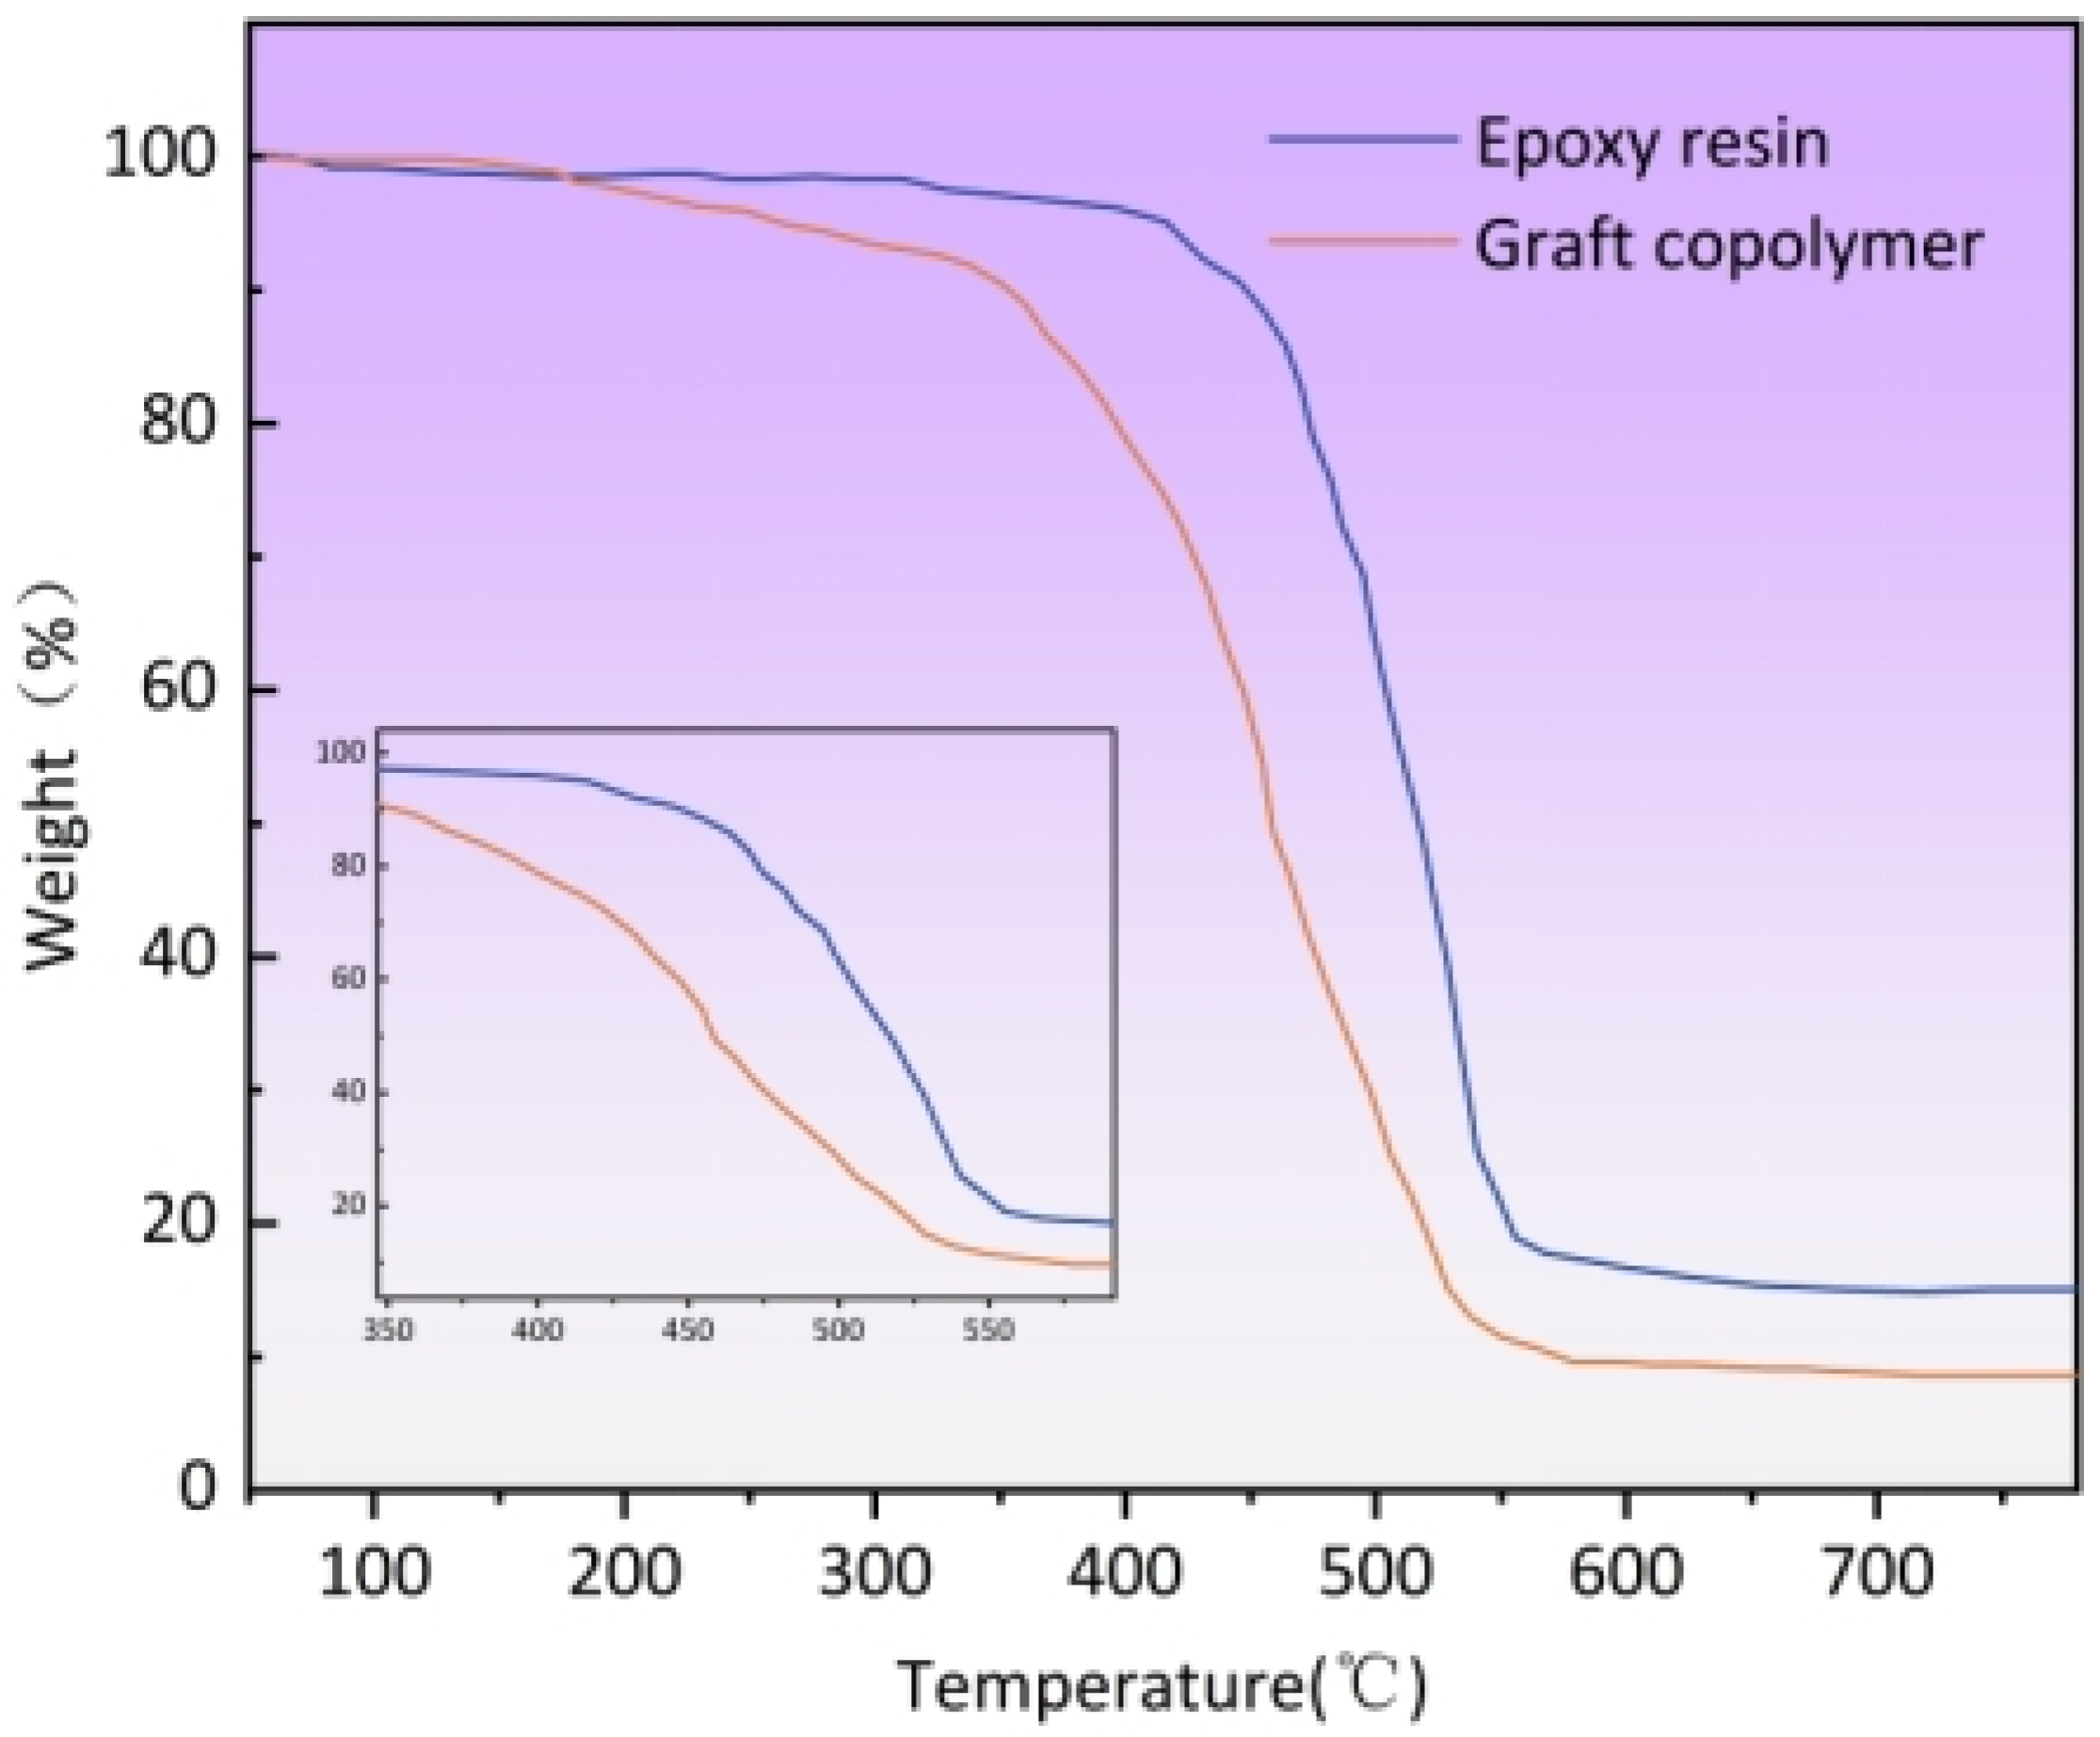
TGA was performed on the epoxy resin and the purified graft copolymer, and the results are shown in Figure 10.
Figure 10 shows that the maximum weight loss range of both the epoxy resin and graft copolymer was 350–560 °C. Upon increasing the temperature, the graft copolymer started to decompose before the pure epoxy resin did because many monomers were grafted onto the epoxy resin. This increased the branching of the graft copolymer, and the branched chains started to decompose first, thus, the decomposition temperature of the graft copolymer was slightly lower than that of the pure epoxy resin. The final weight loss was higher for the pure epoxy resin than it was for the graft copolymer, so the thermal stability of the graft copolymer at high temperatures was lower than that of the pure epoxy resin. However, the usage conditions of this epoxy resin will be lower than those used in this study, suggesting a good use performance.

3.3. Neutralization Reaction

3.3.1. Influence of the Neutralization Degree on the Emulsion

The synthesized epoxy–acrylic resin contained many carboxylic acid groups, which were hydrophilic, but they were associated and insoluble in water. Therefore, it is necessary to use alkaline-neutralizing agents to neutralize them via ionization to increase their water solubility. A comparison of the properties of different common types of neutralizing agents is shown in Table 7.
As can be seen from Table 7, ammonia showed a worse dispersion effect than triethylamine and DMEA did, and the emulsion viscosity was higher because triethylamine and DMEA improve the performance of the solvent. The larger the molecular chain of organic amines is, the better the emulsion stability is. Triethylamine has a low boiling point, so when it reached the surface, it immediately evaporated from the film, and the surface of the coating was dry. However, the interior was still moist, causing surface defects. In contrast, DMEA did not display this phenomenon, so it was ultimately selected.
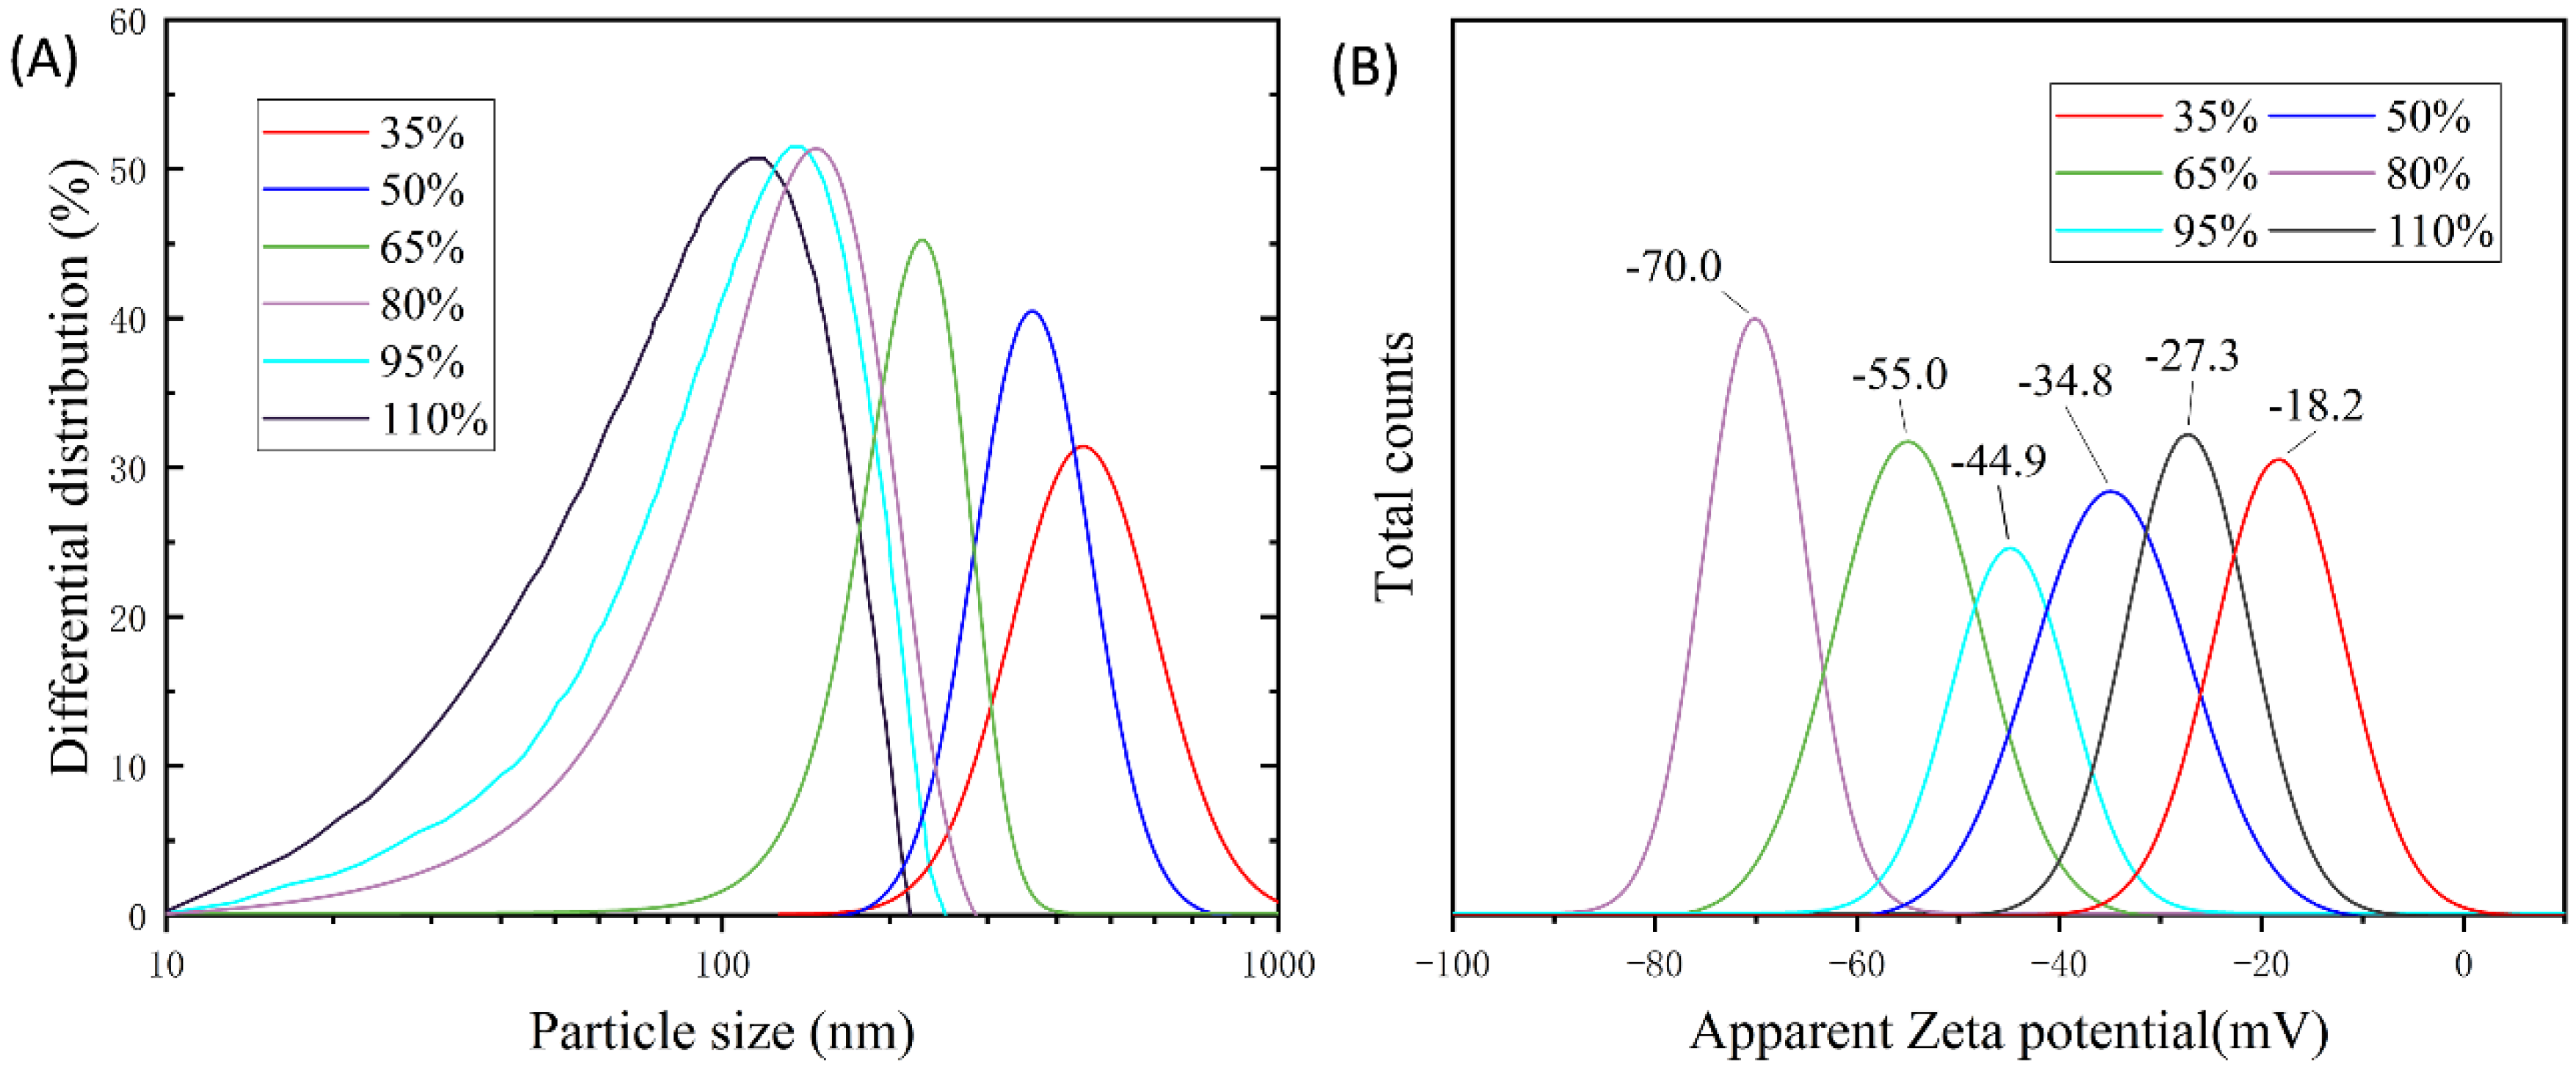
The effects of the neutralization degree on the emulsion properties are shown in Figure 11 and Table 8 when the amount of epoxy resin was 18% of the total formulation, the amount of MAA was 3%, the amount of BPO was 8% of the total monomer, the reaction time was 5 h, the grafting temperature was 120 °C, the neutralization temperature was 50 °C, and the other conditions remained unchanged.
In addition to the neutralizer, the degree of neutralization, i.e., the degree to which the carboxylic acid group is neutralized, also affects salt formation. From Figure 11A and Table 8, it can be seen that when the neutralization degree was 35%, the particle size distribution of the emulsion was broad, and the average particle size was about 467.6 nm. The viscosity was low, there was a small amount of granular material at the bottom of the emulsion, and the stability of the emulsion was poor. When the neutralization degrees were 50% and 65%, the particle size distribution of the emulsion became narrower, the average particle size also decreased, the viscosity gradually increased, and the stability of the emulsion improved. When the neutralization degree was 80%, the particle size distribution of the water dispersion was narrower, the average particle size was only about 160 nm, and the dispersion remained stable for more than one year at room temperature. When the neutralization degrees were 95% and 110%, the viscosity of the emulsion increased rapidly, and the stability decreased. When the neutralization degree was 125%, gelation occurred. The above results were corroborated by the zeta potential distribution of the emulsion (Figure 7B), where the closer the potential is to zero, the more unstable the emulsion is. The greater the absolute value of the potential is, the more stable the emulsion is. It can be seen that the emulsion was most stable at 80% neutralization.
When the neutralization degree was low (65% and below), most carboxylic acids on the resin chain were still exposed and were insoluble in water when they were not neutralized into salts. The molecular chains were easily entangled, resulting in larger dispersed particles, poor hydrophilicity, unstable emulsions, and easy delamination. Another reason is that because there were still many carboxylic acid groups left in the system, DMEA catalyzed the cross-linking reaction between the carboxylic acid groups and epoxy groups. Upon extending the reaction time, the cross-linking degree of the system increased, particle agglomeration increased, and after reaching a certain degree, many aggregated particles settled, which destabilized the dispersion and led to delamination. Upon increasing the neutralization degree, more carboxylic acid groups in the system were neutralized into salts, the hydrophilicity of the dispersed particles increased, the agglomeration of the particles decreased rapidly, the particle size decreased, and the distribution was uniform. Under these conditions, the unreacted epoxy resin molecules in the system were wrapped by other particles, which helped to increase the stability of the system. When the neutralization degree reached 80%, the epoxy chain segment of the graft copolymer was located inside the micelles, and the carboxylate chain segment was located on the surface of the micelles. Therefore, the surfaces of the emulsion microspheres were charged, forming a double electric layer. The epoxy–acrylic acid graft copolymer was dispersed in water in its ionic form, which improved the hydrophilicity of the dispersed particles, reduced the particle agglomeration, decreased the average particle size, and increased the stability of the dispersion. When the neutralization degree continued to increase, the viscosity of the system rapidly increased to 125% gel. Too much alkali agent was added, causing the coating film to become yellow and brittle. Combined with the above results, the emulsion system was most stable when the degree of neutralization was 80%.
The viscosity of the grafting product was high at room temperature and was difficult to disperse in water. As can be seen from Table 9, when the temperatures were 30 °C and 40 °C, the graft product was semi-solid with poor mobility. This was because the low temperature prevented it from fully reacting with DMEA. When the temperature was 50 °C, the viscosity of the grafting product was moderate, and the grafting product was neutralized by DMEA, and then dispersed in water. A stable white emulsion was obtained. When the temperature was 60 °C, the color of the grafting product darkened after neutralization by DMEA. This was because DMEA is a tertiary amine, which can be used as a catalyst to initiate the ring-opening of the epoxy groups. This will lead to side reactions, thus reducing the stability of the emulsion. When the temperatures were 70 °C and 80 °C, increasing the temperature increased the number of side reactions, and the cross-linking degree between the epoxy groups increased. The product after neutralization was brown, the water solubility was poor, and the amines were easily volatilized at high temperatures. Therefore, the salt-forming temperature of the synthetic resin was controlled at about 50 °C, and the water-dispersion system produced was more stable.

3.3.2. Morphology of Emulsion Particles

The morphology of the emulsion particles was observed by transmission electron microscopy (TEM; JEOL-JEM 2100plus). From the TEM images of the emulsion particles at different scales in Figure 12, it can be seen that the particles had smooth surfaces, round and regular morphologies, a regular spherical structure, no bonding agglomeration, and an average particle size of about 160 nm. The sizes of the emulsion particles were slightly different, probably because the grafting ratio between the epoxy resin and acrylic monomer was not 100%. The emulsion system contained both epoxy–acrylic acid grafted copolymers, un-grafted epoxy resin, as well as the polymerization reaction products between acrylic monomers (MAA, ST, and BA). This produced emulsion particles of different sizes. The TEM images confirm the particle size results obtained by the laser particle size analysis.

3.3.3. Emulsion Performance Testing

The properties of the emulsions prepared under optimal conditions are summarized in Table 10.
The emulsion was evenly coated on the test plate and cured in an oven at 150 °C for 1 h. Then, the performance of the coating film was tested and compared with a commercial solvent-based epoxy coating. Here, the selected solvent-based epoxy coating was an IPN8710 anti-corrosion coating from Zhangjiagang Jinchang Chemical Co. The tested performance of the coating film was compared with the technical index of IPN8710 anti-corrosion coating, as shown in Table 11.
As can be seen from Table 11, after coating the film, the homemade emulsion reached or even exceeded the technical index of IPN8710 in terms of pencil hardness, adhesion, and flexibility. It also showed good salt water resistance, acid resistance, and alkali resistance. Since IPN8710 is commercially available, the better performance of the homemade emulsions may also meet the market demands. Moreover, the process of producing the homemade emulsion is simple, and most importantly, it produced fewer VOCs.
The coating film properties of the homemade emulsions were compared with those reported in the literature [27,31,32,33], where national or corporate standards were mostly used to evaluate the coating film properties. For water and media resistance, most of them use 48 h or 72 h as indicators, and the film was considered to qualify if no defects appeared within these time periods. As can be seen in Table 11, the emulsion film exceeded these indicators in terms of water and media resistance, showing excellent water and media resistance.

4. Conclusions

This paper demonstrated a method to improve the poor stability and short storage period of waterborne epoxy–acrylic emulsions prepared by self-emulsification. To improve the properties of the cured coating films, a two-step method was used to make high-molecular-weight epoxy resins with different molecular weights. Theoretically, we can use this method to prepare epoxy resins of any molecular weight. Then, the high-molecular-weight epoxy resin was grafted and polymerized with an acrylic monomer, which retained the characteristics of the epoxy groups. Finally, DMEA was used to neutralize the carboxylic acid groups, and stable waterborne epoxy acrylic emulsions were obtained by high-speed dispersion in water. In addition, the formulation process was optimized, and the effects of the process formulation on the storage stability and grafting ratio of the emulsion were discussed. The structure and emulsion properties of the grafted products were characterized and tested. The optimum conditions for the preparation of the emulsion were as follows: a grafting temperature of 120 °C, a reaction time of 5 h (2 h dropwise addition, 3 h hold), an epoxy resin dosage of 18% of the total formulation, an MAA dosage of 3%, an initiator BPO dosage of 8% of the total monomer content, a neutralization degree of 80%, and a neutralization temperature of 50 °C. The experimental results showed that the emulsion remained stable for more than 1 year, and the dilution stability, mechanical stability, and freeze–thaw stability were excellent. The alkali stability was good, and the emulsion remained stable at pH 11. The acid stability was poor, and the emulsion was broken when acetic acid was added in a slightly excessive amount. The emulsion was coated on the test plate, and the film performance was tested after curing. The film performance was compared with that of commercially available solvent-based epoxy resin coatings and found to meet or exceed the technical specifications of commercially available epoxy coatings in terms of hardness, adhesion, flexibility, and media resistance. In general, waterborne epoxy–acrylic emulsions with an excellent overall performance were obtained, which lays the foundation for their application in waterborne epoxy–acrylic acid anti-corrosion paints.

Author Contributions

Conceptualization, J.L. and Y.Z.; methodology, J.L. and Y.Z.; validation, J.L. and J.S.; formal analysis, J.L.; investigation, J.S.; resources, Y.Z.; data curation, J.L.; writing—original draft preparation, J.L.; writing—review and editing, J.L., Y.Z. and J.S.; visualization, J.S.; supervision, Y.Z.; All authors have read and agreed to the published version of the manuscript.

Funding

This research received no external funding.

Institutional Review Board Statement

Not applicable.

Informed Consent Statement

Not applicable.

Data Availability Statement

The data presented in this study are available on request from the corresponding author.

Conflicts of Interest

The authors declare no conflict of interest.

References

  1. Gündüz, G.; Khalid, A.H.; Mecidoğlu, I.A.; Aras, L. Water-Borne and Air-Drying Oil-Based Resins. Prog. Org. Coat. 2004, 49, 259–269. [Google Scholar] [CrossRef]
  2. Yu, J.; Pan, H.; Zhou, X. Preparation of Waterborne Phosphated Acrylate–Epoxy Hybrid Dispersions and Their Application as Coil Coating Primer. J. Coat. Technol. Res. 2014, 11, 361–369. [Google Scholar] [CrossRef]
  3. Gao, J.; Zhu, F.L.; Yang, J.; Liu, X. Synthesis and Curing Kinetics of UV-Curable Waterborne Bisphenol-S Epoxy-Acrylate/Polyurethane-Acrylate/Methylacryloylpropyl-POSS Nanocomposites. J. Macromol. Sci. Part B 2014, 53, 1800–1813. [Google Scholar] [CrossRef]
  4. Zhaoying, Z.; Yuhui, H.; Bing, L.; Guangming, C. Studies on Particle Size of Waterborne Emulsions Derived from Epoxy Resin. Eur. Polym. J. 2001, 37, 1207–1211. [Google Scholar] [CrossRef]
  5. Shikha, D.; Kamani, P.K.; Shukla, M.C. Studies on Synthesis of Water-Borne Epoxy Ester Based on RBO Fatty Acids. Prog. Org. Coat. 2003, 47, 87–94. [Google Scholar] [CrossRef]
  6. Schauer, E.; Berglund, L.; PenÄa, G.; Marieta, C.; Mondragon, I. Morphological Variations in PMMA-Modified Epoxy Mixtures by PEO Addition. Polymer 2002, 43, 1241–1248. [Google Scholar] [CrossRef]
  7. Khurana, P.; Aggarwal, S.; Narula, A.; Choudhary, V. Curing and Thermal Behavior of Epoxy Resin in the Presence of Silicon-Containing Amide Amines. J. Appl. Polym. Sci. 2003, 87, 1345–1353. [Google Scholar] [CrossRef]
  8. Ma, C.; Deng, C.; Zheng, W. Waterborne Epoxy Resin Modified by AMPS. J. Wuhan Univ. Technol.-Mat. Sci. Edit. 2007, 22, 649–652. [Google Scholar] [CrossRef]
  9. Choudhary, V.; Agarwal, N.; Varma, I.K. Evaluation of Bisacrylate Terminated Epoxy Resins as Coatings. Prog. Org. Coat. 2006, 57, 223–228. [Google Scholar] [CrossRef]
  10. Tong, L.; Akay, G. Process Intensification in Particle Technology: Flow Induced Phase Inversion in the Intensive Emulsification of Epoxy Polymer Melts in Water. J. Mater. Sci. 2002, 37, 4985–4992. [Google Scholar] [CrossRef]
  11. Wuzella, G.; Kandelbauer, A.; Mahendran, A.R.; Müller, U.; Teischinger, A. Influence of Thermo-Analytical and Rheological Properties of an Epoxy Powder Coating Resin on the Quality of Coatings on Medium Density Fibreboards (MDF) Using in-Mould Technology. Prog. Org. Coat. 2014, 77, 1539–1546. [Google Scholar] [CrossRef]
  12. Triwulandari, E.; Ghozali, M.; Meliana, Y. Synthesis of 1, 4-Butanediol Monooleate and 1, 4-Butanediol, 9-Hydroxy-10-Methoxy-Monostearate from Palm Oil as Modifier of Epoxy Resin for Coating. Procedia Chem. 2015, 16, 495–502. [Google Scholar] [CrossRef] [Green Version]
  13. Chiang, T.H.; Hsieh, T.E. A Study of UV-Curable Epoxide Resins Containing Thermal Accelerator—Tertiary Amines. React. Funct. Polym. 2008, 68, 601–612. [Google Scholar] [CrossRef]
  14. Liu, H.; Chen, M.; Huang, Z.; Xu, K.; Zhang, X. The Influence of Silicon-Containing Acrylate as Active Diluent on the Properties of UV-Cured Epoxydiacrylate Films. Eur. Polym. J. 2004, 40, 609–613. [Google Scholar] [CrossRef]
  15. Wang, Y.; Chen, Z.; Yu, F. Preparation of Epoxy-Acrylic Latex Based on Bisphenol F Epoxy Resin. J. Macromol. Sci. Part A 2018, 55, 205–212. [Google Scholar] [CrossRef]
  16. Petit, H.; Henry, N.; Krebs, A.; Uytterhoeven, G.; Jong, F. Ambient Cure High Solids Acrylic Resins for Automotive Refinish Clear Coat Applications. Prog. Org. Coat. 2001, 43, 41–49. [Google Scholar] [CrossRef]
  17. Khallaf, M.K.; El-Midany, A.A.; El-Mofty, S.E. Influence of Acrylic Coatings on the Interfacial, Physical, and Mechanical Properties of Stone-Based Monuments. Prog. Org. Coat. 2011, 72, 592–598. [Google Scholar] [CrossRef]
  18. Jiao, C.; Sun, L.; Shao, Q.; Song, J.; Hu, Q.; Naik, N.; Guo, Z. Advances in Waterborne Acrylic Resins: Synthesis Principle, Modification Strategies, and Their Applications. ACS Omega 2021, 6, 2443–2449. [Google Scholar] [CrossRef]
  19. Zou, M.; Zhao, Q.; Nie, J.; Zhang, Z. Preparation and Characterization of Polysiloxane–Polyacrylates Composite Lattices by Two Seeded Emulsion Polymerization and Their Film Properties. J. Appl. Polym. Sci. 2007, 103, 1406–1411. [Google Scholar] [CrossRef]
  20. Zou, M.; Huang, F.; Nie, J.; Zhang, Z.; Ge, X. Preparation and Characterization of Polysiloxane-Polyacrylates Composite Latices and Their Film Properties. Polym. Int. 2005, 54, 861–869. [Google Scholar] [CrossRef]
  21. Brady, R.F., Jr. Properties Which Infuence Marine Fouling Resistance in Polymers Containing Silicon and Fuorine. Prog. Org. Coat. 1999, 35, 31–35. [Google Scholar] [CrossRef]
  22. Galliano, F.; Landolt, D. Evaluation of Corrosion Protection Properties of Additives for Waterborne Epoxy Coatings on Steel. Prog. Org. Coat. 2002, 44, 217–225. [Google Scholar] [CrossRef]
  23. Woo, J.T.K.; Toman, A. Water-Based Epoxy-Acrylic Graft Copolymer. Prog. Org. Coat. 1993, 21, 371–385. [Google Scholar] [CrossRef]
  24. Zhang, K.; Chen, X.; Xiao, Y.; Liu, R.; Liu, J. Enhanced Anticorrosion Properties through Structured Particle Design of Waterborne Epoxy-Styrene-Acrylate Composite Emulsion. Coatings 2021, 11, 1422. [Google Scholar] [CrossRef]
  25. Hamouda, I.M.; Ahmed, S.A. Effect of Microwave Disinfection on Mechanical Properties of Denture Base Acrylic Resin. J. Mech. Behav. Biomed. Mater. 2010, 3, 480–487. [Google Scholar] [CrossRef]
  26. Guo, W.L.; Jin, Z.M.; Gao, C.H. Study on Formulation for Epoxy Acrylic Hybrid Emulsion. Adv. Mat. Res. 2012, 524, 1715–1718. [Google Scholar] [CrossRef]
  27. Kawahara, H.; Goto, T.; Ohnishi, K.; Ogura, H.; Kage, H.; Matsuno, Y. Preparation of Epoxy Resin/Acrylic Composite Latexes by Miniemulsion Polymerization Method. J. Appl. Polym. Sci. 2001, 81, 128–133. [Google Scholar] [CrossRef]
  28. Aggarwal, L.K.; Thapliyal, P.C.; Karade, S.R. Anticorrosive Properties of the Epoxy–Cardanol Resin Based Paints. Prog. Org. Coat. 2007, 59, 76–80. [Google Scholar] [CrossRef]
  29. Liu, M.; Mao, X.; Zhu, H.; Lin, A.; Wang, D. Water and Corrosion Resistance of Epoxy–Acrylic–Amine Waterborne Coatings: Effects of Resin Molecular Weight, Polar Group and Hydrophobic Segment. Corros. Sci. 2013, 75, 106–113. [Google Scholar] [CrossRef]
  30. Woo, J.T.; Ting, V.; Evans, J.; Ortiz, C.; Carlson, G.; Marcinko, R. Water Dispersible Epoxy-g-Acrylic Copolymer for Container Coating; Bauer, R.S., Ed.; ACS Symposium Series; American Chemical Society: Washington, DC, USA, 1983; Volume 221, pp. 283–300. ISBN 978-0-8412-0777-6. [Google Scholar]
  31. Zafar, S.; Riaz, U.; Ahmad, S. Water-Borne Melamine–Formaldehyde-Cured Epoxy–Acrylate Corrosion Resistant Coatings. J. Appl. Polym. Sci. 2008, 107, 215–222. [Google Scholar] [CrossRef]
  32. Zhang, K.; Fu, H.; Huang, H.; Chen, H. Waterborne Epoxy—Acrylic Dispersions Modified by Siloxane. J. Dispers. Sci. Technol. 2007, 28, 1209–1217. [Google Scholar] [CrossRef]
  33. Guo, W.L.; Zhou, H.C.; Lu, H.Q.; Hu, W. Preparation and Characterization of Fluorinated Epoxy Resin Emulsion for Waterborne Coatings. AMR 2011, 347, 4065–4068. [Google Scholar] [CrossRef]
  34. Sun, S.; Sun, P.; Liu, D. The Study of Esterifying Reaction between Epoxy Resins and Carboxyl Acrylic Polymers in the Presence of Tertiary Amine. Eur. Polym. J. 2005, 41, 913–922. [Google Scholar] [CrossRef]
  35. Feng, Z.; Yang, G.; Rong, M.; Ou, H.; Fu, R. Synthesis and characterization of solid bisphenol A type epoxy resins. Thermosetting Resin. 2010, 6, 33–36. [Google Scholar] [CrossRef]
  36. Wu, Z.; Li, S.; Lu, J. Improved method for determining epoxy value. J. Wuhan Inst. Chem. Tech. 2006, 1, 5–7. (In Chinese) [Google Scholar]
  37. Deng, A.; Dang, J.; Mu, R. Study on epoxy resin graft modified by acrylic acid. Chem. Adhesion. 2013, 1, 22–25. (In Chinese) [Google Scholar]
Figure 1. Schematic diagram of the synthesis of the high−molecular−weight epoxy resin.
Coatings 13 00595 g001
Figure 2. Schematic diagram of epoxy–acrylic acid graft copolymerization reaction.
Coatings 13 00595 g002
Figure 3. Schematic diagram of the experimental setup.
Coatings 13 00595 g003
Figure 4. Schematic structure of benzyl triphenyl phosphine bromide.
Coatings 13 00595 g004
Figure 5. (A) Epoxy resin gel permeation chromatogram; (B) effect of different catalyst amounts on epoxy equivalents; (C) relationship between reaction temperature and reaction time.
Coatings 13 00595 g005
Figure 6. Effect of different temperatures on the grafting ratio.
Coatings 13 00595 g006
Figure 7. Effect of different initiator dosages on the grafting ratio.
Coatings 13 00595 g007
Figure 8. FTIR spectra of epoxy resin and graft copolymer: (A) 4000−500 cm−1 and (B) 2000−500 cm−1.
Coatings 13 00595 g008
Figure 9. DSC curve of the epoxy resin and graft copolymer.
Coatings 13 00595 g009
Figure 10. TGA curves of epoxy resin and graft copolymer.
Coatings 13 00595 g010
Figure 11. (A) Emulsion particle size distribution and (B) zeta potential distribution.
Coatings 13 00595 g011
Figure 12. TEM images of emulsion particles: (A) scale bar: 500 nm; (B) scale bar: 200 nm; (C) scale bar: 100 nm.
Coatings 13 00595 g012
Table 1. Formulations for the preparation of emulsions.
FormulationRaw MaterialsMass/g
1Epoxy resin48
2Ethylene glycol monobutyl ether15
3n-Butanol20
4MAA8
5ST6
6BA6
7BPO1.6
8n-Butanol3.8
9DMEA6.4
10Ethylene glycol monobutyl ether3.7
11Deionized water140
Table 2. Molecular weight and distribution of epoxy resin.
NumberMnMwMzMw/MnMz/Mw
a3980550877161.3841.401
b4905668195401.3621.428
c6004828611,6831.3801.410
d7084997414,2131.4081.425
e786110,66714,8061.3571.388
Table 3. Comparison of the performance of different epoxy resin coatings.
Epoxy ResinPencil HardnessAdhesion
/Grade
Flexibility
/mm
Water
Resistance/d
Salt Water
Resistance/d
Acid
Resistance/d
Alkali
Resistance/d
a4H11>60<20<7<3
b4H11>60<20<10<5
c5H11>60>30≥10≥5
d4H11>60>30<5<3
e5H11>60>30<5<3
Table 4. Effect of different temperatures on the water dispersibility of the resin.
Grafting Temperature (°C)Resin Water DispersibilityStorage Stability
110rather poorStratification, a small amount of light yellow precipitate
120GoodStable white emulsion with a slight blue tint
130rather poorDelamination, a small amount of brown gel
140poorDelamination, adhesion appeared, reddish-brown gel
Table 5. Effect of epoxy resin dosage on coating film properties.
Epoxy Resin Dosage/%10121416182022
Pencil hardness2H2H3H4H5H4H4H
Adhesion/grade2111111
Flexibility/mm1111112
Table 6. Effect of the amount of MAA on the performance of the coating film.
MAA Dosage/%Water DispersibilityPencil HardnessAdhesion/GradeFlexibility/mm
1Poor
2Rather poor3H22
3Good5H11
4Good4H11
5Good3H22
6Good3H32
Table 7. Comparison of the performance of different types of neutralizers.
Neutralizing AgentResin Water DispersibilityEmulsion StateFilm-Forming Properties
AmmoniaPoorHigher viscosityPoor
TriethylamineGoodModerate viscosity, stable emulsionPoor
DMEAGoodModerate viscosity, stable emulsionGood
Table 8. Comparison of the performance of emulsions with different degrees of neutralization.
Degree of Neutralization (%)Particle Size (nm)Viscosity (mPa·s)Dispersion Surface ConditionStability (d)
35467.610.8Small viscosity, white, with a small amount of granularity≤30
50368.212.2Low viscosity, white≤90
65242.3141.5Low viscosity, milky white≤240
80144.5438.3Moderate viscosity, milky white≥360
951283644.8High viscosity, milky white≤180
11011913,381.6Very viscous, white-yellowish≤30
125Gel
Table 9. Effect of neutralization temperature on the water dispersibility of products.
Neutralization Temperature (°C)Water Dispersibility of Grafting Products
30Large viscosity, poor flowability, semi-solid, and difficult to disperse
40Large viscosity, poor flowability, semi-solid, and difficult to disperse
50Moderate viscosity, turned light yellow after neutralization, and white stable emulsion appeared after water dispersion
60Moderate viscosity, turned yellow after neutralization, and a small amount of granular material appeared after water dispersion
70Small viscosity, turned into a brown color after neutralization, lumpy precipitation appeared after water dispersion, and poor water solubility
80Small viscosity, turned into a brown color after neutralization, lumpy precipitation appeared after water dispersion, and poor water solubility
Table 10. Emulsion performance tests.
Test ItemsTest ResultsTest Method
Emulsion appearanceMilky white, slightly blueVisual assessment
Solid content/%29.4%Weighing method
pH7–8Precision pH test paper
Viscosity/mPa·s438.3Rotary Viscometer
Storage stability>360 daysLeave at room temperature
Dilution stabilityStable, infinitely dilutableDeionized water dilution
Mechanical stabilityNo stratification within 30 minCentrifuge at 4000 r/min
Freeze–thaw stabilityRepeat 10 times if any stable emulsion formsFrozen for 18 h, thawed at room temperature for 6 h
Alkali stabilityGood, still stable emulsion at pH 11Ammonia
Acid stabilityPoor, adding a small amount will destroy the emulsion stateAcetic acid
Table 11. Comparison of coating film performance of two products.
Test ItemsCoating Film Properties of Homemade EmulsionsTechnical Specifications of IPN8710
Pencil hardness5H2H
Adhesion/grade12
Flexibility/mm11
Salt water resistance (5%NaCl)/d303
Acid resistance (5%H2SO4)/d103
Alkali resistance (5%KOH)/d53
Disclaimer/Publisher’s Note: The statements, opinions and data contained in all publications are solely those of the individual author(s) and contributor(s) and not of MDPI and/or the editor(s). MDPI and/or the editor(s) disclaim responsibility for any injury to people or property resulting from any ideas, methods, instructions or products referred to in the content.