Article

Long-Term In Situ Performance Evaluation of Epoxy Asphalt Concrete for Long-Span Steel Bridge Deck Pavement

School of Transportation, Southeast University, Nanjing 211189, China
*
Author to whom correspondence should be addressed.
These authors contributed equally to this work.
Coatings 2023, 13(3), 545; https://doi.org/10.3390/coatings13030545
Submission received: 9 February 2023 / Revised: 28 February 2023 / Accepted: 28 February 2023 / Published: 2 March 2023
(This article belongs to the Special Issue Surface Engineering and Mechanical Properties of Building Materials)

Abstract

:
Suitable evaluation of distress is beneficial to understanding the in situ performance of deck pavement. This study attempts to evaluate the long-term in situ performance of American ChemCo epoxy asphalt concrete on the Xihoumen Bridge (XHMB) after 12 years of service. The traditional performance indexes were adopted to reveal the performance of XHMB. Then, based on the typical distresses, a new pavement performance index (PPI) was proposed to characterize the authentic distress condition. Finally, the performance evaluation and evolution were conducted. According to the results, the rutting depth indexes and riding quality indexes of all lanes are higher than 97 and 94, respectively. The pavement condition indexes of the pass lanes and drive lanes in 2021 are greater than 94 and 86, respectively, which is contradictory to the distribution of numerous distresses on the pavement. According to the PPI results, the PPIs of the down direction pass lane are mostly 100. However, for the down direction drive lane, the PPIs of about 30% of segments are below 80 or 60. Finally, based on the limited data, the distress of American ChemCo epoxy asphalt concrete may initiate after serving for 4–5 years and then escalate after about 10 years.

1. Introduction

Bridges are designed to traverse an obstacle to connect the separated two sides [1]. The design and selection of the bridge type may be influenced by many factors. Particularly for an urban area, the bridge should be constructed as an attractive and user-friendly structure [1,2]. For a highway bridge, these functions may be limited and an orthotropic steel bridge deck (OSBD) is extensively utilized to communicate two separate terminals with a considerable distance. Compared with traditional concrete bridges, OSBD prevails because of its lightweight, superb structural strength, and long service life [3]. Additionally, the OSBD segments could be prefabricated, which is capable to shorten the construction period and equips the construction process with great flexibility. To isolate the steel deck surface from environmental corrosion and provide vehicles with a flat and skid-resistance layer, multilayered pavement structures are constructed on the steel deck.
The OSBD pavement system typically consists of the anticorrosion primer, the waterproof tack coat, and the surfacing layer from the bottom to the top [4]. The anticorrosion primer and the waterproof tack coat layer are designed to protect the steel deck from rusting and therefore prolong the service life of the infrastructure [5]. Additionally, the waterproof tack coat also functions to integrate the steel deck with the surfacing layer [6,7]. The surfacing layer is capable to carry, transfer, and distribute the vehicle loads from the pavement surface to the steel deck [8]. Differing from the traditional asphalt pavement, the OSBD pavement typically faces a more rigorous service environment, including complex stress conditions and wider service temperature ranges [3,9]. Considering the harsh field conditions, higher requirements are put forward for the mechanical performance of OSBD pavement.
Previously, various bituminous materials, including the guss asphalt (GA) concrete and (stone) mastic asphalt (S)MA, have been developed and utilized as the OSBD surfacing layer [3]. Those materials could be paved alone or together to form divergent pavement systems due to their excellent waterproofness, deformation compliance, and flexibility [10,11]. However, traditional bituminous materials and their concrete may melt and therefore deform permanently at high temperatures. The existence of this temperature instability distress, including rutting, bleeding, and shoving, undoubtedly restricts the application of GA and SMA in OSBD [12,13]. In addition, bituminous concrete is prone to ravel due to the coupling effects of traffic loads and harsh environmental conditions, including moisture, freeze–thaw conditions, and bitumen age [14,15,16].
Decades ago, epoxy asphalt concrete (EAC) was invented by the Shell Petroleum Company and then utilized as the pavement material on the San Mateo–Hayward Bridge orthotropic deck [17,18]. The epoxy asphalt is typically composed of thermosetting epoxy resin and thermoplastic base asphalt with a weight ratio of 1:1. According to previous studies, the base asphalt is evenly distributed in the continuous epoxy resin in the form of spherical particles [19]. The unique encapsulated structure may be beneficial to improving the epoxy resin network flexibility [20]. In 2000, EAC was first used in China on the Nanjing Second Yangtze River Bridge to release the severe distress of bituminous concrete [18,21]. In the following several years, EAC has prevailed as the OSBD surfacing material due to its outstanding high-temperature stability, mechanical strength, moisture damage resistance, and deformation compliance [20,22,23].
However, EAC is not problem-free. Premature failure may arise from inexperienced construction, improper temperature control, and inappropriate materials ratio [7]. Apart from this abnormal distress, fatigue cracks may occur on the pavement surface and then propagate into block cracks as a result of repeated vehicle loading [10]. The existence of distresses compromises the serviceability, including the flatness, skid resistance, and durability, of the OSBD surfacing pavement. To end this dilemma, scholars attempt to evaluate the performance of surfacing materials through laboratory tests and consequently forecast the in situ distress [24,25]. Nonetheless, the loading and constraint conditions in laboratory tests even for the full-scale test may differ from the actual situation in the field [26,27]. The laboratory test could characterize the mechanical properties of materials but could rarely capture the authentic response of those materials in the field.
The distress survey of OSBD pavement has also been conducted to clarify the evolution of typical distresses [12,28,29]. Unfortunately, these distress surveys usually cover a relatively short period and are consequently unable to convey the comprehensive evolution of pavement distresses. In addition, the distress survey may simply record the number, size, and severity of distresses and could hardly manifest the quantitative performance of OSBD pavement [21]. By contrast, in road asphalt pavement engineering, appropriate performance indexes were put forward to quantitatively characterize the service performance of pavement [30,31,32], which is beneficial to guiding the maintenance of pavement with severe distress [33,34,35]. However, the performance indexes adopted in road pavement engineering may not accommodate OSBD pavement due to the huge difference between steel bridges and roads.
To fill this gap, the in situ condition and performance evolution of Xihoumen Bridge (XHMB) deck pavement over twelve years are evaluated in this study. Specifically, based on the annual performance detection, the pavement performance of XHMB is evaluated using the traditional performance evaluation indexes, which were originally used in the road pavement field. Then, the applicability of the indexes to revealing the performance of OSBD pavement is analyzed. Afterward, a new pavement condition index (PPI) is proposed to characterize the authentic pavement condition. Finally, based on the PPI, the performance evaluation and partition of XHMB pavement are conducted. The organization of this study is illustrated in Figure 1.

2. Study Area

2.1. Location and Design Parameters

XHMB is a double-tower, double-cable unsymmetrical steel box girder suspension bridge, located in Zhejiang Province. The geographical location diagram and external view are shown in Figure 2a,b. XHMB is designed with a main span of 1650 m and was the first separate double steel box girder suspension bridge in the world. The detailed parameters of the bridge are listed in Table 1. Based on the field performance of several typical pavement systems constructed at home and abroad, the XHMB deck is paved with double-layered American ChemCo epoxy asphalt concrete with a thickness of 55 mm (30 mm upper layer + 25 mm bottom layer), as illustrated in Figure 2c.

2.2. Climate

XHMB is located in a sea area frequently affected by typhoons. The hydrologic, geological, and climatic conditions of XHMB are complex. The region where XHMB is located belongs to the subtropical monsoon climate region, which is typically characterized by high temperatures and rainy in summer and low temperatures and dry in winter. According to local meteorological data, the annual average temperature is about 18 °C. The historical extreme maximum temperature is 34 °C, and the extreme minimum temperature is −5 °C. The average annual number of rainy days is as high as 200 days and the average annual precipitation is as high as 1800 mm. Detailed climatic data are provided in Figure 3. The severe environmental conditions put forward the strict requirements for the performance of OSBD surfacing materials.

2.3. Traffic Volume

The XHMB was opened to traffic in 2009 and has undertaken heavy transit traffic volume since then. According to existing studies [6,36], fatigue cracking of the OSBD surfacing layer is mainly attributed to the repeated shear and tensile stresses induced by vehicles. Therefore, the traffic data of XHMB from 2010 to 2020 were collected and analyzed. The results are shown in Figure 4a. In this study, the direction from Ningbo to Zhoushan is denoted as the up direction and the direction from Zhoushan to Ningbo is denoted as the down direction. The direction and lane distribution of traffic was also studied and is presented in Figure 4b.
According to Figure 4a, since 2010, the annual average daily traffic (AADT) demonstrates a significant increasing trend, from 8727 in 2010 to 21745 in 2020. The annual average traffic growth is about 15%. In addition, the traffic growth rates year by year were also calculated, as shown in Figure 4. The traffic growth rates approximately range from 4% to 12% except for the growth rate in 2011 and 2020. Based on the traffic growth tendency, the traffic volume of XHMB may continuously rise in the coming years. As shown in Figure 4b, the traffic volume in the up direction is slightly higher than that in the down direction. By contrast, the traffic volume of the pass lane is significantly higher than that of the drive lane regardless of the direction. The lane distribution of traffic may ascribe to the driving habits of vehicles with different loads. Typically, vehicles with heavy loads prefer to drive in the drive lane at a relatively low speed, while vehicles with light loads usually drive on the pass lane at a high speed.

3. Performance Evaluation of XHMB Pavement

Currently, considering the lack of corresponding OSBD pavement evaluation specifications, the assessment methodology of road pavement performance was extensively utilized to reveal the OSBD pavement conditions by bridge maintenance companies. In this study, the evaluation methodology of road pavement performance was utilized to characterize the XHMB surfacing layer conditions. By comparing the evaluation indexes with the actual OSBD pavement performance, the applicability of such an evaluation scheme could be clarified.
After the XHMB was opened to traffic, an annual pavement performance inspection was conducted. The inspected performance includes rutting condition, flatness, and pavement surface condition, which are characterized by the rutting depth index (RDI), riding quality index (RQI), and pavement surface condition index (PCI), based on the Highway Performance Assessment Standards in China (JTG 5210-2018).

3.1. Rutting Depth Index (RDI)

The RDI is calculated according to Equation (1).
RDI = { 100 RD 90 3 × ( RD 10 ) 0 ( RD 10 ) ( 10 < RD 40 ) ( RD > 40 )
where RD is the rutting depth, mm.
According to the RDI value and the corresponding RD value, the rutting condition of pavement could be graded, as listed in Table 2.
The XHMB was paved with double-layered American ChemCo epoxy asphalt concrete, which is well acknowledged as a thermal-setting material. The rutting condition of XHMB pavement was recently determined in November 2020. The results are shown in Figure 5.
As illustrated in Figure 5a, the average RDs of the four lanes range from 1.67 to 2.57 mm. The RDs of drive lanes are slightly higher than that of pass lanes regardless of the driving directions. This may attribute to the loading difference between vehicles driving in the driving lane and pass lane. In addition, a mild difference in RDs between the up direction and down direction could also be observed.
To precisely characterize the RD distribution, the RDs of the four lanes were collected in 10 m units and the proportions of different RD intervals were calculated, as shown in Figure 5b. The RDs of pass lanes are all lower than 5 mm. By contrast, the RDs of a few sections in drive lanes range from 5 to 10 mm. The RD data imply that the RDIs of the XHMB all exceed 90 even for the section with relatively severe rutting distress. Finally, according to Figure 5c, the average RDIs of all four lanes are all higher than 95, which further indicates the outstanding rutting resistance of the XHMB pavement.

3.2. Riding Quality Index (RQI)

The RQI is calculated according to Equation (2).
RQI = 100 1 + 0.026 × e 0.65 × IRI
where IRI is the international roughness index, m/km.
According to the RQI value and the corresponding IRI value, the flatness of pavement could be graded, as listed in Table 3.
The rutting condition of XHMB pavement was recently detected in November 2020. The results are shown in Figure 6.
As shown in Figure 6a, the average IRIs of the four lanes ranges from 1.04 to 1.37 m/km, which indicates the good flatness of XHMB pavement. Note that the IRIs of drive lanes are a little larger than that of pass lanes for both directions. Additionally, there are some distinctions between IRIs of the up direction and down direction. Similar to the RD analysis, the IRI distribution was also studied based on the flatness data tested every 10 m. According to Figure 6b, for both directions, the IRI centered in the range (0.5, 1.5] m/km. Compared with the up direction, the IRI of down direction pavement is more to the right side of the figure, which further confirms the minor flatness of the up direction pavement. Figure 6c demonstrates the RQI of the four lanes. Consistent with the results of IRI, the average RQIs exceed 90 and concentrate around 95.
Combining the RDI and RQI results, the rutting resistance and flatness of the XHMB surfacing layer are in fairly good condition. Severe rutting distress and poor flatness were not observed. This phenomenon could be ascribed to the outstanding high-temperature stability of epoxy asphalt concrete even under strict in-service environmental conditions.

3.3. Pavement Surface Condition Index (PCI)

The PCI mainly concerns with the integrity of pavement through the visual survey. The occurrence of distresses, including map crack, longitudinal crack, transverse crack, bleeding, rutting, shoving, pothole, raveling, and patching, may decrease the PCI with diverse weighting coefficients according to the Highway Performance Assessment Standards in China (JTG 5210-2018). The PCI is determined according to Equations (3) and (4). In this study, the weighting coefficient and calculation of 21 types of distresses are not described in detail.
PCI = 100 15 × DR 0.412
DR = 100 × i = 1 21 w i × A i A
where DR is the pavement distress ratio, %; wi is the weighting coefficient of type i distress; Ai is the equivalent distress area, m2; and A is the detected pavement area, m2.
According to Equations (3) and (4), the average PCIs of the XHMB four lanes over several years were calculated and are shown in Figure 7. Note that the distress condition of XHMB was conducted by the automatic detection vehicle before 2021. Considering the identification accuracy of such a method, a detailed visual survey was carried out in June 2021 to determine the authentic distress condition of XHMB before maintenance treatment. The number, type, and severity of distresses were recorded to calculate the PCI.
According to Figure 7, with the increase in service durations, the PCI demonstrates a steadily decreased trend regardless of the driving direction and lanes except for some outliers. It should be noted that dramatic declines in PCIs are observed from 2020 to 2021. This may be attributed to the inconsistency of distress survey methods. The inspection accuracy of detection vehicles before 2021 may be lower than that of the visual survey in 2021, especially for the microcrack in XHMB pavement, as shown in Figure 8.
As shown in Figure 7, the PCIs of the two pass lanes in different directions are always higher than that of the drive lanes, which indicates the relatively severe deterioration of drive lanes and the negative impacts of heavy-duty loads on the durability of the OSBD surfacing layer. Although a continuous downward trend of PCI over years is observed, three out of the four lanes have PCIs greater than 95 for before 2021. Even for the down direction drive lane, the PCI before 2021 is still higher than 92. In addition, after the sharp decrease in PCI from 2020 to 2021, the PCIs of the pass lanes and drive lanes in 2021 are still greater than 94 and 86, respectively.
According to the PCI results, the XHMB pavement is in quite good condition and the distresses seem not apparent or severe. However, based on the latest visual survey, numerous distresses were observed on the XHMB pavement, especially on the drive lanes, as pictured in Figure 9. The spatial distribution of distresses in 2021 is drawn schematically in Figure 10.
As demonstrated in Figure 9, short cracks emerge densely on the pavement surface. The separate short cracks may join together and evolve into map cracks without effective treatment. Then, water can permeate to the bottom of the pavement system and weaken the interface bonding strength between the pavement system and steel deck plate. Finally, the weakened area turns into a pothole, and patching is conducted to rehabilitate the service performance of the pavement. Based on Figure 10, the pass lane surface condition in both directions is significantly superior to that of the drive lane in both directions, especially for the down direction pass lane. In addition, numerous transverse cracks widely distribute in the drive lanes in both directions; patching is observed mainly in the drive lane in the down direction. By contrast, the map crack mainly concentrates on the up direction drive lane and pass lane. The occurrence of distresses with such high intensity is far from the good condition of XHMB pavement indicated by the PCI index.
The inconsistency between PCI and the actual condition of XHMB pavement may be attributed to the limited distresses types in XHMB pavement. The calculation of PCI in the current standard is based on the principle of point deduction. When the distress type is relatively single, although the pavement is in a poor condition, the PCI is still very high as long as other distresses are less. In addition, the PCI is typically calculated per kilometer, which is too broad to characterize the detailed performance of OSBD pavement with a 1000–2000 m span. Hence, the OSBD pavement condition should be evaluated based on the typical distresses and reveal the performance with a relatively high resolution.

4. XHMB Pavement Condition Evaluation Based on Typical Distresses

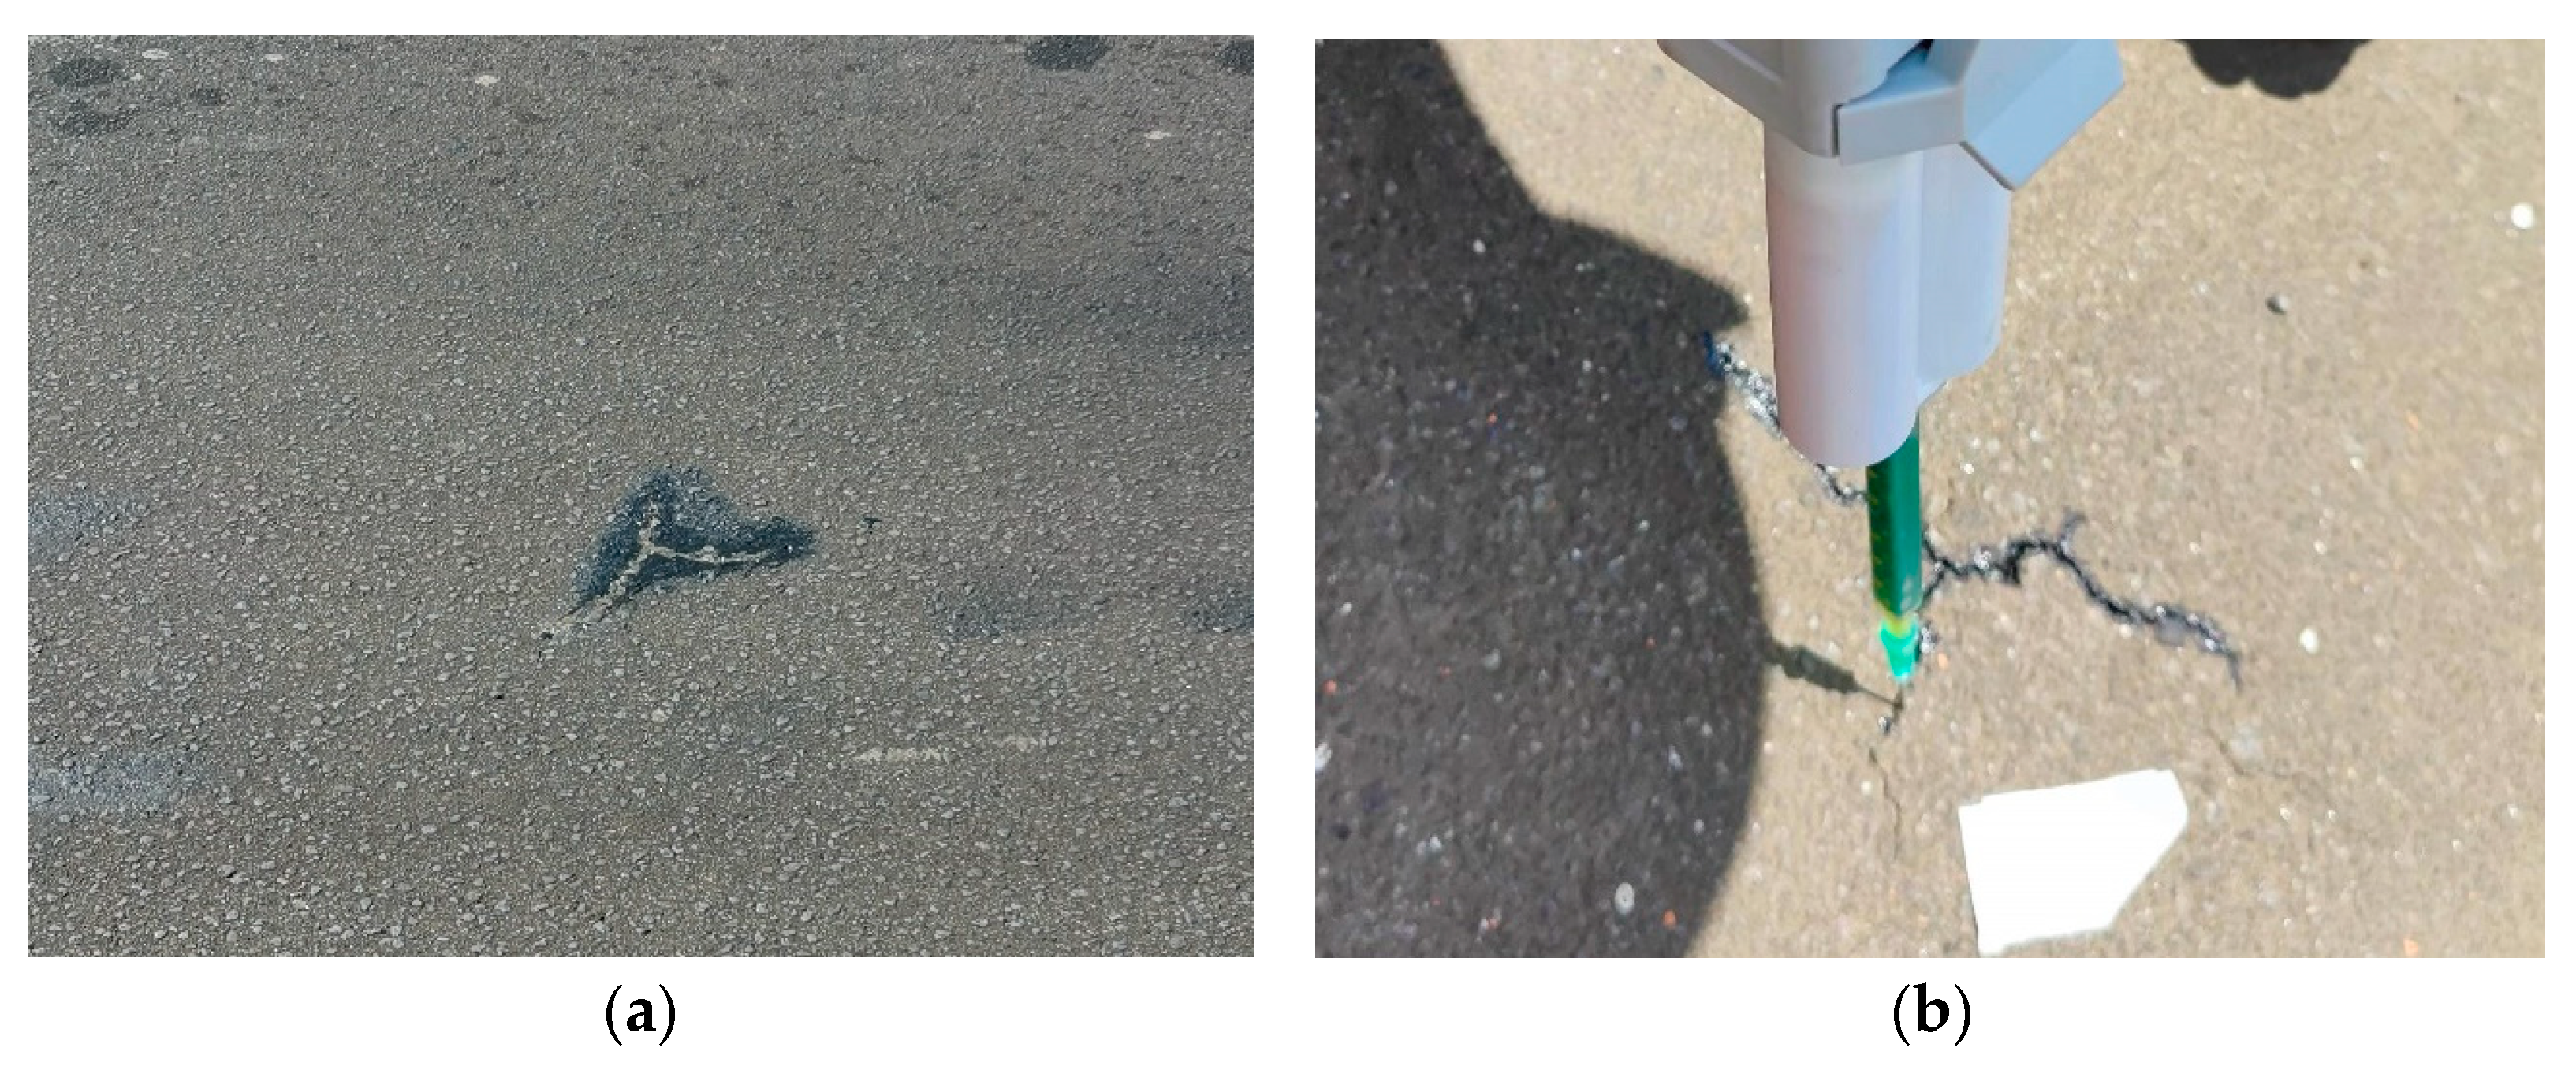
4.1. Typical Distresses of XHMB Pavement

The distresses type and number were recorded over several years and the data from 2017 to 2021 were used to determine the typical distress of XHMB pavement. The results are shown in Figure 11.
According to Figure 11, with the increase in service duration, the distresses number demonstrates a significant increase trend, especially from 2020 to 2021. Among the distresses, the cracks, including longitudinal, transverse, and chicken-feet cracks, occupy the primary part of the XHMB distresses during the 5 years that were studied, followed by patching and map crack. The raveling, rutting, and shoving distress could rarely be observed in XHMB EAC. Based on the survey results, it is concluded that the typical distress of XHMB pavement may consist of linear and areal damage. The linear deterioration includes longitudinal, transverse, (shown in Figure 9a), and chicken-feet cracks (shown in Figure 8). By contrast, the areal deterioration includes map crack, pothole, and patching (shown in Figure 9b).

4.2. Pavement Performance Index (PPI)

The previous section describes the typical distresses, which are widely divergent from the road pavement. Therefore, a pavement performance index (PPI) is proposed to authentically evaluate the pavement condition of XHMB. Similar to PCI, the PPI is still determined using the deduction system. However, the evaluated pavement length decreases from 1 km in road pavement evaluation to 10 m in OSBD pavement. Hence, the OSBD pavement is separated into several segments with a length of 10 m and width of 3.75 m. This may be beneficial for capturing the detailed condition of OSBD pavement with a considerable resolution. Additionally, the PPI is mainly determined by three parts, including crack index (CI), patching index (PI), and surface deterioration index (SDI), rather than the 21 types of distresses regulated in Highway Performance Assessment Standards in China (JTG 5210-2018). The calculation of PPI is shown in Equation (5).
PPI = 0.3 × CI + 0.3 × PI + 0.4 × SDI
where CI is the crack index; PI is the patching index; SDI is the surface deterioration index; and the numbers before CI, PI, and SDI are the weighting coefficients, which are determined by the expert scoring method.

4.2.1. Crack Index (CI)

As mentioned above, the cracks on XHMB pavement include longitudinal, transverse, and chicken-feet cracks. The CI is mainly adopted to characterize the effects of these linear cracks on the performance of XHMB pavement. As shown in Figure 9, the linear crack is short and narrow with considerable density. Therefore, both the length and the number of cracks are taken into consideration when calculating the CI. Considering the connected shape of chicken-feet cracks, the effects of chicken-feet cracks on pavement performance are multiplied by a weighting coefficient of 2.5. This means the equivalent number and length of the chicken-feet crack is 2.5 times the measured number and length. The CI is determined by interpolation based on Table 4. It should be noted that the threshold value listed in Table 4 to calculate the CI and the following PI and SDI is determined by the expert scoring method.
The CI of an evaluated area is calculated based separately on the crack length and number, and the smaller CI among the two calculations is adopted to determine the PPI.

4.2.2. Patching Index (PI)

Patching mainly refers to the rehabilitation of severe distresses, such as potholes and map cracks. However, patching can hardly renew the performance of pavement suffering from distresses. The incompatibility between the original pavement materials and patching materials may generate a weak surface. In addition, the flatness of the patched area is always unsatisfactory, which may decrease the comfortability of driving vehicles. Hence, in this study, the patching is treated as relatively severe distress. The PI is determined by interpolation based on Table 5.
Note that the patching ratio refers to the ratio of the patching area to the investigated area. As noted above, the evaluated area in this study refers to a segment with a length of 10 m and a width of 3.75 m.

4.2.3. Surface Deterioration Index (SDI)

Surface deterioration in this study mainly involves the map crack, raveling, and pothole distress. This distress is typically evolved from the longitudinal, transverse, and chicken-feet cracks. Owing to the existence of surface deteriorations, moisture may easily penetrate the interface between the concrete and the steel deck plate, which is detrimental to the durability of the steel bridge. Similar to patching distress, the surface deterioration can be categorized as areal distress and is significantly detrimental to pavement performance. However, compared with patching distress, the surface deterioration could be more harmful. Therefore, the threshold of SDI calculation is kept the same as the PI, as shown in Table 5.

4.3. XHMB Pavement Performance Evaluation Based on PPI

The PPIs of XHMB’s four lanes were calculated according to the visual survey results from 2021. The results are shown in Figure 12.
As shown in Figure 12, the XHMB pavement conditions are revealed with a high resolution compared with the PCI. According to Figure 12, the PPIs for the pass lanes in both directions are obviously higher than that of the drive lanes. Among the four lanes, the performance of down direction pass lane is significantly superior to other lanes. To be specific, the PPIs of the down direction pass lane are mostly 100, which indicate no distress is observed in this lane. Although the PPIs of a few segments are lower than 90, the lowest PPI in this lane is still larger than 70. By contrast, the drive lanes demonstrate lower PPI and worse pavement conditions, especially for the down direction drive lane. The PPIs of a larger proportion of segments are below 80 or even below 60. Concerning the up direction drive and pass lanes, although the PPIs of some segments are lower than 80, the PPIs mainly range from 90 to 100. Figure 13 is provided to better understand the PPI distribution for the four lanes.
As revealed in Figure 13, the percentages of segments with PPI above 90 in four lanes are 65.47%, 84.75%, 52.47%, and 95.07%, respectively. To be specific, the percentages of segments with a PPI above 90 for the pass lanes in both directions center around 90%, which is dramatically higher than that of drive lanes. In addition, the percentages of segments with a PPI below 80 for the pass lanes in both directions are lower than 5%. By contrast, the percentages of up direction and down direction drive lanes are about 18% and 36%, respectively. For the down direction drive lane, 12.11% of the total span shares a PPI value below 60 and may face severe distresses.
According to Figure 12 and Figure 13, most segments of the XHMB pavement are in good condition without the influence of distress, while there are also considerable segments suffering from serious distress, especially the segments in drive lanes. Therefore, XHMB pavement conditions are greatly divergent and varying maintenance treatments should be piecewise adopted to rehabilitate the XHMB pavement performance and prolong the service life.

4.4. Performance Partition of XHMB Pavement

Considering the dispersion of the distress distribution, maintenance treatments should be determined and then conducted in sections. Based on the PPI, the schematic performance partition of XHMB pavement in 2021 was drawn and is shown in Figure 14.
As shown in Figure 14, the performance condition of XHMB pavement in 2021 is divided into four different grades: I, II, III, and IV, among which the I grade refers to the best performance. Generally speaking, the PPIs of considerable segments in the up and down direction drive lanes fall between 60 and 80. Hence, the drive lanes are categorized as type III and type IV. By contrast, the pass lanes are mainly divided into type II and type III. It should be noted that no distress was reported in the middle of the down direction pass lane. Therefore, the distress-free section is categorized as type I.
According to the performance partition of XHMB pavement, suitable maintenance measures could be adopted to enhance the pavement conditions. Pavements with different performance grades should be treated with varying maintenance programs. For type I pavement, a functional thin overlay could be utilized to improve the skid resistance and mitigate the degradation effects of environmental factors on the pavement materials. For type II pavement, sectional maintenance is necessary to prevent the deterioration of existing distress. For type III pavement and type II pavement with intensive distress, to make full use of the residual value of the bottom concrete, the upper layer should be milled and refilled with fresh concrete. Finally, concerning type IV pavement, to prevent the corrosion of steel deck plate, the pavement system should be milled and repaved.

4.5. Performance Evolution of XHMB Pavement

There are limited reports of tracking surveys for OSBD pavement conditions in China, especially for American ChemCo epoxy asphalt concrete deck pavement. To understand the in situ performance of American ChemCo epoxy asphalt concrete and long-spanned suspension bridge deck pavement, the performance variation for XHMB pavement was evaluated based on the PPI and distress parameters. The distress variation for XHMB pavement is shown in Figure 15a.
According to Figure 15a, the distress first appeared in 2014 after the XHMB was opened to traffic for 5 years. A similar phenomenon was also observed in other OSBD pavements in Zhoushan cross-sea bridge clusters, such as the Jintang Bridge (JTB) and Taoyaomen Bridge (TYMB). Variation in the JTB distress number is shown in Figure 15b. TYMB and JTB were opened to traffic in 2006 and 2009 and were originally paved with the same materials as XHMB. The TYMB and JTB are twin-tower, cable-stayed bridges with a total span of 888 and 1210 m, respectively. The TYMB and JTB share the same traffic loading and environmental conditions as XHMB. The distress occurred in the TYMB and JTB first after the two bridges were opened to traffic for 4 and 5 years. According to the limited data, the distress of American ChemCo epoxy asphalt concrete may initiate after the concrete served for 4–5 years, regardless of the bridge structures.
As shown in Figure 15a,b, from 2014 to 2018, the distress number demonstrates a steady upward trend for both XHMB and JTB. Then, an obvious increase in distress numbers could be observed both in XHMB and JTB from 2018 to 2019. Furthermore, after 2019, the distress number continued to rise exponentially. This phenomenon may indicate that after the American ChemCo epoxy asphalt concrete was opened to traffic for about 10 years, the distress shows an outbreak trend. At this point, necessary structural maintenance is needed to rehabilitate the pavement performance.

5. Conclusions

This study aims to evaluate the long-term in situ performance of XHMB pavement. The traditional performance evaluation indexes were adopted to reveal the pavement performance of XHMB. The applicability of those indexes to revealing the performance of OSBD pavement was analyzed. On this basis, a new pavement condition index, PPI, was proposed to characterize the authentic pavement condition. In addition, the performance evaluation, partition, and variation for XHMB were conducted. The main conclusions are shown as follows.
(1)
After being opened to traffic for more than 10 years, the average RDs of XHMB pavement range from 1.67 to 2.57 mm, and the average RDIs of all four lanes are all higher than 95, which indicates the outstanding rutting resistance of the XHMB pavement.
(2)
Similar to the rutting condition, the roughness of XHMB pavement is in good condition. In 2020, the average IRIs range from 1.04 to 1.37 m/km and the average RQIs of the four lanes concentrate around 95.
(3)
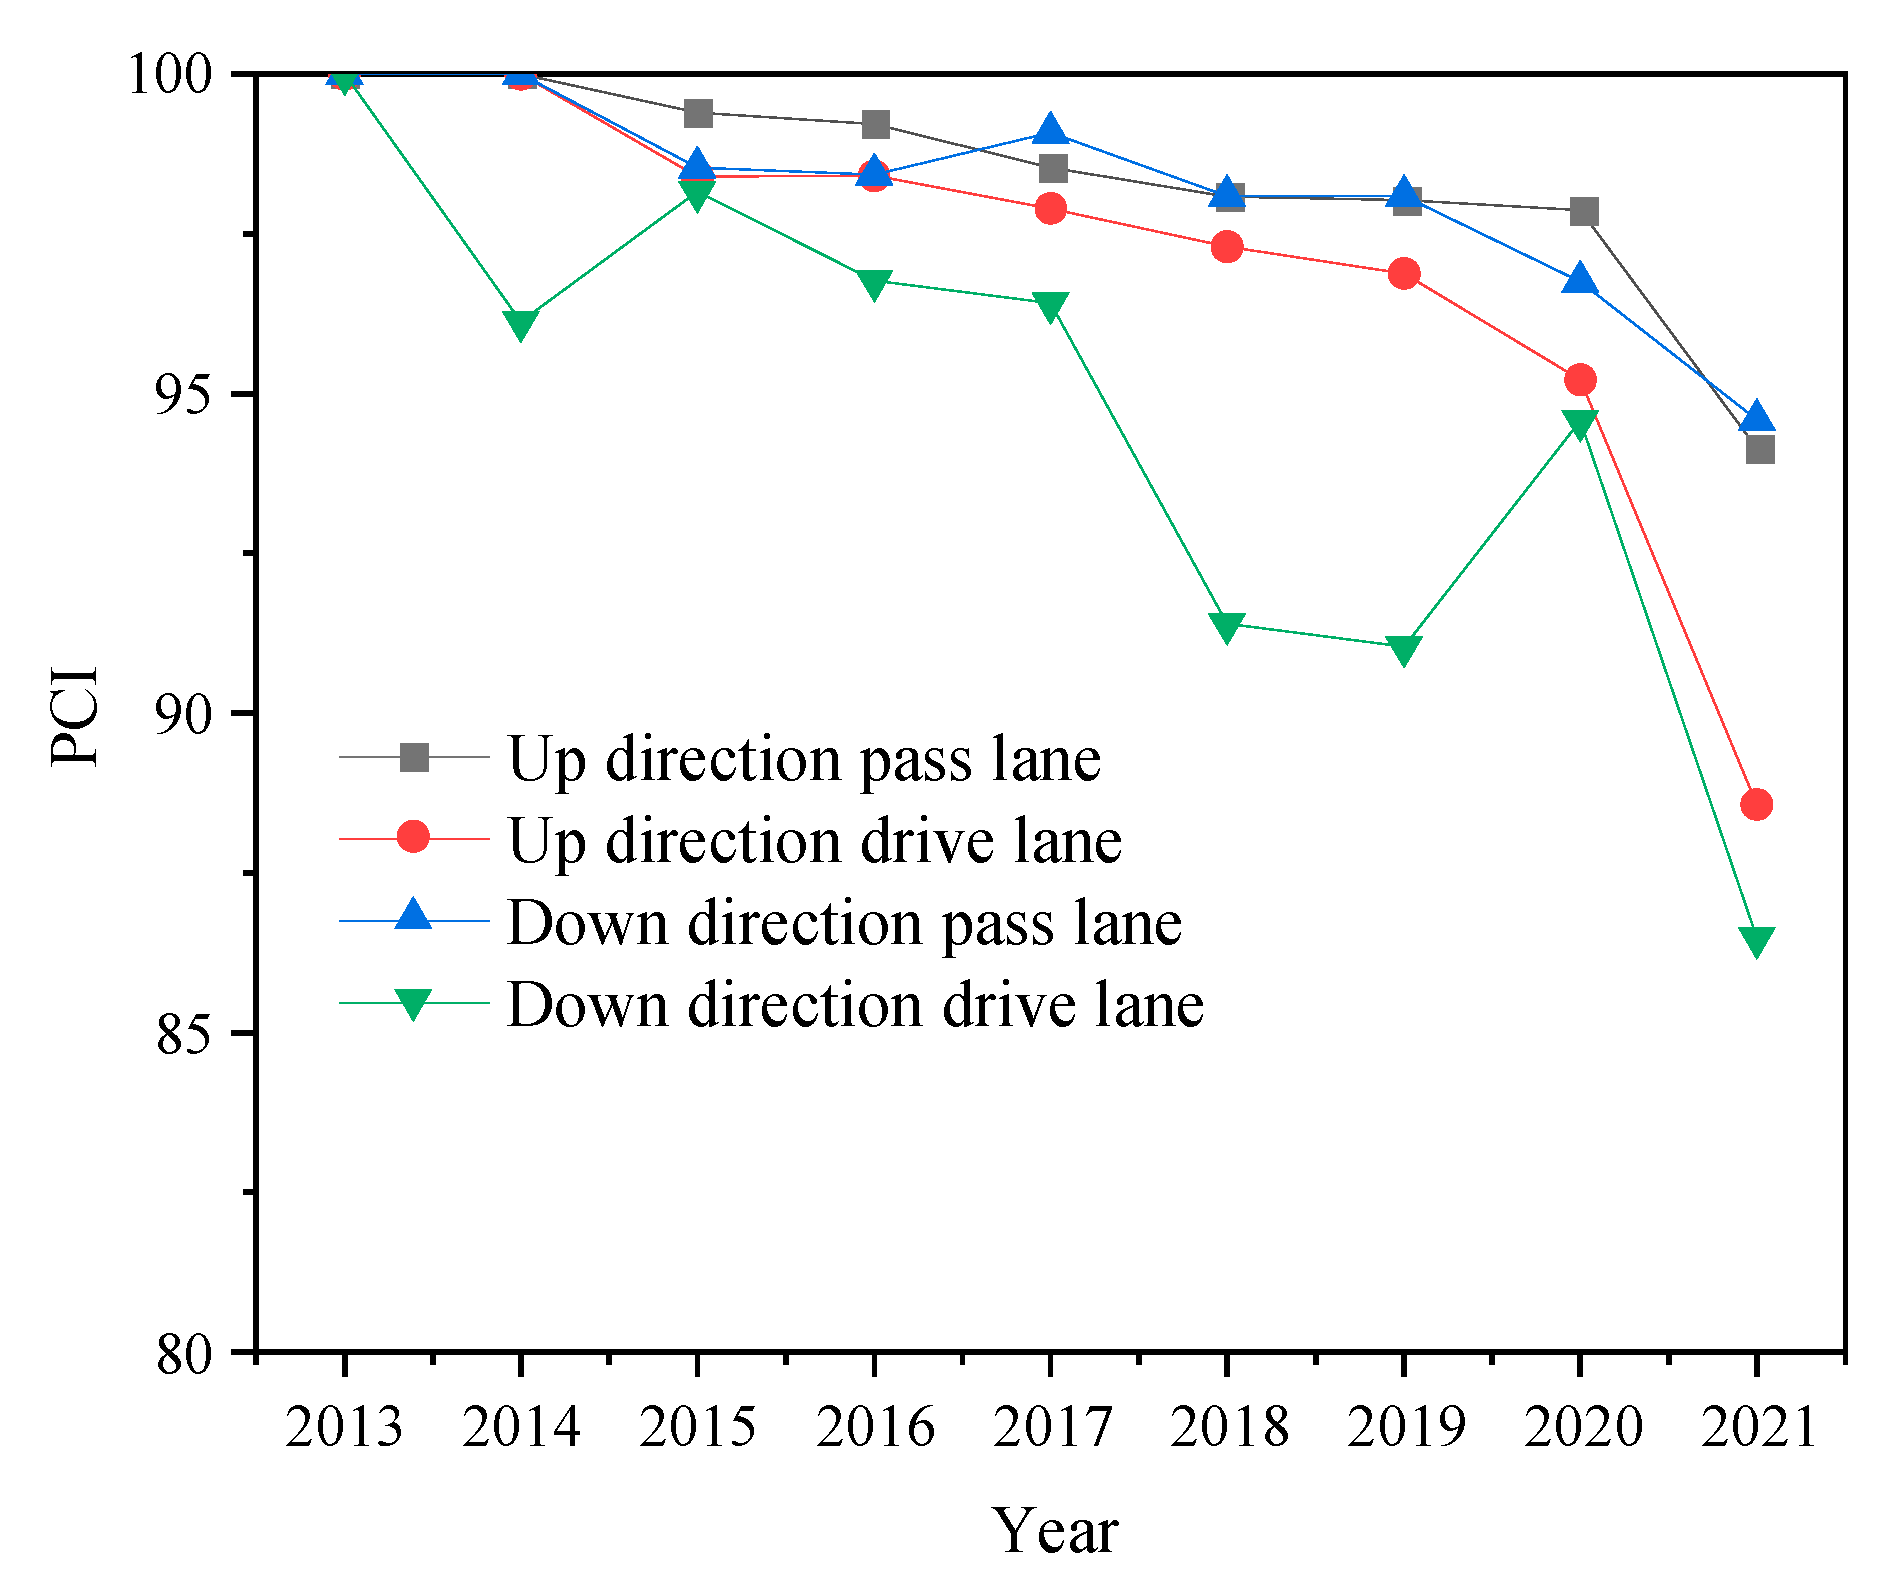
The PCIs of the pass lanes and drive lanes in 2021 are greater than 94 and 86, respectively, which may imply favorable surface conditions and structural integrity of XHMB pavement. However, numerous distresses, including cracks, patching, and map cracking, widely distribute on the XHMB pavement with a close interval, which is far from the good surface condition reflected by the PCI. Hence, the PCI can hardly characterize the authentic surface conditions of OSBD pavement with a high resolution.
(4)
The cracks occupy the primary part of the XHMB distresses, followed by patching and map cracking. Therefore, a pavement performance index (PPI) consisting of the crack index, patching index, and surface deterioration index, was developed.
(5)
According to the PPI results, the XHMB pavement conditions are revealed with a high resolution compared with the PCI. The performance of the pass lane is superior to the drive lane. To be specific, the PPIs of the down direction pass lane are 100 mostly. By contrast, for the down direction drive lane, the PPIs for about 30% of the segments are below 80 or even below 60.
(6)
Based on the divergent XHMB pavement conditions, the performance condition of XHMB pavement in 2021 was divided into four different grades, with varying maintenance treatments required to rehabilitate the pavement performance.
(7)
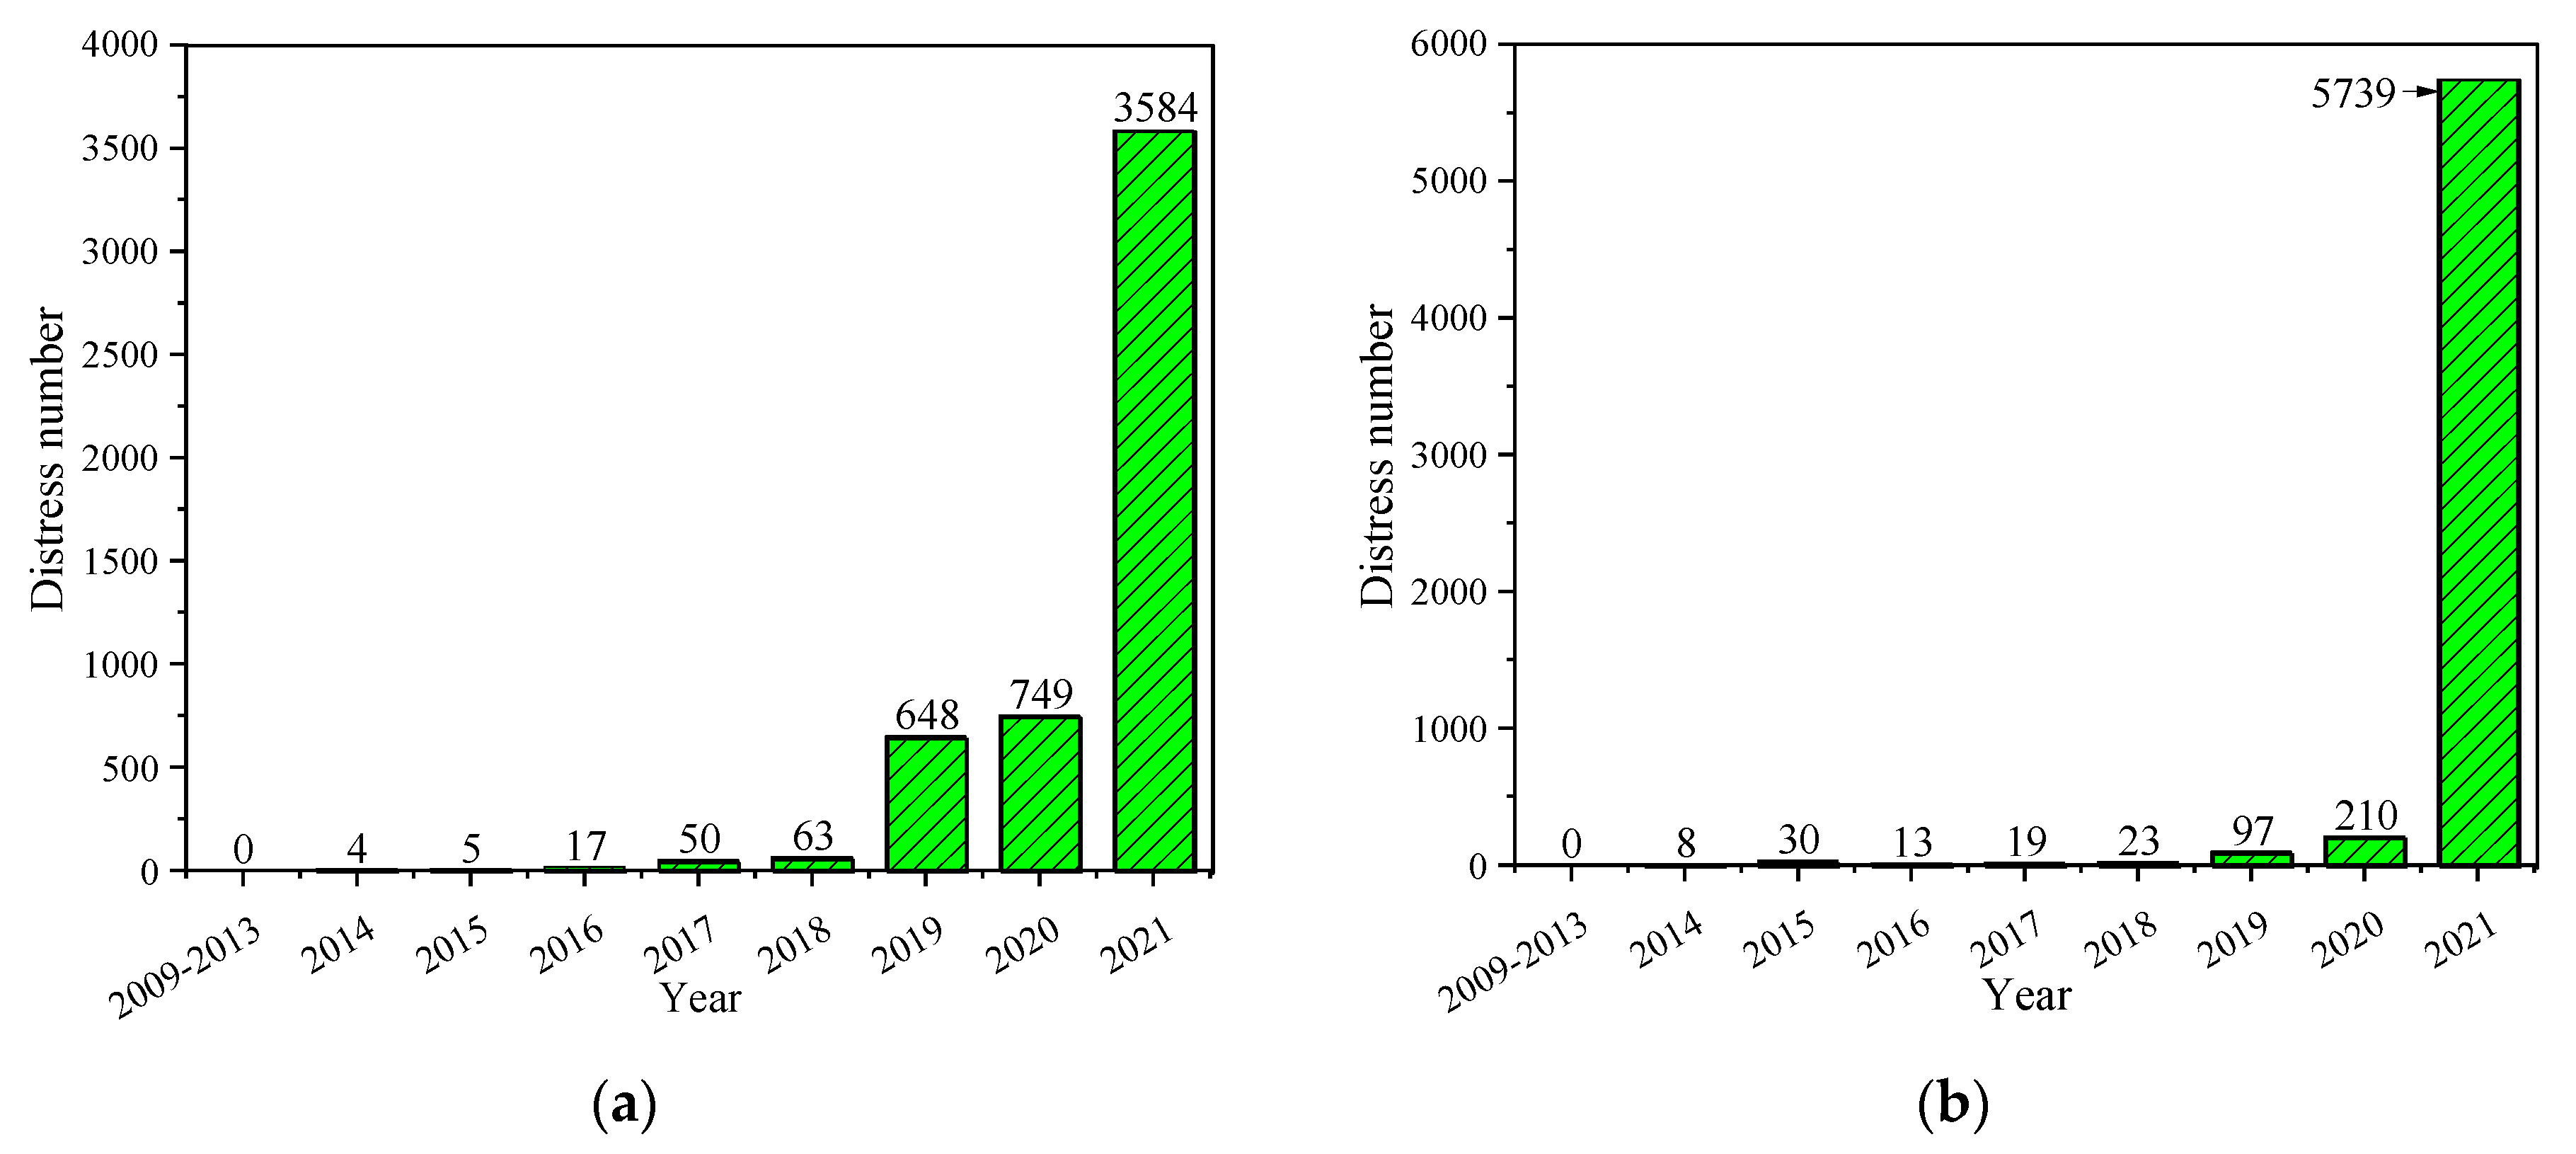
According to the distress quantity of XHMB and the adjacent JTB, the distress of American ChemCo epoxy asphalt concrete may initiate after the concrete has served for 4–5 years. After the concrete was opened to traffic for about 10 years, the distress shows an outbreak trend. At this point, necessary structural maintenance is needed to rehabilitate pavement performance.

Author Contributions

Conceptualization, F.N., Y.H. and Z.Z.; methodology, Y.H., Z.Z. and J.T.; formal analysis, Y.H., Z.Z. and J.T.; investigation, Y.H., Z.Z. and J.T.; resources, F.N.; writing—original draft preparation, Y.H. and Z.Z.; writing—review and editing, Y.H. and Z.Z.; supervision, F.N. and X.G.; funding acquisition, F.N. and X.G. All authors have read and agreed to the published version of the manuscript.

Funding

This work was supported by the National Natural Science Foundation of China (52078131), the science and technology project of Anhui Communications Holding Group Co., Ltd. (JKKJ-2019-06), and the Postgraduate Research and Practice Innovation Program of Jiangsu Province (KYCX21_0134).

Institutional Review Board Statement

Not applicable.

Informed Consent Statement

Not applicable.

Data Availability Statement

All data are included in the article.

Conflicts of Interest

The authors declare no conflict of interest.

References

  1. Salamak, M.; Fross, K. Bridges in urban planning and architectural culture. Procedia Eng. 2016, 161, 207–212. [Google Scholar] [CrossRef] [Green Version]
  2. Corticelli, R.; Pazzini, M.; Mazzoli, C.; Lantieri, C.; Ferrante, A.; Vignali, V. Urban Regeneration and Soft Mobility: The Case Study of the Rimini Canal Port in Italy. Sustainability 2022, 14, 14529. [Google Scholar] [CrossRef]
  3. Zhao, Y.; Ni, F.; Zhou, L.; Jiang, J. Performance evaluation of long-span suspension bridge pavement based on long-term maintenance data. J. Mater. Civ. Eng. 2020, 32, 04019363. [Google Scholar] [CrossRef]
  4. Jia, X.; Huang, B.; Chen, S.; Shi, D. Comparative investigation into field performance of steel bridge deck asphalt overlay systems. KSCE J. Civ. Eng. 2016, 20, 2755–2764. [Google Scholar] [CrossRef]
  5. Liu, X.; Medani, T.; Scarpas, A.; Huurman, M.; Molenaar, A. Experimental and numerical characterization of a membrane material for orthotropic steel deck bridges: Part 2. Finite Elem. Anal. Des. 2008, 44, 580–594. [Google Scholar] [CrossRef]
  6. Zhang, X. Emergency and Long-term Measures of Steel Deck Pavement Distresses at BRT Station. J. Fail. Anal. Prev. 2017, 17, 1081–1089. [Google Scholar] [CrossRef]
  7. Bocci, E.; Canestrari, F. Analysis of structural compatibility at interface between asphalt concrete pavements and orthotropic steel deck surfaces. Transp. Res. Rec. 2012, 2293, 1–7. [Google Scholar] [CrossRef]
  8. Medani, T.O. Design Principles of Surfacings on Orthotropic Steel Bridge Decks. Ph.D. Thesis, Delft University of Technology, Delft, The Netherlands, 2006. [Google Scholar]
  9. Farreras-Alcover, I.; Chryssanthopoulos, M.K.; Andersen, J.E. Data-based models for fatigue reliability of orthotropic steel bridge decks based on temperature, traffic and strain monitoring. Int. J. Fatigue 2017, 95, 104–119. [Google Scholar] [CrossRef]
  10. Chen, X.; Qian, Z.; Liu, X.; Lei, Z. State of the art of asphalt surfacings on long-spanned orthotropic steel decks in China. J. Test. Eval. 2012, 40, 1252–1259. [Google Scholar] [CrossRef] [Green Version]
  11. Han, Y.; Cui, B.; Tian, J.; Ding, J.; Ni, F.; Lu, D. Evaluating the effects of styrene-butadiene rubber (SBR) and polyphosphoric acid (PPA) on asphalt adhesion performance. Constr. Build. Mater. 2022, 321, 126028. [Google Scholar] [CrossRef]
  12. Jia, X.; Huang, B.; Bowers, B.F.; Rutherford, T.E. Investigation of tack coat failure in orthotropic steel bridge deck overlay: Survey, analysis, and evaluation. Transp. Res. Rec. 2014, 2444, 28–37. [Google Scholar] [CrossRef]
  13. Luo, S.; Lu, Q.; Qian, Z.; Wang, H.; Huang, Y. Laboratory investigation and numerical simulation of the rutting performance of double-layer surfacing structure for steel bridge decks. Constr. Build. Mater. 2017, 144, 178–187. [Google Scholar] [CrossRef]
  14. Han, Y.; Jiang, J.; Ni, F.; Dong, Q.; Zhao, X. Effect of cohesive and adhesive parameters on the moisture resistance of thin friction course (TFC) with varying mix design parameters. Constr. Build. Mater. 2020, 258, 119420. [Google Scholar] [CrossRef]
  15. Han, Y.; Jiang, J.; Ding, J.; Zhao, Z.; Ma, X.; Ni, F. Investigation of the raveling potential of thin friction course (TFC) under freeze–thaw conditions. Mater. Struct. 2021, 54, 39. [Google Scholar] [CrossRef]
  16. Han, Y.; Ding, J.; Han, D.; Zhao, Z.; Ma, X.; Ni, F. Evaluating the thermal aging-induced raveling potential of thin friction course (TFC). Constr. Build. Mater. 2022, 321, 126160. [Google Scholar] [CrossRef]
  17. Pauli, A.T.; Huang, S.-C. Relationship between asphalt compatibility, flow properties, and oxidative aging. Int. J. Pavement Res. Technol. 2013, 6, 1–7. [Google Scholar]
  18. Huang, W.; Qian, Z.; Chen, G.; Yang, J. Epoxy asphalt concrete paving on the deck of long-span steel bridges. Chin. Sci. Bull. 2003, 48, 2391–2394. [Google Scholar] [CrossRef]
  19. Tian, J.; Luo, S.; Lu, Q.; Liu, S. Effects of Epoxy Resin Content on Properties of Hot Mixing Epoxy Asphalt Binders. J. Mater. Civ. Eng. 2022, 34, 04022145. [Google Scholar] [CrossRef]
  20. Chen, C.; Eisenhut, W.O.; Lau, K.; Buss, A.; Bors, J. Performance characteristics of epoxy asphalt paving material for thin orthotropic steel plate decks. Int. J. Pavement Eng. 2020, 21, 397–407. [Google Scholar] [CrossRef]
  21. Luo, S.; Lu, Q. Condition survey and analysis of first epoxy asphalt concrete pavement on orthotropic bridges in China. A ten-year review. J. Southeast Univ. 2011, 27, 417–422. [Google Scholar]
  22. Liu, Y.; Qian, Z.; Shi, X.; Zhang, Y.; Ren, H. Developing cold-mixed epoxy resin-based ultra-thin antiskid surface layer for steel bridge deck pavement. Constr. Build. Mater. 2021, 291, 123366. [Google Scholar] [CrossRef]
  23. Zhang, Z.; Li, J.; Wang, Z.; Long, S.; Jiang, S.; Liu, G. Preparation and performance characterization of a novel high-performance epoxy resin modified reactive liquid asphalt. Constr. Build. Mater. 2020, 263, 120113. [Google Scholar] [CrossRef]
  24. Zhao, Y.; Jiang, L.; Zhou, L. Improvement of bending fatigue test for asphalt surfacing on orthotropic steel bridge deck. Adv. Civ. Eng. Mater. 2016, 5, 325–336. [Google Scholar] [CrossRef]
  25. Zhao, Y.; Jiang, J.; Ni, F.; Zhou, L. Fatigue cracking resistance of engineered cementitious composites (ecc) under working condition of orthotropic steel bridge decks pavement. Appl. Sci. 2019, 9, 3577. [Google Scholar] [CrossRef] [Green Version]
  26. Park, H.M.; Choi, J.Y.; Lee, H.J.; Hwang, E.Y. Performance evaluation of a high durability asphalt binder and a high durability asphalt mixture for bridge deck pavements. Constr. Build. Mater. 2009, 23, 219–225. [Google Scholar] [CrossRef]
  27. Kim, T.W.; Baek, J.; Lee, H.J.; Lee, S.Y. Effect of pavement design parameters on the behaviour of orthotropic steel bridge deck pavements under traffic loading. Int. J. Pavement Eng. 2014, 15, 471–482. [Google Scholar] [CrossRef]
  28. Yin, C.; Zhang, H.; Pan, Y. Cracking mechanism and repair techniques of epoxy asphalt on steel bridge deck pavement. Transp. Res. Rec. 2016, 2550, 123–130. [Google Scholar] [CrossRef]
  29. Ding, J.; Luo, S. A sixteen-year review of condition survey and analysis of steel deck pavement on Jiangyin Yangtze River Bridge. Mater. Sci. Forum 2016, 873, 91–95. [Google Scholar] [CrossRef]
  30. Dong, Q.; Chen, X.; Dong, S.; Ni, F. Data Analysis in Pavement Engineering: An Overview. IEEE Trans. Intell. Transp. Syst. 2021, 23, 22020–22039. [Google Scholar] [CrossRef]
  31. Yao, L.; Leng, Z.; Jiang, J.; Ni, F. Modelling of pavement performance evolution considering uncertainty and interpretability: A machine learning based framework. Int. J. Pavement Eng. 2022, 23, 5211–5226. [Google Scholar] [CrossRef]
  32. Li, H.; Jiang, J.; Ni, F. Factors Affecting Maintenance Probability and Resurfacing Thickness Based on the Pavement Management System. Adv. Civ. Eng. 2020, 2020, 8817081. [Google Scholar] [CrossRef]
  33. Yao, L.; Dong, Q.; Jiang, J.; Ni, F. Deep reinforcement learning for long-term pavement maintenance planning. Comput.-Aided Civ. Infrastruct. Eng. 2020, 35, 1230–1245. [Google Scholar] [CrossRef]
  34. Yao, L.; Leng, Z.; Jiang, J.; Ni, F. Large-Scale Maintenance and Rehabilitation Optimization for Multi-Lane Highway Asphalt Pavement: A Reinforcement Learning Approach. IEEE Trans. Intell. Transp. Syst. 2022, 23, 22094–22105. [Google Scholar] [CrossRef]
  35. Yao, L.; Dong, Q.; Ni, F.; Jiang, J.; Lu, X.; Du, Y. Effectiveness and cost-effectiveness evaluation of pavement treatments using life-cycle cost analysis. J. Transp. Eng. Part B Pavements 2019, 145, 04019006. [Google Scholar] [CrossRef]
  36. Hoang, V.H.; Nguyen, Q.T.; Tran, A.T.; Tran, T.C.H.; Do, T.A. Mechanical behavior of the asphalt wearing surface on an orthotropic steel bridge deck under cyclic loading. Case Stud. Constr. Mater. 2022, 16, e00836. [Google Scholar] [CrossRef]
Figure 1. Organization and methodology.
Coatings 13 00545 g001
Figure 2. Location and appearance of XHMB: (a) geographical location diagram; (b) external view; (c) pavement structure.
Coatings 13 00545 g002aCoatings 13 00545 g002b
Figure 3. Climatic information for XHMB: (a) temperature; (b) rainfall.
Coatings 13 00545 g003
Figure 4. Analysis of traffic volume: (a) variation in traffic volume; (b) direction distribution in traffic.
Coatings 13 00545 g004
Figure 5. Rutting condition of XHMB pavement: (a) average RD; (b) RD distribution; (c) average RDI.
Coatings 13 00545 g005
Figure 6. The roughness of XHMB pavement: (a) average IRI; (b) IRI distribution; (c) average RQI.
Coatings 13 00545 g006aCoatings 13 00545 g006b
Figure 7. PCI of XHMB pavement.
Coatings 13 00545 g007
Figure 8. Irregular cracks on XHMB pavement. (a) chicken-feet crack, (b) irregular crack.
Coatings 13 00545 g008
Figure 9. Typical distresses of XHMB pavement: (a) cracks; (b) pothole and patching.
Coatings 13 00545 g009
Figure 10. Spatial distribution of XHMB pavement distresses.
Coatings 13 00545 g010
Figure 11. Distress conditions of XHMB pavement.
Coatings 13 00545 g011
Figure 12. PPIs of XHMB pavement in 2021: (a) up direction drive lane; (b) up direction pass lane; (c) down direction drive lane; (d) down direction pass lane.
Coatings 13 00545 g012
Figure 13. PPI distribution for the four lanes.
Coatings 13 00545 g013
Figure 14. Performance partition of XHMB pavement based on PPI value.
Coatings 13 00545 g014
Figure 15. Variation of XHMB and JTB pavement distresses number: (a) Xihoumen Bridge (XHMB); (b) Jintang Bridge (JTB).
Coatings 13 00545 g015
Table 1. Main parameters of XHMB.
Bridge NameXihoumen Bridge
Structure typeSuspension bridge
Opening timeDecember 2009
Designed service life/year15
Main span/m1650
Total span/m2230
Longitudinal gradient/%2.5
Steel deck plate thickness/mm14 (Strengthening position: 16)
Stiffener thickness/mm8
Distance between adjacent stiffeners/mm600
Table 2. Grades of pavement rutting condition.
GradeABCDE
RDI[100, 90](90, 80](80, 70](70, 60](60, 0]
RD/mm[0, 10](10, 13.3](13.3, 16.7](16.7, 20]>20
Table 3. Grades of pavement flatness.
GradeABCDE
RQI[100, 90](90, 80](80, 70](70, 60](60, 0]
IRI/mm[0, 2.3](2.3, 3.5](3.5, 4.3](4.3, 5.0]>5.0
Table 4. Threshold of CI calculation.
Total Length of Cracks/mNumber of CracksCI
[0, 0.1][0, 1][100, 90]
(0.1, 0.3](1, 3](90, 80]
(0.3, 2.7)(3, 27)(80, 0]
≥2.7≥270
Table 5. Threshold of PI and SDI calculation.
Total Patching Ratio/%PI and SDI
[0, 0.05][100, 90]
(0.05, 0.2](90, 80]
(0.2, 0.5](80, 70]
(0.5, 1](70, 60]
(1, 2](60, 40]
(2, 8](40, 0]
>80
Disclaimer/Publisher’s Note: The statements, opinions and data contained in all publications are solely those of the individual author(s) and contributor(s) and not of MDPI and/or the editor(s). MDPI and/or the editor(s) disclaim responsibility for any injury to people or property resulting from any ideas, methods, instructions or products referred to in the content.

