
Optimization of Electropolishing Process Using Taguchi Robust Design for UNS N08367 in a Mixed Solution of Sulfuric Acid and Phosphoric Acid

Abstract
1. Introduction
2. Experimental Method

| Ni | Cr | Mo | C | Si | Mn | P | S | Cu | N | Fe |
|---|---|---|---|---|---|---|---|---|---|---|
| 24.62 | 20.6 | 6.44 | 0.015 | 0.27 | 0.72 | 0.017 | 0.001 | 0.53 | 0.232 | Bal. |
| Factors | Unit | Level | ||
|---|---|---|---|---|
| Electrolyte (A) 95 wt% H2SO4 : 85 wt% H3PO4 | - | 1 (2:8) | 2 (3:7) | 3 (4:6) |
| Current density (B) | mA/cm2 | 1 (200) | 2 (300) | 3 (400) |
| Temperature (C) | °C | 1 (70) | 2 (75) | 3 (80) |
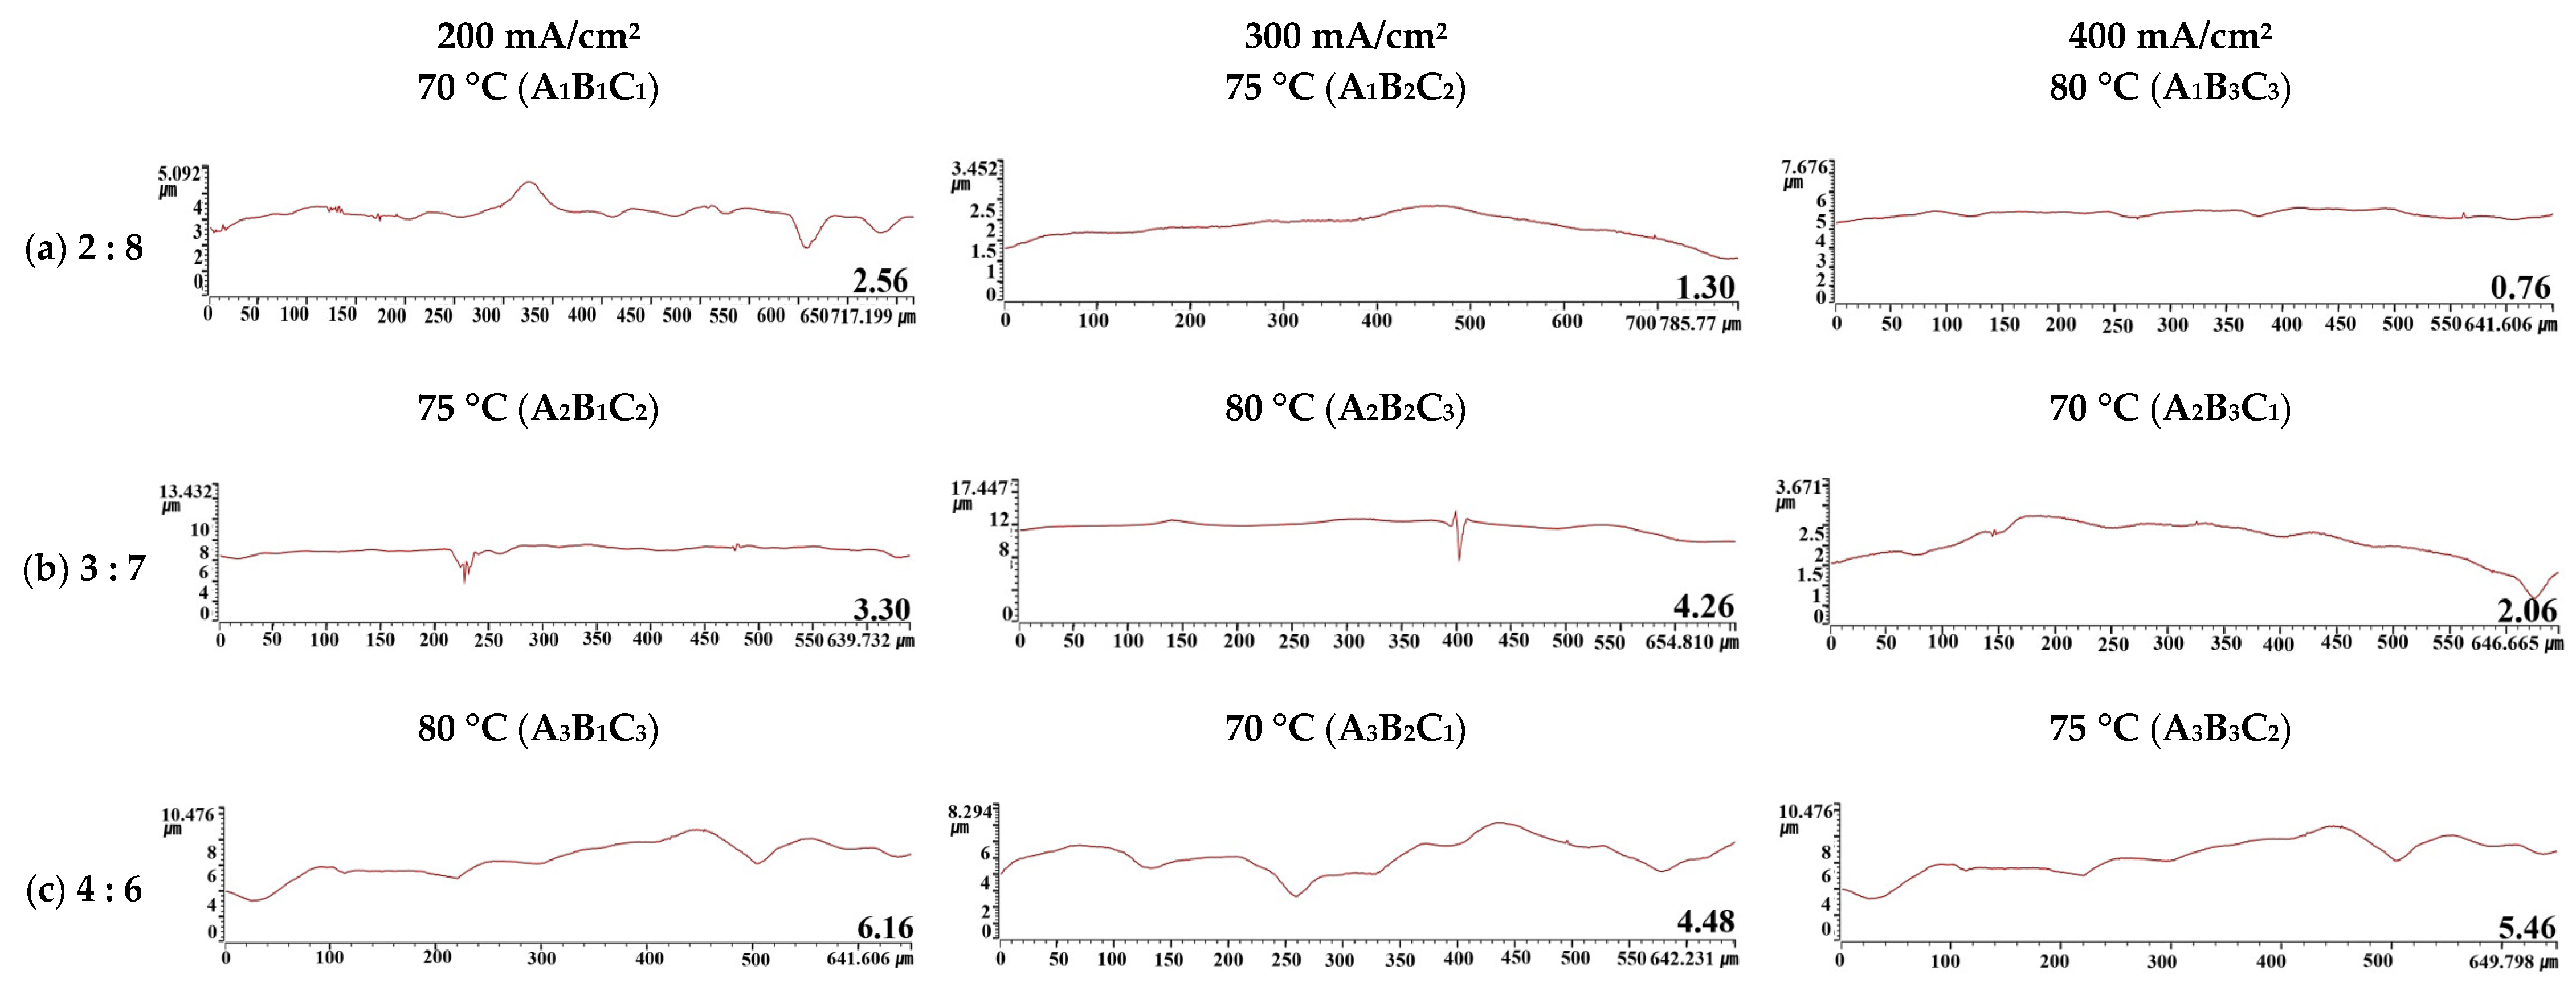
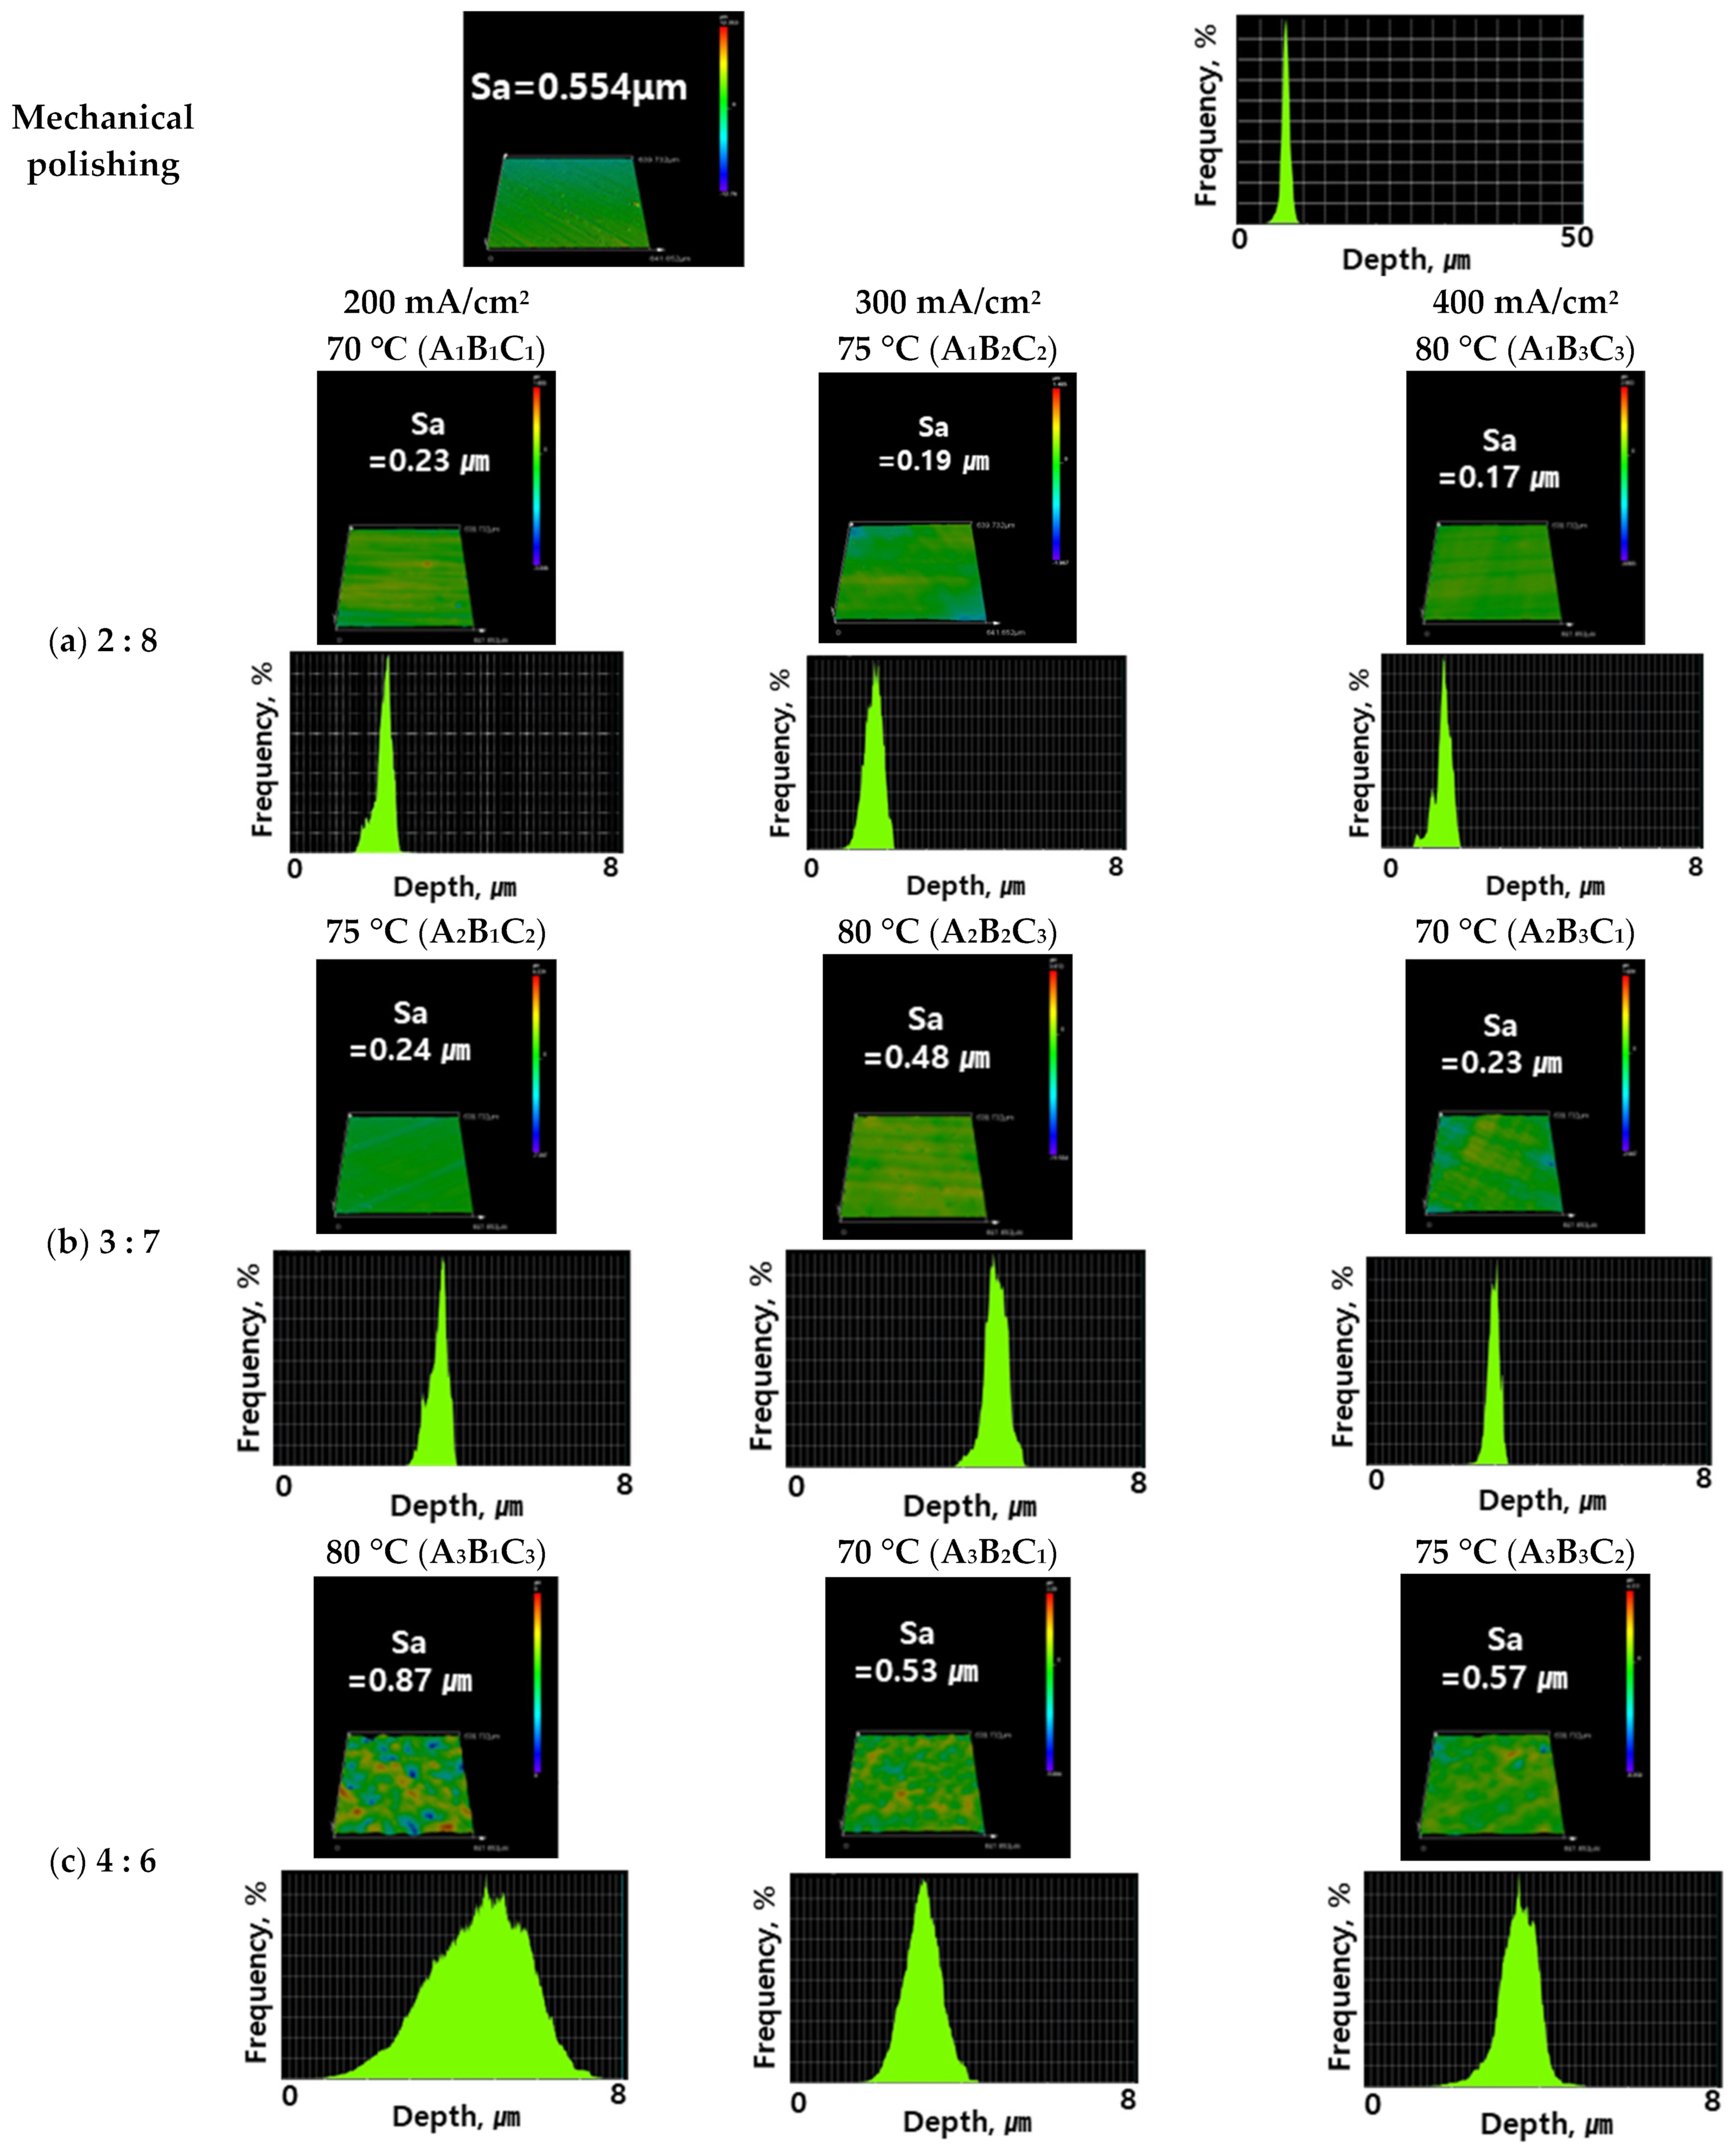
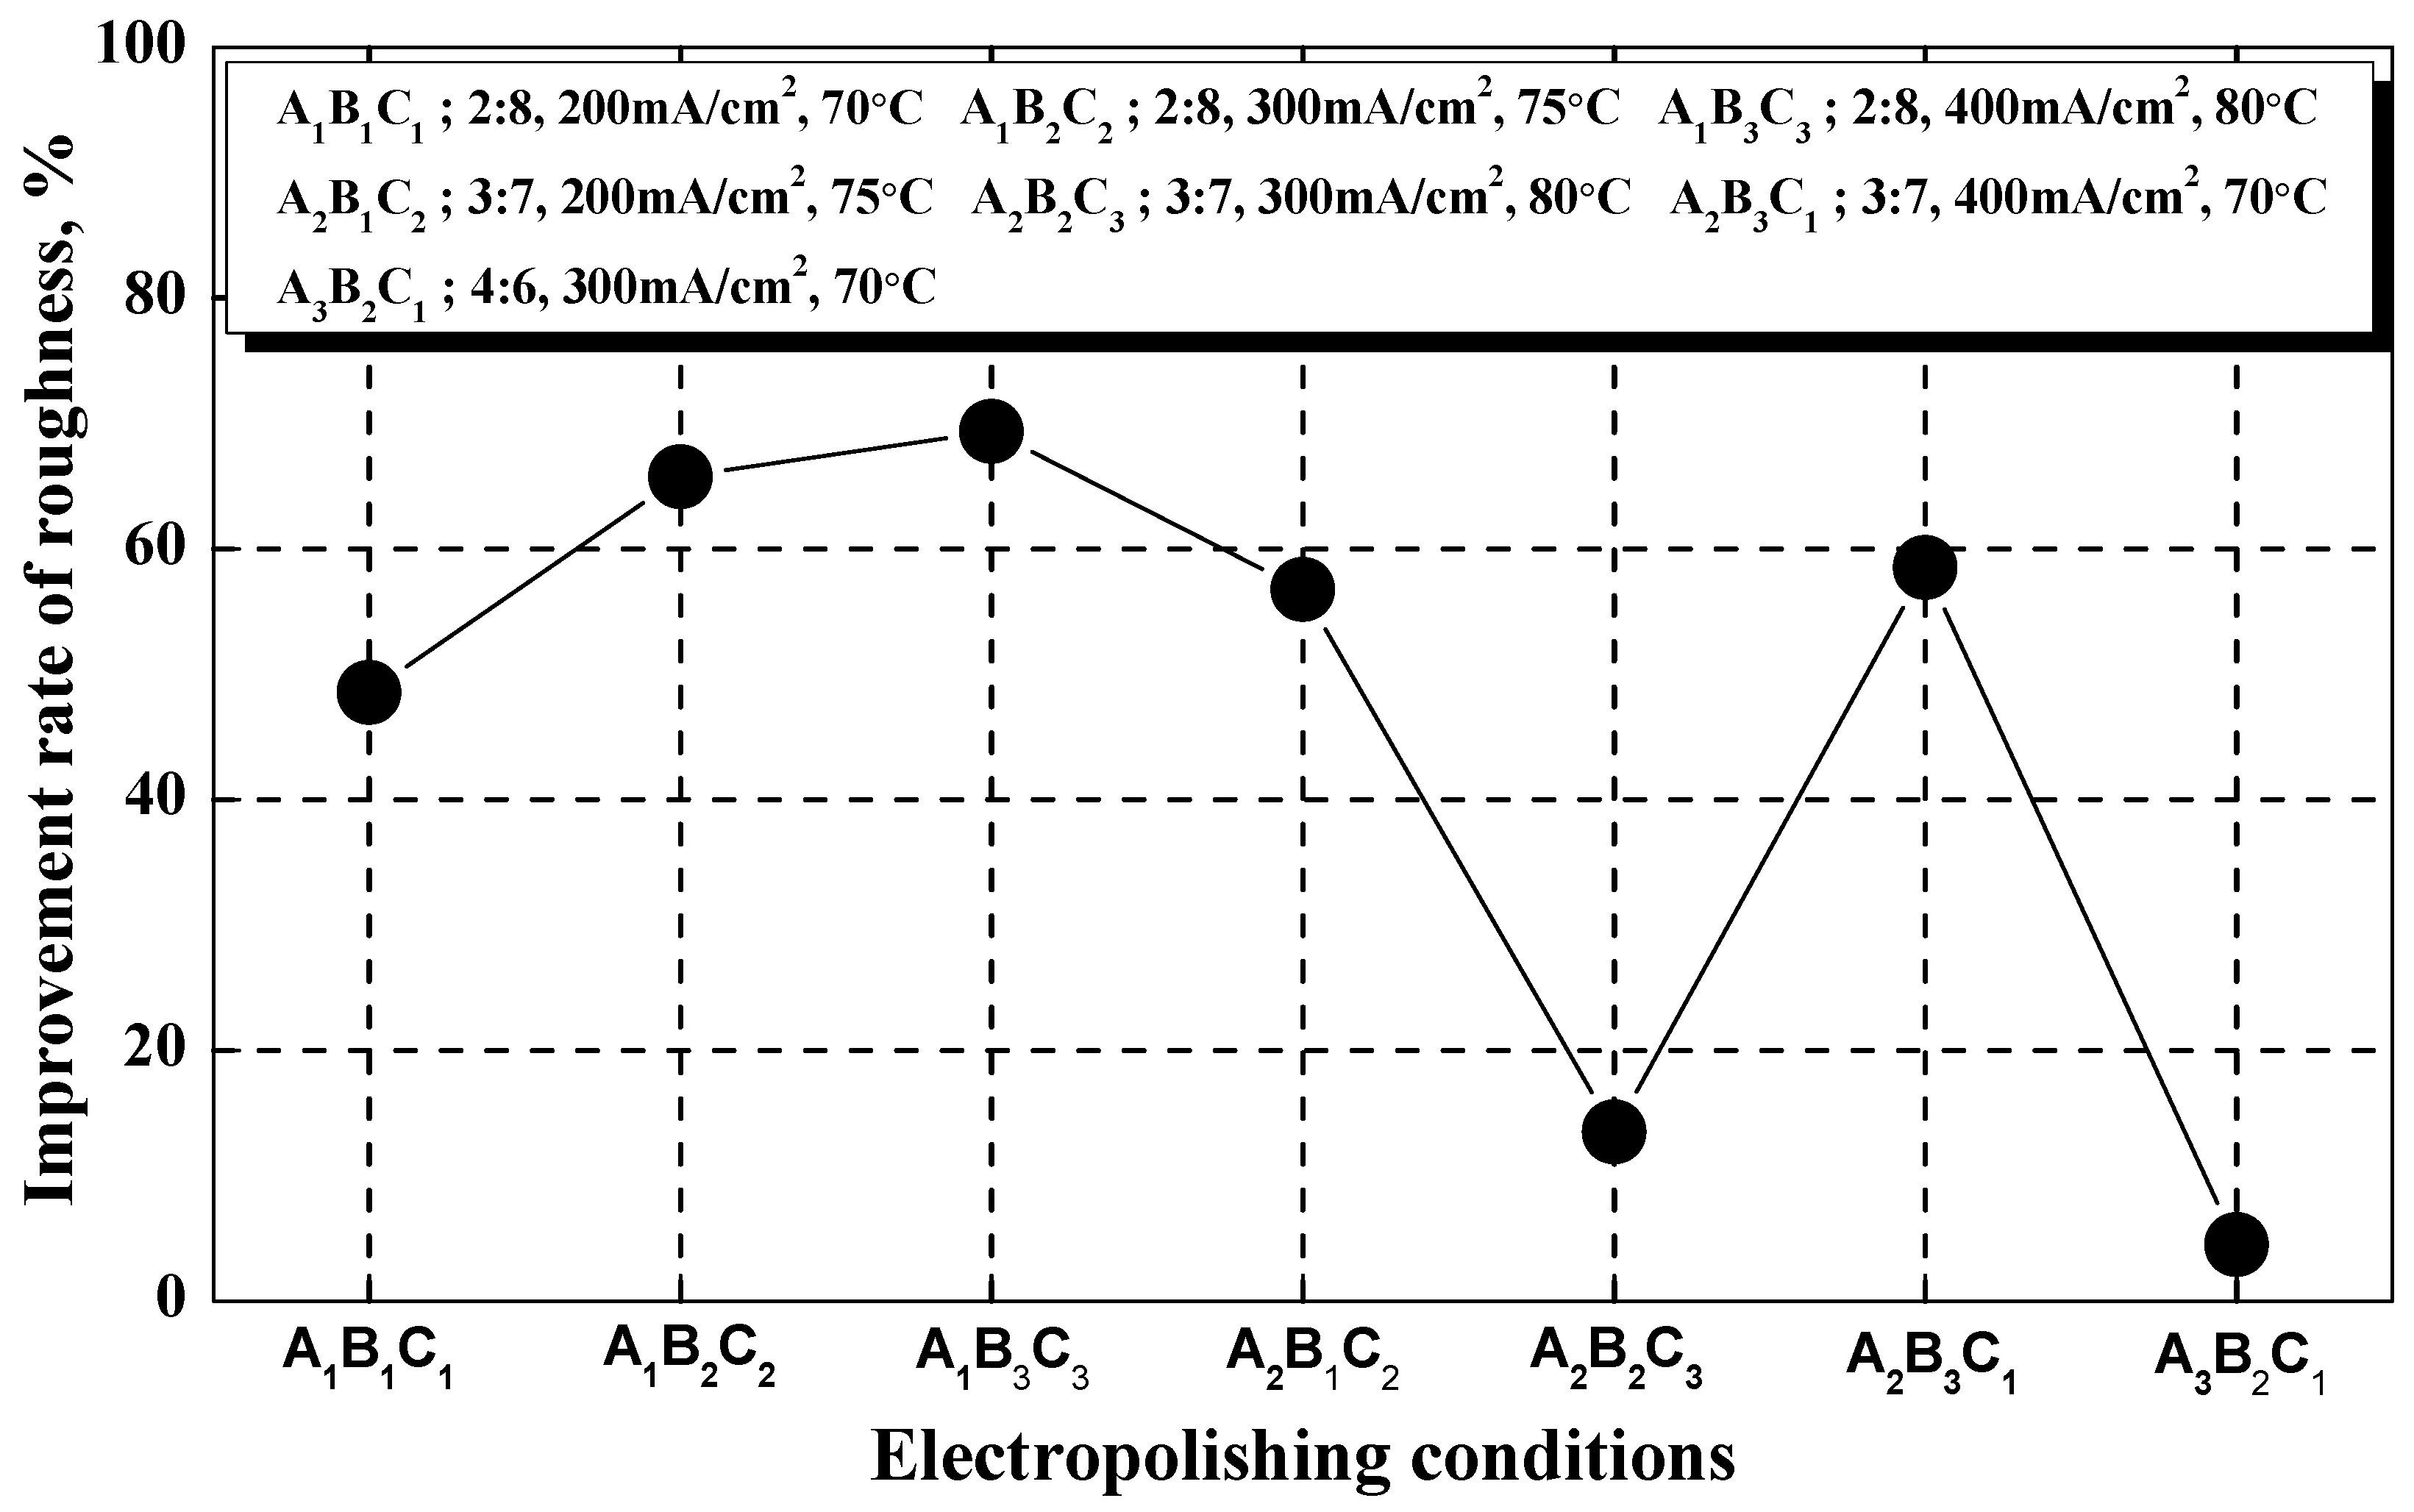
3. Experimental Results and Discussion
| Row | Inner Array | Outer Array: Roughness, μm | ||||
|---|---|---|---|---|---|---|
| Electrolyte (H2SO4, 95 wt%) | Current Density (mA/cm2) | Temp. (°C) | ||||
| A | B | C | R1 | R2 | R3 | |
| 1 | 1 | 1 | 1 | R1 | R2 | R3 |
| 2 | 1 | 2 | 2 | R4 | R5 | R6 |
| 3 | 1 | 3 | 3 | R7 | R8 | R9 |
| 4 | 2 | 1 | 1 | R10 | R11 | R12 |
| 5 | 2 | 2 | 2 | R13 | R14 | R15 |
| 6 | 2 | 3 | 3 | R16 | R17 | R18 |
| 7 | 3 | 1 | 1 | R19 | R20 | R21 |
| 8 | 3 | 2 | 2 | R22 | R23 | R24 |
| 9 | 3 | 3 | 3 | R25 | R26 | R27 |
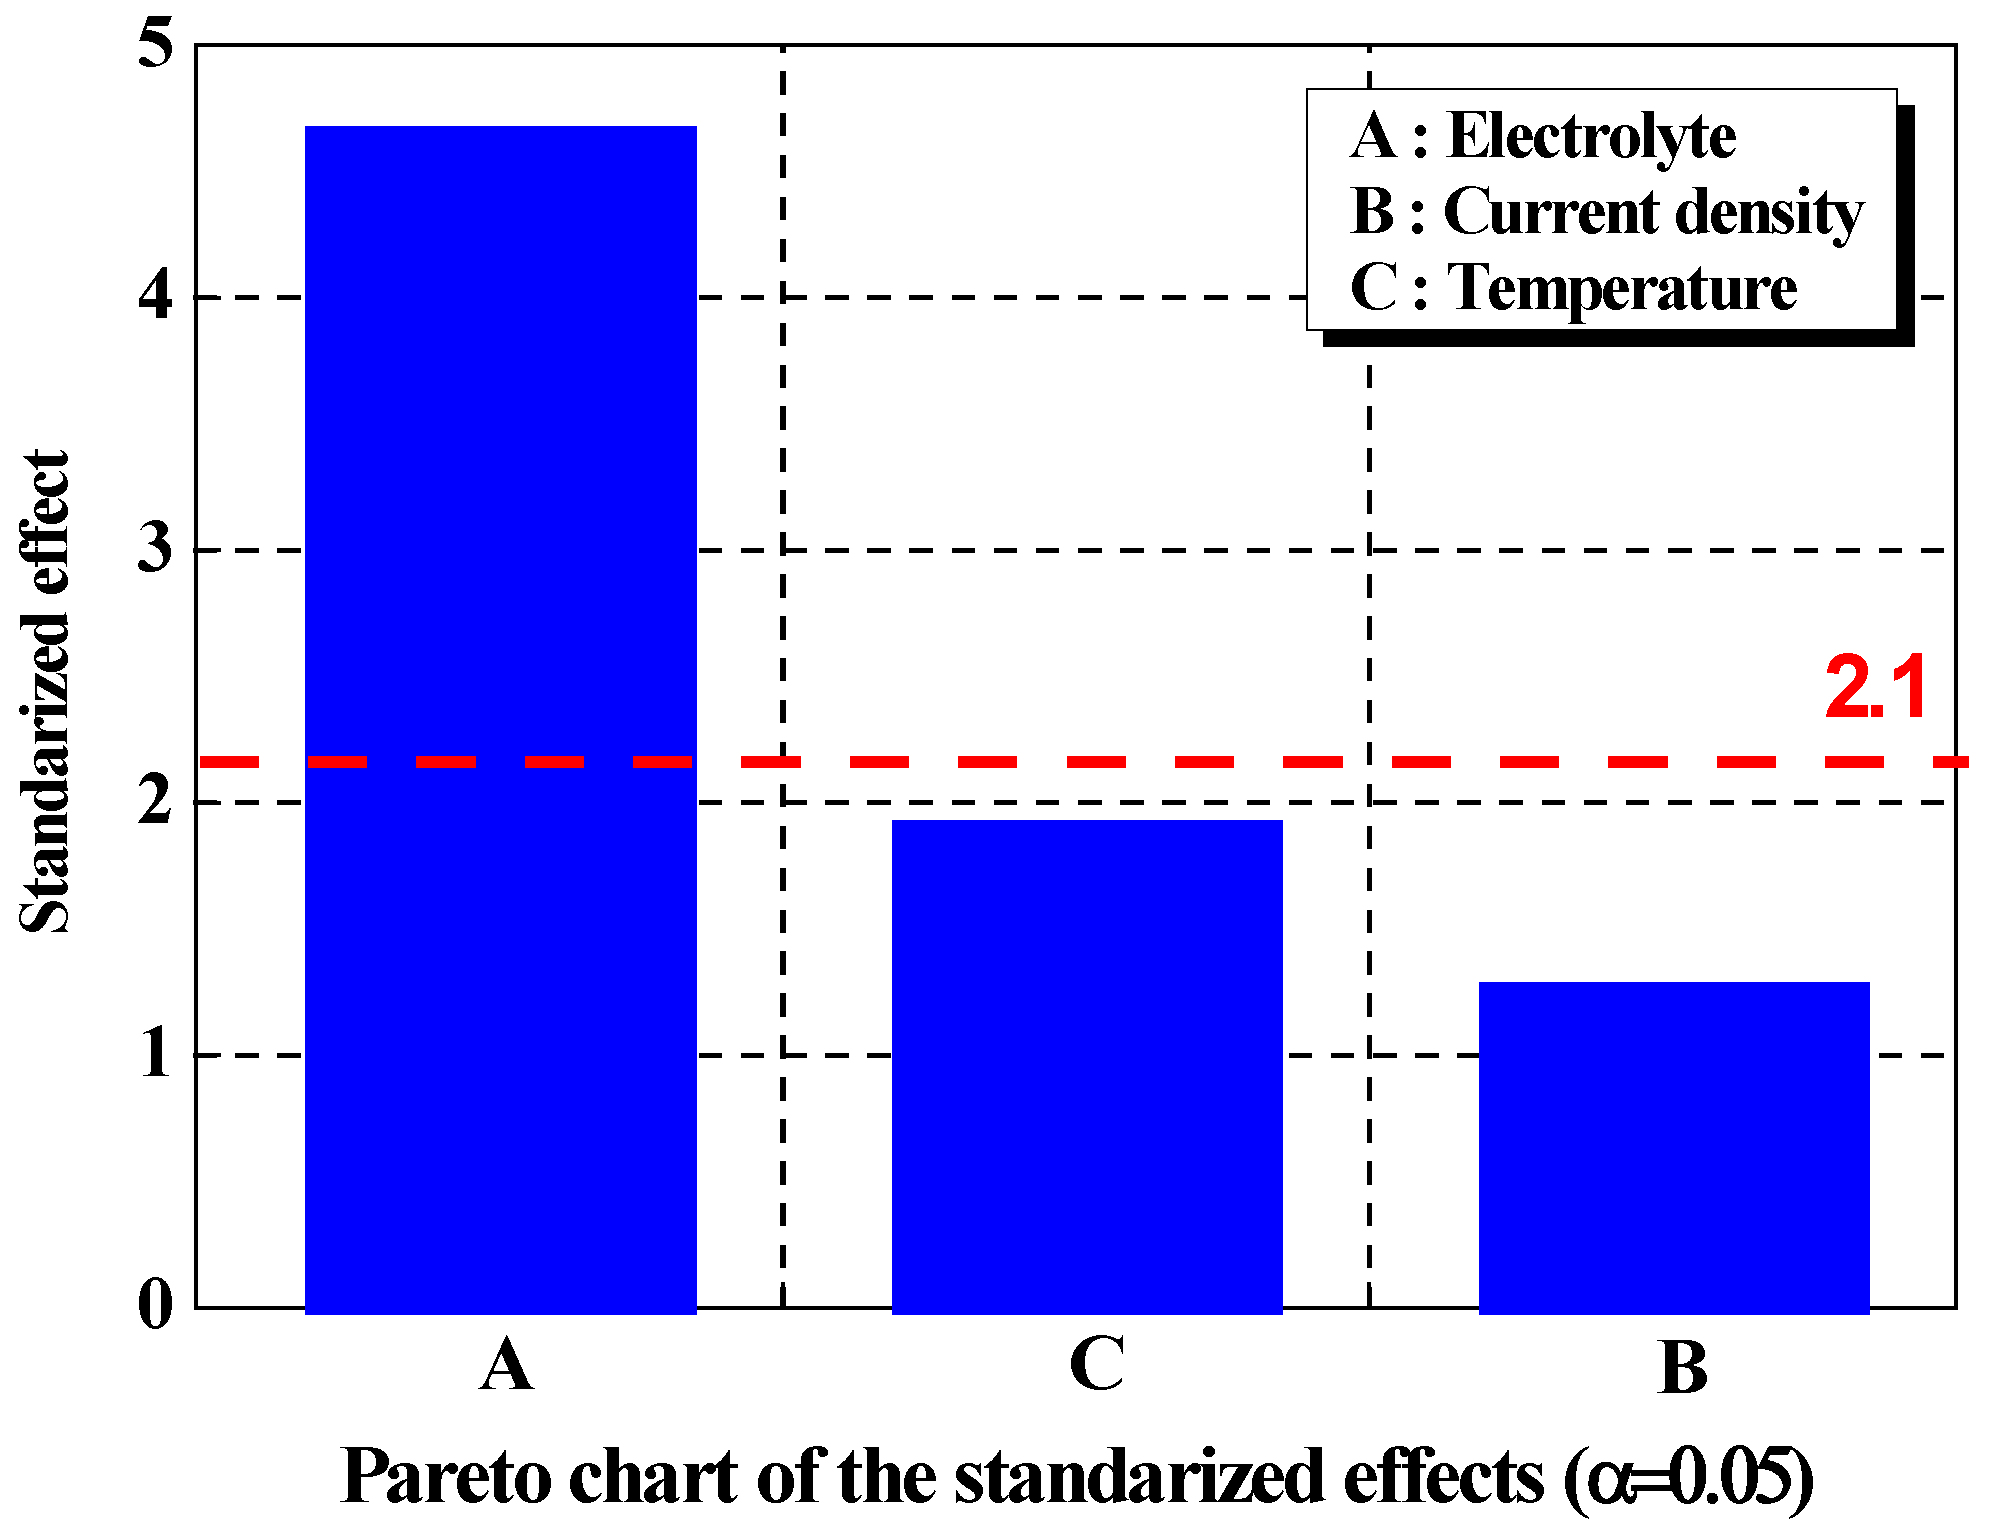
| Source | DF | Adj SS | Adj MS | F-Value | p-Value |
|---|---|---|---|---|---|
| Linear | 3 | 0.38191 | 0.12730 | 8.93 | 0.019 |
| A | 1 | 0.30781 | 0.30781 | 21.59 | 0.006 |
| B | 1 | 0.02257 | 0.02257 | 1.58 | 0.264 |
| C | 1 | 0.05152 | 0.05152 | 3.61 | 0.116 |
| Error | 5 | 0.07130 | 0.01426 | ||
| Total | 8 | 0.45320 |

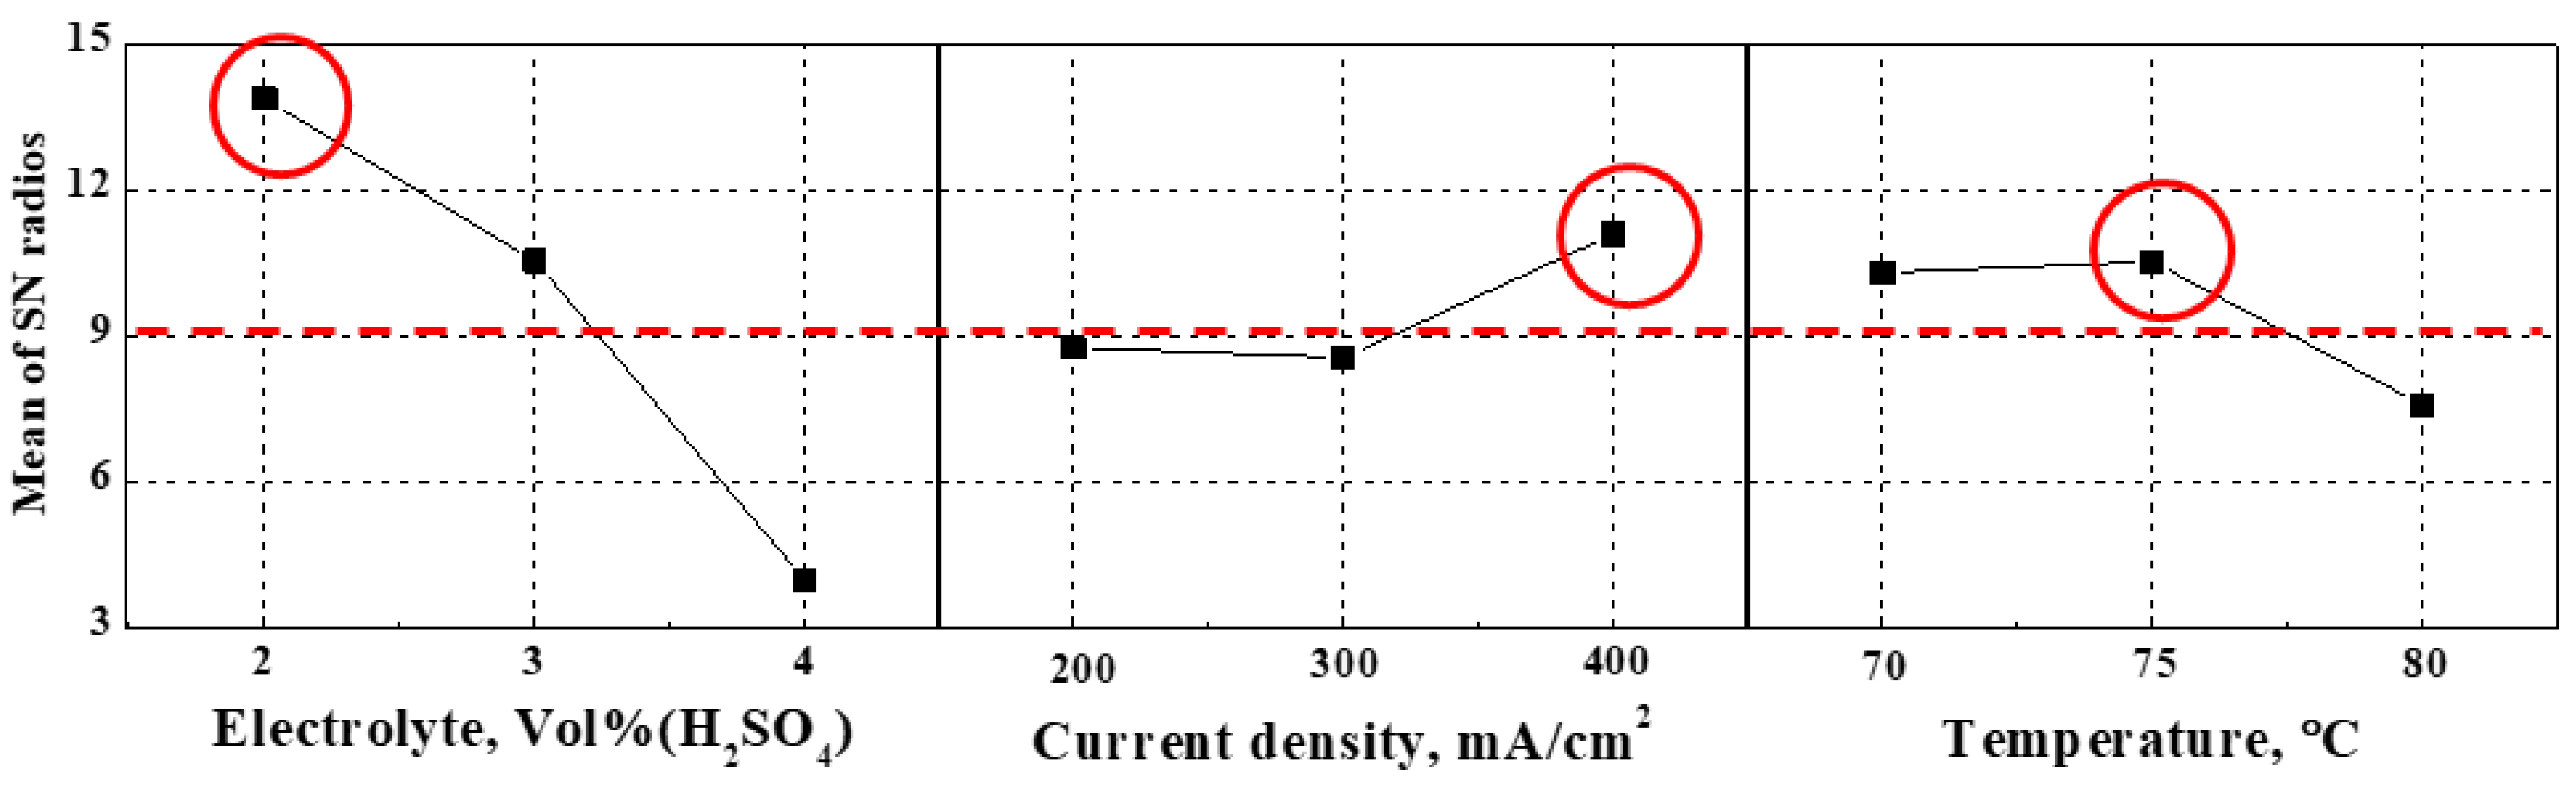
| Level | Electrolyte | Current Density | Temperature |
|---|---|---|---|
| 1 | 13.895 | 8.764 | 10.307 |
| 2 | 10.551 | 8.563 | 10.527 |
| 3 | 3.973 | 11.092 | 7.585 |
| Delta | 9.921 | 2.529 | 2.942 |
| Rank | 1 | 3 | 2 |

| Electrolyte | Current Density | Temperature | SN Ratios | |
|---|---|---|---|---|
| Experimental value | 2 | 400 | 80 | 15.27 |
| Predicted value | 2 | 400 | 75 | 16.58 |


4. Conclusions
Author Contributions
Funding
Institutional Review Board Statement
Informed Consent Statement
Data Availability Statement
Conflicts of Interest
References
- Lee, E.S. Machining Characteristics of the electropolishing of stainless steel (STS316L). Int. J. Adv. Manuf. Technol. 2000, 16, 591–599. [Google Scholar] [CrossRef]
- Kim, W.M.; Sin, M.J.; Lee, E.S. A Study of Micro Electrolytic-deburring for Nitinol. JKSPE 2006, 2006, 229–230. [Google Scholar]
- Kim, S.H.; Lee, S.G.; Choi, S.G.; Lee, E.S.; Choi, S.B.; Lee, C.H. A Study on the Characteristics of Micro Electropolishing for Stainless Steel. Int. J. Adv. Manuf. Technol. 2016, 85, 2313. [Google Scholar] [CrossRef]
- See, S.D.; Lee, J.M.; Kang, C.Y.; Kim, J.H.; Lee, D.H. Effect of Grain Size on Corrosion Resistance and High Temperature Oxidation Behavior of 22Cr-12Ni-5W Super Austenitic Stainless Steels. KSPSE 2004, 14, 5. [Google Scholar]
- Qian, M.; DuPont, J.N. Microsegregation-related pitting corrosion characteristics of AL-6XN superaustenitic stainless steel laser welds. Corros. Sci. 2010, 52, 3548–3553. [Google Scholar] [CrossRef]
- Cardoso, J.L.; Cavalcante, A.L.S.N.; Vieira, R.C.A.; Lima-Neto, P.D.; Silva, M.J.G.D. Pitting corrosion resistance of austenitic and superaustenitic stainless steels in aqueous medium of NaCl and H2SO4. J. Mater. Res. 2016, 31, 1755–1763. [Google Scholar] [CrossRef]
- Jung, K.H.; Kim, S.J. Experiment Investigation for Design on the Sensitization-Dependent Passivation Characteristics of AL-6XN in 3.5% NaCl Solution. J. Nanosci. Nanotechnol. 2021, 21, 3984–3988. [Google Scholar] [CrossRef] [PubMed]
- Mahardika, M.; Setyawan, M.A.; Sriani, T.; Miki, N.; Prihandana, G.S. Electropolishing Parametric Optimization of Surface Quality for the Fabrication of a Titanium Microchannel Using the Taguchi Method. Machines 2021, 9, 325. [Google Scholar] [CrossRef]
- Brent, D.; Saunders, T.A.; Moreno, F.G.; Tyagi, P. Taguchi Design of Experiment for the Optimization of Electrochemical Polishing of Metal Additive Manufacturing Components. Int. Mech. Eng. Congress. Expo. 2016, 2, 1–6. [Google Scholar] [CrossRef]
- Rokosz, K.; Hryniewicz, T.; Simon, F.; Rzadkiewicz, S. Comparative XPS analyses of passive layers composition formed on Duplex 2205 SS after standard and high-current-density electropolishing. Teh. Vjesn. 2016, 23, 731–735. [Google Scholar] [CrossRef]
- Pa, P.S. The optimal parameters in a magnetically assisted finishing system using Taguchi’s method. Phys. B Condens. Matter 2010, 405, 4470–4475. [Google Scholar] [CrossRef]
- Hwang, H.K.; Kim, S.J. Effect of Seawater Temperature on the Cyclic Potentiodynamic Polarization Characteristics and Microscopic Analysis on Damage Behavior of Super Austenitic Stainless Steel. Corros. Sci. Technol. 2021, 20, 412–425. [Google Scholar] [CrossRef]
- ASTM B912; Standard Specification for Passivation of Stainless Steels Using Electropolishing. ASTM International: West Conshohocken, PA, USA, 2018.
- Moon, S.; Kim, S. Design Optimization of Earth Retaining Walls Using the Taguchi Method. KICEM 2017, 18, 83. [Google Scholar] [CrossRef]
- Lin, C.C.; Hu, C.C. Electropolishing of 304 stainless steel: Surface roughness control using experimental design strategies and a summarized electropolishing model. Electrochim. Acta 2008, 53, 3356. [Google Scholar] [CrossRef]
- Tyagi, P.; Brent, D.; Saunders, T.; Goulet, T.; Riso, C.; Klein, K.; Moreno, F.G. Roughness Reduction of Additively Manufactured Steel by Electropolishing. Int. J. Adv. Manuf. Technol. 2020, 106, 1337–1344. [Google Scholar] [CrossRef]
- Alrbaey, K.; Wimpenny, D.I.; Al-Barzinjy, A.A.; Moroz, A. Electropolishing of Re-melted SLM Stainless Steel 316L Parts Using Deep Eutectic Solvents: 3 × 3 Full Factorial Design. JMEP 2016, 25, 2836–2846. [Google Scholar] [CrossRef]
- Yang, G.; Wang, B.; Tawfiq, K.; Wei, H.; Zhou, S.; Chen, G. Electropolishing of surfaces: Theory and applications. Surf. Eng. 2016, 33, 149–166. [Google Scholar] [CrossRef]
- Bolboacă, S.D.; Jäntschi, L. Design of Experiments: Useful Orthogonal Arrays for Number of Experiments from 4 to 16. Entropy 2007, 9, 198–232. [Google Scholar] [CrossRef]
- Lee, S.B. Minitab Example-driven Design of Experiments; ERETECH: Anyang-si, Republic of Korea, 2018; pp. 9–11. [Google Scholar]
- Mohan, S.N.; Avinash, L.; Manjunath, P.G.C.; Danil, Y.P.; Khaled, G.; Raghupatruni, V.S.P.; Szymon, W. Experimental investigation of selective laser melting parameters for higher surface quality and microhardness properties: Taguchi and super ranking concept approaches. JMRT 2021, 14, 2586. [Google Scholar] [CrossRef]
- Pignatiello, J.J., Jr. An Overview of the Strategy and Tactics of Taguchi. IIE Trans. 2007, 20, 247. [Google Scholar] [CrossRef]
- Tsui, K.L. An overview of Taguchi method and newly developed statistical methods for robust design. IIE Trans. 2007, 24, 44. [Google Scholar] [CrossRef]
- Yang, B.T. Optimal Design of the Flux Barrier in the Spoke Type BLDC Motor Using the Modified Taguchi Method. Ph.D. Thesis, The Graduate School of Industry Hanyang University, Seoul, Republic of Korea, 2011. [Google Scholar]
- Taguchi, G. Introduction to Quality Engineering: Designing Quality into Products and Processes, Quality Resources, American; Asian Productivity Organization: Tokyo, Japan, 1986. [Google Scholar]
- Freddi, A.; Salmon, M. Introduction to the Taguchi method. In Design Principles and Methodologies; Springer: Berlin/Heidelberg, Germany, 2019; Chapter 9; pp. 159–180. [Google Scholar] [CrossRef]
- Jung, K.H.; Kim, S.J. Prediction of Pitting Corrosion Characteristics of AL-6XN Steel with Sensitization and Environmental Variables Using Multiple Linear Regression Method. Corros. Sci. Tech. 2020, 19, 302–309. [Google Scholar] [CrossRef]
- Datta, M.; Landolt, D. Fundamental aspects and applications of electrochemical microfabrication. Electrochim. Acta 2000, 45, 2535. [Google Scholar] [CrossRef]
- Nahm, S.G. Understanding Effect Sizes. Hanyand Med. Rev. 2015, 35, 40. [Google Scholar] [CrossRef][Green Version]
- Baguley, T. Standardized or simple effect size: What should be reported? Br. J. Psychol. 2011, 100, 603–617. [Google Scholar] [CrossRef] [PubMed]
- Kim, S.H.; Lee, S.H.; Cho, J.H.S.; Kim, B.; Choi, J.S.; Park, C. H Electropolishing Characteristics of Stainless Steel for Industrial Application. J. Korean Inst. Surf. Eng. 2016, 49, 363–367. [Google Scholar] [CrossRef]
- Schwaab, M.; Pinto, J.C. Optimum reference temperature for reparameterization of the Arrhenius equation. Part 1: Problems involving one kinetic constant. Chem. Eng. Sci. 2007, 62, 2750. [Google Scholar] [CrossRef]
- Latha, G.; Rajeswari, S. Pitting and crevice corrosion behaviour of superaustenitic stainless steels in sea water cooling systems. Corros. Rev. 2000, 18, 1. [Google Scholar] [CrossRef]
- Hwang, H.K.; Kim, S.J. Electrochemical Characteristics of Superaustenitic Stainless Steel with Temperature in Sea Water. Corros. Sci. Tech. 2021, 20, 391–402. [Google Scholar] [CrossRef]
- Hwang, H.K.; Kim, S.J. Electrochemical Properties of Austenitic Stainless Steel with Initial Delay Time and Surface Roughness in Electropolishing Solution. Corros. Sci. Tech. 2022, 21, 158–169. [Google Scholar] [CrossRef]
- Kim, S.H. Process Optimization for Life Extension of Electropolishing Solution for Semiconductor Piping Tube. Ph.D. Thesis, Kwangwoon University, Seoul, Republic of Korea, 2016. [Google Scholar]
- Chatterjee, B. Science and Industry of Electropolishing. Jahrb. Oberfl. 2015, 71, 71–93. [Google Scholar]
- Hocheng, H.; Kao, P.S.; Chen, Y.F. Electropolishing of 316L stainless steel for anticorrosion passivation. JMEP 2001, 10, 414–418. [Google Scholar] [CrossRef]

| Row | Inner Array | Outer Array: Roughness, μm | SN Ratios | ||||
|---|---|---|---|---|---|---|---|
| Electrolyte (H2SO4, 95 wt%) | Current Density (mA/cm2) | Temp. (°C) | |||||
| A | B | C | R1 | R2 | R3 | ||
| 1 | 1 | 1 | 1 | 0.230 | 0.246 | 0.232 | 12.53 |
| 2 | 1 | 2 | 2 | 0.210 | 0.201 | 0.196 | 13.87 |
| 3 | 1 | 3 | 3 | 0.169 | 0.175 | 0.173 | 15.27 |
| 4 | 2 | 1 | 1 | 0.232 | 0.239 | 0.237 | 12.54 |
| 5 | 2 | 2 | 2 | 0.500 | 0.483 | 0.474 | 6.27 |
| 6 | 2 | 3 | 3 | 0.228 | 0.232 | 0.224 | 12.84 |
| 7 | 3 | 1 | 1 | 0.872 | 0.857 | 0.880 | 1.21 |
| 8 | 3 | 2 | 2 | 0.527 | 0.510 | 0.547 | 5.54 |
| 9 | 3 | 3 | 3 | 0.569 | 0.549 | 0.537 | 5.16 |
Disclaimer/Publisher’s Note: The statements, opinions and data contained in all publications are solely those of the individual author(s) and contributor(s) and not of MDPI and/or the editor(s). MDPI and/or the editor(s) disclaim responsibility for any injury to people or property resulting from any ideas, methods, instructions or products referred to in the content. |
© 2023 by the authors. Licensee MDPI, Basel, Switzerland. This article is an open access article distributed under the terms and conditions of the Creative Commons Attribution (CC BY) license (https://creativecommons.org/licenses/by/4.0/).
Share and Cite
Hwang, H.-K.; Kim, S.-J. Optimization of Electropolishing Process Using Taguchi Robust Design for UNS N08367 in a Mixed Solution of Sulfuric Acid and Phosphoric Acid. Coatings 2023, 13, 312. https://doi.org/10.3390/coatings13020312
Hwang H-K, Kim S-J. Optimization of Electropolishing Process Using Taguchi Robust Design for UNS N08367 in a Mixed Solution of Sulfuric Acid and Phosphoric Acid. Coatings. 2023; 13(2):312. https://doi.org/10.3390/coatings13020312
Chicago/Turabian StyleHwang, Hyun-Kyu, and Seong-Jong Kim. 2023. "Optimization of Electropolishing Process Using Taguchi Robust Design for UNS N08367 in a Mixed Solution of Sulfuric Acid and Phosphoric Acid" Coatings 13, no. 2: 312. https://doi.org/10.3390/coatings13020312
APA StyleHwang, H.-K., & Kim, S.-J. (2023). Optimization of Electropolishing Process Using Taguchi Robust Design for UNS N08367 in a Mixed Solution of Sulfuric Acid and Phosphoric Acid. Coatings, 13(2), 312. https://doi.org/10.3390/coatings13020312