
Single-Impact Failure of Multi-Layered Automotive Coatings: A Finite Element-Based Study


Abstract
1. Introduction
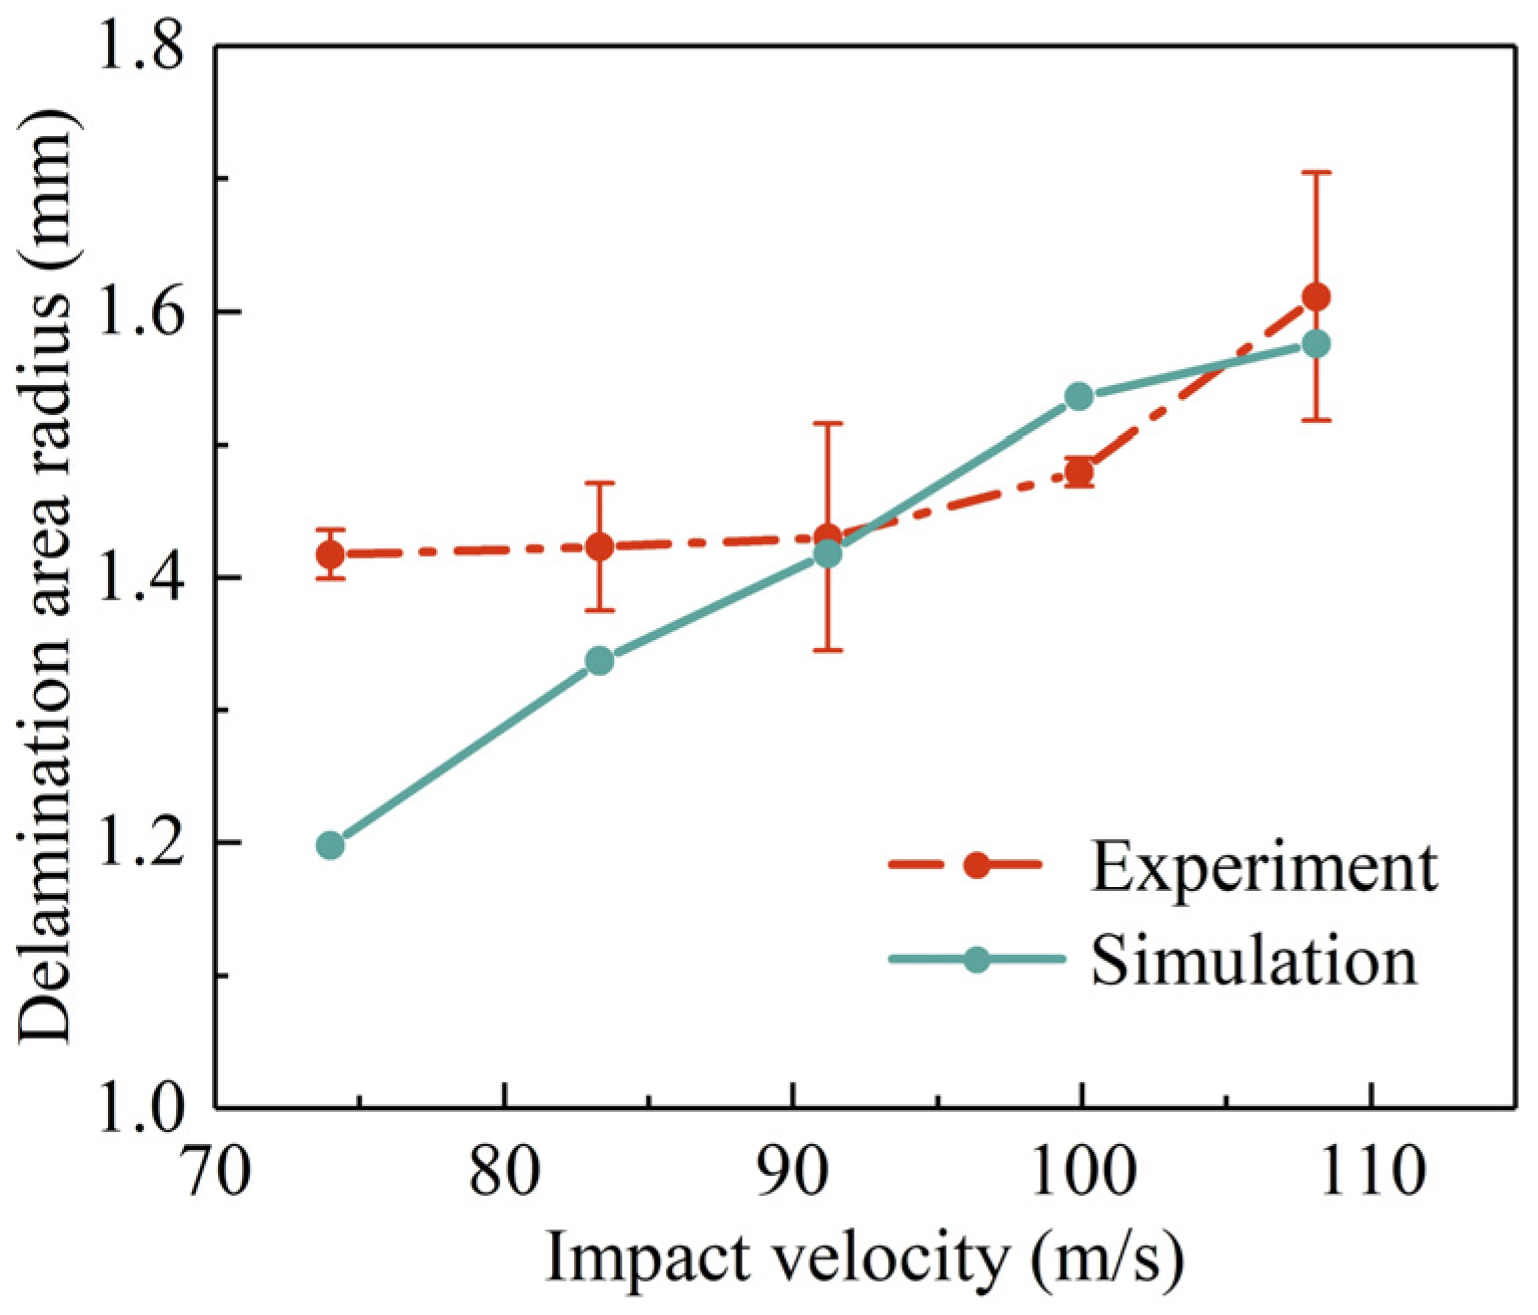
- A finite element model for single-impact failure of automotive coatings is developed, which accounts for not only the polymer-ply and interlaminar failures of the coating system but also the effect of impact velocity. The numerical results indicate that the proposed model can reproduce the failure patterns of automotive coatings and qualitatively capture the effect of impact velocity.
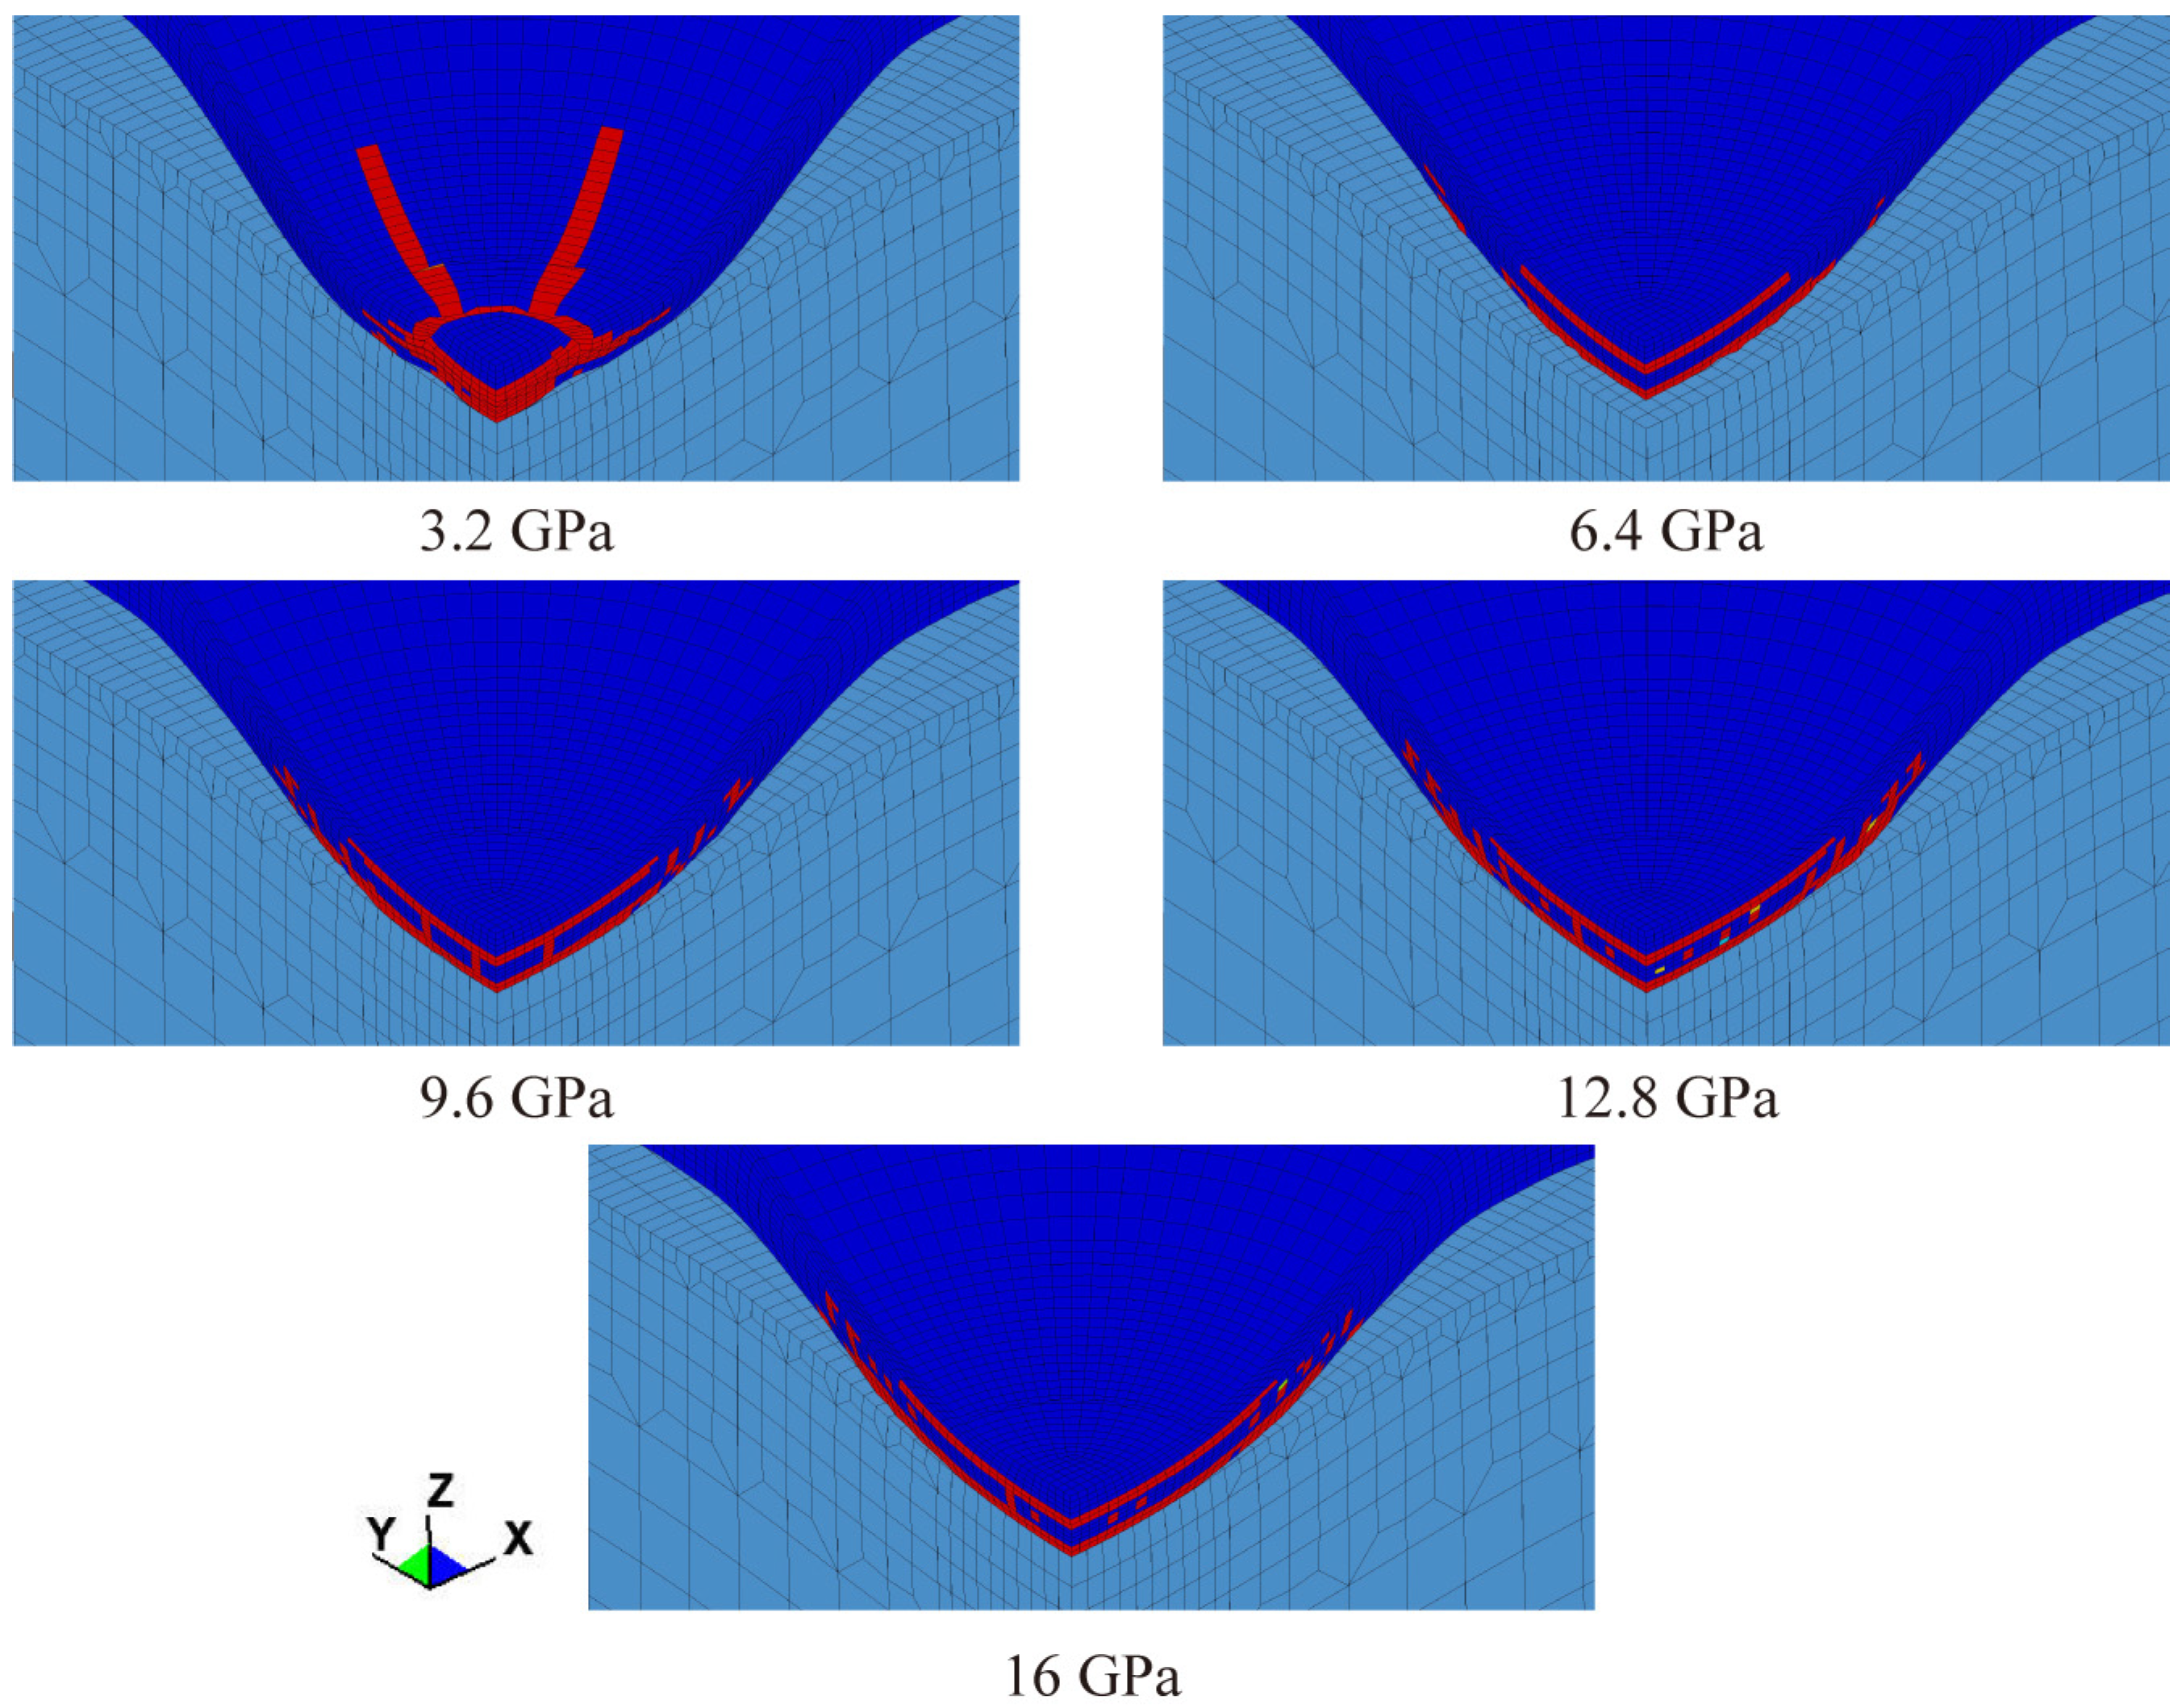
- The impact failure mechanisms of automotive coatings are numerically revealed, the results show that both brittle and ductile failures are found in the coating, and there are three stages for the propagation of the delamination crack.
- The effects of primer mechanical properties, i.e., Young’s modulus, yield strength, and re-hardening modulus, on the impact resistance of automotive coatings are firstly numerically investigated.
2. Experiment and Modeling Descriptions
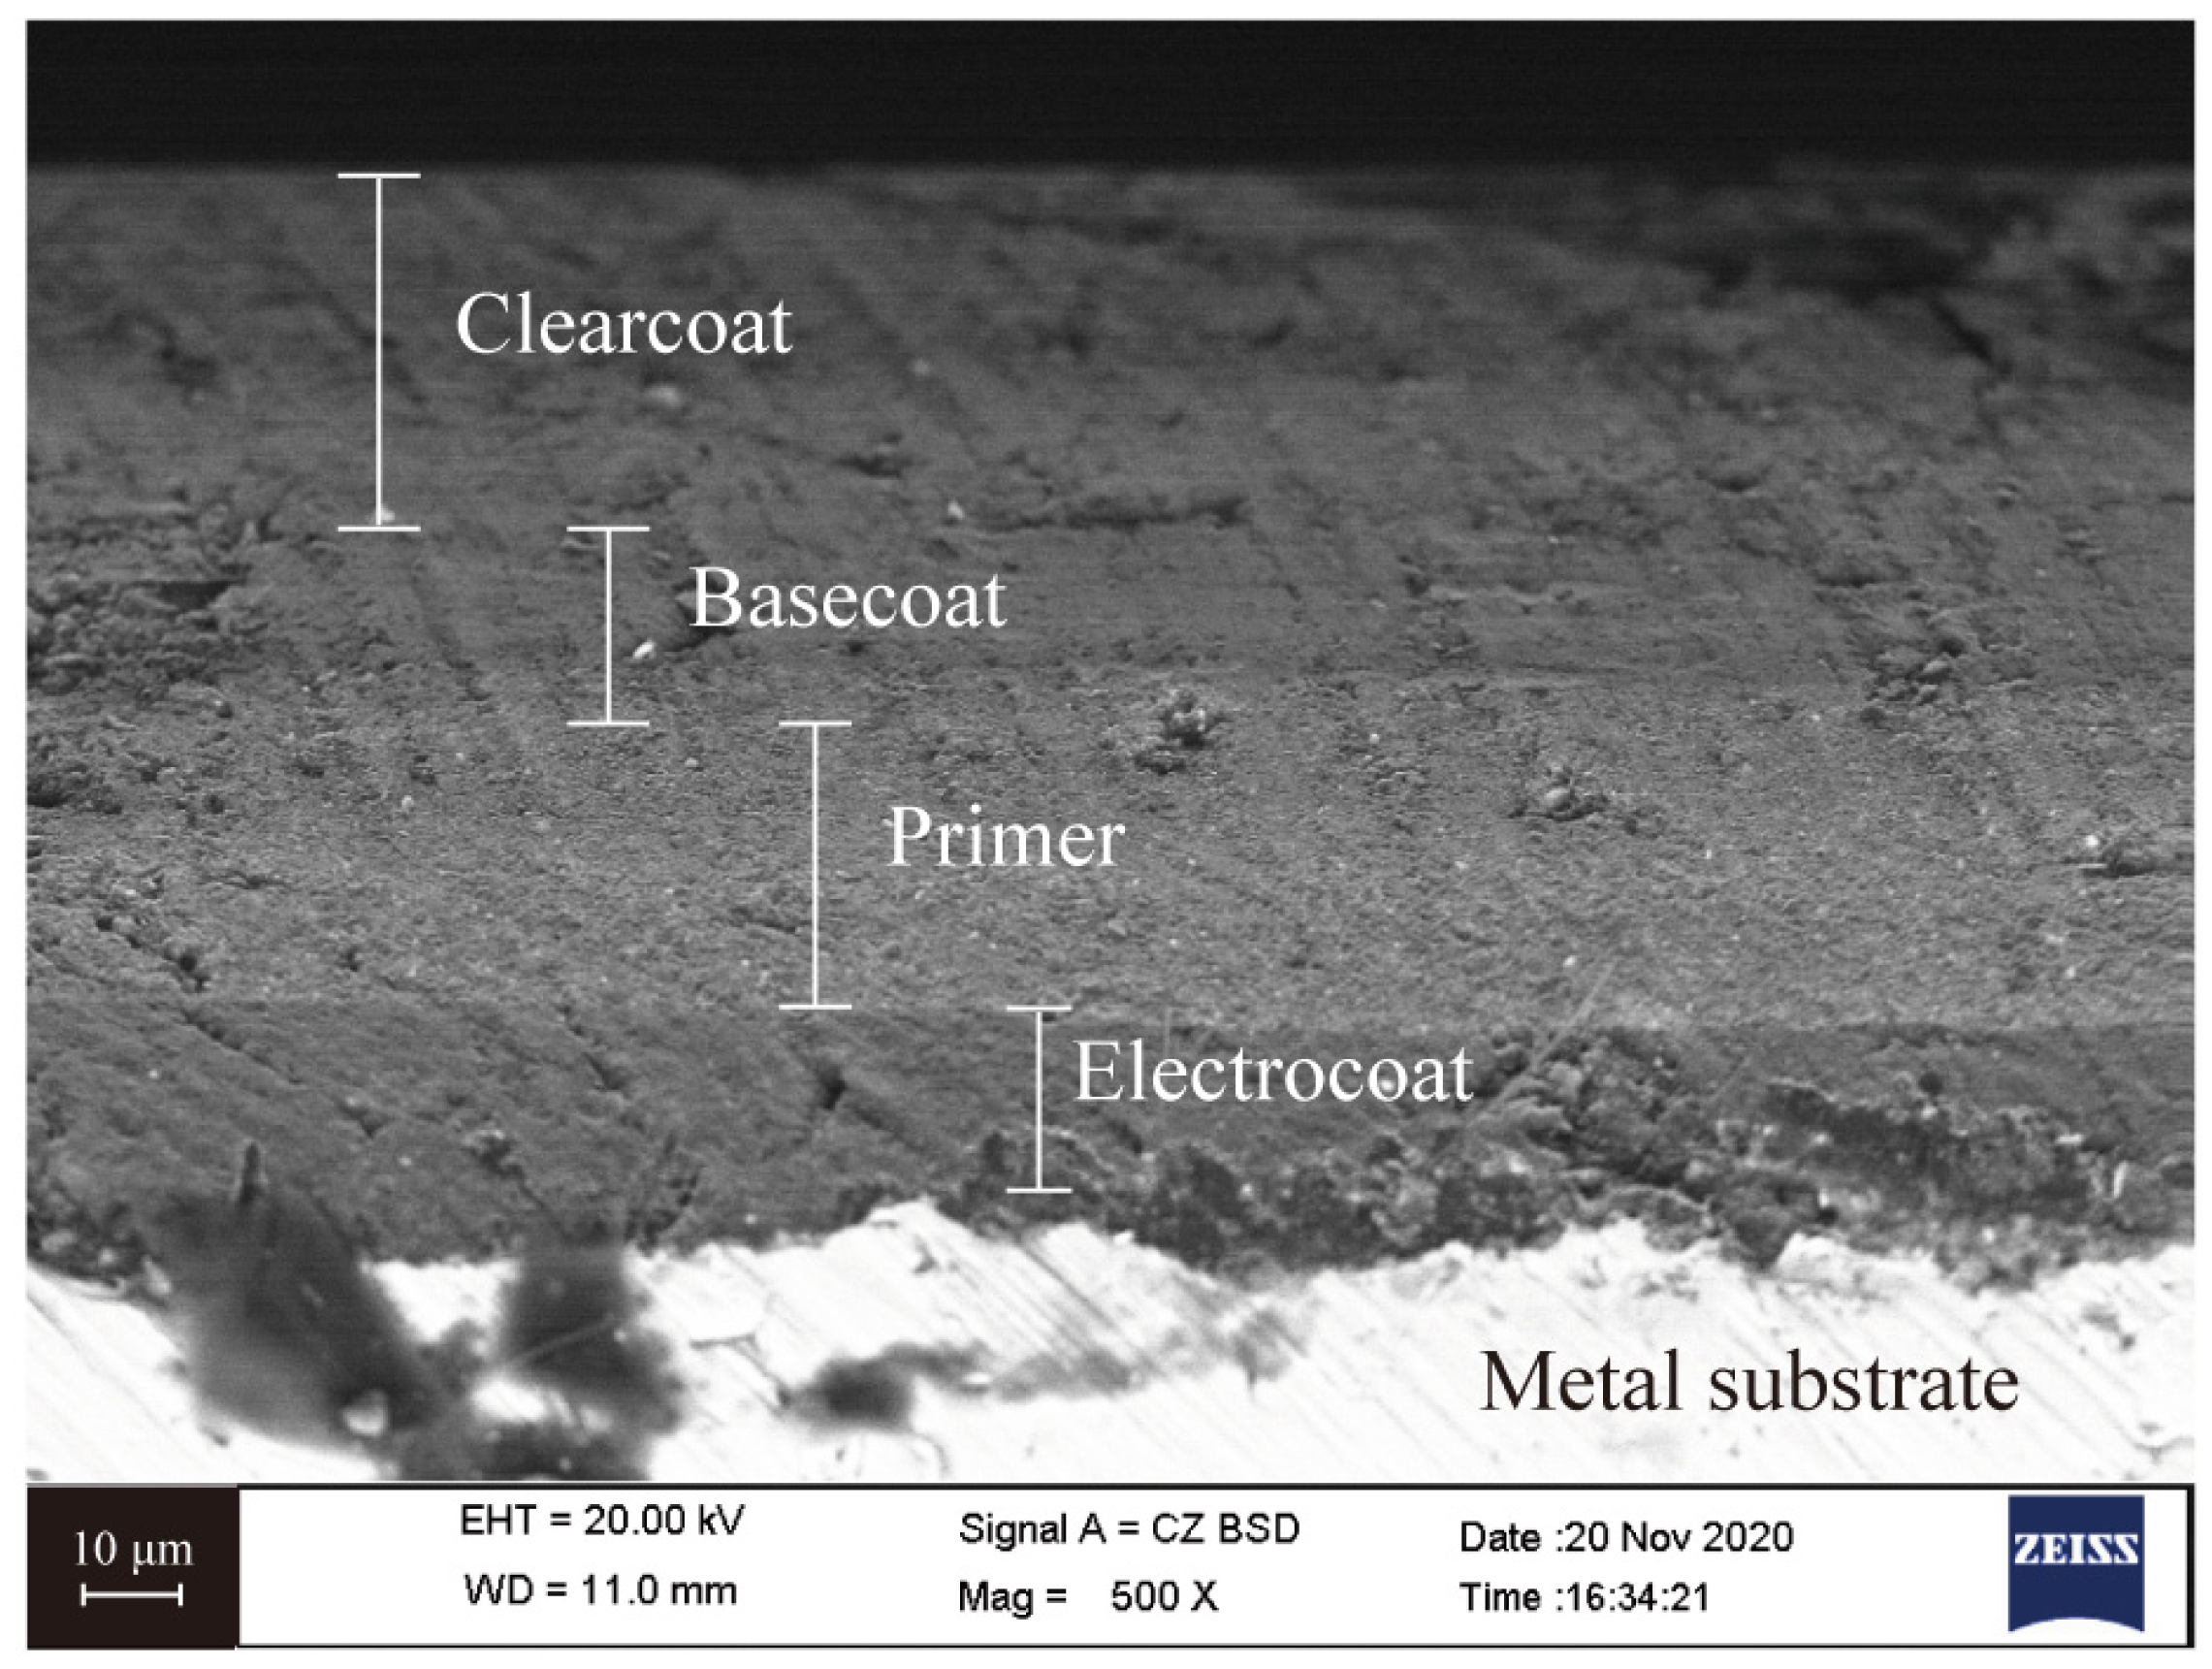
2.1. Experimental Procedure
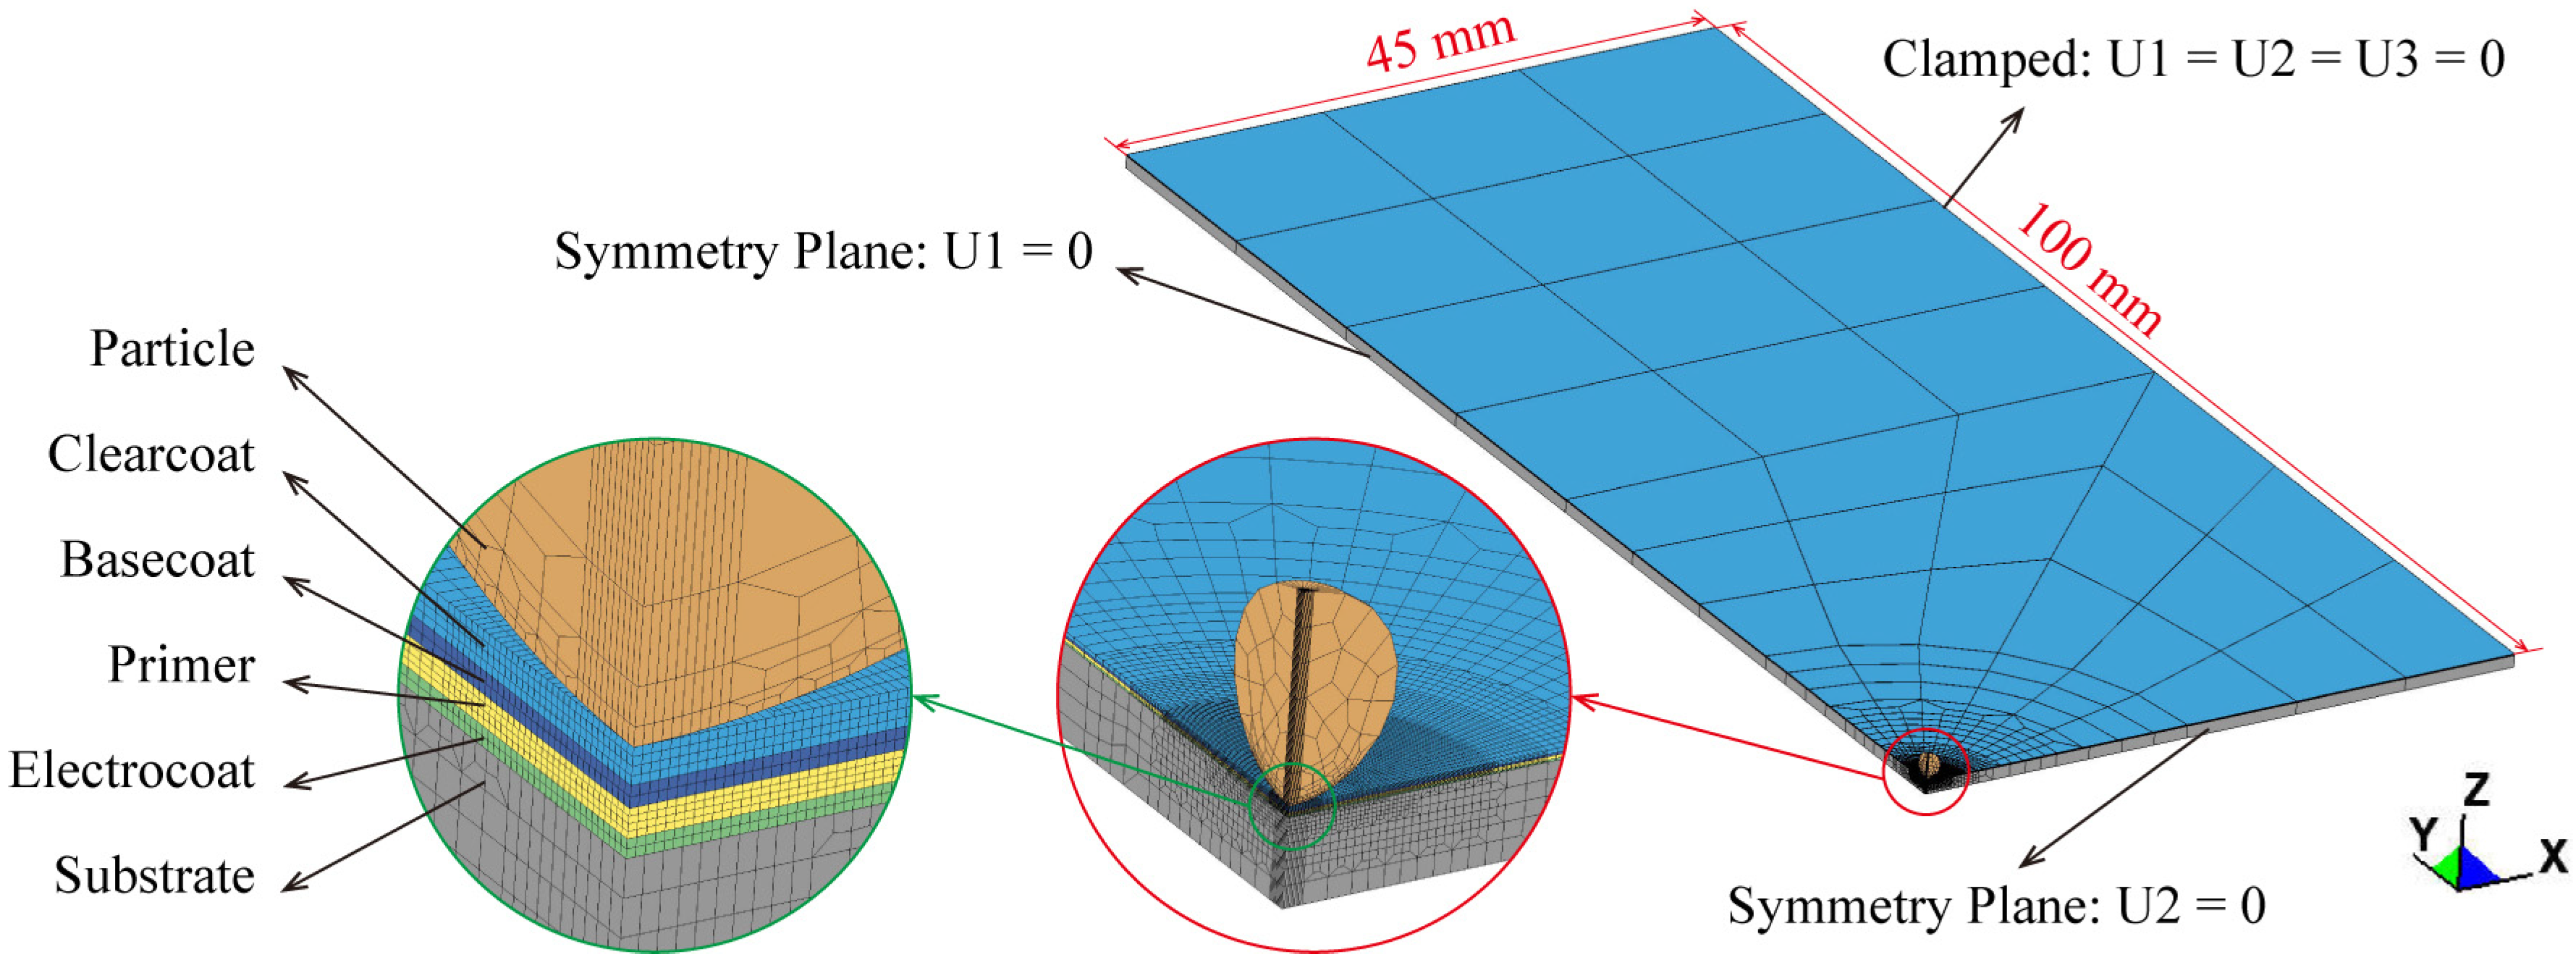
2.2. Finite Element Model
2.2.1. Coating Failure Model
2.2.2. Large Deformation Cohesive Zone Model
2.2.3. Simulation Configuration
3. Results and Discussion
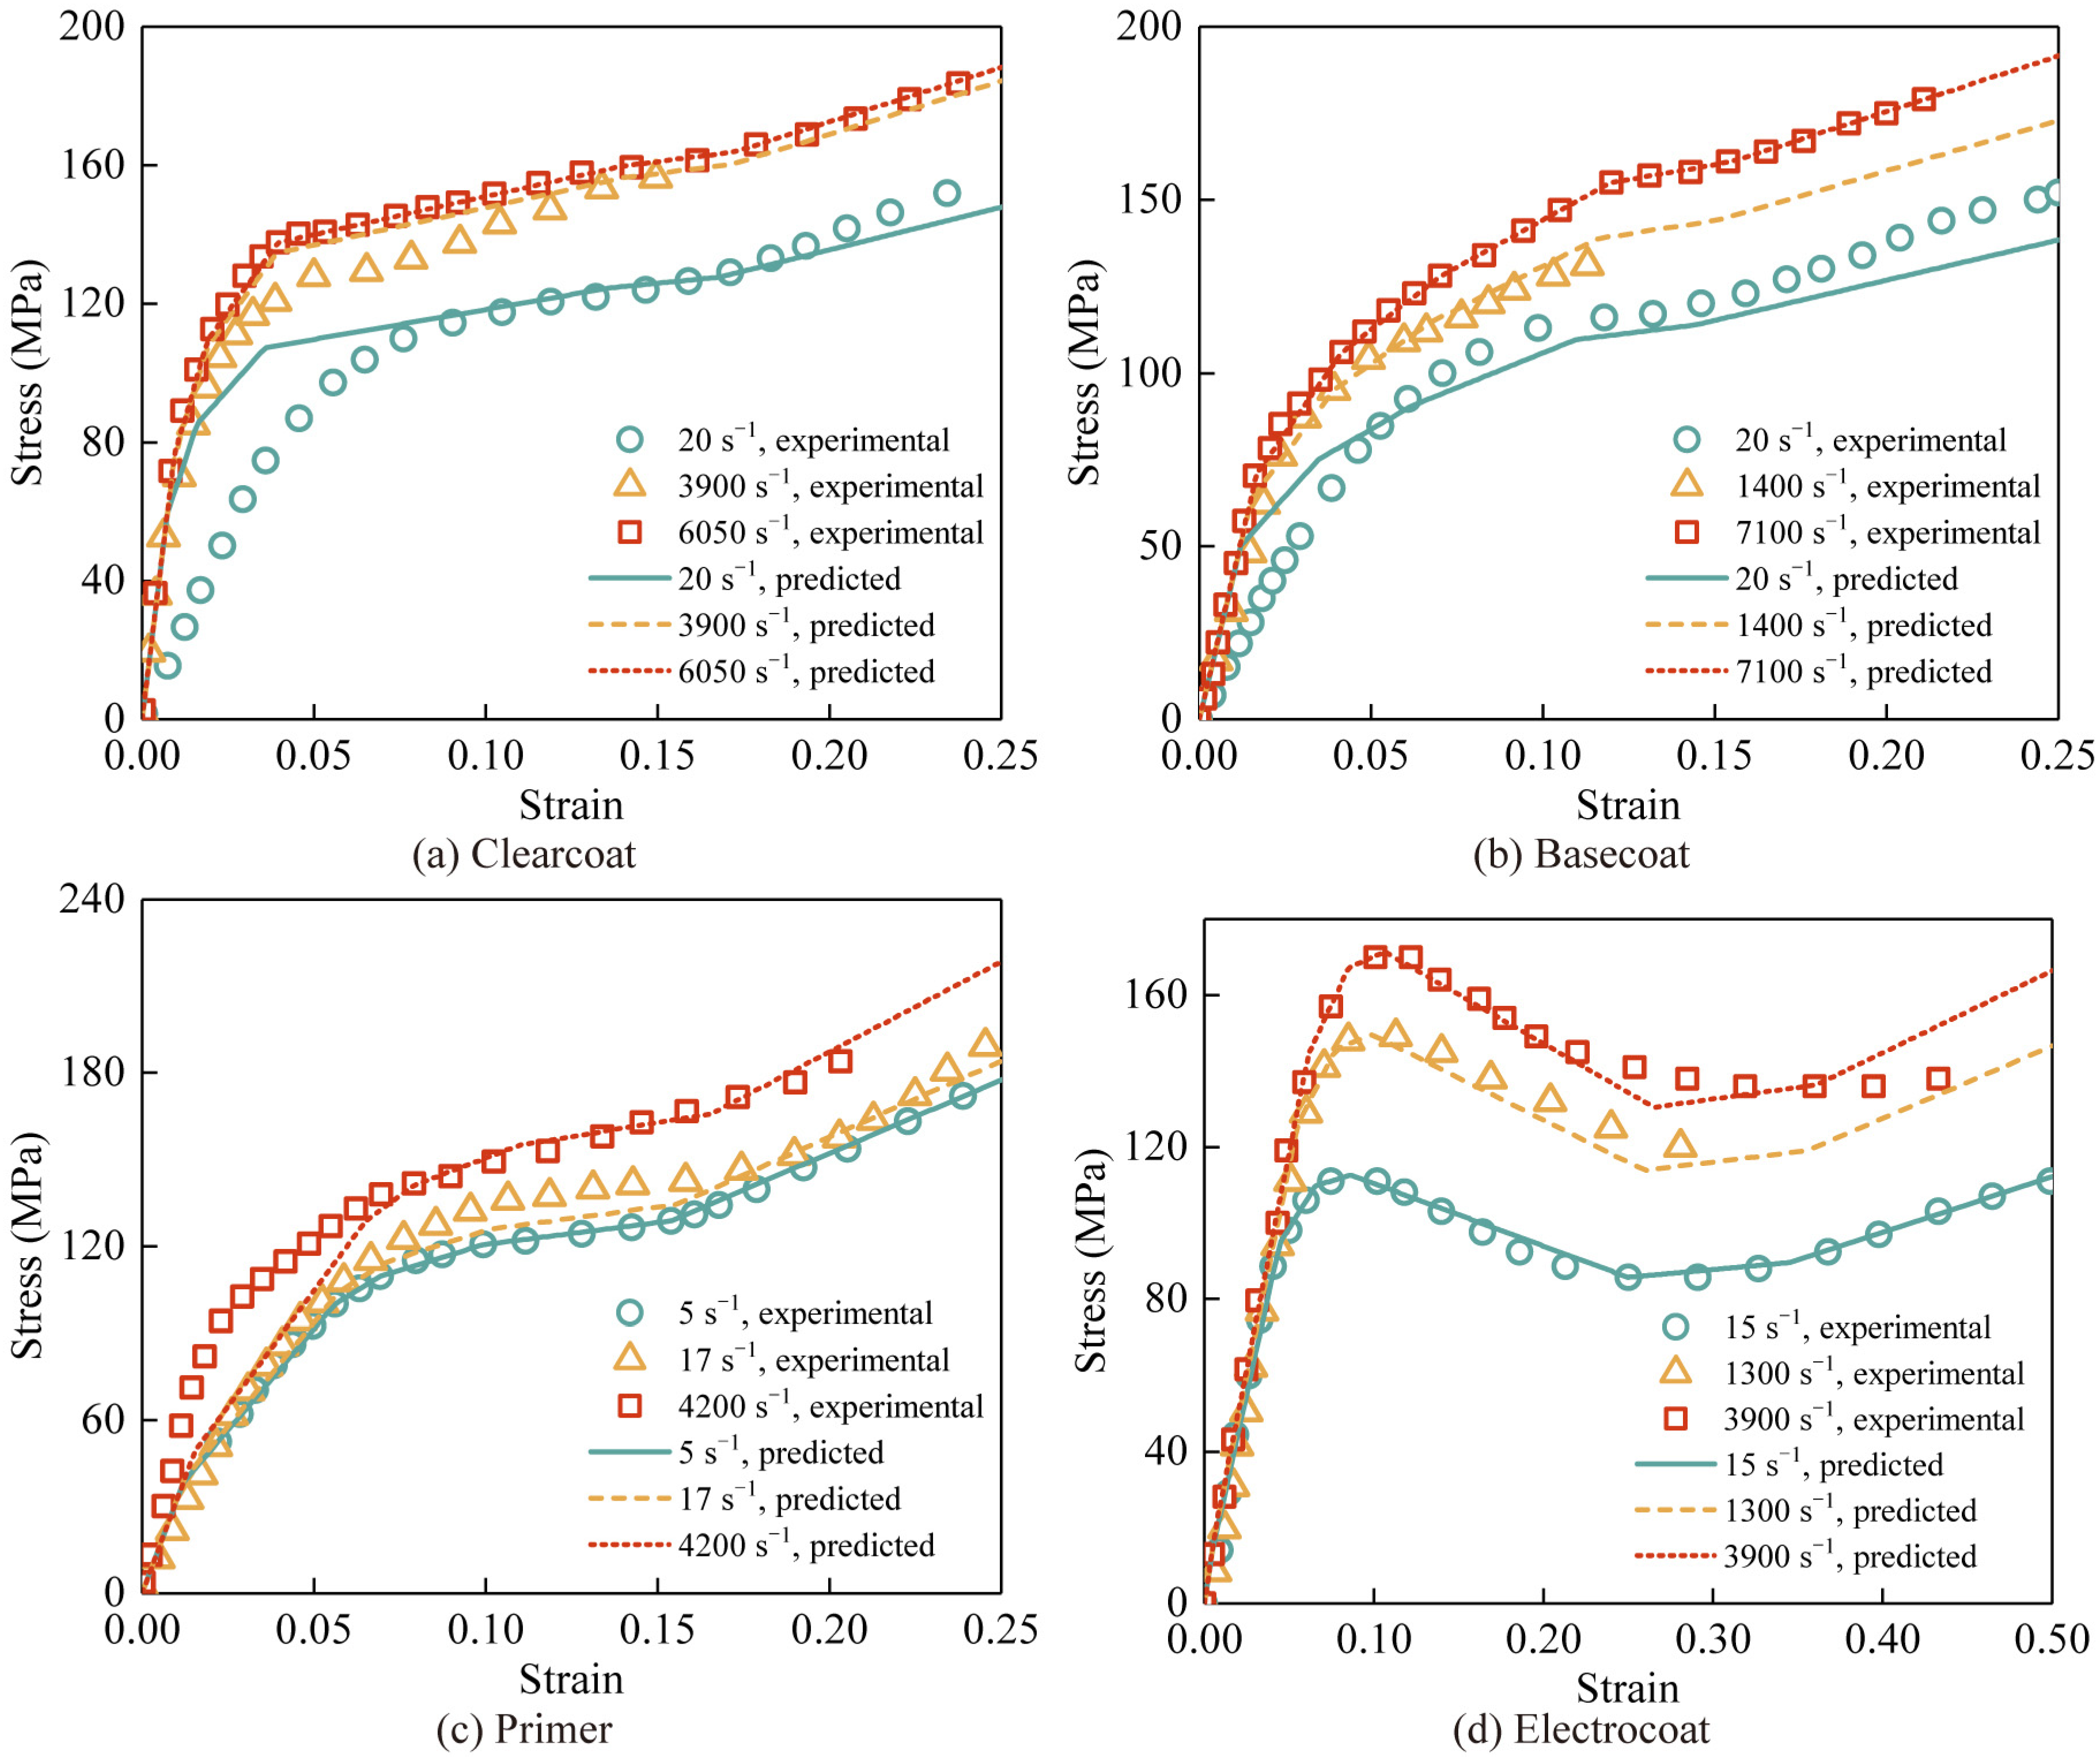
3.1. Experimental Results
3.2. Simulation Results
4. Parametric Studies
4.1. The Effect of Young’s Modulus
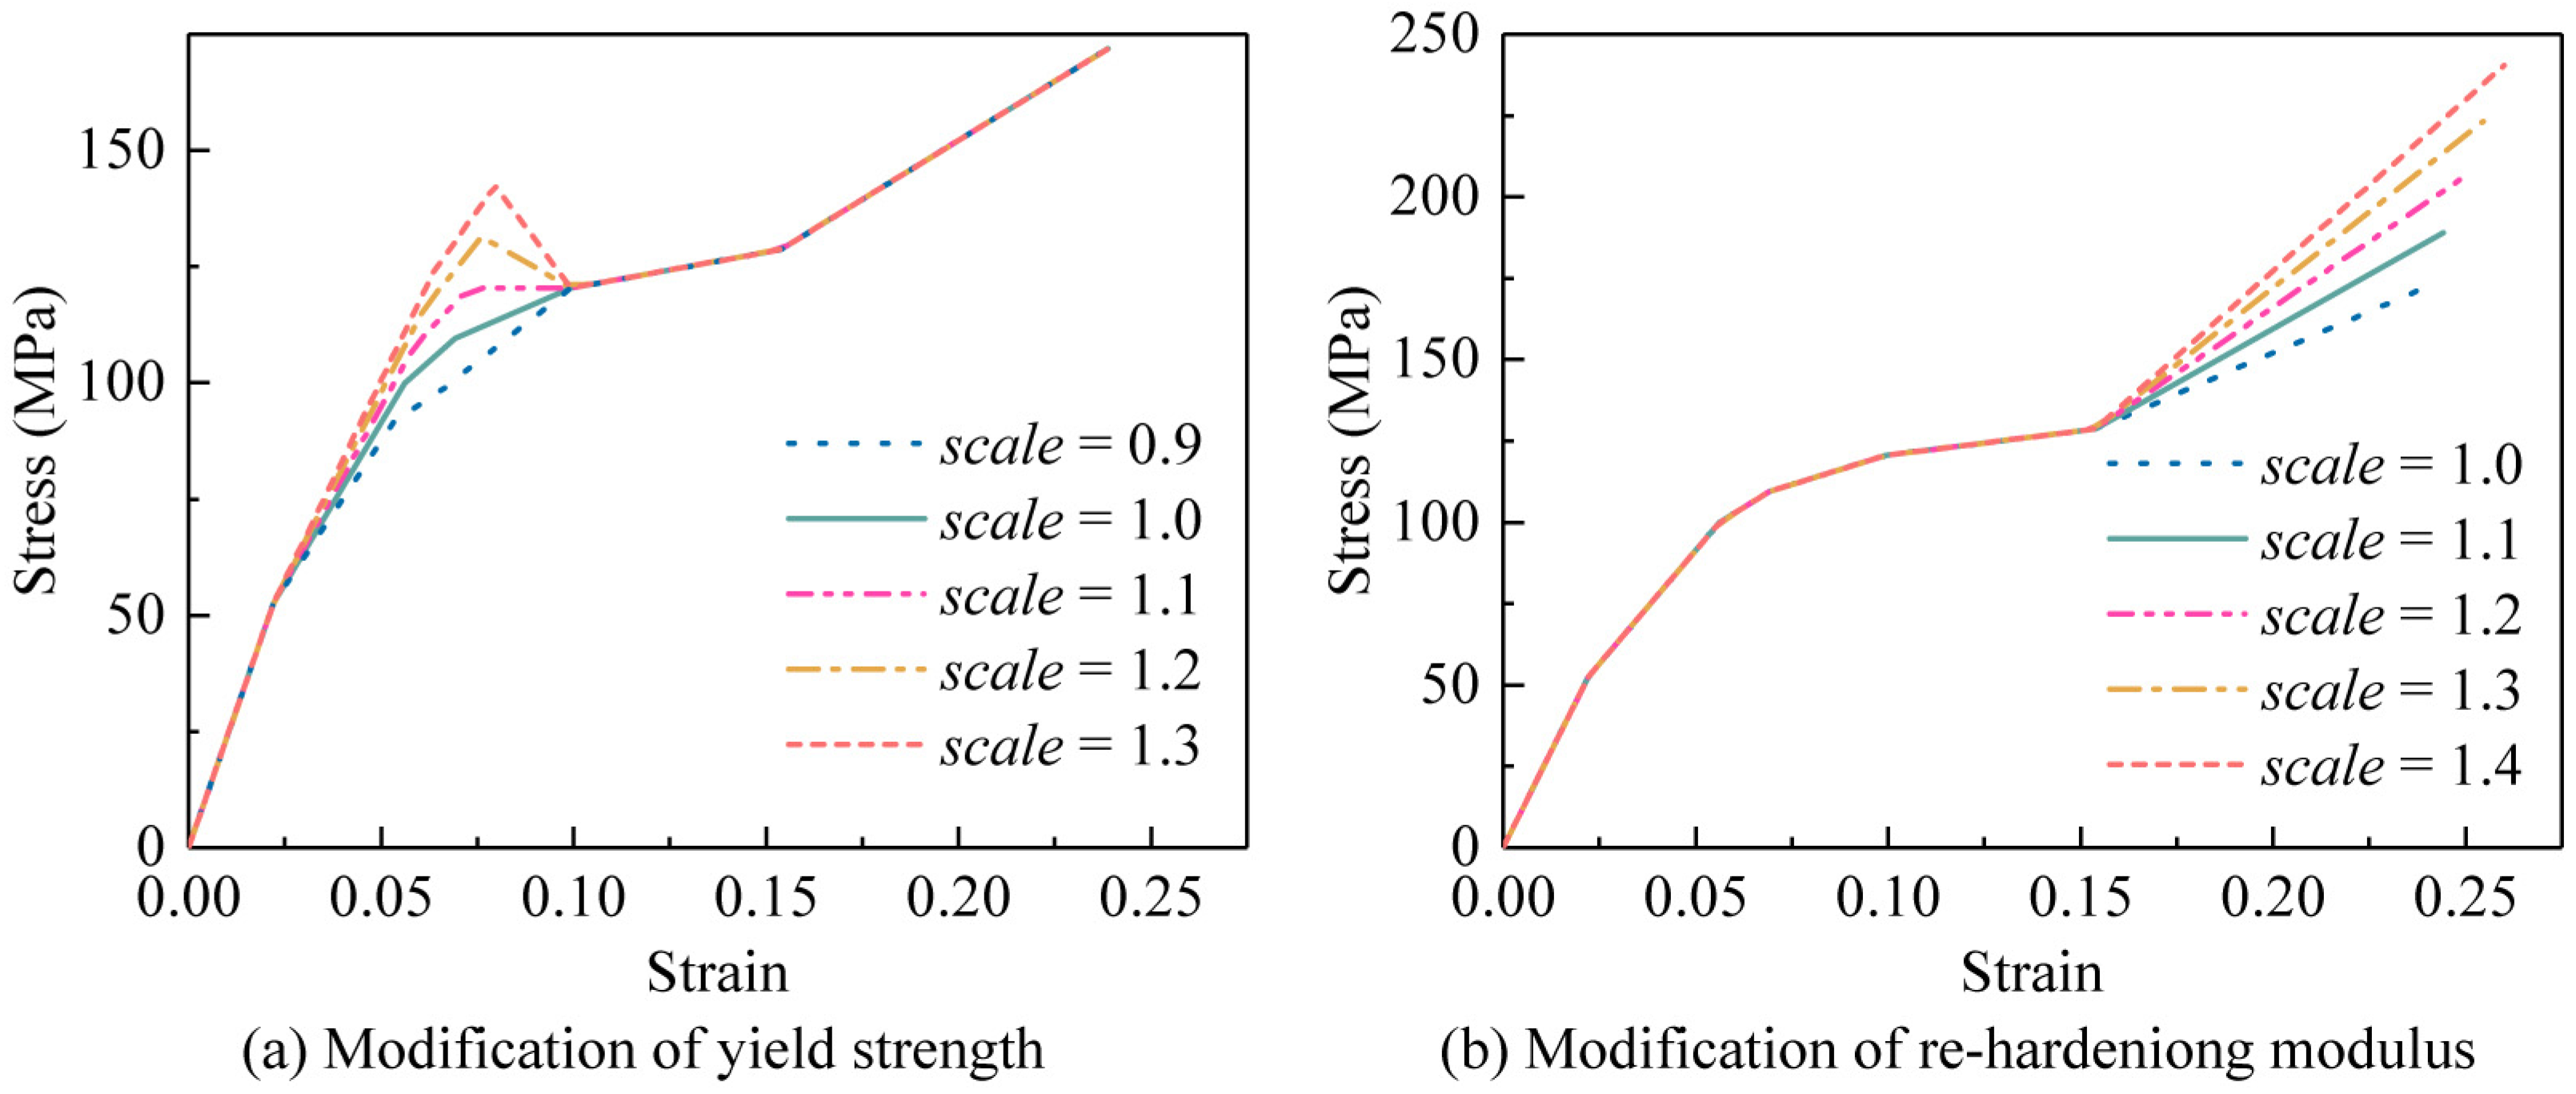
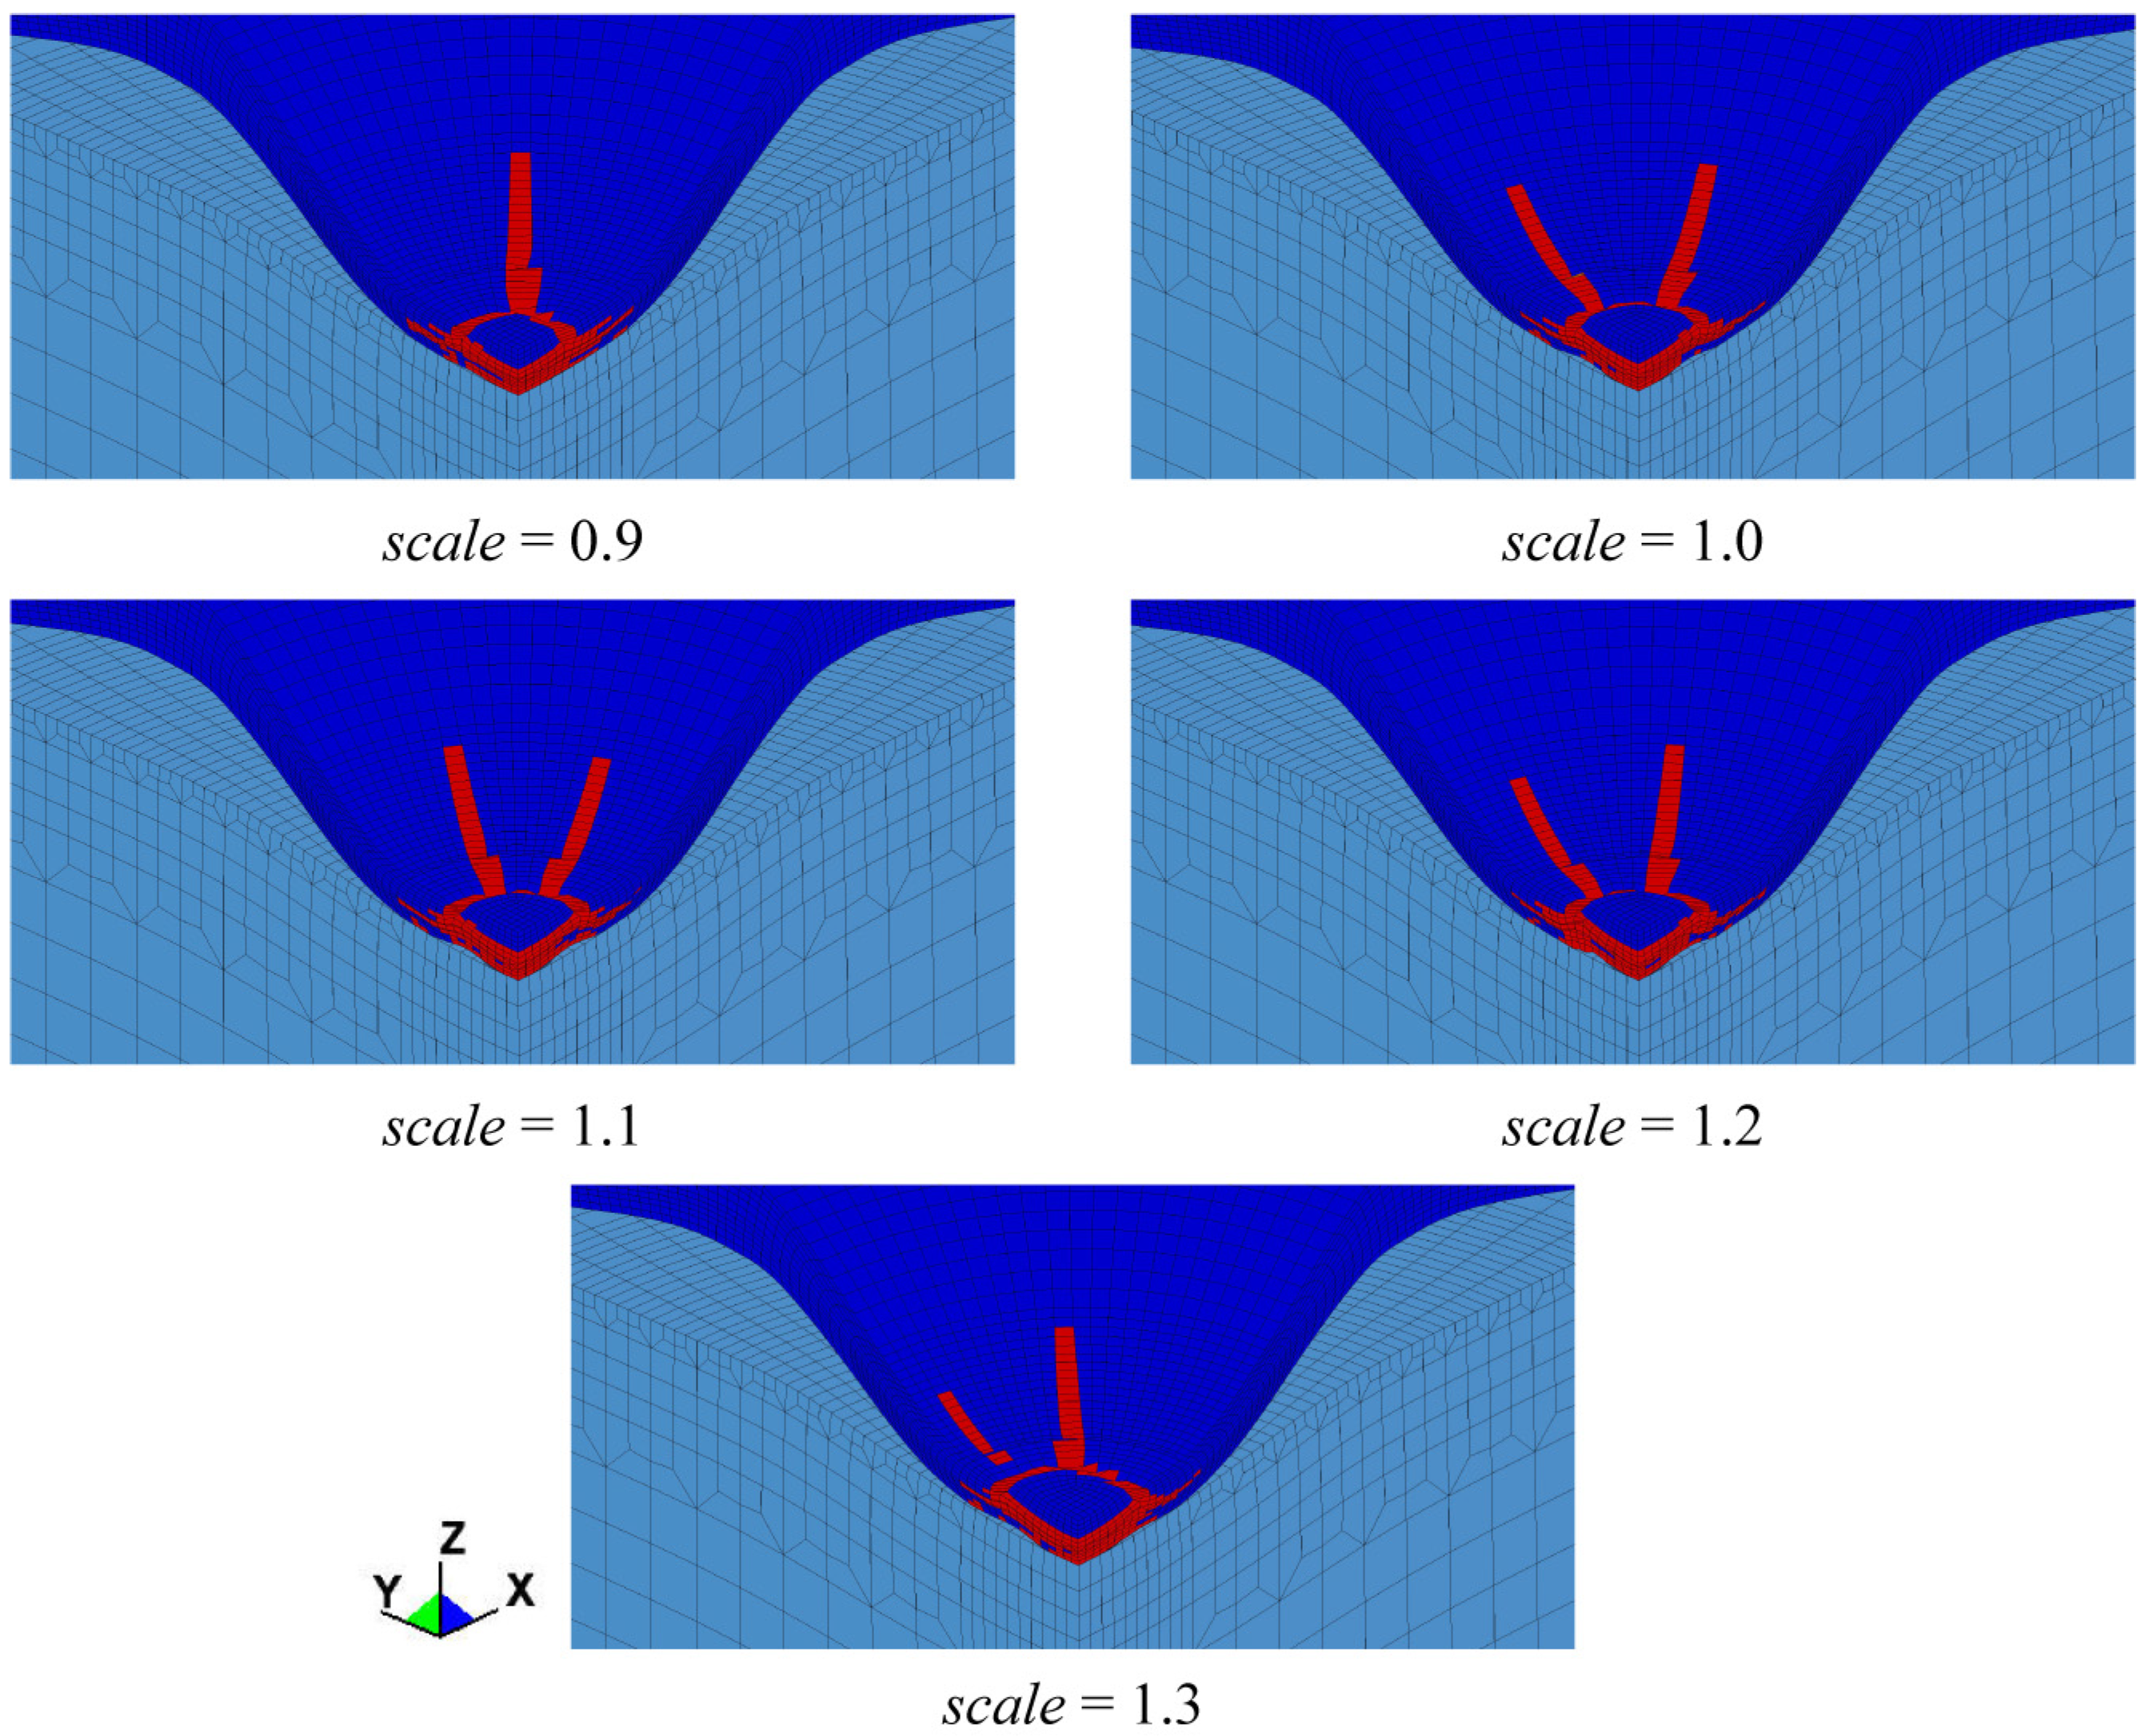
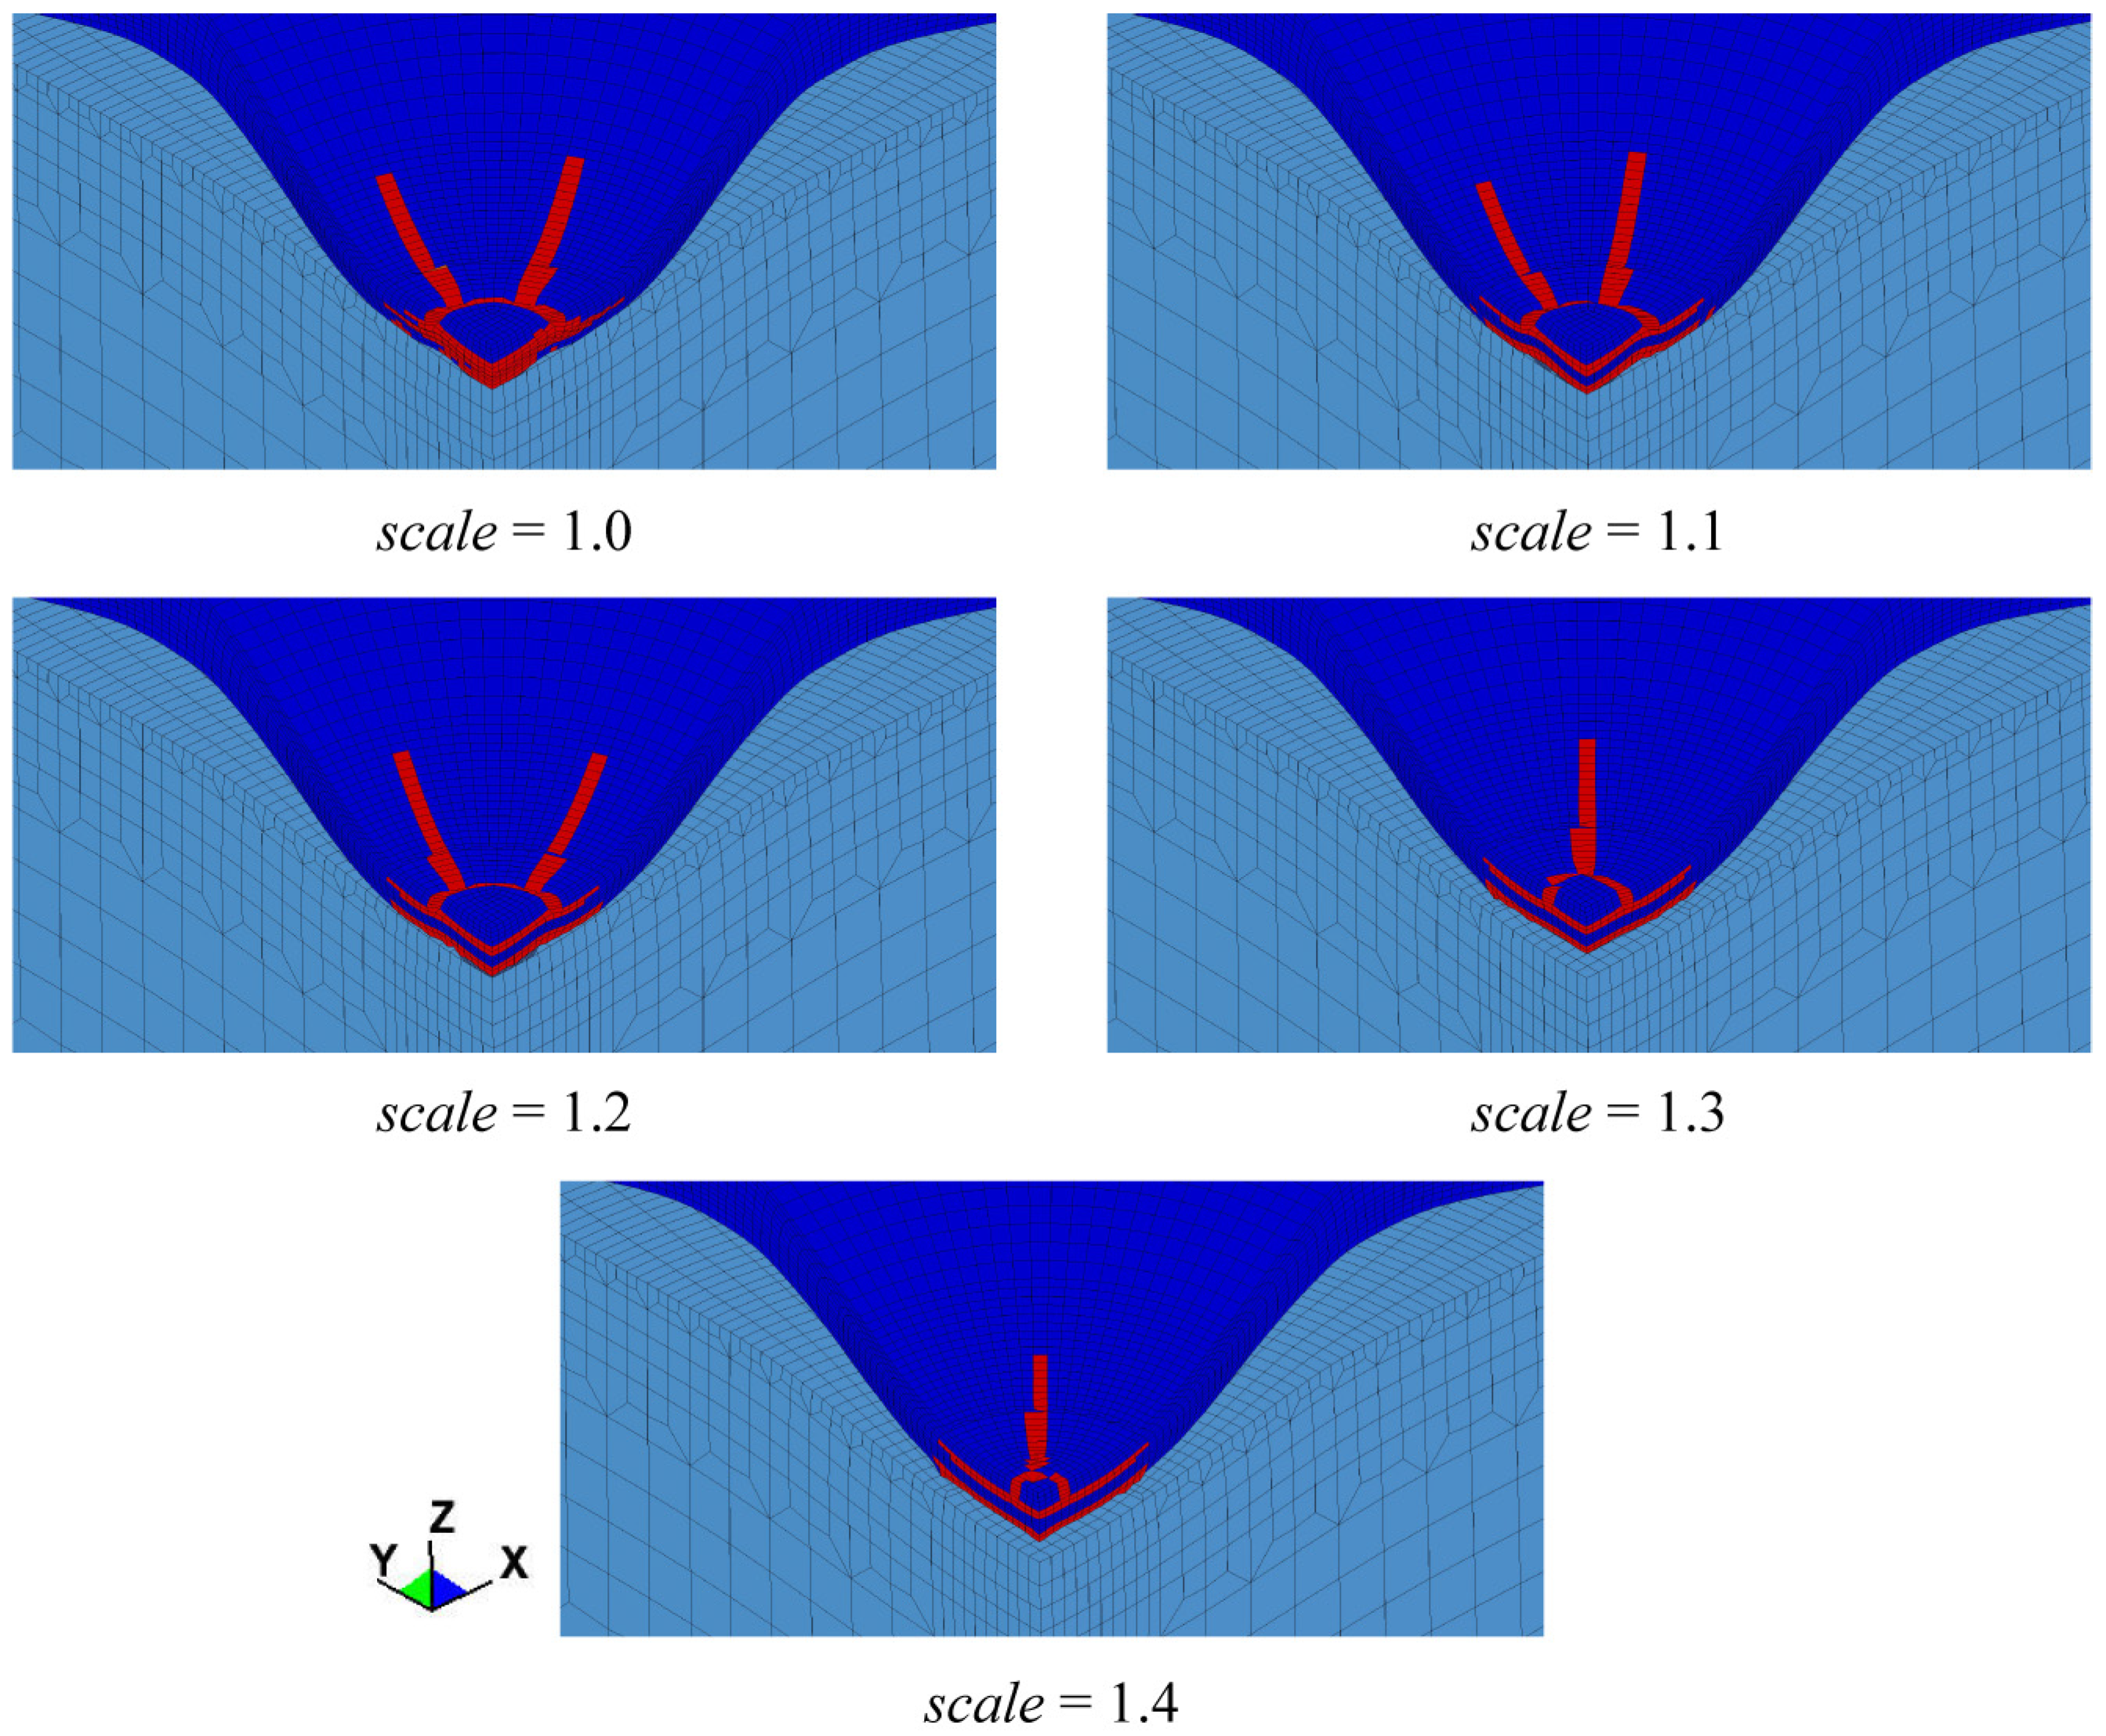
4.2. The Effect of Yield Behavior
5. Conclusions
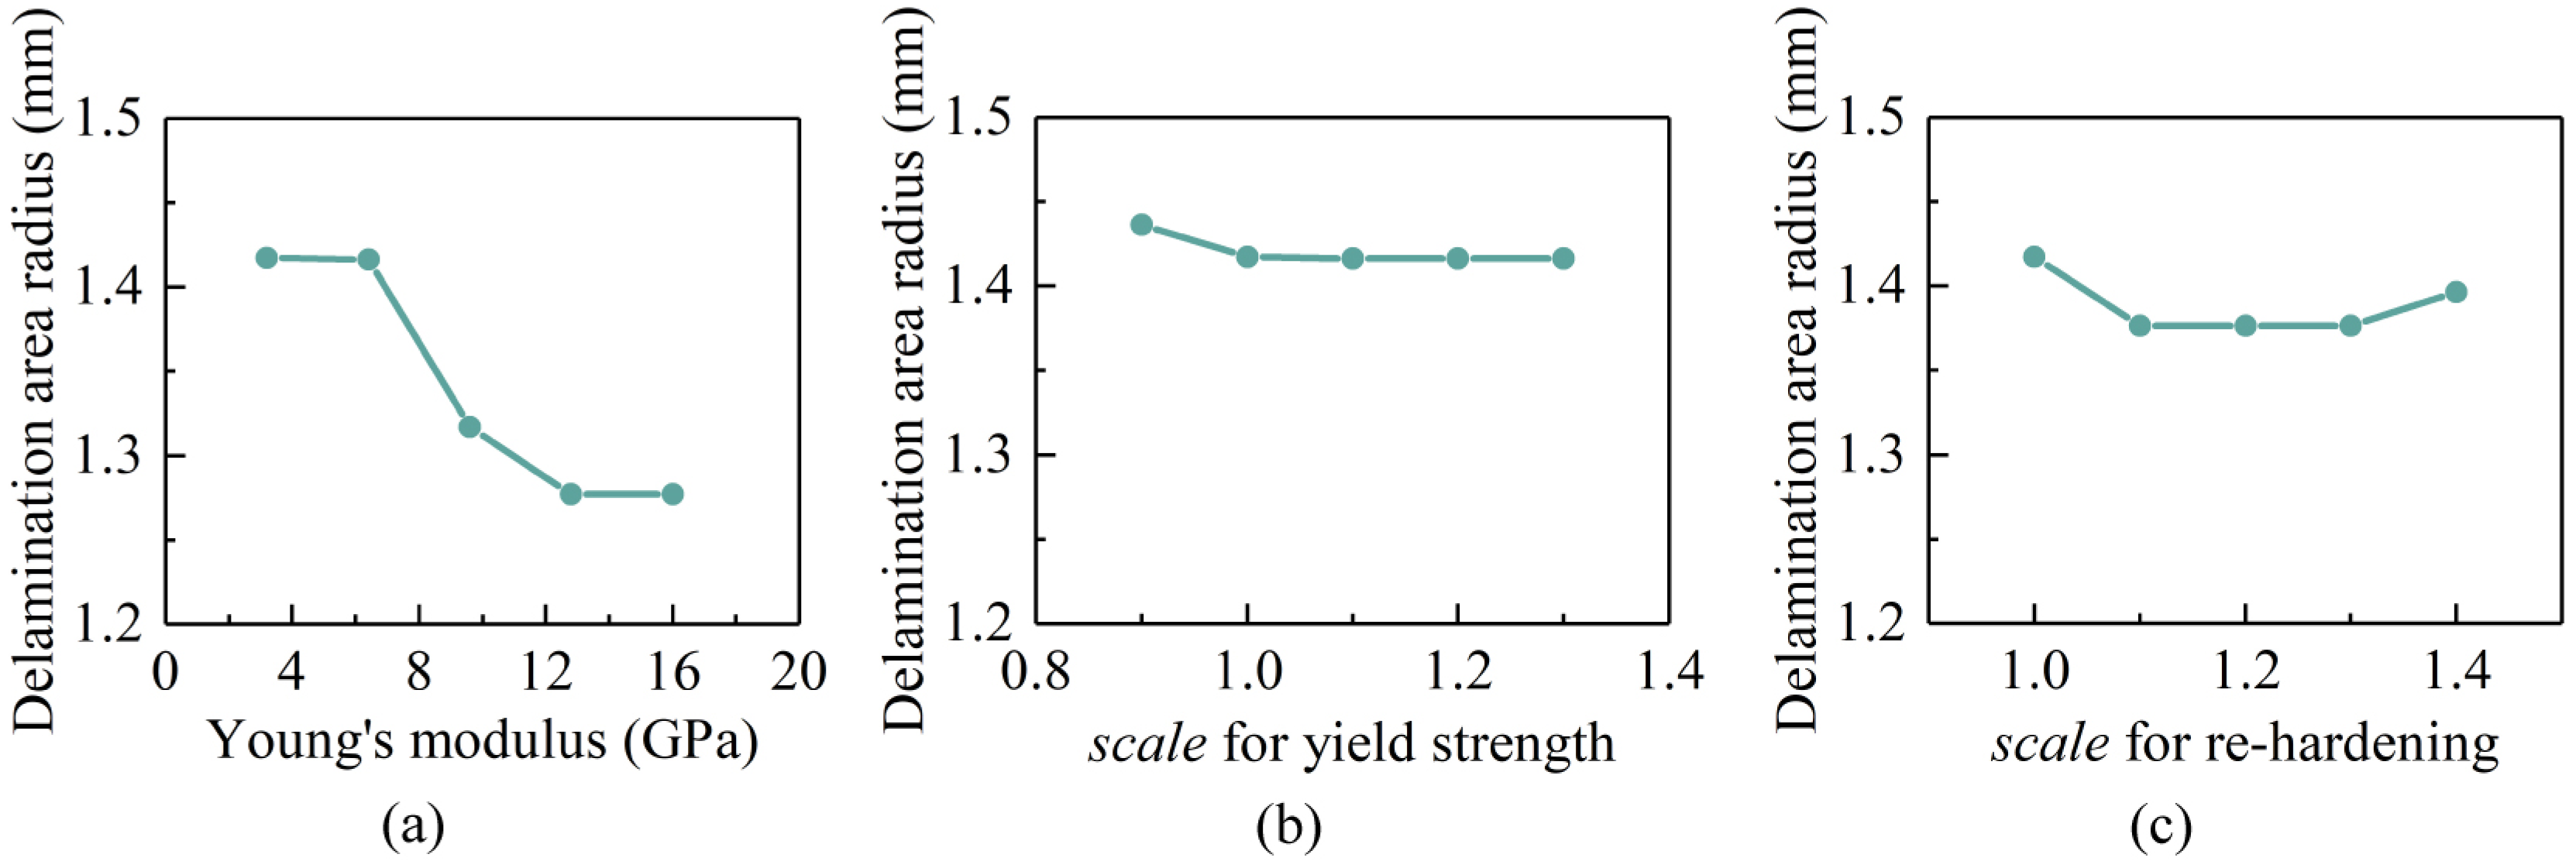
- The increase of Young’s modulus can significantly improve the impact resistance of automotive coatings, which is manifested as the negative correlation between the interlaminar failure area and Young’s modulus.
- Since the resulting von Mises effective stresses on the primer are far higher than its yield strength during the single-impact process, changing the yield strength does not affect the impact resistance of automotive coatings.
- Damage of the primer is sensitive to the re-hardening modulus, and a slight increase in the re-hardening modulus will result in no damage to the primer. However, when the re-hardening modulus reaches a certain value, the effect of further increasing the re-hardening modulus on the impact failure of automotive coatings is negligible.
Author Contributions
Funding
Institutional Review Board Statement
Informed Consent Statement
Data Availability Statement
Conflicts of Interest
References
- DIN 55996-1; Paints and Varnishes—Stone Chip Resistance Test for Coatings—Part 1: Multi Impact Test. Deutsches Institut fur Normung e.V: Berlin, Germany, 2001.
- SAE J400; Test for Chip Resistance of Surface Coatings. Society of Automotive Engineers: New York, NY, USA, 2002.
- Zhaoyong, H. Experimental Study on Mechanical Properties of Automotive Body Coatings. Postgraduate’s Thesis, South China University of Technology, Guangzhou, China, 2020. [Google Scholar]
- Trezona, R.I.; Hutchings, I.M. Resistance of paint coatings to multiple solid particle impact: Effect of coating thickness and substrate material. Prog. Org. Coat. 2001, 41, 85–92. [Google Scholar] [CrossRef]
- Maozhong, Y.; Baiyun, H.; Jiawen, H. Erosion wear behaviour and model of abradable seal coating. Wear 2002, 252, 9–15. [Google Scholar] [CrossRef]
- Wood, R.J.K. The sand erosion performance of coatings. Mater. Des. 1999, 20, 179–191. [Google Scholar] [CrossRef]
- Razin, A.A.; Ramezanzadeh, B.; Yari, H. Detecting and estimating the extent of automotive coating delamination and damage indexes after stone chipping using electrochemical impedance spectroscopy. Prog. Org. Coat. 2016, 92, 95–109. [Google Scholar] [CrossRef]
- Nichols, M.E.; Misovski, T. 3—Instrumented stone chipping of automotive paint systems. In Service Life Prediction of Polymers and Coatings; White, C.C., Nichols, M.E., Pickett, J.E., Eds.; William Andrew Publishing: New York, NY, USA, 2020; ISBN 978-0-12-818367-0. [Google Scholar]
- Liu, Y.; Zou, C.; Zang, M.; Chen, S. Experimental study on mechanical property and stone-chip resistance of automotive coatings. Mater. Res. Express 2022, 9, 16402. [Google Scholar] [CrossRef]
- Zehnder, A.T.; Ramamurthy, A.C.; Bless, S.J.; Brar, N.S. Stone impact damage to automotive paint finishes: Measurement of temperature rise due to impact. Int. J. Impact Eng. 1993, 13, 133–143. [Google Scholar] [CrossRef]
- Ramamurthy, A.C.; Lorenzen, W.I.; Bless, S.J. Stone impact damage to automotive paint finishes: An introduction to impact physics and impact induced corrosion. Prog. Org. Coat. 1994, 25, 43–71. [Google Scholar] [CrossRef]
- Eraky, M.T.; Elmelegy, T.; Shazly, M.; Eltayeb, N.S.M. A combined CFD-SOLID finite element model to study the mechanics of sand erosion damage in coated glass fiber reinforced polymer. In Proceedings of the International Mechanical Engineering Congress and Exposition, Pittsburgh, PA, USA, 9–15 November 2018. [Google Scholar]
- Xiong, S.; Chen, S.; Zang, M.; Makoto, T. Development of an Unresolved CFD-DEM Method for Interaction Simulations Between Large Particles and Fluids. Int. J. Comput. Methods 2021, 18, 2150047. [Google Scholar] [CrossRef]
- Qian, J.; Zou, C.; Zang, M.; Chen, S.; Tsubokura, M. A CFD-DEM-Wear Coupling Method for Stone Chip Resistance of Automotive Coatings with a Rigid Connection Particle Method for Non-Spherical Particles. Comput. Model. Eng. Sci. 2022, 133, 251–280. [Google Scholar] [CrossRef]
- Xiao, G. Research on the Mechanism of Anti-Stone-Damage Automotive Coating Based on Computational Fluid Dynamics Method. Coatings 2022, 12, 295. [Google Scholar] [CrossRef]
- Toi, Y.; Park, J.; Nakai, N.; Hara, Y. Identification of Dynamic Damage Mechanics Models and Tensile Fracture Analysis for Multi-Layer Coatings. Trans. Jpn. Soc. Mech. Eng. Ser. A 2005, 71, 1626–1631. [Google Scholar] [CrossRef]
- Xian, Y.; Toi, Y. Damage Mechanics Simulation of Dynamic Fracture Behaviors of Multi-Layer Coatings by Uncoupled Analysis. Trans. Jpn. Soc. Simul. Technol. 2016, 8, 119–127. [Google Scholar]
- Grujicic, M.; Pandurangan, B.; He, T.; Cheeseman, B.A.; Yen, C.F.; Randow, C.L. Computational investigation of impact energy absorption capability of polyurea coatings via deformation-induced glass transition. Mater. Sci. Eng. A 2010, 527, 7741–7751. [Google Scholar] [CrossRef]
- Zhang, J.; Wang, C.Q.; Kan, Q.H. Finite element analysis for impact debonding mechanisms of polymer coating. Sichuan Daxue Xuebao (Gongcheng Kexue Ban)/J. Sichuan Univ. (Eng. Sci. Ed.) 2012, 44, 122–125. [Google Scholar]
- Xu, X.; Zou, C.; Zang, M.; Chen, S. Development of a GPU parallel computational framework for impact debonding of coating-substrate interfaces. Thin-Walled Struct. 2022, 175, 109270. [Google Scholar] [CrossRef]
- Zhang, N.; Yang, F.; Li, L.; Shen, C.; Castro, J.; Lee, L.J. Thickness effect on particle erosion resistance of thermoplastic polyurethane coating on steel substrate. Wear 2013, 303, 49–55. [Google Scholar] [CrossRef]
- Gong, Y.; Yang, Z.; Wang, Y. Impact Simulation on Ductile Metal Pipe with Polymer Coating by a Coupled Finite Element and Meshfree Method. J. Fail. Anal. Prev. 2012, 12, 267–272. [Google Scholar] [CrossRef]
- Zhang, H.; Li, Z.; He, W.; Liao, B.; He, G.; Cao, X.; Li, Y. Damage evolution and mechanism of TiN/Ti multilayer coatings in sand erosion condition. Surf. Coat. Technol. 2018, 353, 210–220. [Google Scholar] [CrossRef]
- Fallon, C.; Mcshane, G.J. Design of elastomer coatings for concrete impact damage mitigation. Int. J. Impact Eng. 2020, 146, 103700. [Google Scholar] [CrossRef]
- Liu, Y.; Liaw, B. Drop-weight impact tests and finite element modeling of cast acrylic/aluminum plates. Polym. Test 2009, 28, 808–823. [Google Scholar] [CrossRef]
- Zouari, B.; Touratier, M. Identification of an elasto-viscoplastic flow stress in large strains and large strain rates of a paint film from impacts. Int. J. Form. Process. 2005, 2–3, 227–249. [Google Scholar] [CrossRef]
- Cen, H.; Tian, W.; Li, P.; Wei, R. Simulation Analysis on Polyurethane Coating of Wind Blade. J. Shanghai Jiaotong Univ. (Sci.) 2019, 24, 496–499. [Google Scholar] [CrossRef]
- Zouari, B.; Touratier, M. Simulation of organic coating removal by particle impact. Wear 2002, 253, 488–497. [Google Scholar] [CrossRef]
- Zou, C.; Yang, H.; Xu, X.; Zang, M.; Chen, S. Computational modeling of impact failure of polymer coatings. Compos. Struct. 2022, 291, 115576. [Google Scholar] [CrossRef]
- Chen, D.; Sarumi, M.; Al-Hassani, S.T.S.; Gan, S.; Yin, Z. A model for erosion at normal impact. Wear 1997, 205, 32–39. [Google Scholar] [CrossRef]
- Aquaro, D.; Fontani, E. Erosion of ductile and brittle materials. Meccanica 2001, 36, 651–661. [Google Scholar] [CrossRef]
- Finnie, I. Some observations on the erosion of ductile metals. Wear 1972, 19, 81–90. [Google Scholar] [CrossRef]
- Papini, M.; Spelt, J.K. The plowing erosion of organic coatings by spherical particles. Wear 1998, 222, 38–48. [Google Scholar] [CrossRef]
- Ramamurthy, A.C.; Buresh, G.A.; Nagy, M.; Howell, M. Novel instrumentation for evaluating stone impact wear of automotive paint systems. Wear 1999, 225–229, 936–948. [Google Scholar] [CrossRef]
- Papini, M.; Spelt, J.K. Organic coating removal by particle impact. Wear 1997, 213, 185–199. [Google Scholar] [CrossRef]
- Zou, C.; Guo, X.; Xu, X.; Zang, M.; Chen, S. Large deformation delamination in polymer coatings: Discontinuous Galerkin/cohesive zone modeling. Int. J. Mech. Sci. 2022, 232, 107635. [Google Scholar] [CrossRef]
- Wonnemann, H. Primer Surfacer; John Wiley & Sons, Ltd.: New York, NY, USA, 2008; pp. 129–174. [Google Scholar]
- Zhengyi, L. Testing and Analysis of Mechanical Properties for Automotive Coatings. Postgraduate’s Thesis, Southwest Jiaotong University, Chengdu, China, 2009. [Google Scholar]
- Lonyuk, M.; Bosma, M.; Vijverberg, C.A.M.; Bakker, A.; Janssen, M. Relation between chip resistance and mechanical properties of automotive coatings. Prog. Org. Coat. 2008, 61, 308–315. [Google Scholar] [CrossRef]
- Lonyuk, M.; Bosma, M.; Riemslag, A.C.; Zuidema, J.; Bakker, A.; Janssen, M. Stone-impact damage of automotive coatings: A laboratory single-impact tester. Prog. Org. Coat. 2007, 58, 241–247. [Google Scholar] [CrossRef]
- Li, C.; Chenqi, Z.; Mengyan, Z. Simulation Analysis of Impact Damage of Automotive Coatings. In Proceedings of the China SAE Congress and Exhibition (SAECCE), Shanghai, China, 22–24 November 2022. [Google Scholar]
- Nguyen, V.D.; Lani, F.; Pardoen, T.; Morelle, X.P.; Noels, L. A large strain hyperelastic viscoelastic-viscoplastic-damage constitutive model based on a multi-mechanism non-local damage continuum for amorphous glassy polymers. Int. J. Solids Struct. 2016, 96, 192–216. [Google Scholar] [CrossRef]
- Jirásek, M.; Bauer, M. Numerical aspects of the crack band approach. Comput. Struct. 2012, 110–111, 60–78. [Google Scholar] [CrossRef]
- Skamniotis, C.G.; Elliott, M.; Charalambides, M.N. On modelling the constitutive and damage behaviour of highly non-linear bio-composites—Mesh sensitivity of the viscoplastic-damage law computations. Int. J. Plast. 2019, 114, 40–62. [Google Scholar] [CrossRef]
- Lemaitre, J.; Desmorat, R. Engineering Damage Mechanics: Ductile, Creep, Fatigue and Brittle Failures; Springer Science & Business Media: New York, NY, USA, 2006; ISBN 3540272933. [Google Scholar]
- Fleck, N.A.; Stronge, W.J.; Liu, J.H. High strain-rate shear response of polycarbonate and polymethyl methacrylate. Proc. R. Soc. Lond. A Math. Phys. Sci. 1990, 429, 459–479. [Google Scholar]
- Gerlach, R.; Siviour, C.R.; Petrinic, N.; Wiegand, J. Experimental characterisation and constitutive modelling of RTM-6 resin under impact loading. Polymer 2008, 49, 2728–2737. [Google Scholar] [CrossRef]
- Mirghaderi, H.; Rahbar Ranji, A.; Fadavie, M. The effect of epoxy coating on the fatigue strength of grade-A mild steel. J. Adhes. Sci. Technol. 2021, 36, 1847–1857. [Google Scholar] [CrossRef]
- Islam, M.S.; Tong, L. Effects of initial blister radius and shaft diameter on energy release rate of metal-polymer composite coating. Int. J. Adhes. Adhes. 2015, 62, 107–123. [Google Scholar] [CrossRef]
- Zou, Z.; Lee, H. A cohesive zone model taking account of the effect of through-thickness compression. Compos. Part A Appl. Sci. Manuf. 2017, 98, 90–98. [Google Scholar] [CrossRef]
- Fischer, K.A.; Wriggers, P. Frictionless 2D Contact formulations for finite deformations based on the mortar method. Comput. Mech. 2005, 36, 226–244. [Google Scholar] [CrossRef]
- Farah, P.; Popp, A.; Wall, W.A. Segment-based vs. element-based integration for mortar methods in computational contact mechanics. Comput. Mech. 2015, 55, 209–228. [Google Scholar] [CrossRef]
- Ryntz, R.A.; Everson, M. Friction induced paint damage as affected by clearcoat chemistry. Prog. Org. Coat. 1997, 31, 281–288. [Google Scholar] [CrossRef]
- Ledbetter, H.M.; Weston, W.F.; Naimon, E.R. Low-temperature elastic properties of four austenitic stainless steels. J. Appl. Phys. 1975, 46, 3855–3860. [Google Scholar] [CrossRef]
- Ledbetter, H.M.; Frederick, N.V.; Austin, M.W. Elastic-constant variability in stainless-steel 304. J. Appl. Phys. 1980, 51, 305–309. [Google Scholar] [CrossRef]
- Xingxing, W.; Jianhu, L.; Lunping, Z.; Liping, M.; Jun, W. Numerical simulation analysis of petaling formation process of plate penetrated by sharp-nosed missile. Chin. J. Ship Res. 2018, 3, 110–117. [Google Scholar]
- Rumzan, I.; Williams, J.G. Compressive stress-strain properties of automotive paints over a range of strain rates and temperatures. Polymer 2000, 41, 4291–4307. [Google Scholar] [CrossRef]
- Jordan, J.L.; Foley, J.R.; Siviour, C.R. Mechanical properties of Epon 826/DEA epoxy. Mech. Time-Depend. Mater. 2008, 12, 249–272. [Google Scholar] [CrossRef]


| Part | Clearcoat | Basecoat | Primer | Electrocoat | Substrate |
|---|---|---|---|---|---|
| Thickness (mm) | 0.0387 | 0.0229 | 0.0308 | 0.0199 | 0.850 |
| Main ingredient | Solvent-based acrylic resin. | Waterborne acrylic resin. | Waterborne polyester resin. | Epoxy resin. | Cold rolled steel. |
| Preparation process | (1) Sprayed with ABB robot. (2) Let it sit for 7 min. (3) Baked at 140 °C for 30 min. | (1) Sprayed with ABB robot. (2) Pre-dried at 80 °C for 5 min. (3) Cooled down to room temperature. | (1) Sprayed with ABB robot. (2) Pre-dried at 80 °C for 5 min. (3) Baked at 150 °C for 30 min. | (1) Electrophoresis process. (2) Cleaned with ionic water. (3) Baked at 150 °C for 30 min. | - |
| Paint Film | (MPa) | Gc,1 (N/m) | Gc,2 (N/m) | |
|---|---|---|---|---|
| Clearcoat | 400 | 1.3 | 290 | 15 |
| Basecoat | 310 | 1.06 | 85 | 16 |
| Primer | 330 | 0.92 | 180 | 13 |
| Electrocoat | 350 | 1.23 | 220 | 10 |
| Part | Material Model | Parameters |
|---|---|---|
| Clearcoat | Strain-rate-dependent piecewise-linear-plastic model | ρ = 1325 kg/m3, E = 8.1 GPa, v = 0.15, CCS = 3.2476 ms−1, PCS = 10.2033 |
| Basecoat | Strain-rate-dependent piecewise-linear-plastic model | ρ = 903 kg/m3, E = 4.5 GPa, v = 0.15, CCS = 1.558 ms−1, PCS = 7.7133 |
| Primer | Strain-rate-dependent piecewise-linear-plastic model | ρ = 1663 kg/m3, E = 3.2 GPa, v = 0.15, CCS = 2.5461 × 10⁻⁶ ms−1, PCS = 17.392 |
| Electrocoat | Strain-rate-dependent piecewise-linear-plastic model | ρ = 1435 kg/m3, E = 2.96 GPa, v = 0.15, CCS = 12.3505 ms−1, PCS = 2.8723 |
| Particle [54,55] | Linear elastic model | ρ = 7860 kg/m3, E = 199.6 GPa, v = 0.29 |
| Substrate [49,56] | Johnson–Cook model | ρ = 7860 kg/m3, E = 210 GPa, v = 0.29, A = 610 MPa, B = 425 MPa, C = 0.03, n = 0.547, = 1.68 ms−1 |
| Clearcoat | Basecoat | Primer | Electrocoat | ||||
|---|---|---|---|---|---|---|---|
| Effective Plastic Strain | Yield Stress (MPa) | Effective Plastic Strain | Yield Stress (MPa) | Effective Plastic Strain | Yield Stress (MPa) | Effective Plastic Strain | Yield Stress (MPa) |
| 0.00008 | 37.2353 | 0 | 2.7105093 | 0.005724 | 20.60382 | 0 | 12.772 |
| 0.0055191 | 53.113362 | 0.000598 | 31.66019 | 0.024861 | 39.24316 | 0.0125 | 86.33883 |
| 0.0225235 | 66.738064 | 0.0179 | 47.805988 | 0.03502 | 43.01446 | 0.02835 | 100.1326 |
| 0.120563 | 77.49831 | 0.0418 | 57.72799 | 0.061612 | 47.30946 | 0.04835 | 102.6869 |
| 0.1519405 | 79.43251 | 0.0852 | 69.904982 | 0.113637 | 50.54532 | 0.221 | 78.15169 |
| 0.21885 | 89.99594 | 0.119 | 72.61098 | 0.18513 | 67.48708 | 0.315 | 81.70818 |
| - | - | 0.171 | 80.72898 | - | - | 0.4285 | 97.575623 |
| Elements (at.%) | Clearcoat | Basecoat | Primer | Electrocoat |
|---|---|---|---|---|
| C | 74.89 | 77.11 | 57.38 | 70.84 |
| O | 24.92 | 19.05 | 33.64 | 23.90 |
| Ti | - | - | 6.63 | 1.58 |
| Al | 0.19 | 3.11 | 0.23 | 1.74 |
| Si | - | - | 0.95 | 1.59 |
| Others | - | 0.73 | 1.17 | 0.35 |
| Elements (at.%) | Region I | Region II | Region III |
|---|---|---|---|
| C | 38.68 | 54.11 | 63.68 |
| O | 19.63 | 28.89 | 28.50 |
| Ti | 37.47 | 14.54 | 4.28 |
| Al | 0.46 | 0.69 | 1.42 |
| Si | 1.41 | 0.73 | 1.55 |
| Others | 2.35 | 1.04 | 0.57 |
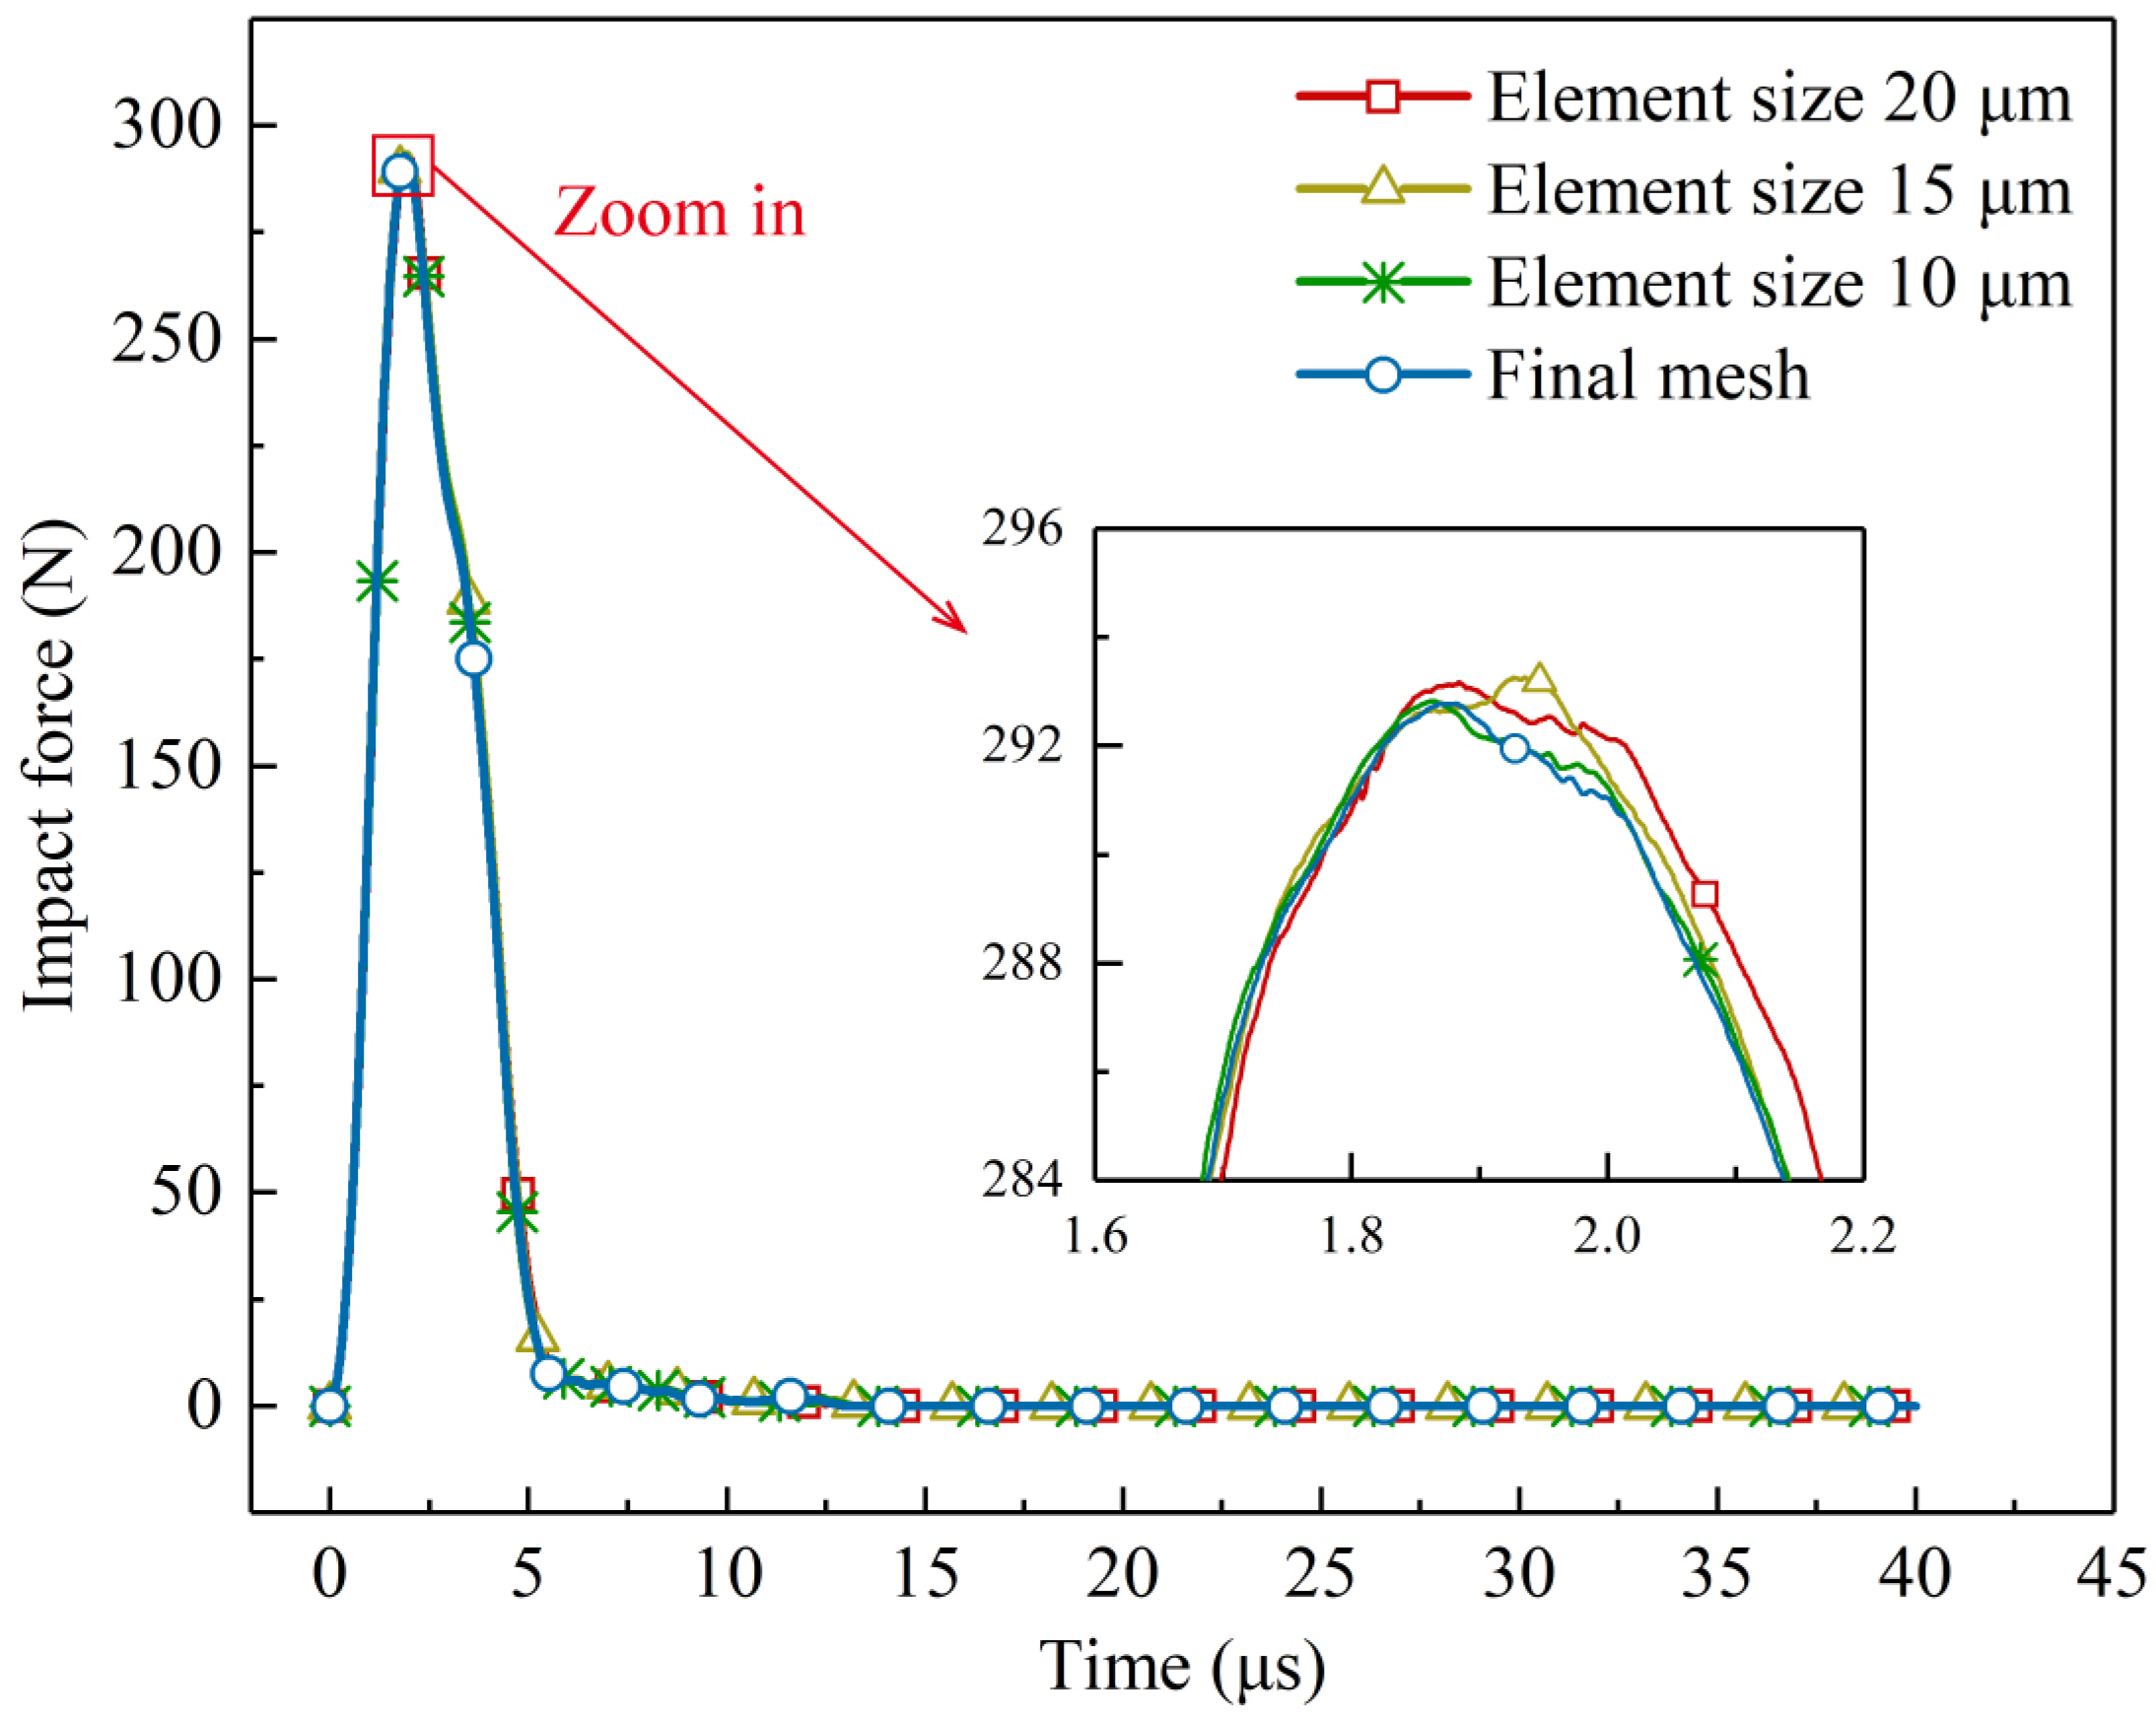
| Mesh | 20 μm | 15 μm | 10 μm | Final Mesh |
|---|---|---|---|---|
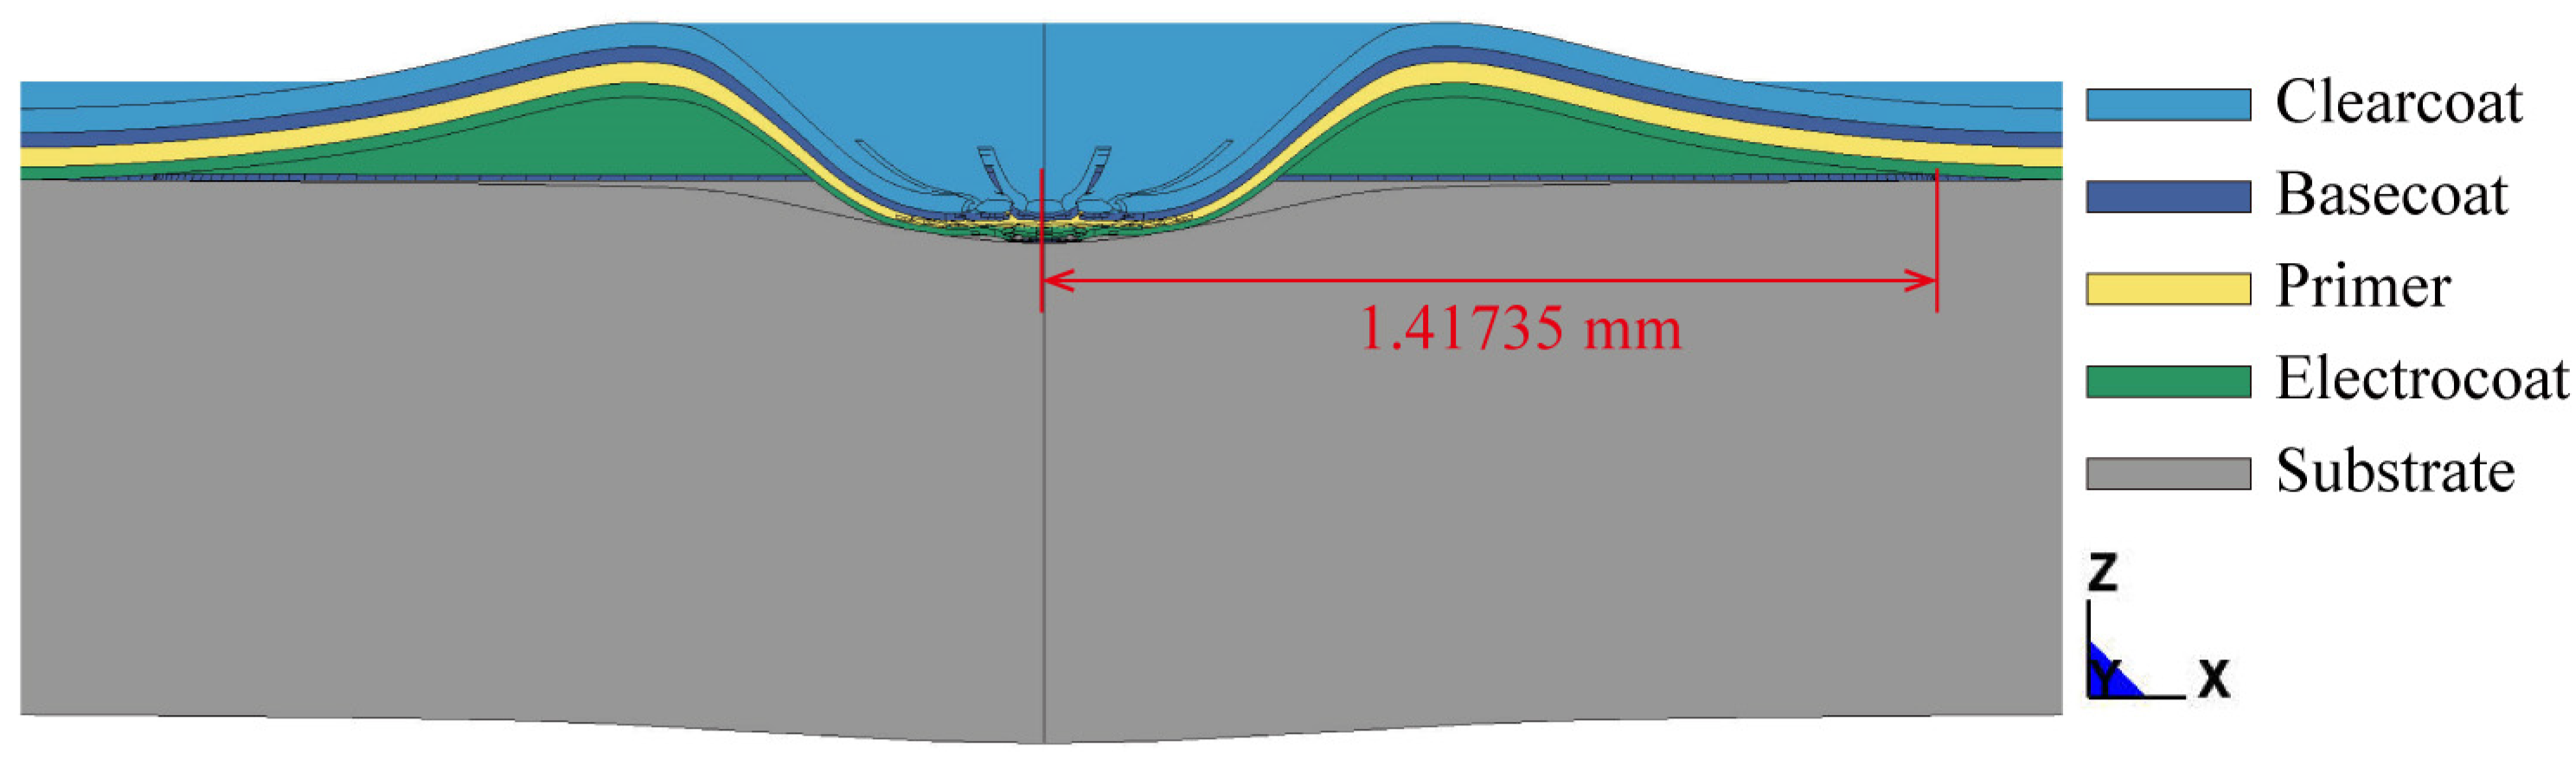
| Delamination area radius (mm) | 1.49654 | 1.48854 | 1.49657 | 1.41735 |
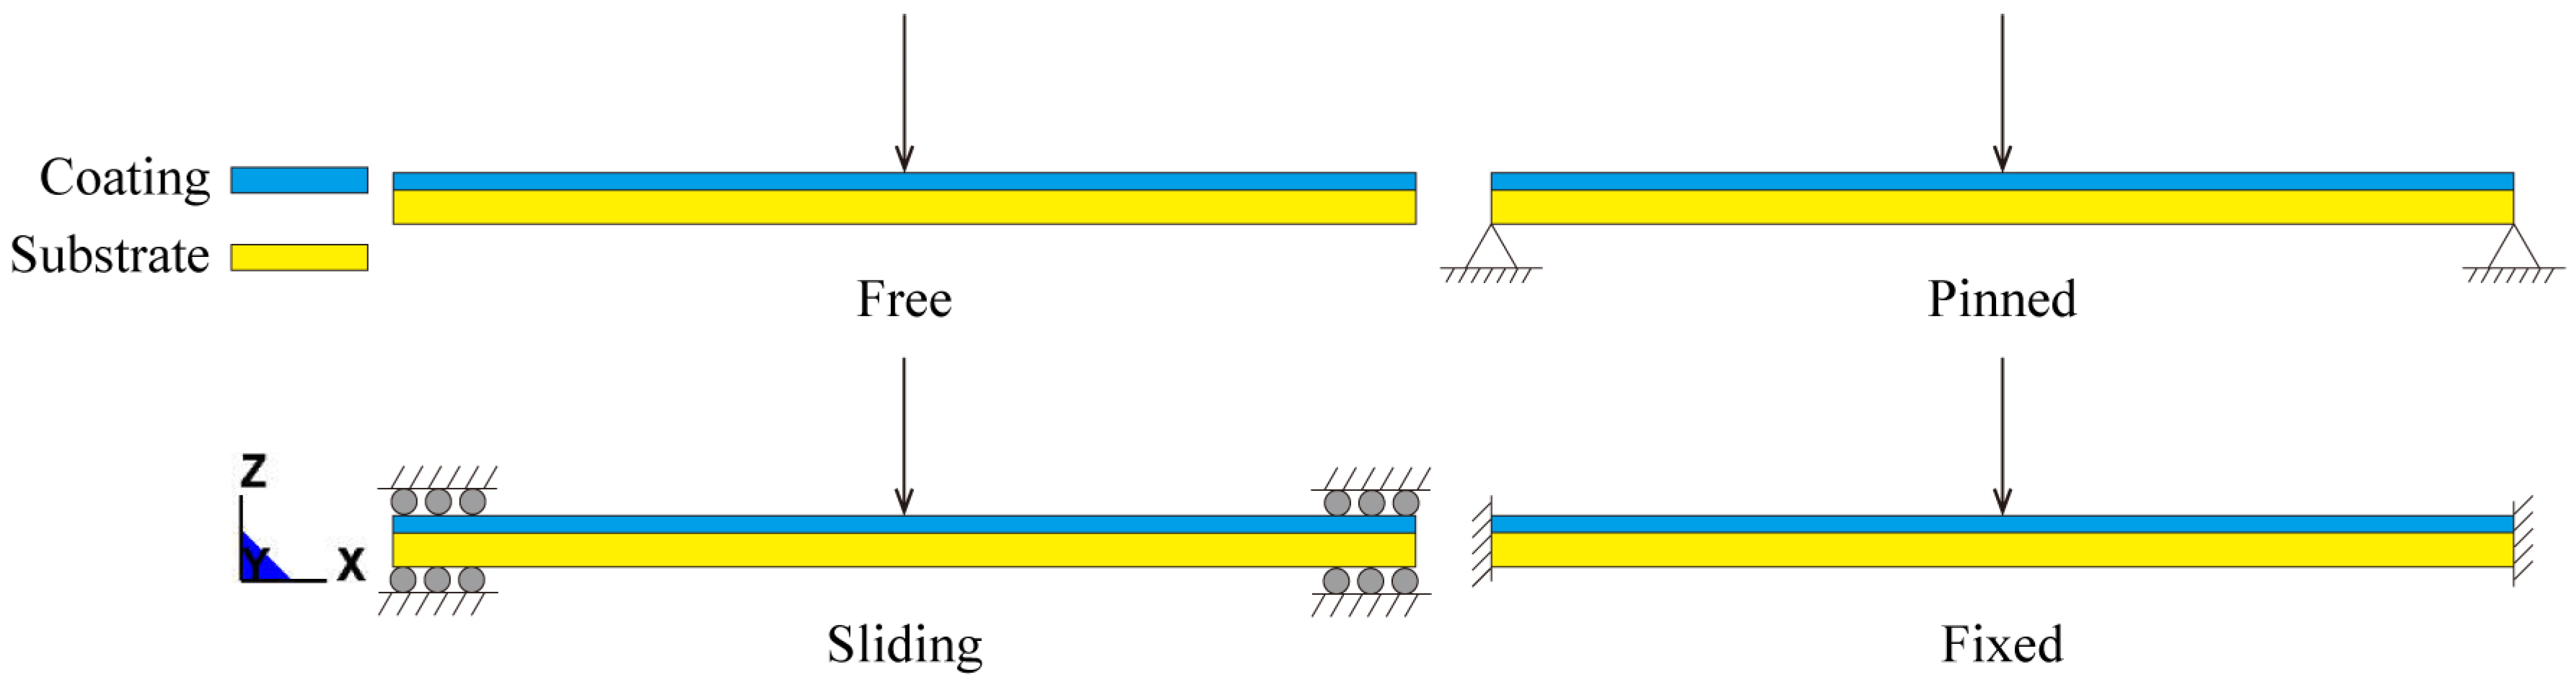
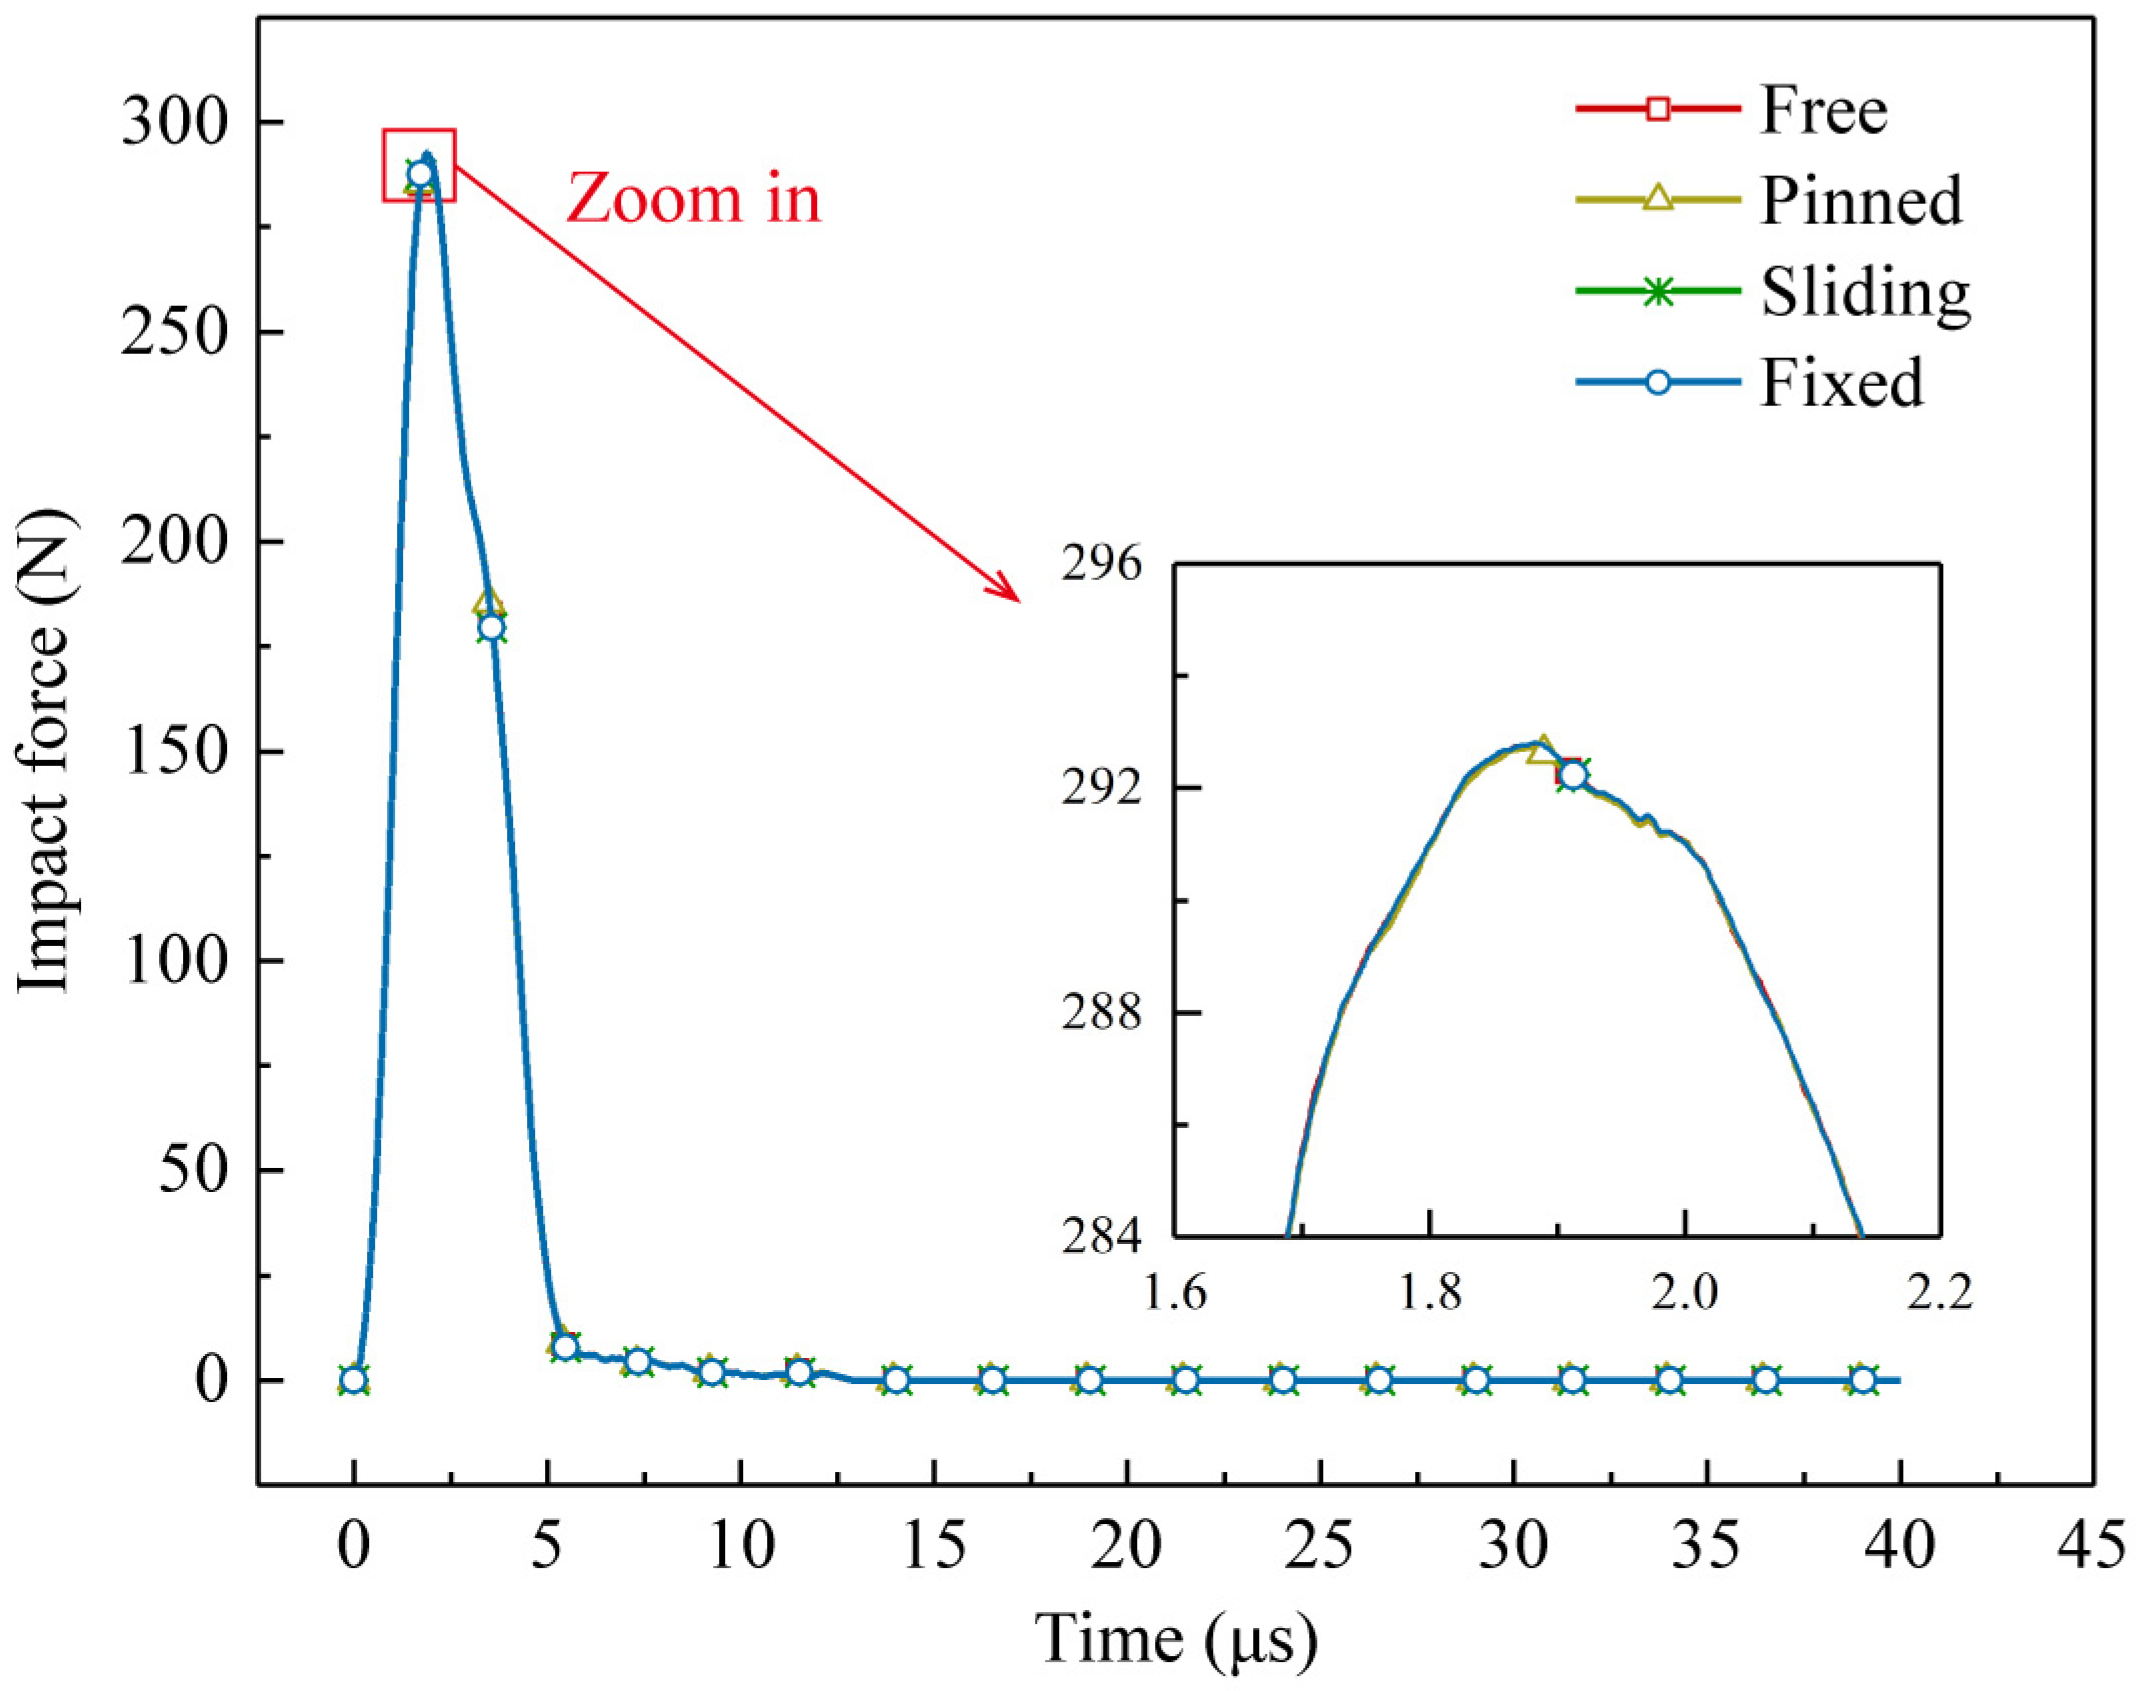
| Boundary Condition | Free | Pinned | Sliding | Fixed |
|---|---|---|---|---|
| Delamination area radius (mm) | 1.43639 | 1.43640 | 1.43638 | 1.41735 |
Disclaimer/Publisher’s Note: The statements, opinions and data contained in all publications are solely those of the individual author(s) and contributor(s) and not of MDPI and/or the editor(s). MDPI and/or the editor(s) disclaim responsibility for any injury to people or property resulting from any ideas, methods, instructions or products referred to in the content. |
© 2023 by the authors. Licensee MDPI, Basel, Switzerland. This article is an open access article distributed under the terms and conditions of the Creative Commons Attribution (CC BY) license (https://creativecommons.org/licenses/by/4.0/).
Share and Cite
Chen, L.; Zou, C.; Zang, M.; Chen, S. Single-Impact Failure of Multi-Layered Automotive Coatings: A Finite Element-Based Study. Coatings 2023, 13, 309. https://doi.org/10.3390/coatings13020309
Chen L, Zou C, Zang M, Chen S. Single-Impact Failure of Multi-Layered Automotive Coatings: A Finite Element-Based Study. Coatings. 2023; 13(2):309. https://doi.org/10.3390/coatings13020309
Chicago/Turabian StyleChen, Li, Chenqi Zou, Mengyan Zang, and Shunhua Chen. 2023. "Single-Impact Failure of Multi-Layered Automotive Coatings: A Finite Element-Based Study" Coatings 13, no. 2: 309. https://doi.org/10.3390/coatings13020309
APA StyleChen, L., Zou, C., Zang, M., & Chen, S. (2023). Single-Impact Failure of Multi-Layered Automotive Coatings: A Finite Element-Based Study. Coatings, 13(2), 309. https://doi.org/10.3390/coatings13020309