Article

Investigation of a Solar-Powered Evaporative Cooling System under Tunisian Climate

by
Karim Choubani
1,*,
Mohammed A. Almeshaal
1,
Moncef Balghouthi
2 and
Mohamed Ben Rabha
3,*
1
College of Engineering, Imam Mohammad Ibn Saud Islamic University, Riyadh 11432, Saudi Arabia
2
Thermal Process Laboratory LPT, Centre de Recherches et des Technologies de l’Énergie, Technopôle de Borj-Cédria, BP 95 Hammam-Lif, Tunis 2050, Tunisia
3
Laboratoire de Nanomatériaux et Systèmes Pour Énergies Renouvelables, Centre de Recherches et des Technologies de l’Énergie, Technopôle de Borj-Cédria, BP 95 Hammam-Lif, Tunis 2050, Tunisia
*
Authors to whom correspondence should be addressed.
Coatings 2023, 13(11), 1901; https://doi.org/10.3390/coatings13111901
Submission received: 22 September 2023 / Revised: 23 October 2023 / Accepted: 29 October 2023 / Published: 6 November 2023
(This article belongs to the Special Issue Design of Nanostructures for Energy and Environmental Applications)

Abstract

:
The demand for cooling continues to increase in line with environmental changes and a greater desire for human comfort. In north Africa and middle eastern countries, and particularly in Tunisia, cooling constitutes a big problem as it is recommended for human and animal breeding. This study aimed to analyze the performance and suitability of an evaporative cooling system powered by solar energy and to assess the economic and environmental impact under Tunisian weather conditions. Numerical modeling and simulations were performed, revealing the effects of inlet air temperature and relative humidity on system performances. An experimental study based on the construction of an evaporative cooling prototype formed by environmentally friendly and locally available components was also performed. This study showed the dependence of the process performances on the humidity and temperature of the ambient air. The obtained results revealed that the efficiency of the evaporative cooler exceeds 90%, with maximum efficiency being reached at a high wet-bulb depression, while minimum efficiency was observed when the dry air has a high relative humidity and a low dry-bulb temperature. Experimental results showed that, for input temperatures ranges between 36 and 47 °C and relative air humidity between 15 and 50%, a direct humidifier produces air with a temperature range between 25 and 29 °C and humidity range between 55% and 85%. Thus, evaporative cooling is feasible and suitable under Tunisian climate conditions during the hot season.

1. Introduction

Electricity shortages are currently a very common problem for many countries, especially in hot or cold seasons, when air conditioning (AC) or heating is needed [1]. Regular power outages harm an economy and cause major social problems. One reason for a spike in electricity consumption is the widespread use of AC systems during summer, which has been exacerbated by rises in the ambient temperature in recent years as a direct consequence of climate change. With electricity shortages, however, people have to limit their use of AC systems, which leads to inconvenience in daily life and increases the risk of damaging these systems, therefore, Solar-AC could be a very promising solution to this problem. These systems find many applications such as residential cooling, agricultural cooling, industrial cooling, commercial, and public spaces, outdoor cooling, remote or off-grid cooling and water and wastewater treatment. As the name suggests, Solar-AC uses solar energy rather than mains electricity to condition the air and ensure a comfortable ambient temperature. What is more, solar energy is considered an extremely clean and renewable source of energy for mitigating electricity shortages [2,3]. Indeed, if we couple Solar-AC systems with thermal energy storage systems, users can reduce their electricity costs by capitalizing on their distributed power. The most eco-friendly options that can provide more sustainable solutions to store energy are thermal and pumped-hydro storage systems. A combination of thermal and electrical storage systems could provide a more economical solution compared to the utilization of only electrical storage systems [4,5,6]. Moreover, energy storage on microgrids and nano-grids could be a potential solution for providing a better electrical service for both insufficiently supplied and rural areas. These include small renewable energy collectors and energy storage units typically installed in different buildings [7]. Several studies have investigated the combination of solar energy with AC systems. In 2008, Hwang et al. discussed the implementation of solar collector technology together with various refrigeration technologies to maximize overall system efficiency. The researchers revealed that the adsorption cycle is more efficient than other technologies because it requires a lower heat source temperature. Furthermore, vacuum tube solar collectors have a greater efficiency compared to other types of solar collectors [8]. In 2011, Albers et al. reviewed developments on sorption cooling systems, which, when using closed cycle or ceilings, can facilitate solar-assisted cooling. The heat is discharged using a heat rejection coil or an open cycle [9]. In 2015, Abdul Ghafoor and Munir analyzed different installed solar thermal-cooling technologies, both experimentally and numerically. They showed that the coefficient of performance (COP) increases when the hot water inlet temperature of the chiller is increased [10]. Next, Abo Elmaaref demonstrated that the thermoelectric efficiency of a whole system could be increased with optimum design considerations and configuration, ultimately showing that thermoelectric-based cooling systems are a clean form of technology [11]. For their part, Ayman and Esmail compared different solar cooling technologies and analyzed their advantages and disadvantages, finding that many modern commercial systems are based on absorption cycles [12]. In 2017, Muhammad et al. calculated the overall performance of cooling technologies, ultimately recommending that adsorption cooling should be improved in the future [13]. Swapnil and Tejaswini, meanwhile, found that hybrid desiccant/vapor-compression AC could be a better option due to its 30%–80% increase in energy saving [14]. In 2018, Ajib and Alahmer analyzed several available solar cooling technologies based on different attributes in order to establish their advantages and disadvantages. They found that the capacity of a chiller is affected by variations in the temperature range, while the cold water temperature depends on the COP value and the refrigeration capacity [15]. Rishi et al. analyzed various factors that should be considered when choosing the right solar cooling technology for an implementation. They found that active cooling has a greater efficiency than passive cooling, which is generally limited by natural ventilation. However, active cooling is more expensive than passive cooling due to the high electricity consumption of the equipment [16]. Naskar et al. designed and constructed an AC system supplied with direct current (DC) from photo-voltaic (PV) panels. The obtained results were analyzed, and the technical effectiveness and economic competitiveness were found to be improved [17]. Velasco et al., meanwhile, designed and built an alternative evaporative cooler pad using cotton fabric. They showed that the saturation efficiency was strongly affected by the humidity at the air inlet, with larger air flows leading to lower efficiency. They also revealed that air humidification increases remarkably with the inlet air’s dry bulb temperature, with it slightly affecting specific humidity [18]. Next, Rasuli and Torii studied the feasibility of using solar-powered AC technology in real weather conditions, finding that this technology is sustainable, cost effective, and environmentally friendly [19]. In 2021, Aiman et al. examined a PV-AC coupled system and a solar cooling system where thermal energy was provided by solar collectors. They showed that solar cooling systems were a cost effective and environmentally friendly alternative to traditional air conditioning systems that use electricity generated from fossil fuels. However, the PV-AC technology systems were found to be more promising, and their development could significantly affect the prospects of solar cooling systems [20]. Lai et al. studied performance-enhancement strategies for integrating indirect evaporative technology with a solid desiccant, showing that this technology could enhance direct evaporative cooling applications under different climate conditions [21]. The objective of this study was to develop a theoretical model and an experimental prototype of an evaporative cooling system. A steady-state numerical model, based on energy and mass transfer processes, was built to reveal the effects of inlet air temperature and relative humidity and airflow on system performances. The suitability of the process with the Tunisian weather conditions was discussed. An experimental study, based on the construction of an evaporative cooling prototype formed by environmentally friendly and locally available components, was also performed.

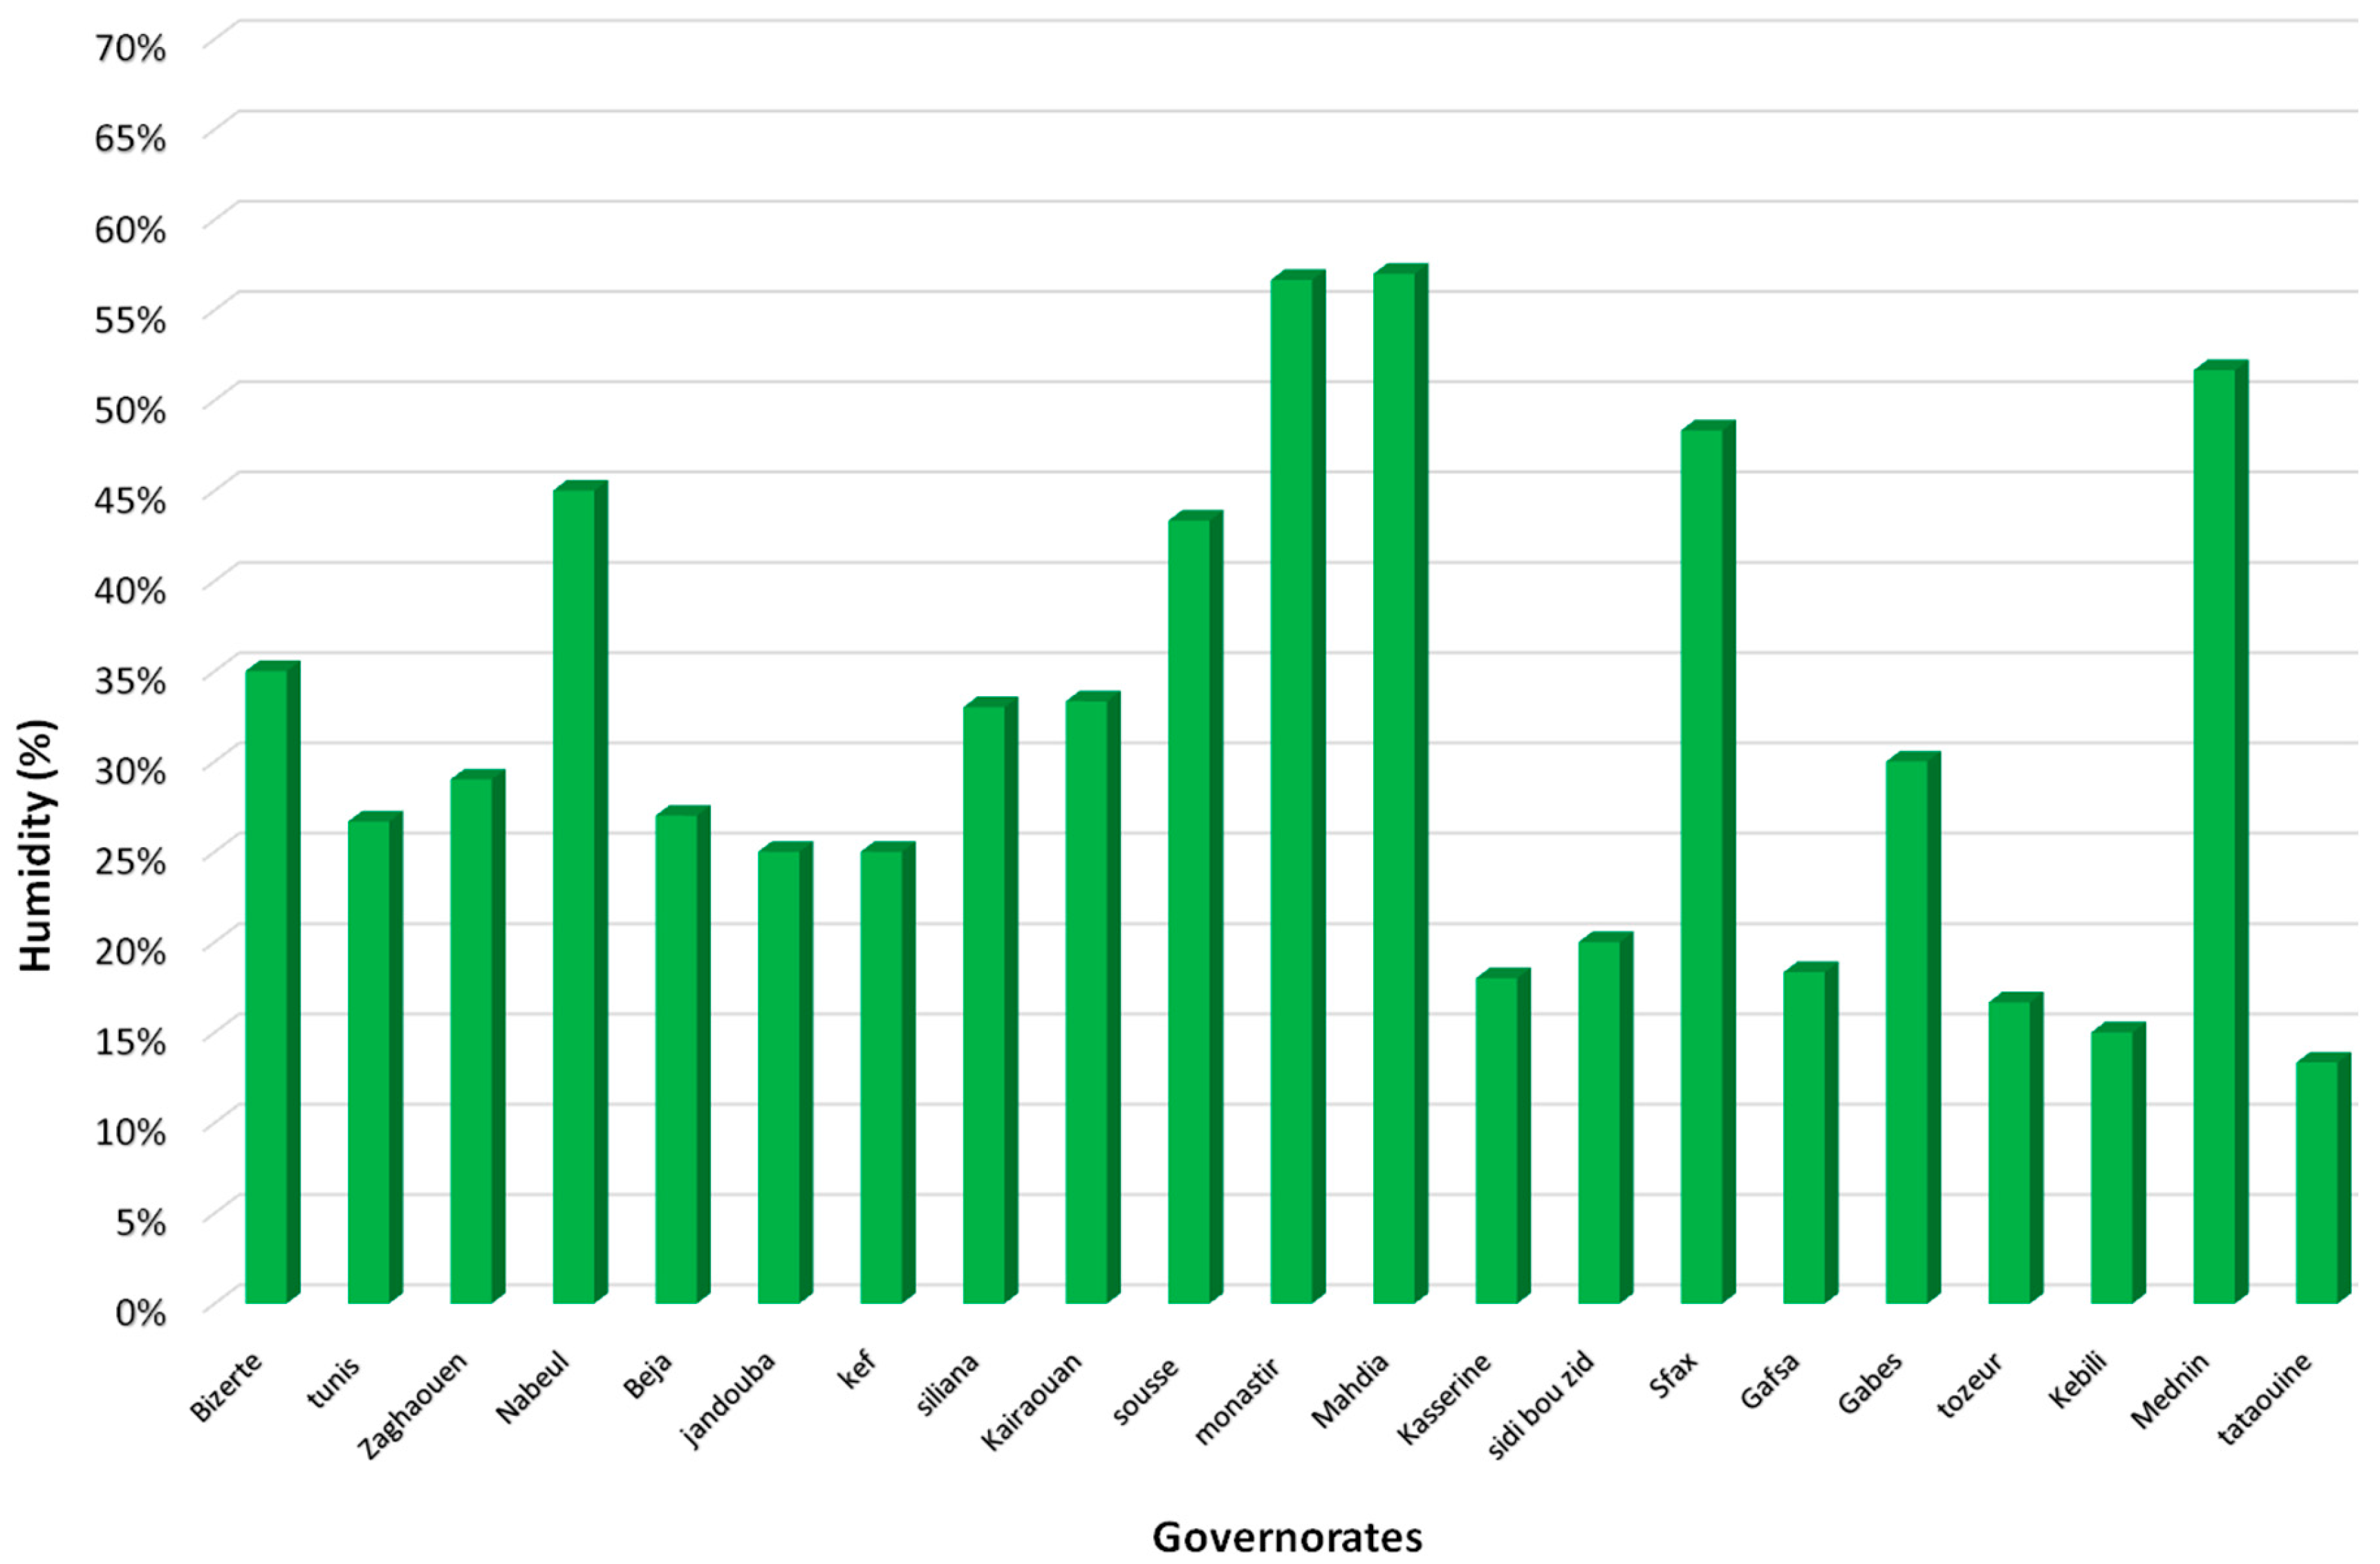
2. Suitability of the Evaporative Cooling Process for Tunisian Regions

As defined by ASHRAE, if the outside air has a low relative humidity (Hr ≤ 35%) and a temperature which is not very high (T > 30 °C), we can use air humidification to reach the levels of temperature and humidity of thermal comfort. This process is direct evaporative cooling. When the temperature and humidity of the outside air are high enough, we can use desiccation humidification, where the air passes through a bed of desiccation and is therefore dehumidified before cooling then humidification.
Figure 1 shows the mean relative humidity during the summer season from May to September in the Tunisian governorates. We note that, for the majority of the regions, the humidity is less than 35%. Only six governorates have mean relative humidity of more than 35%. These regions are near the sea. Hence, tdirect evaporative cooling is suitable for the majority of the Tunisian governorates. By application of this process, we can rush the conditions of summer thermal comfort. For the rejoins with higher humidity, we can use desiccation of air before passing through the humidifier. The desiccant material should be regenerated after a period of working. Fortunately, regeneration can be performed with solar energy, which is very abundant throughout the country, especially during the hot season.

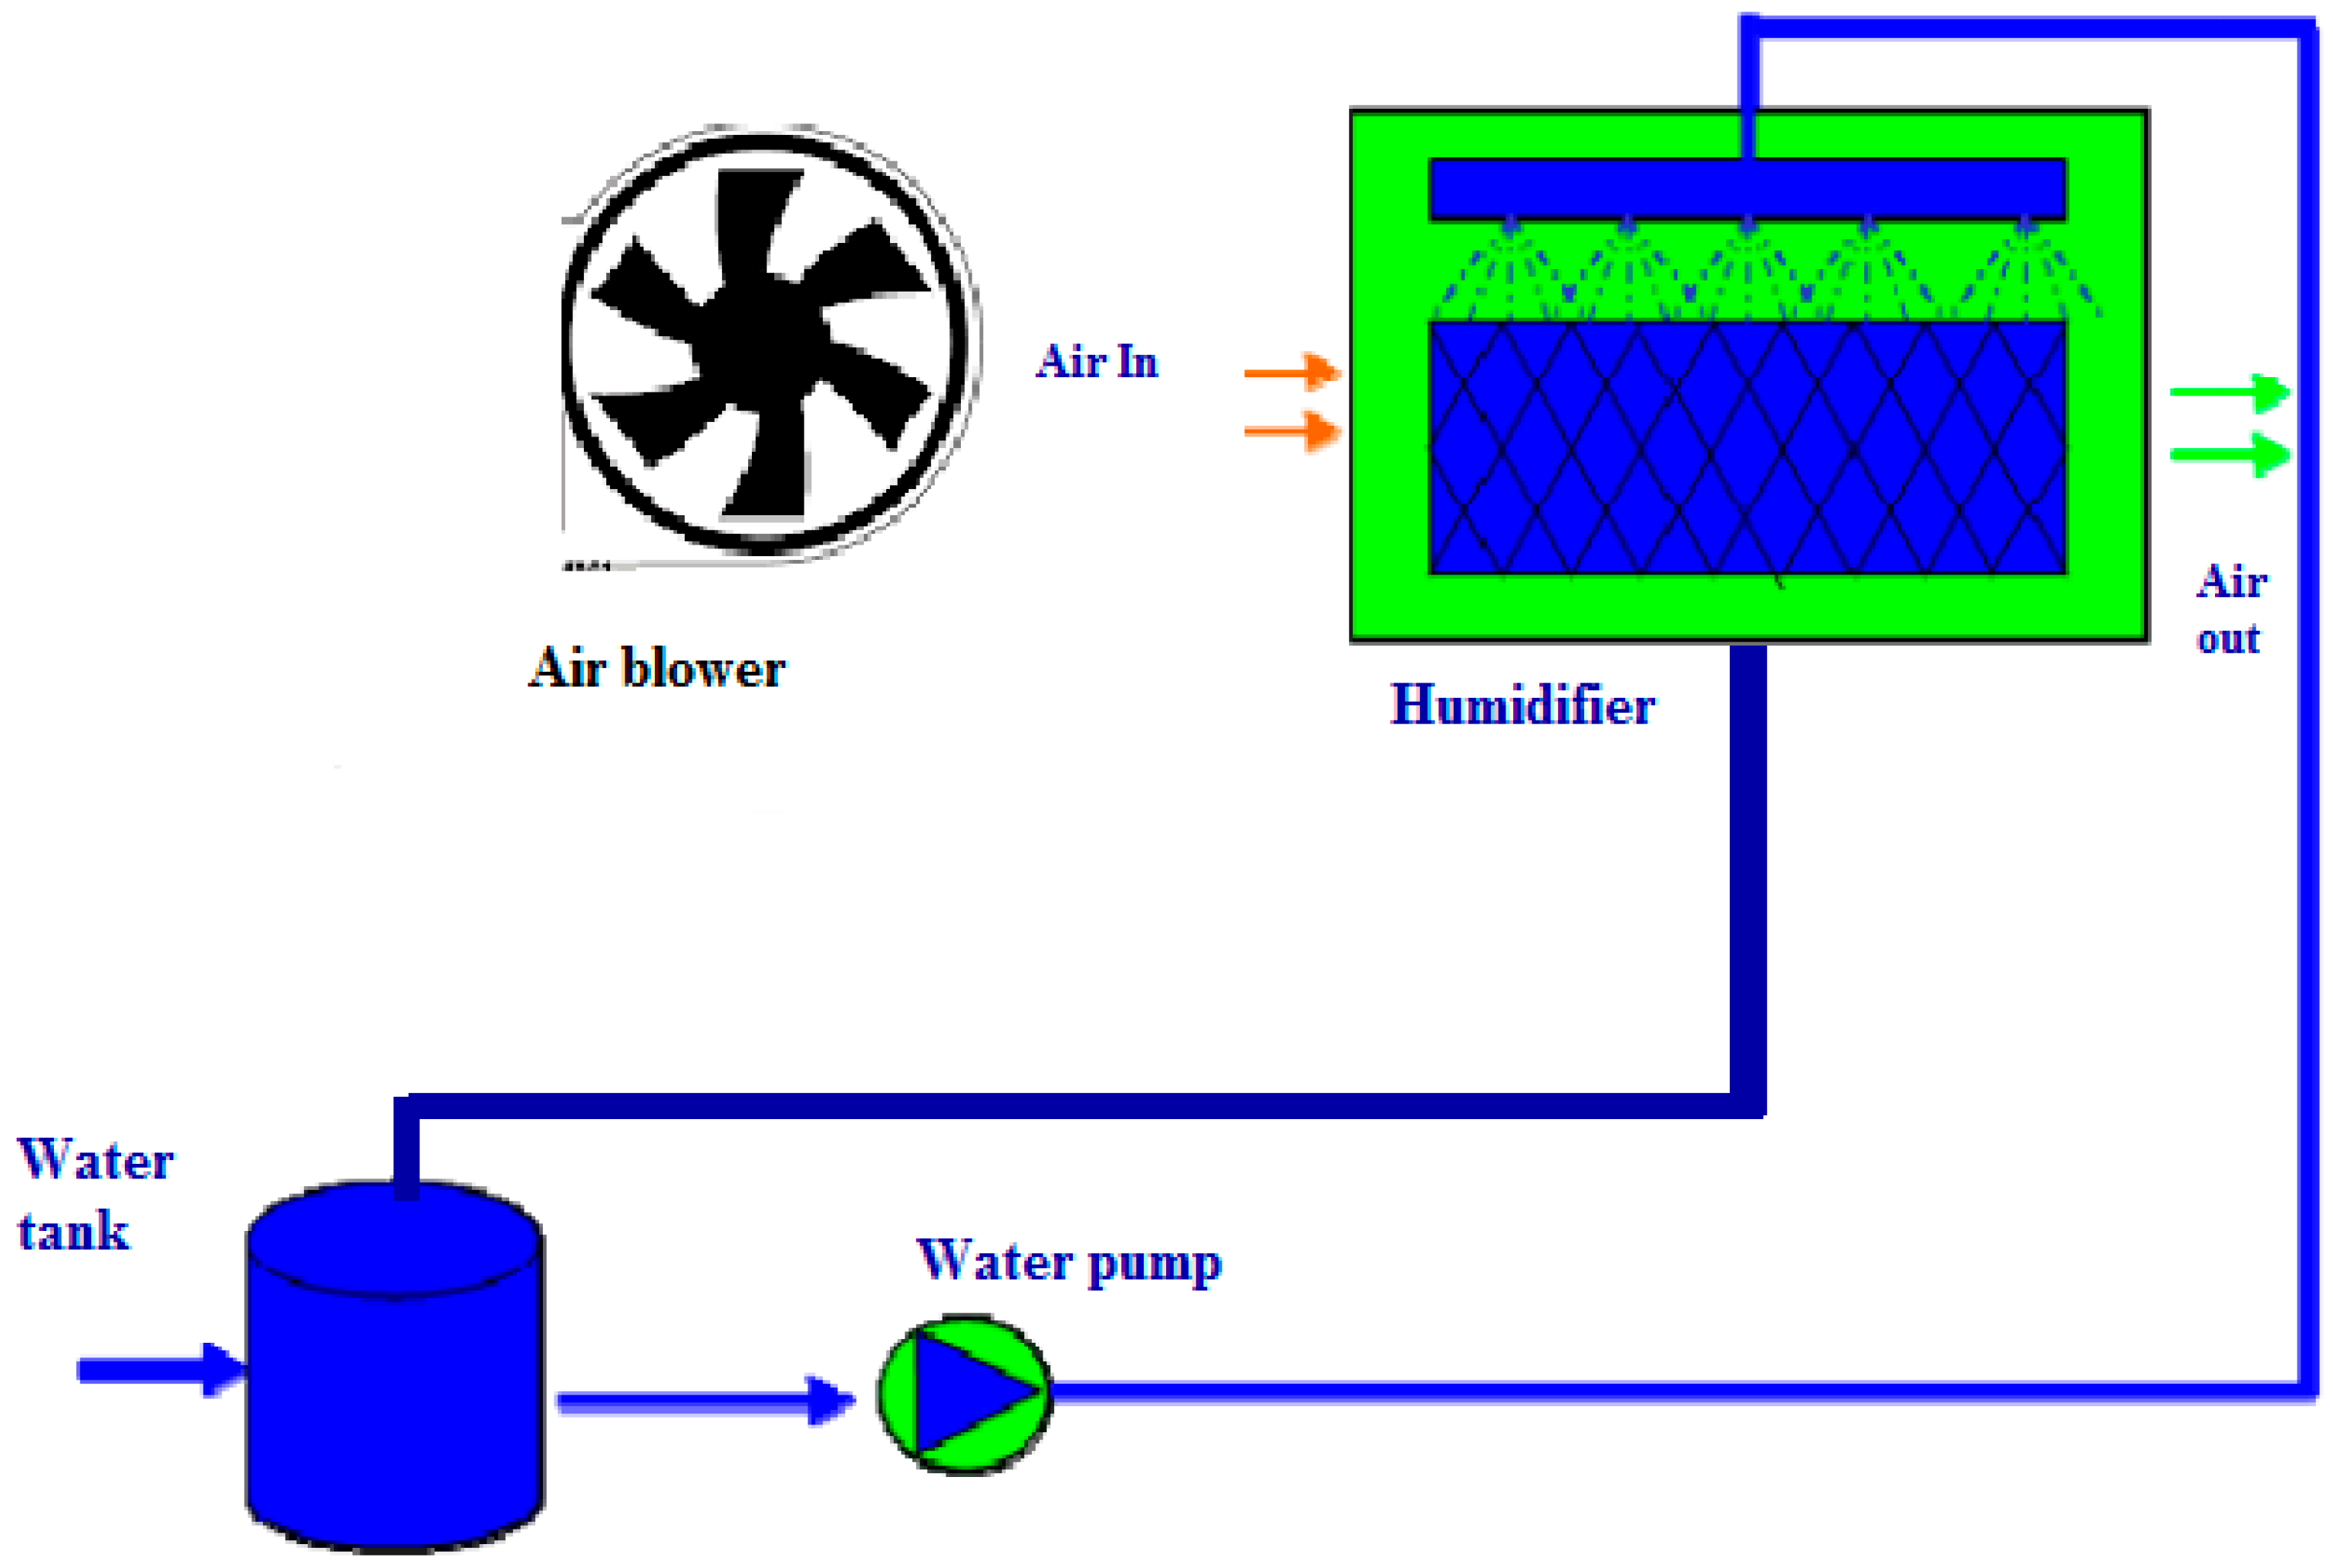
3. System Description and Modeling

Despite many studies looking at the optimized performance parameters of evaporative cooling systems [22,23,24,25,26,27,28,29,30,31], there is a need to develop modeling, simulation, and experimental prototypes that make it possible to determine the most suitable operating parameters for the climate conditions while proposing evaporative cooling systems whose components are friendly to the environment and available locally.
In this study, the proposed system shows in Figure 2 comprises a water reservoir, a fan, and a pump to circulate water. The fan and the pump are supplied with solar energy, which is delivered to a solar battery by the PV panel. The housing is louvered on three sides, with each side being fitted with a thick excelsior pad. A water distribution system with a PVC tube keeps these pads saturated with water when the cooler is operating. The system can be roof or window mounted. The adiabatic efficiency of this system is affected by the nature of the wetted pad, and a water spray system is used to humidify the dry air sucked in by the fan. The evaporative cooling process occurs as follows:
By passing dry air at dry-bulb temperature Tdb over a water surface at temperature TWb (<Tdb), a heat transfer occurs through convection between the air and the water. This heat transfer in turn causes a certain quantity of water to evaporate. The water’s temperature does not vary, but its volume decreases over time, so that it becomes necessary to replace the evaporated water. Air cooling therefore occurs due to the convective heat transfer between the incoming air and the injected water, which absorbs energy in the form of latent heat until it evaporates.
The evaporative cooling process of the PV-AC system is based on the mass and heat transfer that occurs between the hot air and the cold water. Consider an air conditioning process: State 1 is the inputted dry air with dry-bulb temperature T1, specific humidity w1, enthalpy ha1, and mass flow rate m a 1 ˙ . State 2 is the outputted moist air with wet-bulb temperature T2, specific humidity w2, enthalpy ha2, and a mass flow rate m a 2 ˙ . The water spray system is shown in Figure 3.

3.1. Mass Balance

The amount of air that comes in (state 1) is the same as the air that goes out [32].
m a 1 ˙ = m a 2 ˙ = m a ˙
Water vapor comes in along with the air and, combined with the water that is being added, this equals the amount of water that leaves the system [32]:
m ˙ a w 1 + m ˙ w = m ˙ a w 2 m ˙ w = m ˙ a w 2 w 1
where the specific humidity (w) is given by the following equation [32]:
w = 0.622 φ P s a t P a t m φ P s a t
and φ is the relative humidity, given as follows [32]:
φ = P v P s a t
Psat is the saturating vapor pressure, which depends only on the air temperature, to be calculated through the Cadiergues correlation. For a temperature variation of 1   ° C T 100   ° C , the saturating vapor pressure is obtained through the Cadiergues correlation as follows [32]:
P s a t T = 10 A + B T C + T
( A 2.7877 ;   B 7.625 ;   C = 241   [ ° C ] )

3.2. Energy Balance

We assume that the system does not exchange heat or mechanical work with the external environment, so the energy conservation is reduced to enthalpy conservation. Thus, the enthalpy at the inlet is the sum of the enthalpy of the incoming air and that of the liquid water, while, at the outlet, it is simply the enthalpy of the outgoing air [32]:
m a 1 ˙ h a 1 + m w ˙ h w m a 2 ˙ h a 2 = 0
where:
h a 1 = C p a T 1 + w 1 h v 1
h v 1 = L v + C p a v T 1
h a 2 = C p a T 2 + w 1 h v 2
h v 2 = L v + C p a v T 2
h w = h a 2 h a 1 w 2 w 1 = w s a t w 1 ˙ C p l i q T 1
The mass of water vapor added to the input dry air, as expressed in kg per kg of dry air, is given by the following equation:
m w = w 1 w 2
Given the previous equations, we then get:
T 2 = T 1 + w s a t w 1 C p l i q C p v T 1 L v C p a 1 + w s a t C p v
The term C p l i q C p v T 1 can be removed from before the term L v to then obtain:
T 2 T 1 L v w s a t w 1 C p a 1 + w s a t C p v
The dew point temperature T d p is given by the following equation [33]:
T d p = 100 ( P v 2 288.68 ) 1 8.02 109.8
The efficiency of the evaporative cooler is defined by the following equation [33]:
E = T 1 T 2 T 1 T d p

3.3. Numerical Simulation

A numerical code was developed and implemented in MATLAB to predict the performance of the modeled evaporative cooler. The input parameters, such as the dry-bulb temperature and relative humidity, were varied to simulate genuine climate conditions, while the output conditions were set to ensure the desired level of human comfort.
We initially fixed one of the two output parameters (i.e., the preferred temperature or relative humidity for the wet air). We then analyzed the effect of the input parameters on the output parameters, the output and input enthalpies, the enthalpy of the added water, the mass of the added water, and the efficiency of the evaporative cooler. The flowchart presented in Figure 4 depicts the multistep procedure that was adopted to solve the heat and mass transfer equations.

3.3.1. Effect of Dry-Bulb Temperature on the Wet Air’s Relative Humidity

Figure 5 shows the variation in relative humidity φ2 of the wet air when varying the dry air’s temperature T1. The simulations obtained various results for different constant values for the dry air’s relative humidity φ1 and a constant wet-bulb temperature T2. These results revealed that:
(i)
The output air’s relative humidity depends mainly on the input air’s relative humidity when varying the dry-bulb temperature but keeping the wet-bulb temperature constant.
(ii)
In cases (a) and (b), the wet-bulb temperature was kept constant while the dry air’s relative humidity was doubled. The wet air’s relative humidity increased when increasing the dry-bulb temperature until it achieved a maximum value of about 28% in case (a) and 37.5% in case (b). When doubling the value of the dry air’s relative humidity, the maximum value for the wet air’s relative humidity rose by about 40%.
(iii)
In cases (a) and (c), the dry air’s relative humidity was kept constant while the wet-bulb temperature increased by about 20%. Thus, the wet air’s relative humidity increased with increasing dry-bulb temperature until it achieved a maximum value of about 28% in case (a) and 24% in case (c). A rise in the wet-bulb temperature by approximately 20% leads to a roughly 14% decrease in the maximum value of the wet air’s relative humidity.
The dry-bulb temperature of air has a significant effect on the relative humidity of the air when it is saturated with moisture. The relationship between the dry-bulb temperature and relative humidity can be understood through the concept of saturation. As the dry-bulb temperature increases, the air’s capacity to hold moisture also increases. This means that, if the amount of moisture in the air remains constant, the relative humidity decreases as the temperature rises. Conversely, if the dry-bulb temperature decreases, the air’s capacity to hold moisture decreases, leading to an increase in relative humidity.
Figure 5. Effect of dry bulb temperature on the wet air humidity.
Coatings 13 01901 g005

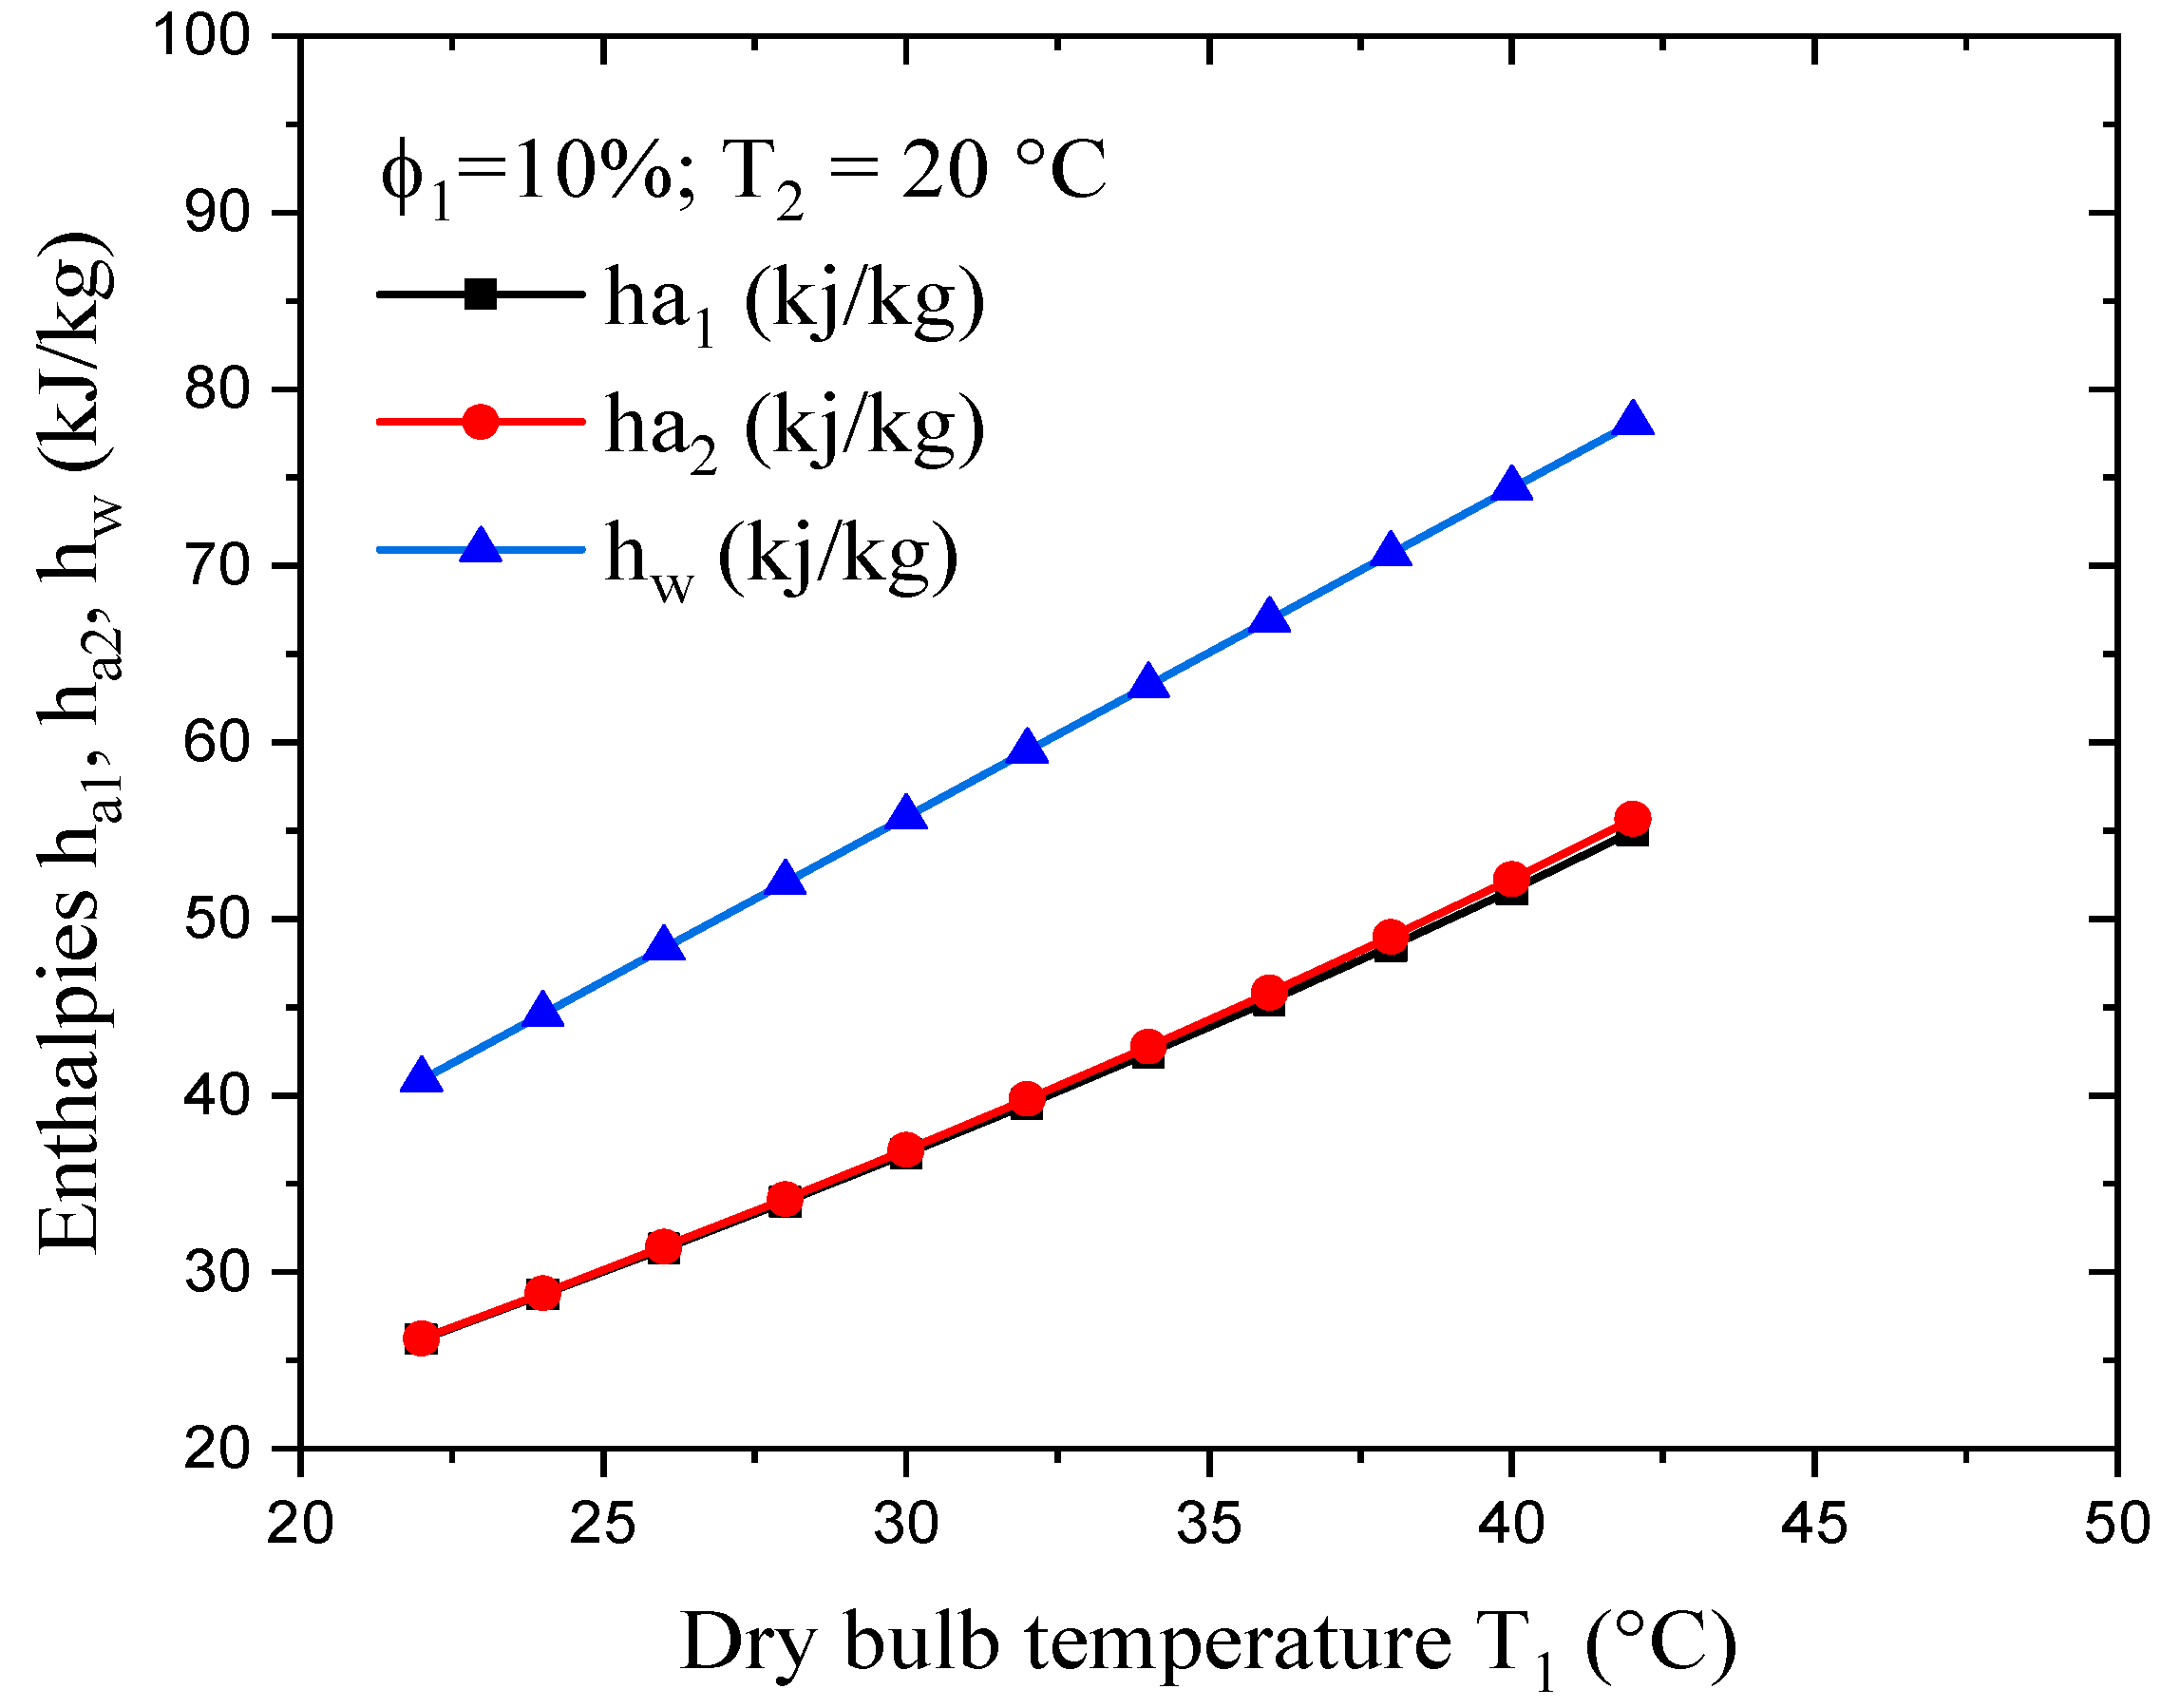
3.3.2. Effect of Dry-Bulb Temperature on the Enthalpies of the Air and Water

Figure 6 shows the variation in the dry and wet airs’ enthalpies (ha1 and ha2) when varying the dry-bulb temperature. These results were obtained with a constant relative humidity φ1 of 10% for the input air and a desired wet-bulb temperature T2 of 20 °C. It was found that, for dry-bulb temperatures from 22 to 42 °C, which corresponds to a rise of about 47.6%, the values for the dry and wet airs’ enthalpies are close, with them varying from about 26 kJ/kg to 55 kJ/kg (a rise of about 52.7%). We can therefore use the approximation that, for a constant dry-bulb temperature, the process takes place with constant enthalpy, although this is still an approximation nevertheless. Indeed, in the psychrometric chart, the lines of constant enthalpy are identical to the lines for constant wet-bulb temperatures. Thus, if we surmise that enthalpy is constant during this process, the wet-bulb temperature also has to be constant.
Figure 6 shows that, when the dry-bulb temperature T1 varies from 22 to 42 °C, the enthalpy of the added water increases from 41 kJ/kg to 78 kJ/kg, which corresponds to a rise of about 47.4%. The variation that occurs in this range of dry-bulb temperatures is due to the difference in the specific humidity (w1–w2), which is very important in determining differences between the air enthalpies (h1–h2).
When the water is added to the air through the evaporative cooler, the enthalpy of the air increases. The amount of enthalpy added depends on the temperature and the phase change from liquid to vapor. As the dry-bulb temperature increases, the enthalpy of added water also increases due to the higher energy required for evaporation or vaporization.

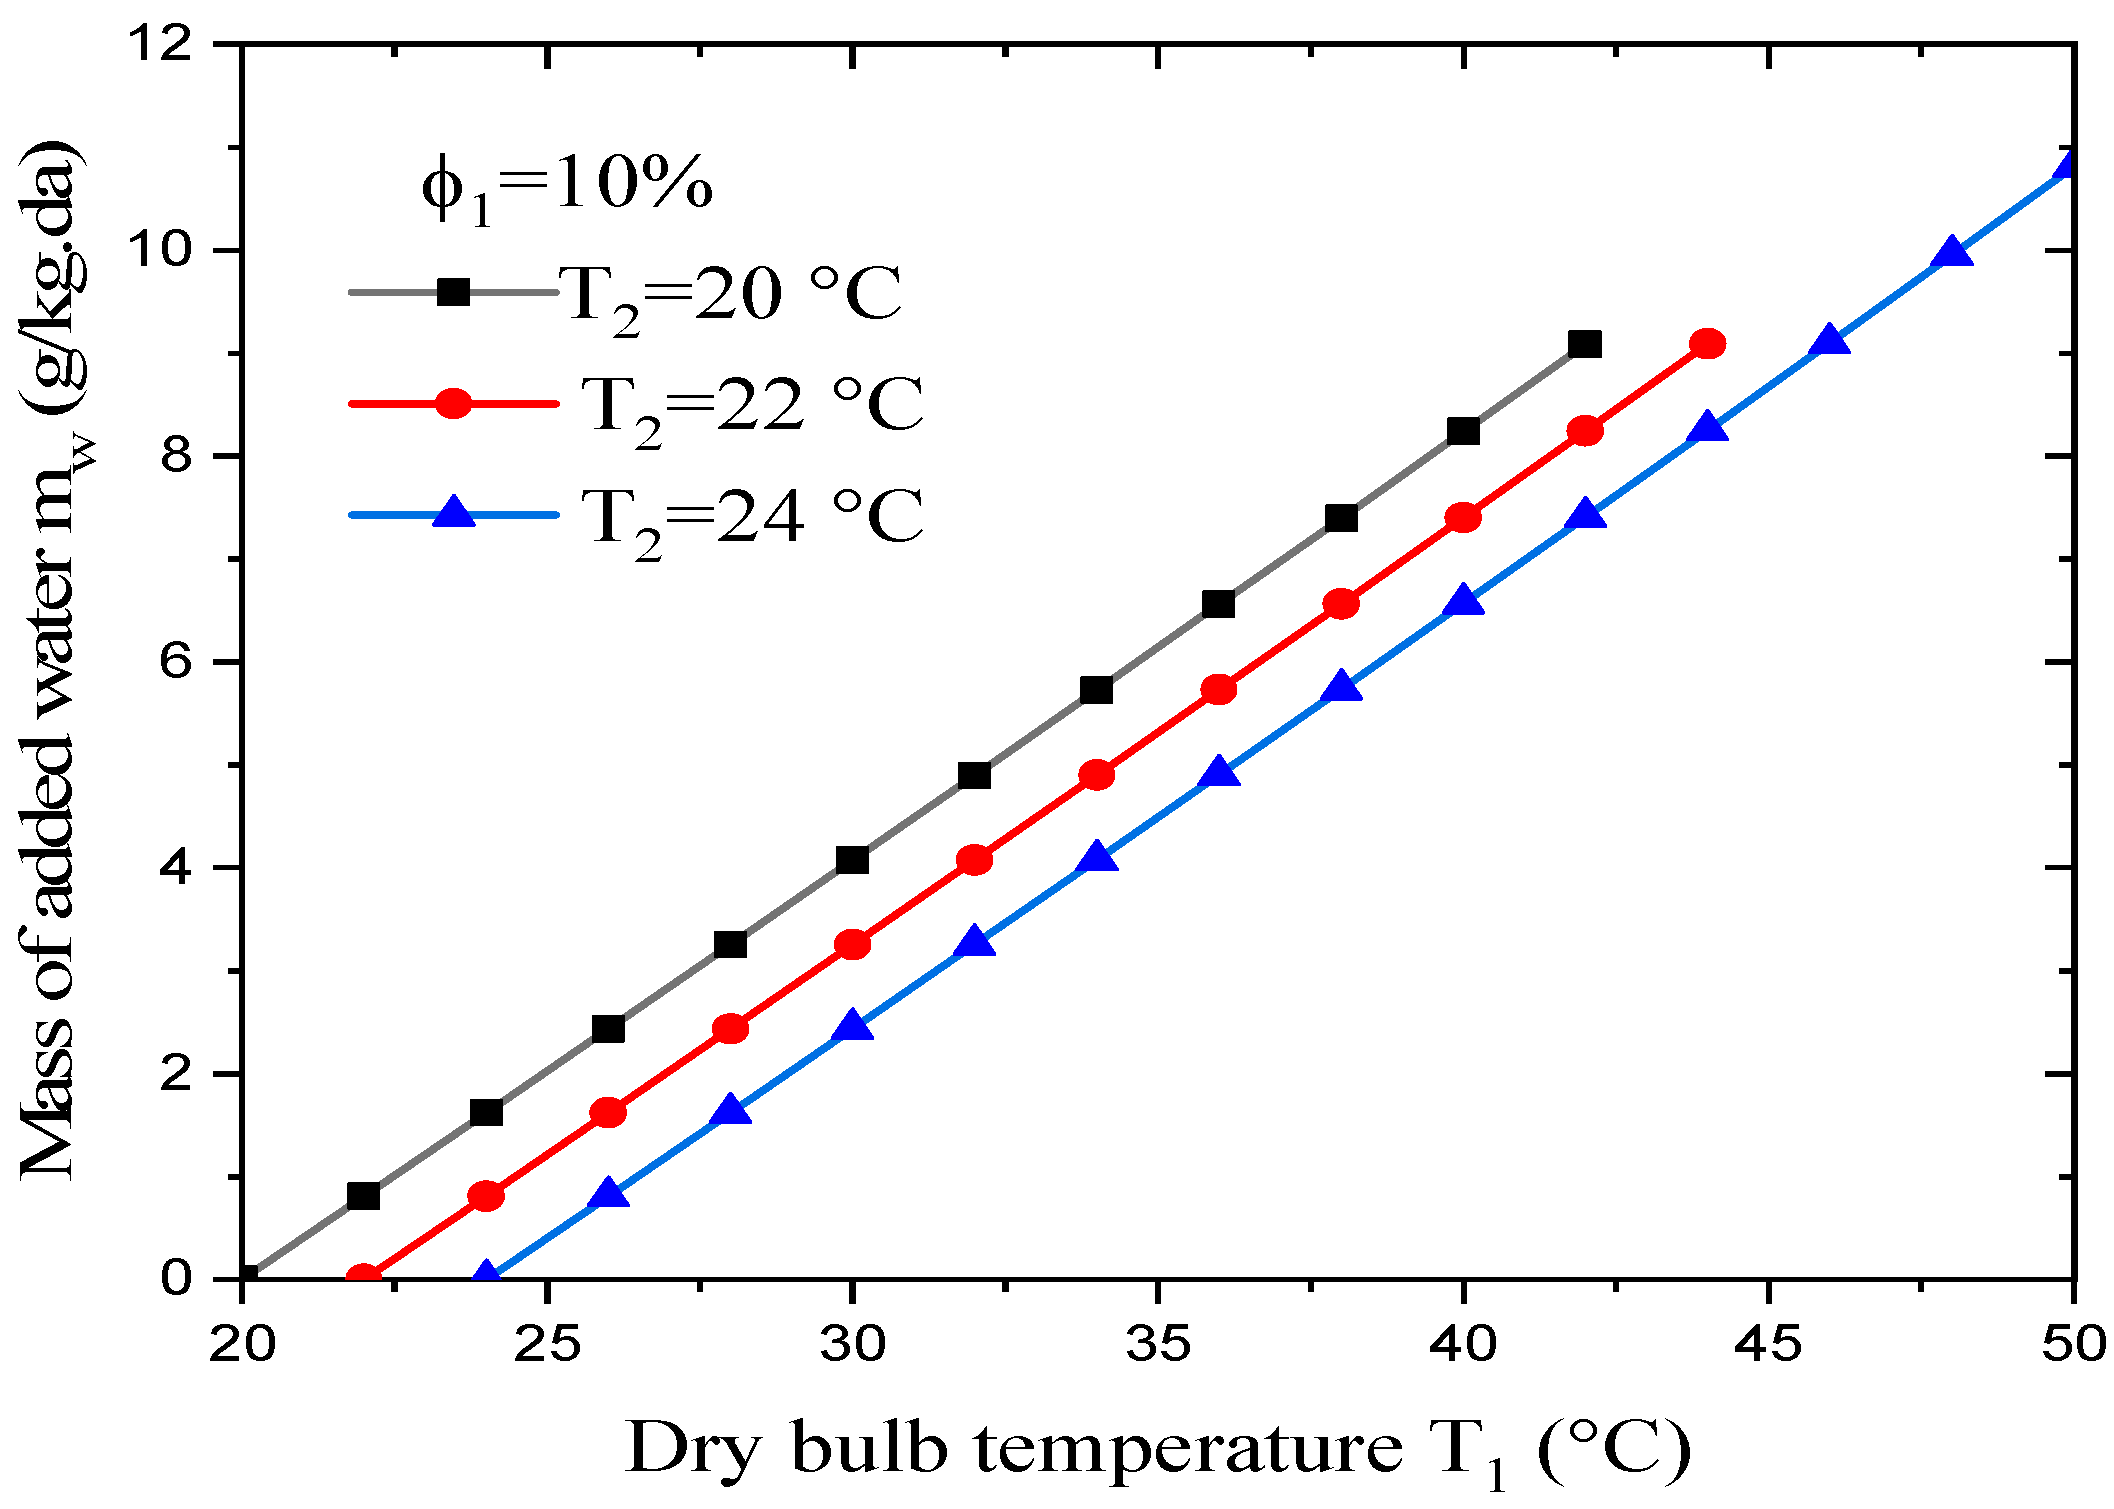
3.3.3. Effect of the Dry Air’s Temperature on the Mass of the Added Water

Figure 7 shows the effect of the dry-bulb temperature on the mass of water that needs to be added to humidify the input dry air. These results were obtained for a constant relative humidity for the dry air φ1 of 10%, combined with different values for the wet-bulb temperature T2. The results obtained show that, by varying dry-bulb temperature and making the input air’s relative humidity constant, the mass of water needed to humidify the dry air increases linearly. It was also found that:
(i)
The added water depends strongly on the input dry air’s temperature, although the flow rate for the water is much less than for the air.
(ii)
For a constant dry-bulb temperature and relative humidity, a rise in the wet-bulb temperature leads to a decrease in the mass of water that needs to be added.
(iii)
For φ1 = 10% and T2 = 20 °C, the maximum value for the water to be added is about 9 g/kgda, and it is achieved at T1 = 42 °C. For φ1 = 10% and T2 = 22 °C, meanwhile, the maximum amount of added water is the same (9 g/kgda), but it is achieved for T1 = 44 °C.
(iv)
For φ1 = 10% and T2 = 24 °C, the maximum value of the added water is about 11 g/kgda, and it is achieved for T1 = 50 °C.
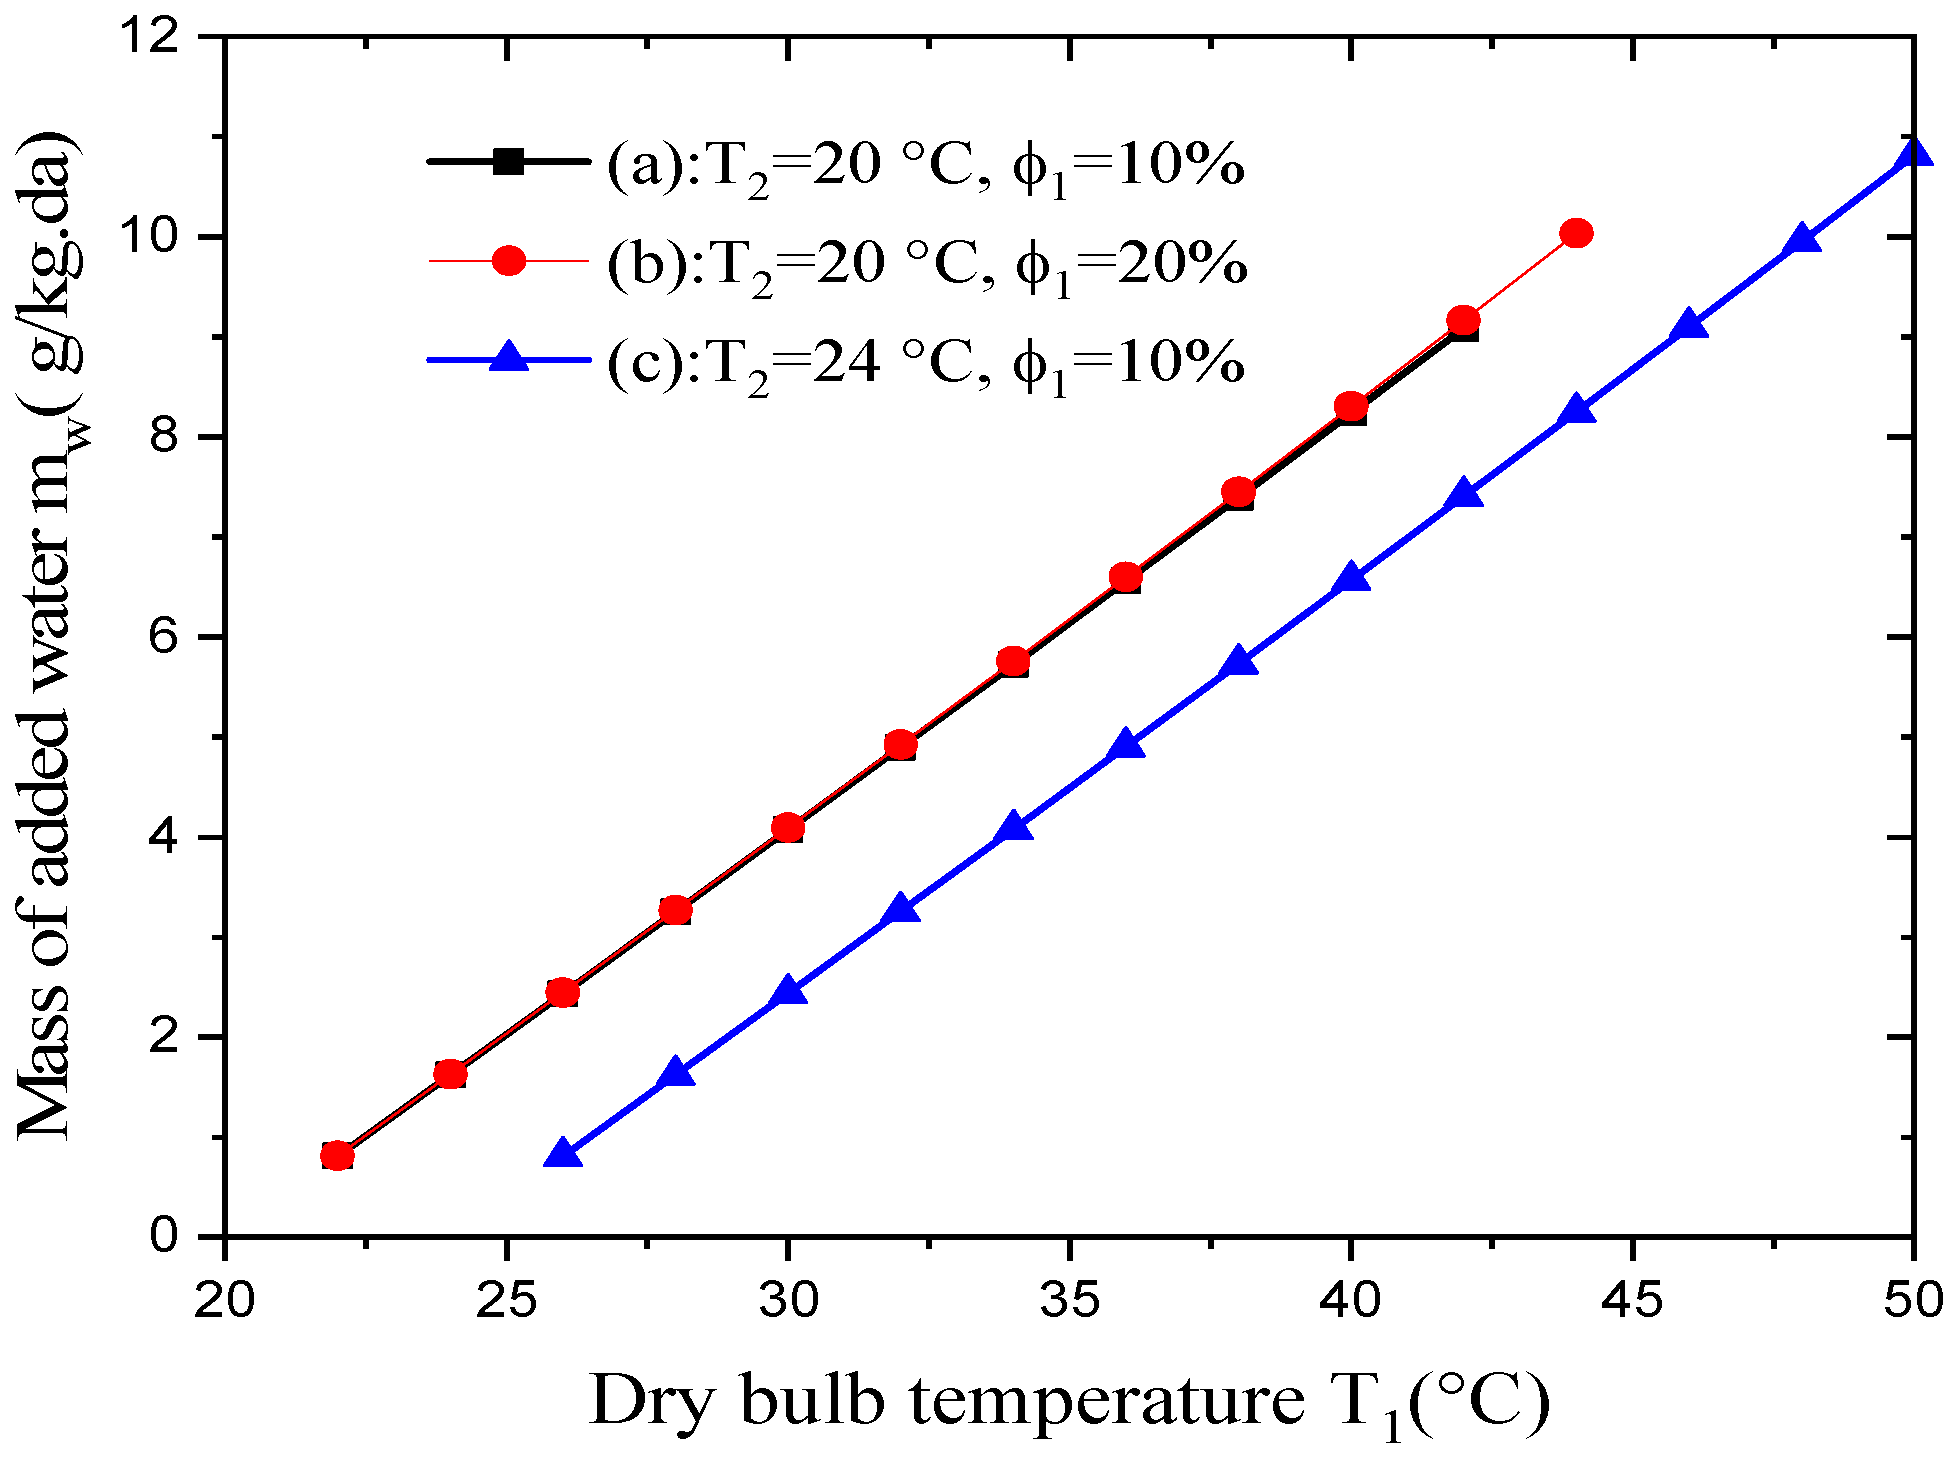
(v)
It seems that every (T1, φ1) pair for the dry air corresponds to an optimal (T2, φ2) pair for the wet air.
Figure 8 reveals that the added mass at a constant wet-bulb temperature was less sensitive to variations in the dry air’s relative humidity. Indeed, for the two cases (T2 = 20 °C, φ1 = 10%) and (T2 = 20 °C, φ1 = 20%), the difference between the values of the added mass water is less than 1%; the black and red curves coincide.
Figure 7. Effect of dry air temperature on the mass of the added water for constant dry air humidity.
Coatings 13 01901 g007
Figure 8. Effect of dry air temperature on the mass of the added water for variable dry air humidity.
Coatings 13 01901 g008
In summary, the mass of the water added to dry air is influenced by the temperature of the dry air. The relationship between the two can be understood through the concepts of saturation and relative humidity. An increase in the temperature of dry air allows for a greater mass of water to be added without reaching saturation at a constant relative humidity. Conversely, a decrease in temperature restricts the amount of water that can be added without reaching saturation.

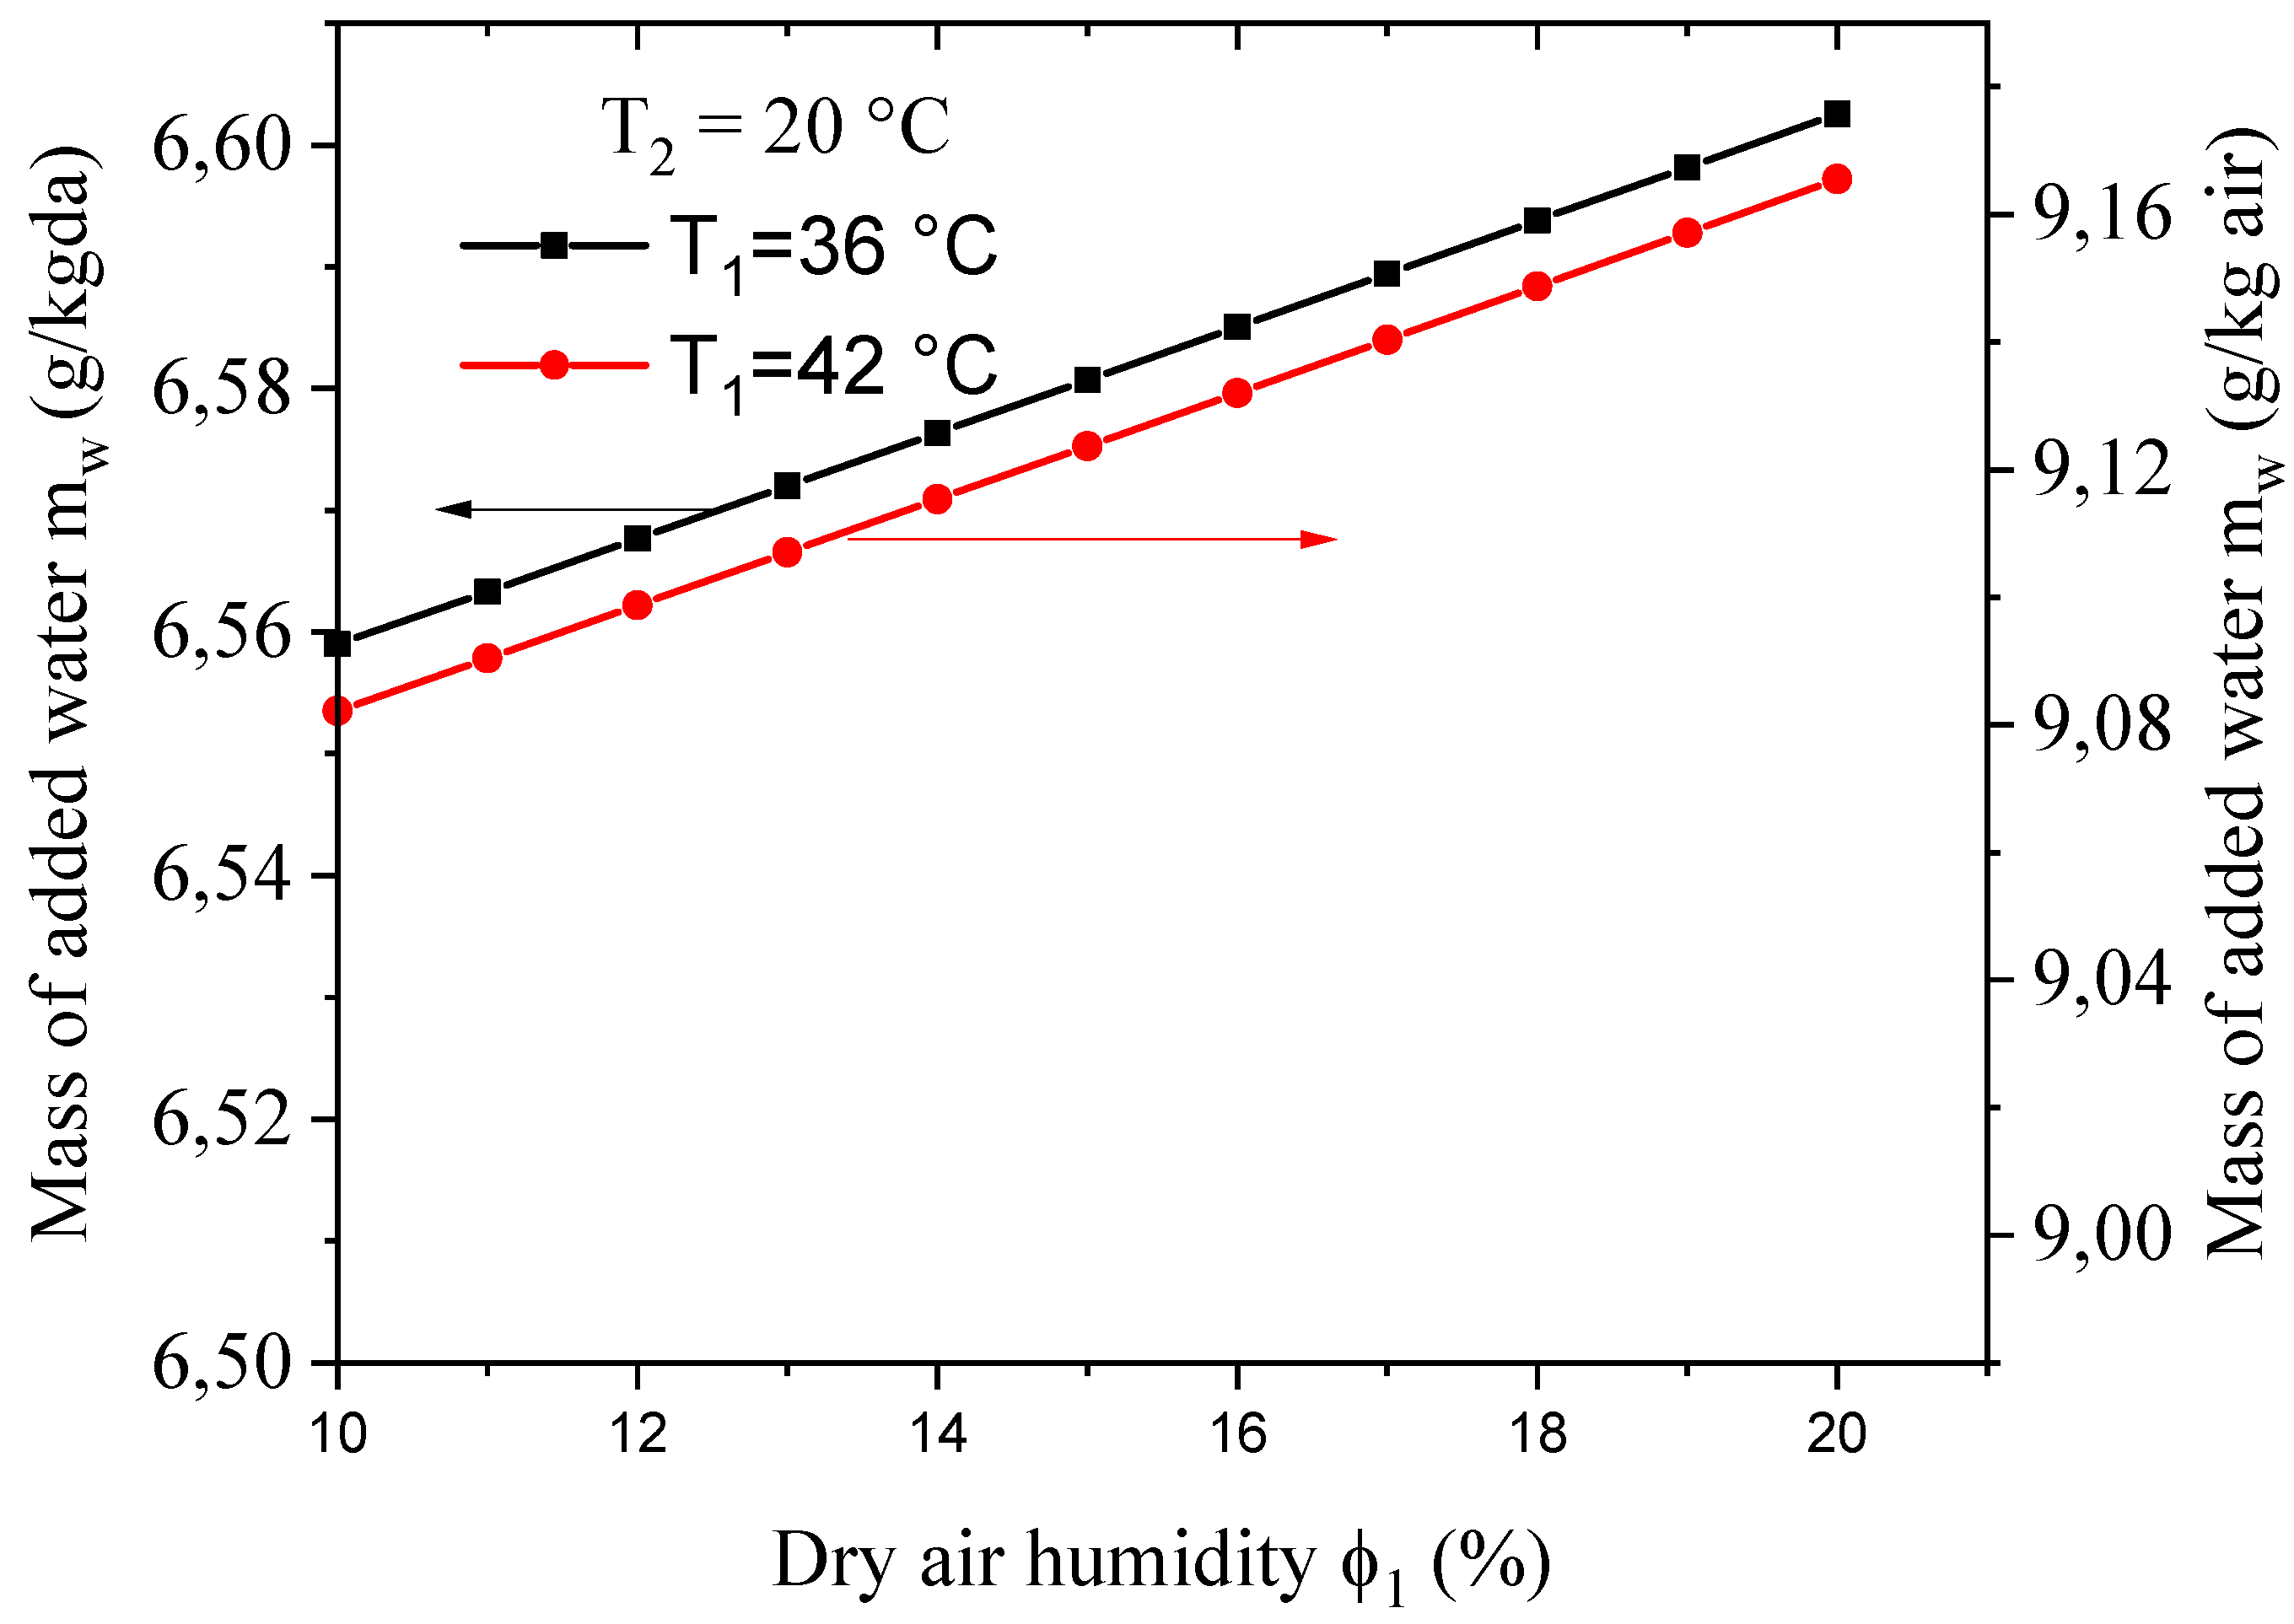
3.3.4. Effect of the Dry Air’s Relative Humidity on the Mass of the Added Water

Figure 9 shows the effect of the dry air’s relative humidity φ1 on the mass of the added water at a constant wet-bulb temperature T2 with a variable dry-bulb temperature T1. It was shown that:
(i)
For a constant dry-bulb temperature T1 and constant wet-bulb temperature T2, the mass of the added water was less sensitive to increases in the dry air’s humidity φ1.
(ii)
For a constant relative humidity for the wet air and a constant wet-bulb temperature, any rise in the dry-bulb temperature leads to an increase in the mass of the added water, because more water is needed to humidify the dry air.
Figure 9. Effect of the relative humidity of the dry air on the mass of the added water.
Coatings 13 01901 g009

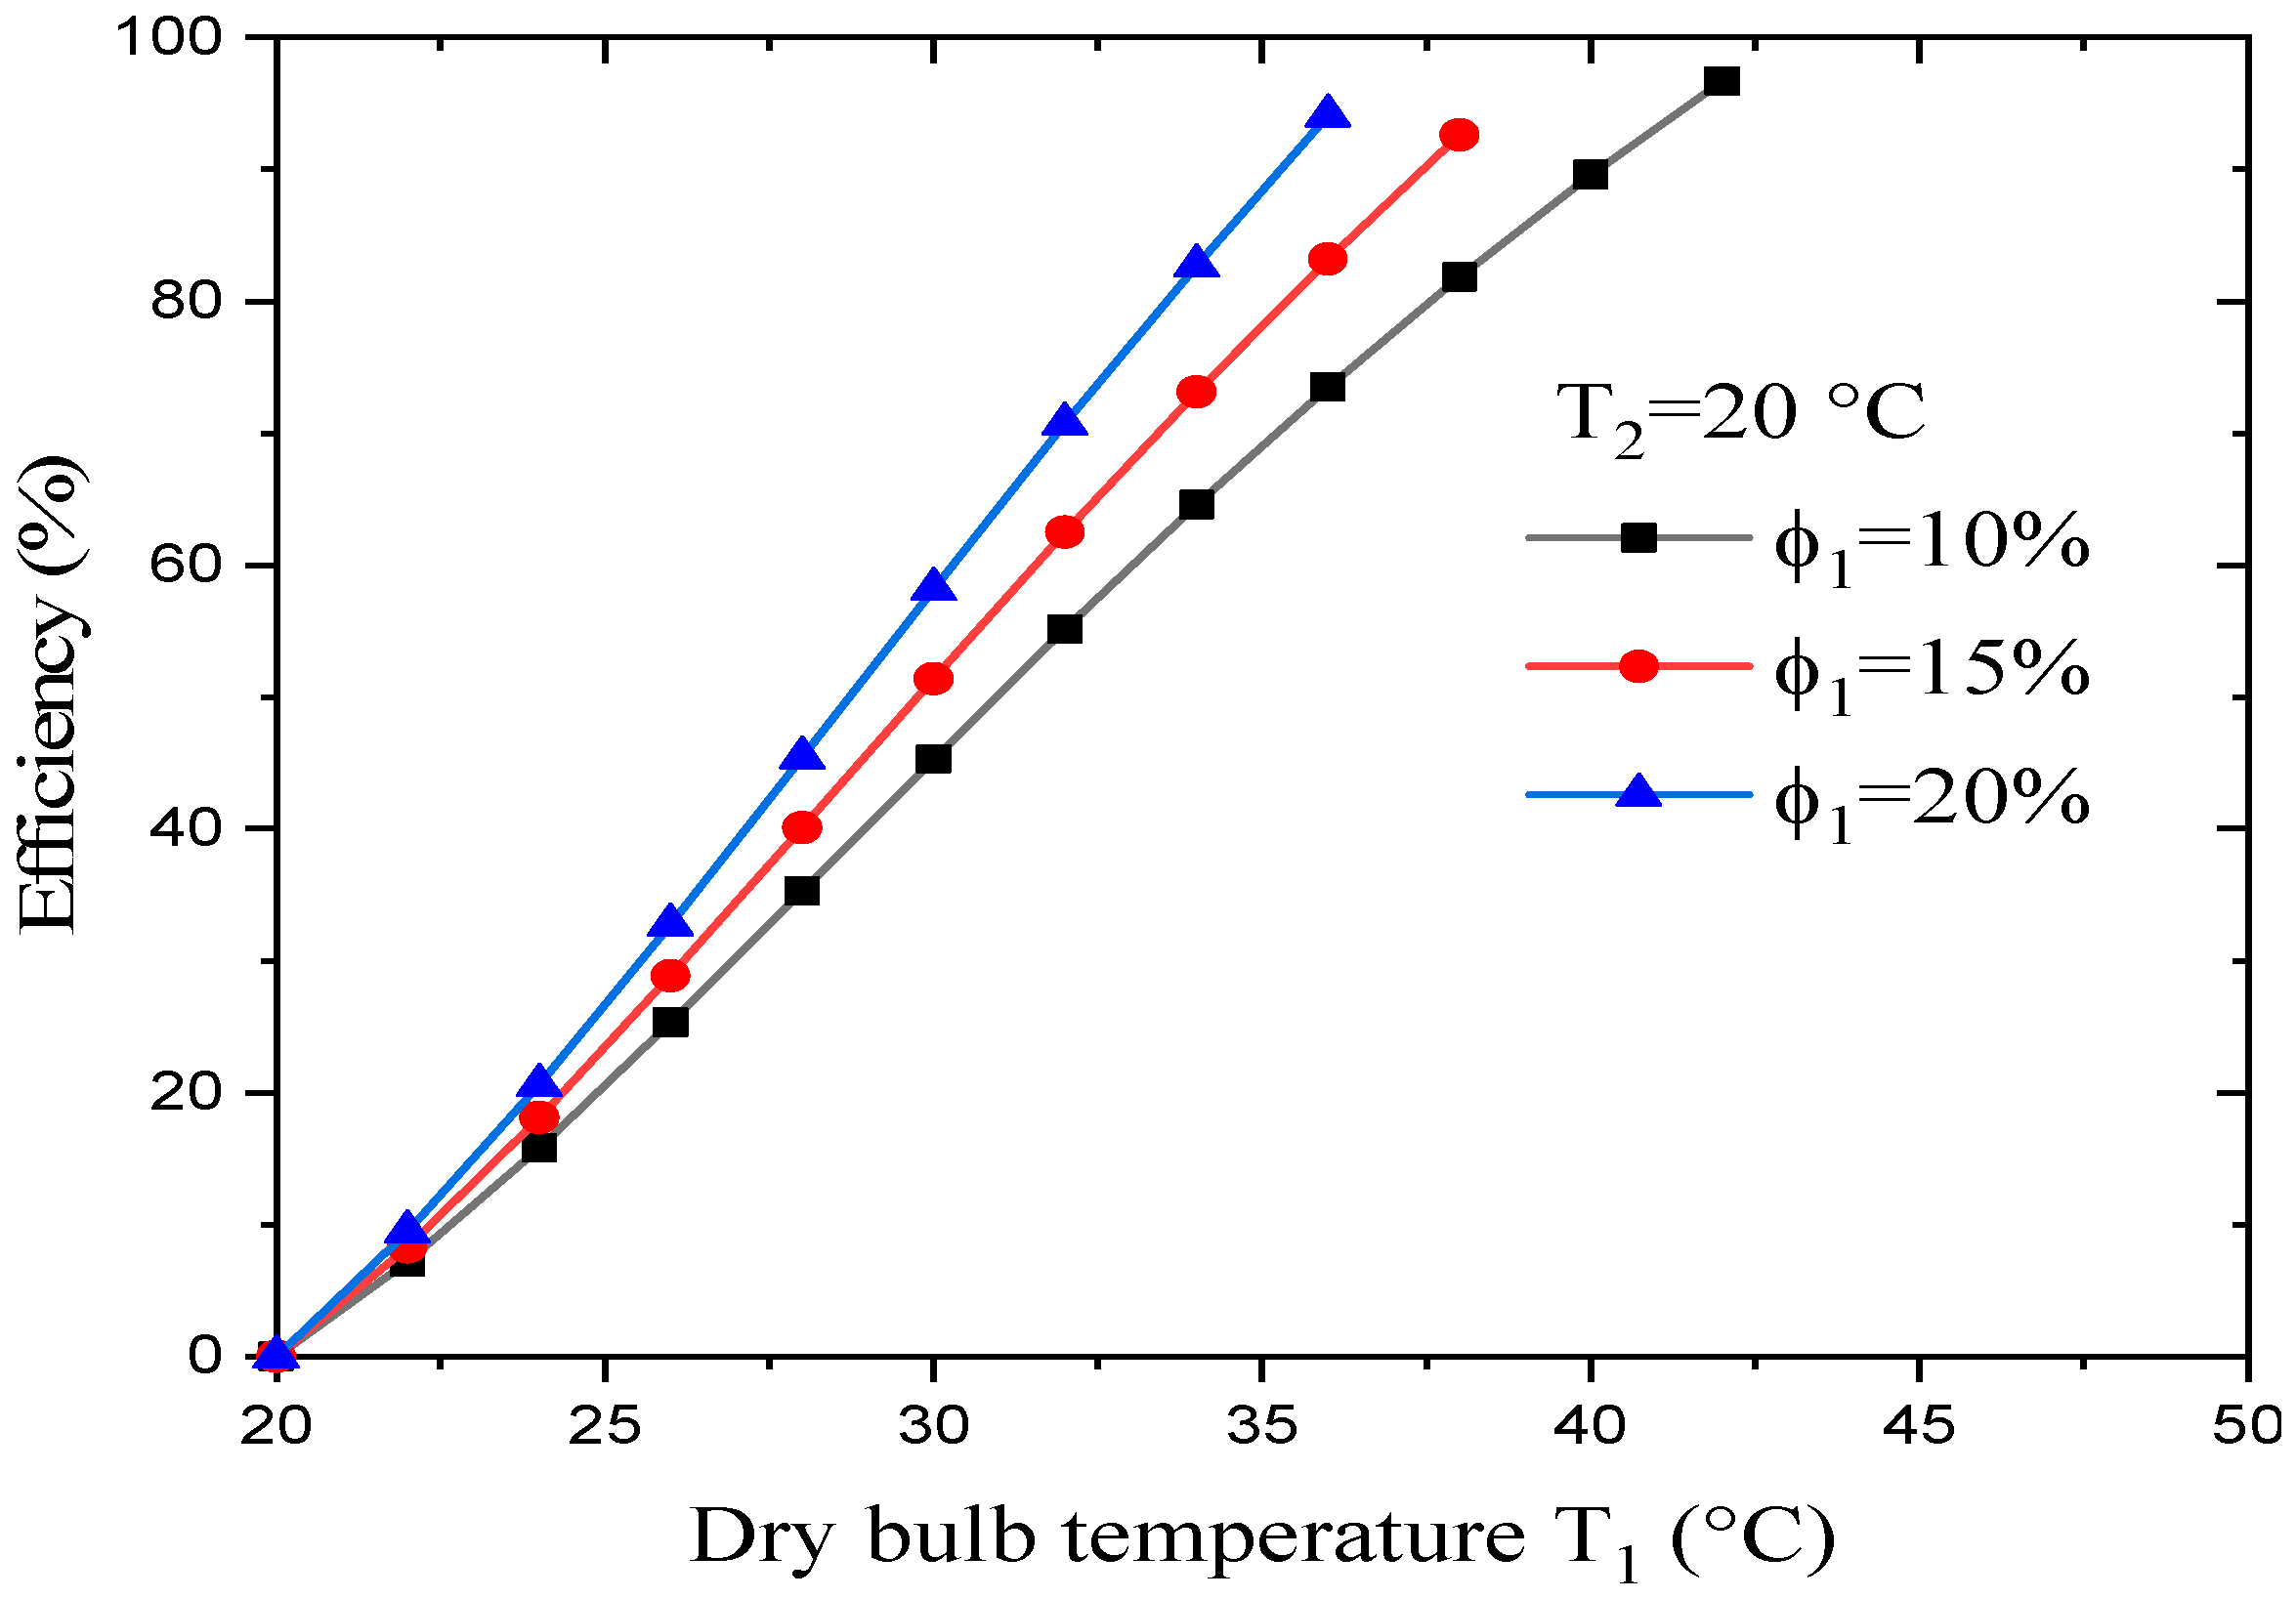
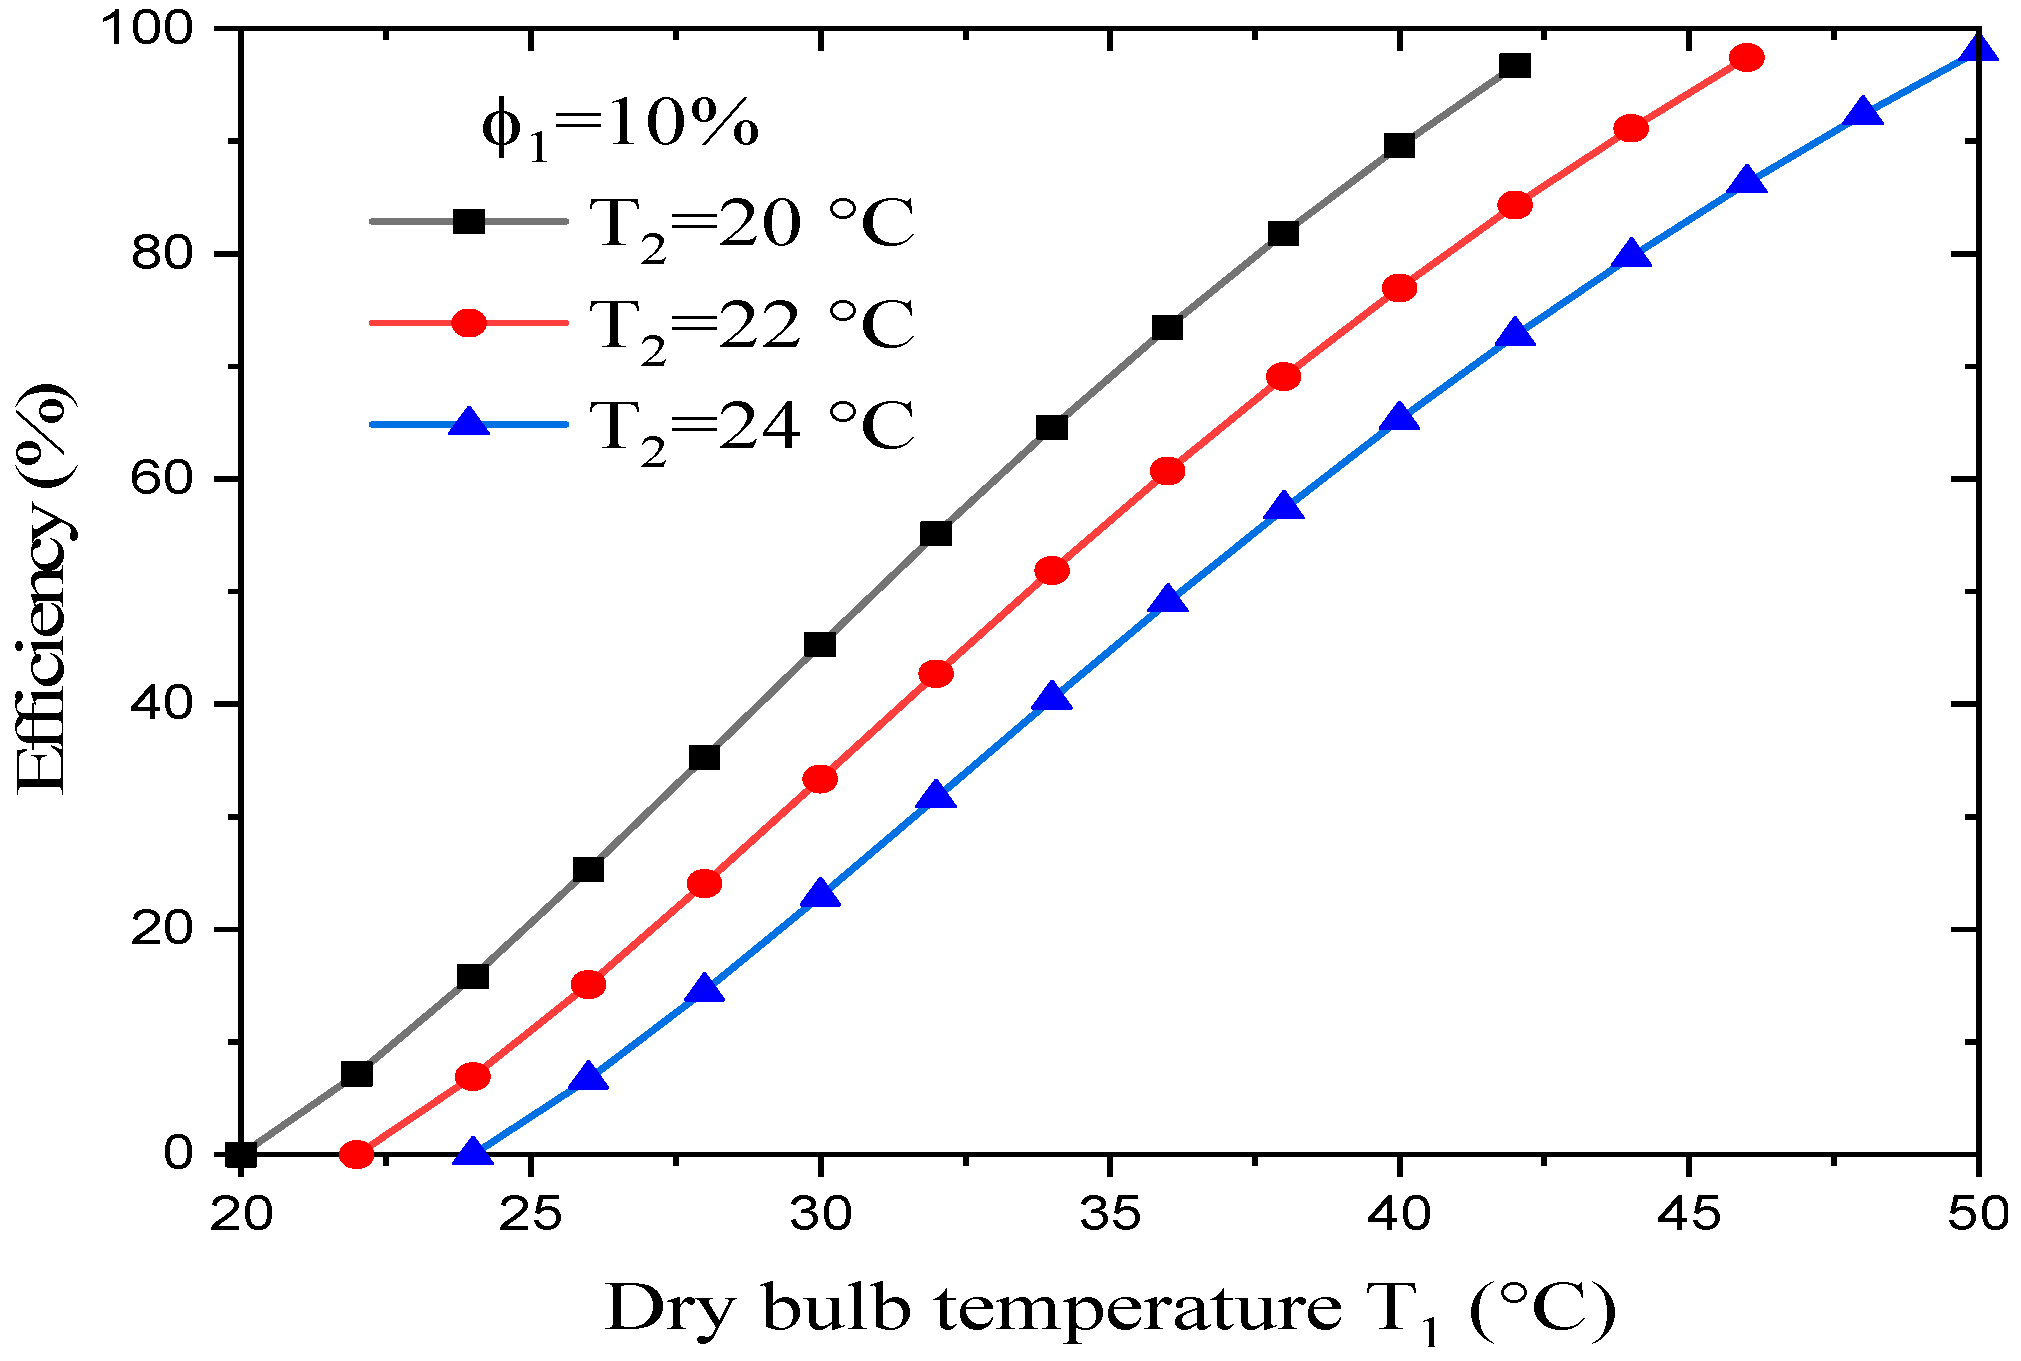
3.3.5. Effect of the Dry-Bulb Temperature on the Evaporative Cooler’s Efficiency

The dry- and wet-bulb temperatures place important limitations on the evaporative cooler’s performance. In fact, evaporative cooling can only be successful in regions where the wet-bulb temperature is reasonably low and coincides with a high dry-bulb temperature. As far as the dry-bulb temperature is concerned, most people agree that cooling is desirable in any climate where the ambient temperature exceeds 32 °C for several hours of the day over an extended period. Figure 10 presents the effect of changes in the input parameters (i.e., dry-bulb temperature T1 and relative humidity φ1) on the evaporative cooler’s efficiency. It was found that:
(i)
For a desired wet-bulb temperature T2, an increase in the dry-bulb temperature leads to an increase in the evaporative cooler’s efficiency.
(ii)
At a constant dry-bulb temperature and desired wet-bulb temperature, an increase in the dry air’s relative humidity leads to an increase in the evaporative cooler’s efficiency.
It is generally accepted that evaporative cooling is satisfactory only when dry-bulb temperatures in excess of 32 °C coincide with wet-bulb temperatures below 24 °C.
(iii)
For a desired wet-bulb temperature, the evaporative cooler reaches its maximum efficiency (about 94%) when the dry air’s relative humidity is low and the dry-bulb temperature is maximal, while it reaches its minimum efficiency (about 90%) when the dry air’s relative humidity is high and the dry-bulb temperature is low.
Figure 11 shows the effects that the dry-bulb temperature T1 and wet-bulb temperature T2 have on the evaporative cooler’s efficiency when the dry air’s relative humidity is constant. It was found that:
(i)
At constant relative humidity for the dry air, a rise in the dry-bulb temperature leads to an increase in the evaporative cooler’s efficiency.
(ii)
With the dry-bulb temperature and the dry air’s relative humidity kept constant, a rise in the wet-bulb temperature leads to a decrease in the evaporative cooler’s efficiency.
(iii)
For a preferred wet-bulb temperature, the evaporative cooler reaches its maximum efficiency (about 98%) with a high wet-bulb depression (WBD), while it reaches its minimum efficiency (about 96%) for a low wet-bulb depression (WBD).
These results are consistent with those obtained by Ayad and Jasim [34] and Camargo et al. [35].
The wet-bulb depression (WBD) gives a useful indication of the degree of heat stress prevention, something that is at its greatest during the summer. In this study’s case, the WBD is so large that it will affect the efficiency of the evaporative cooler.
Figure 10. Effect of dry-bulb temperature on the evaporative cooler efficiency for different dry air relative humidities and constant wet bulb temperature.
Coatings 13 01901 g010
Figure 11. Effect of dry-bulb temperature on the evaporative cooler efficiency for different wet bulb temperatures and constant dry air relative humidity.
Coatings 13 01901 g011

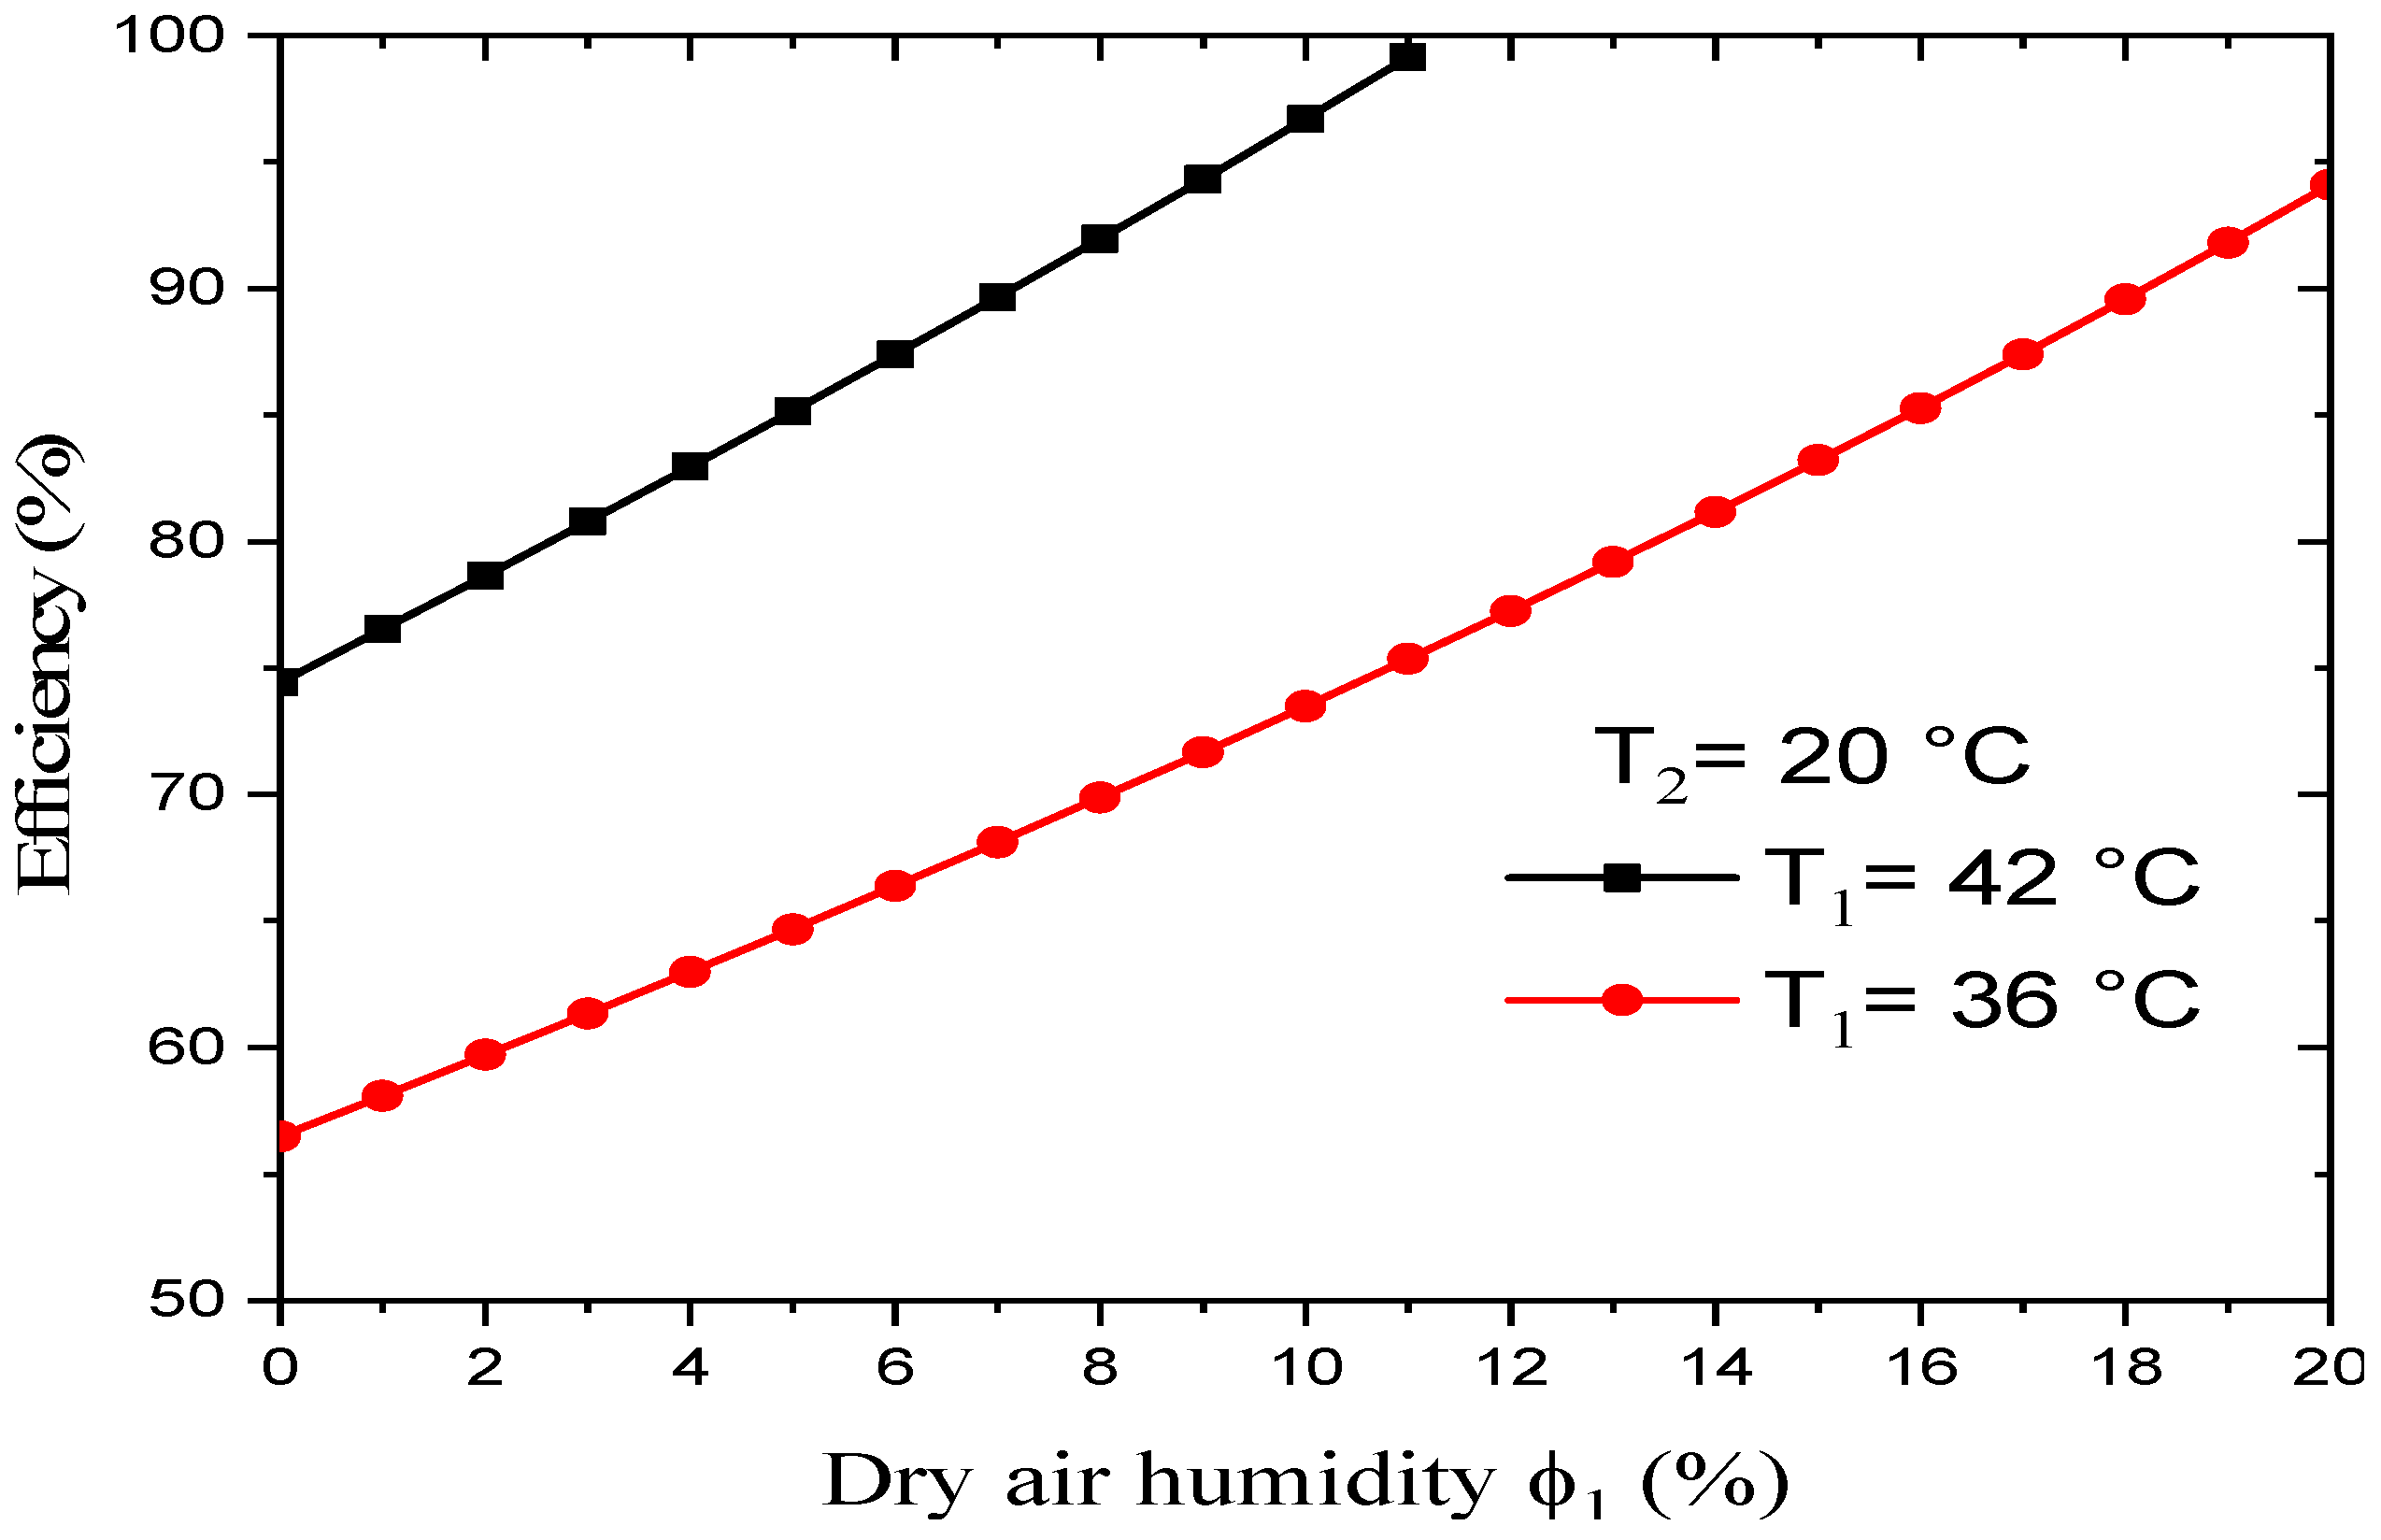
3.3.6. Effect of the Dry Air’s Relative Humidity on the Evaporative Cooler’s Efficiency

Figure 12 shows the effect of the dry air’s humidity φ1 on the evaporative cooler’s efficiency for a constant wet-bulb temperature but varying dry-bulb temperature. It was found that:
(i)
At a constant relative humidity for the dry air and the desired wet-bulb temperature, the evaporative cooler’s efficiency increased along with an increasing dry-bulb temperature. This efficiency was maximized for a critical pair of input parameters (T1, φ1).
(ii)
At a constant desired wet-bulb temperature and dry-bulb temperature, the variation in the evaporative cooler’s efficiency according to the dry air’s relative humidity was not linear. Indeed, for the pair (T1 = 42 °C; T2 = 20 °C), a 10% rise in the dry air’s relative humidity φ1 leads to an increase in the evaporative cooler’s efficiency of about 25%. For the pair (T1 = 36 °C; T2 = 20 °C), however, a rise in the dry air’s relative humidity φ1 of about 20% leads to an increase in the evaporative cooler’s efficiency of about 40%.
Figure 12. Effect of dry air relative humidity on the evaporative cooler efficiency for different dry bulb temperatures and constant wet bulb temperature.
Coatings 13 01901 g012
In summary, evaporative coolers achieve higher efficiency in hot and dry climates with low humidity and lower ambient dry-bulb temperatures. As the dry-bulb temperature increases and the humidity rises, the efficiency of the evaporative cooler decreases. It is important to consider the local climate conditions and the specific design and sizing of the evaporative cooler to optimize its efficiency.

4. Experimental Investigation

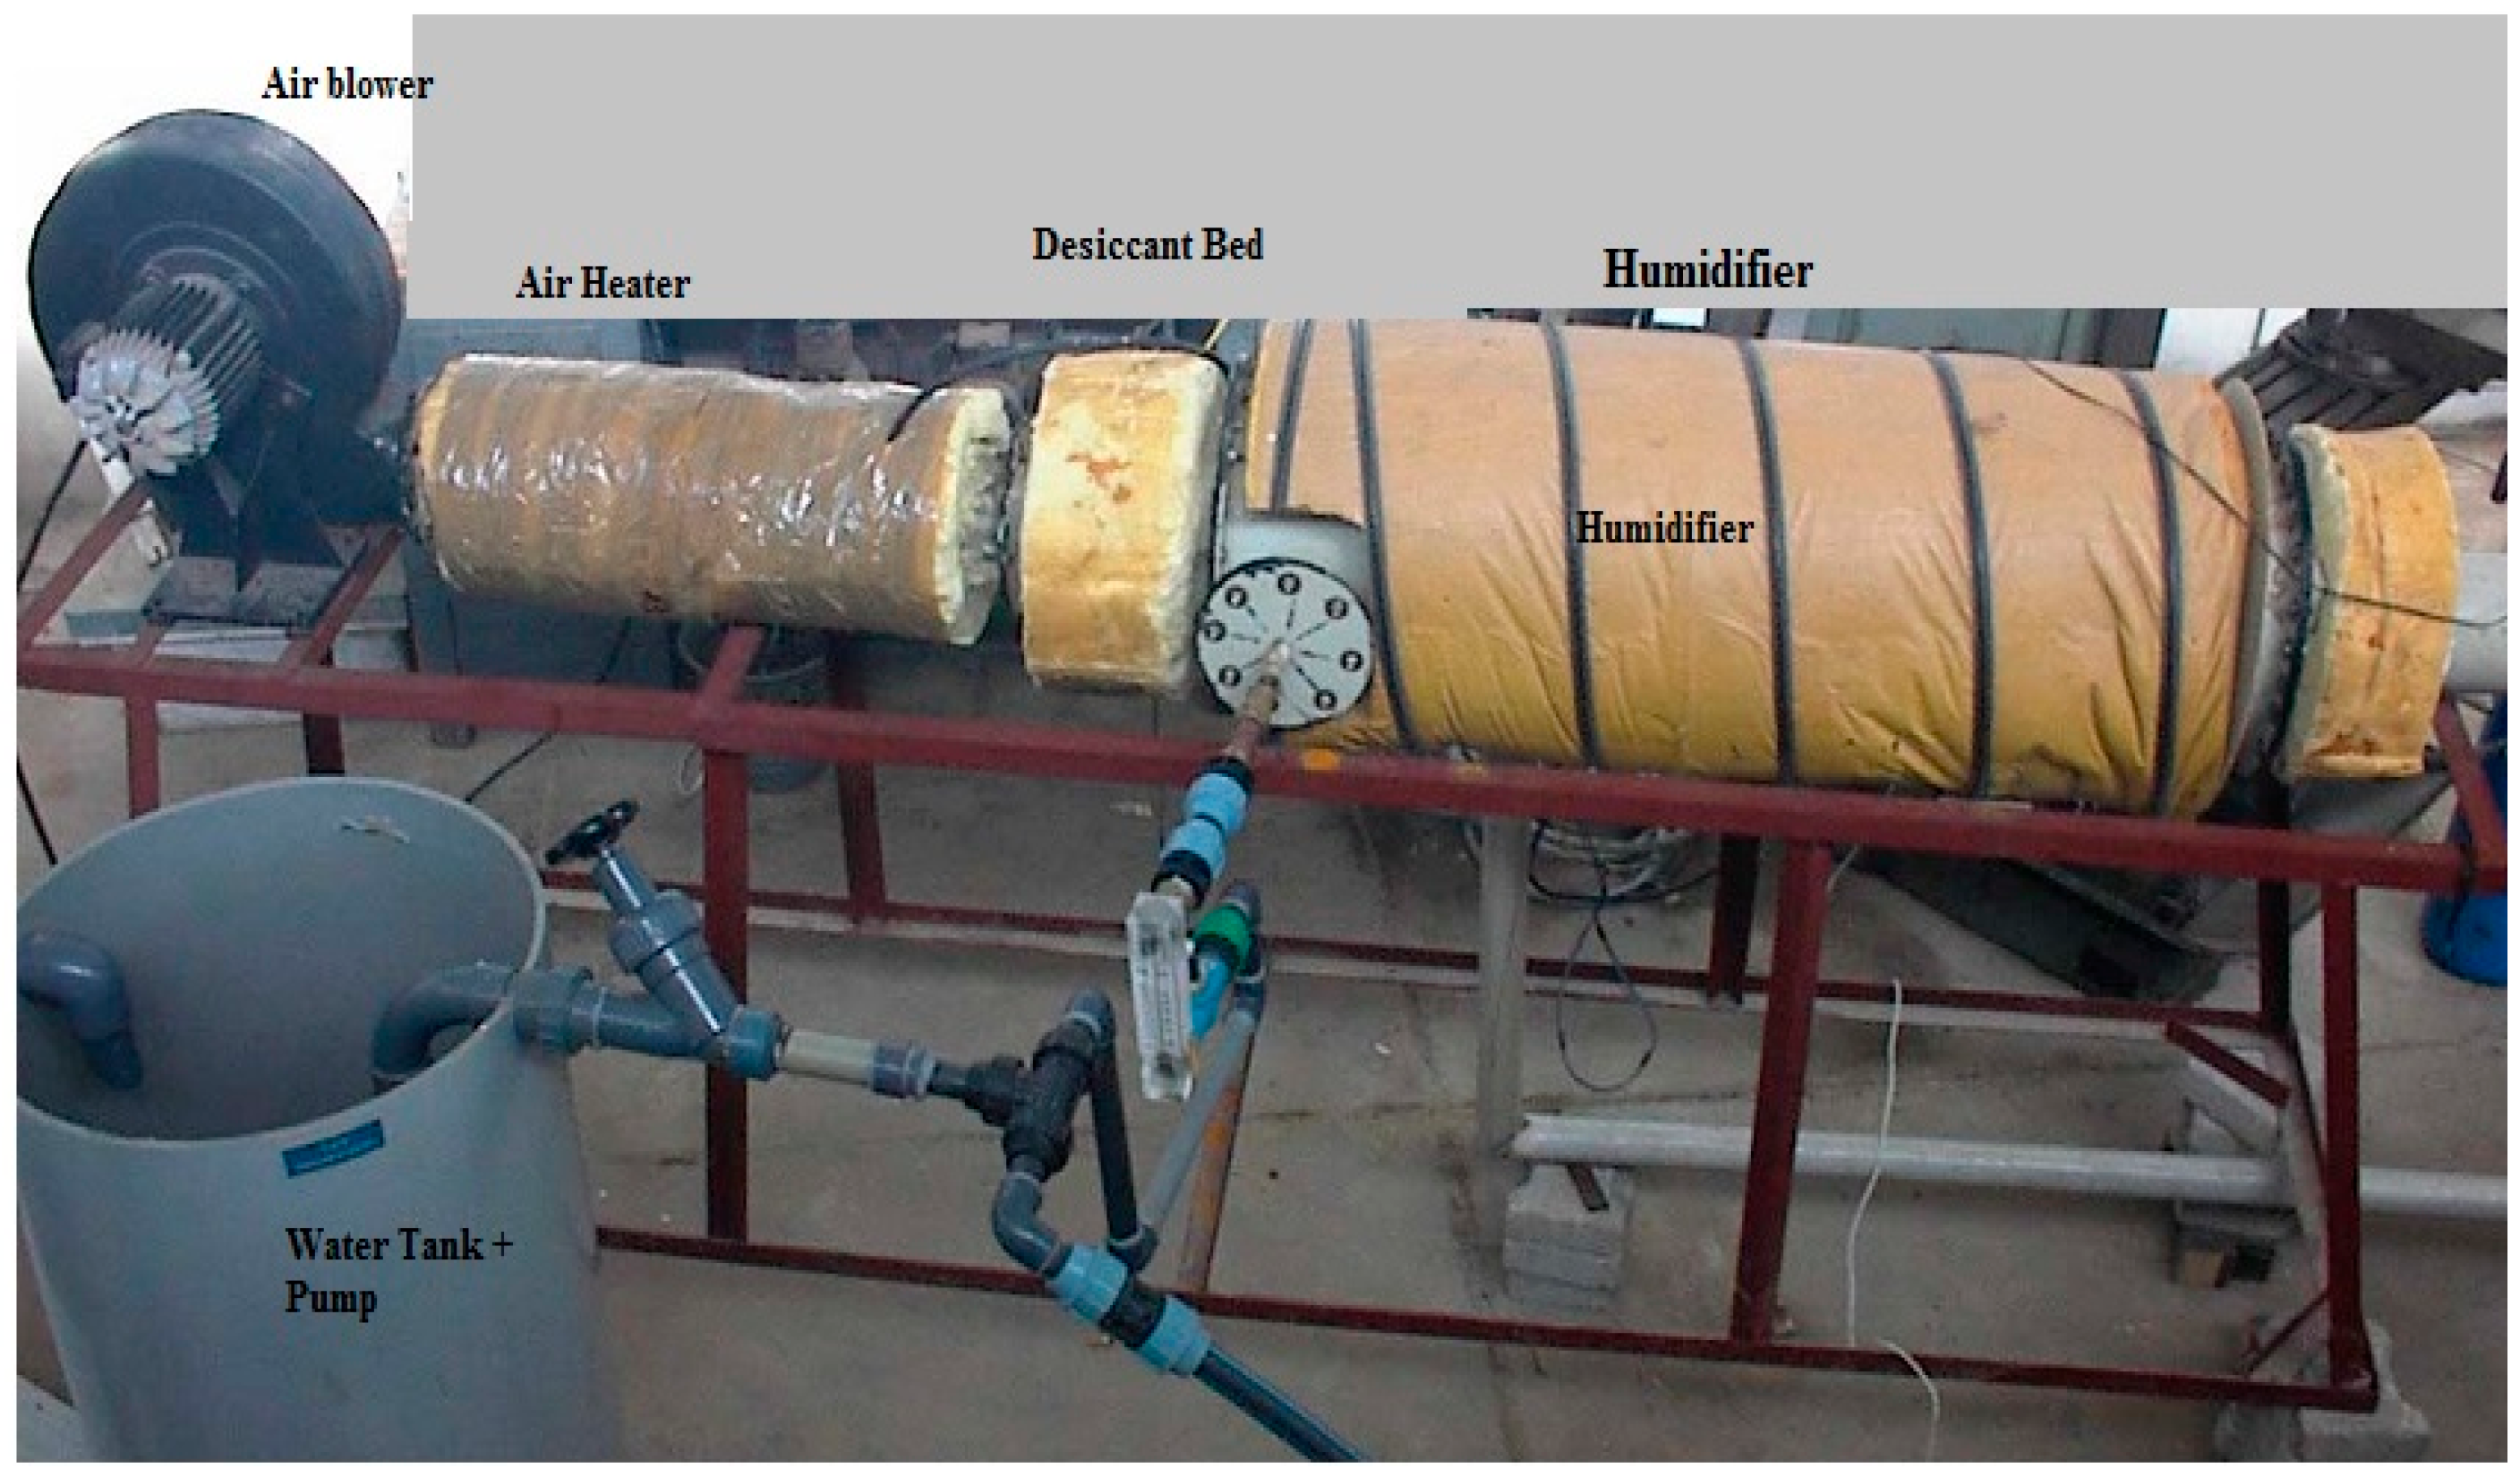
4.1. Experimental Set-Up

An experimental installation was built in the Thermal Process Laboratory at the Research Center of Energy CRTEn Bordj Cedria, Hammam-Lif, Tunisia. It allows for parametric studies on humidifiers. We can vary the temperatures, the air flow, and water flow rates at the inlet of the humidifier as well as the nature of the porous media (Figure 13). The installation essentially comprises a fan, an air flow regulator, a heating resistance, a water tank, a water circulation pump, a slide comprising the spray tubes and serving as a support for the porous matrix, an air–water exchanger, and a bed filled with silica gel (desiccator).

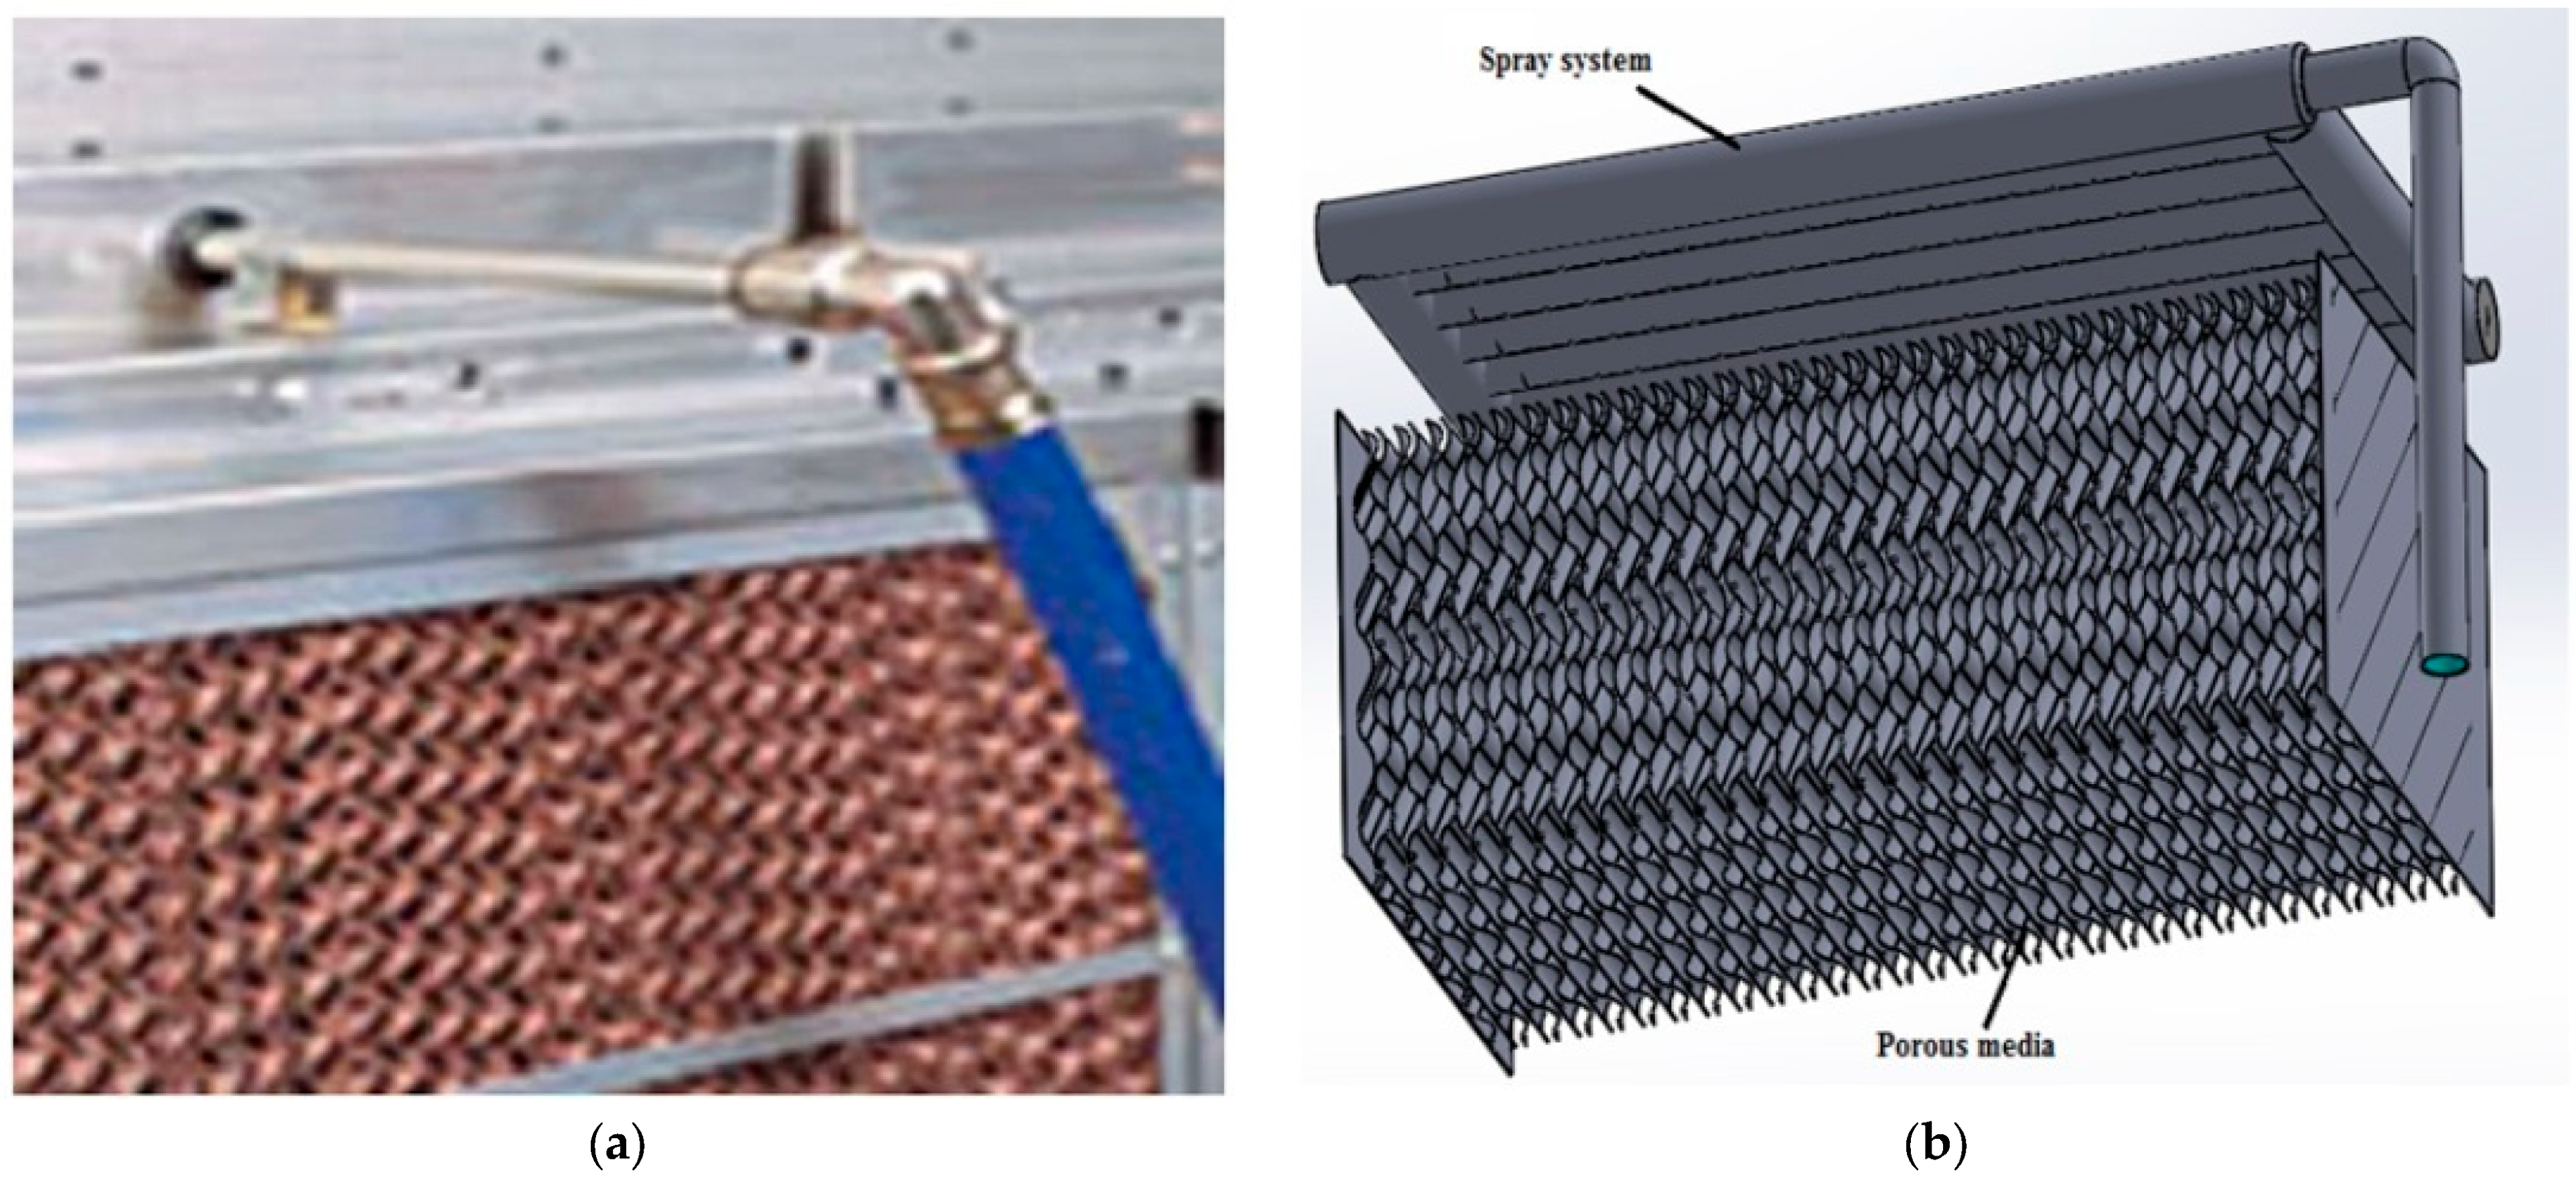
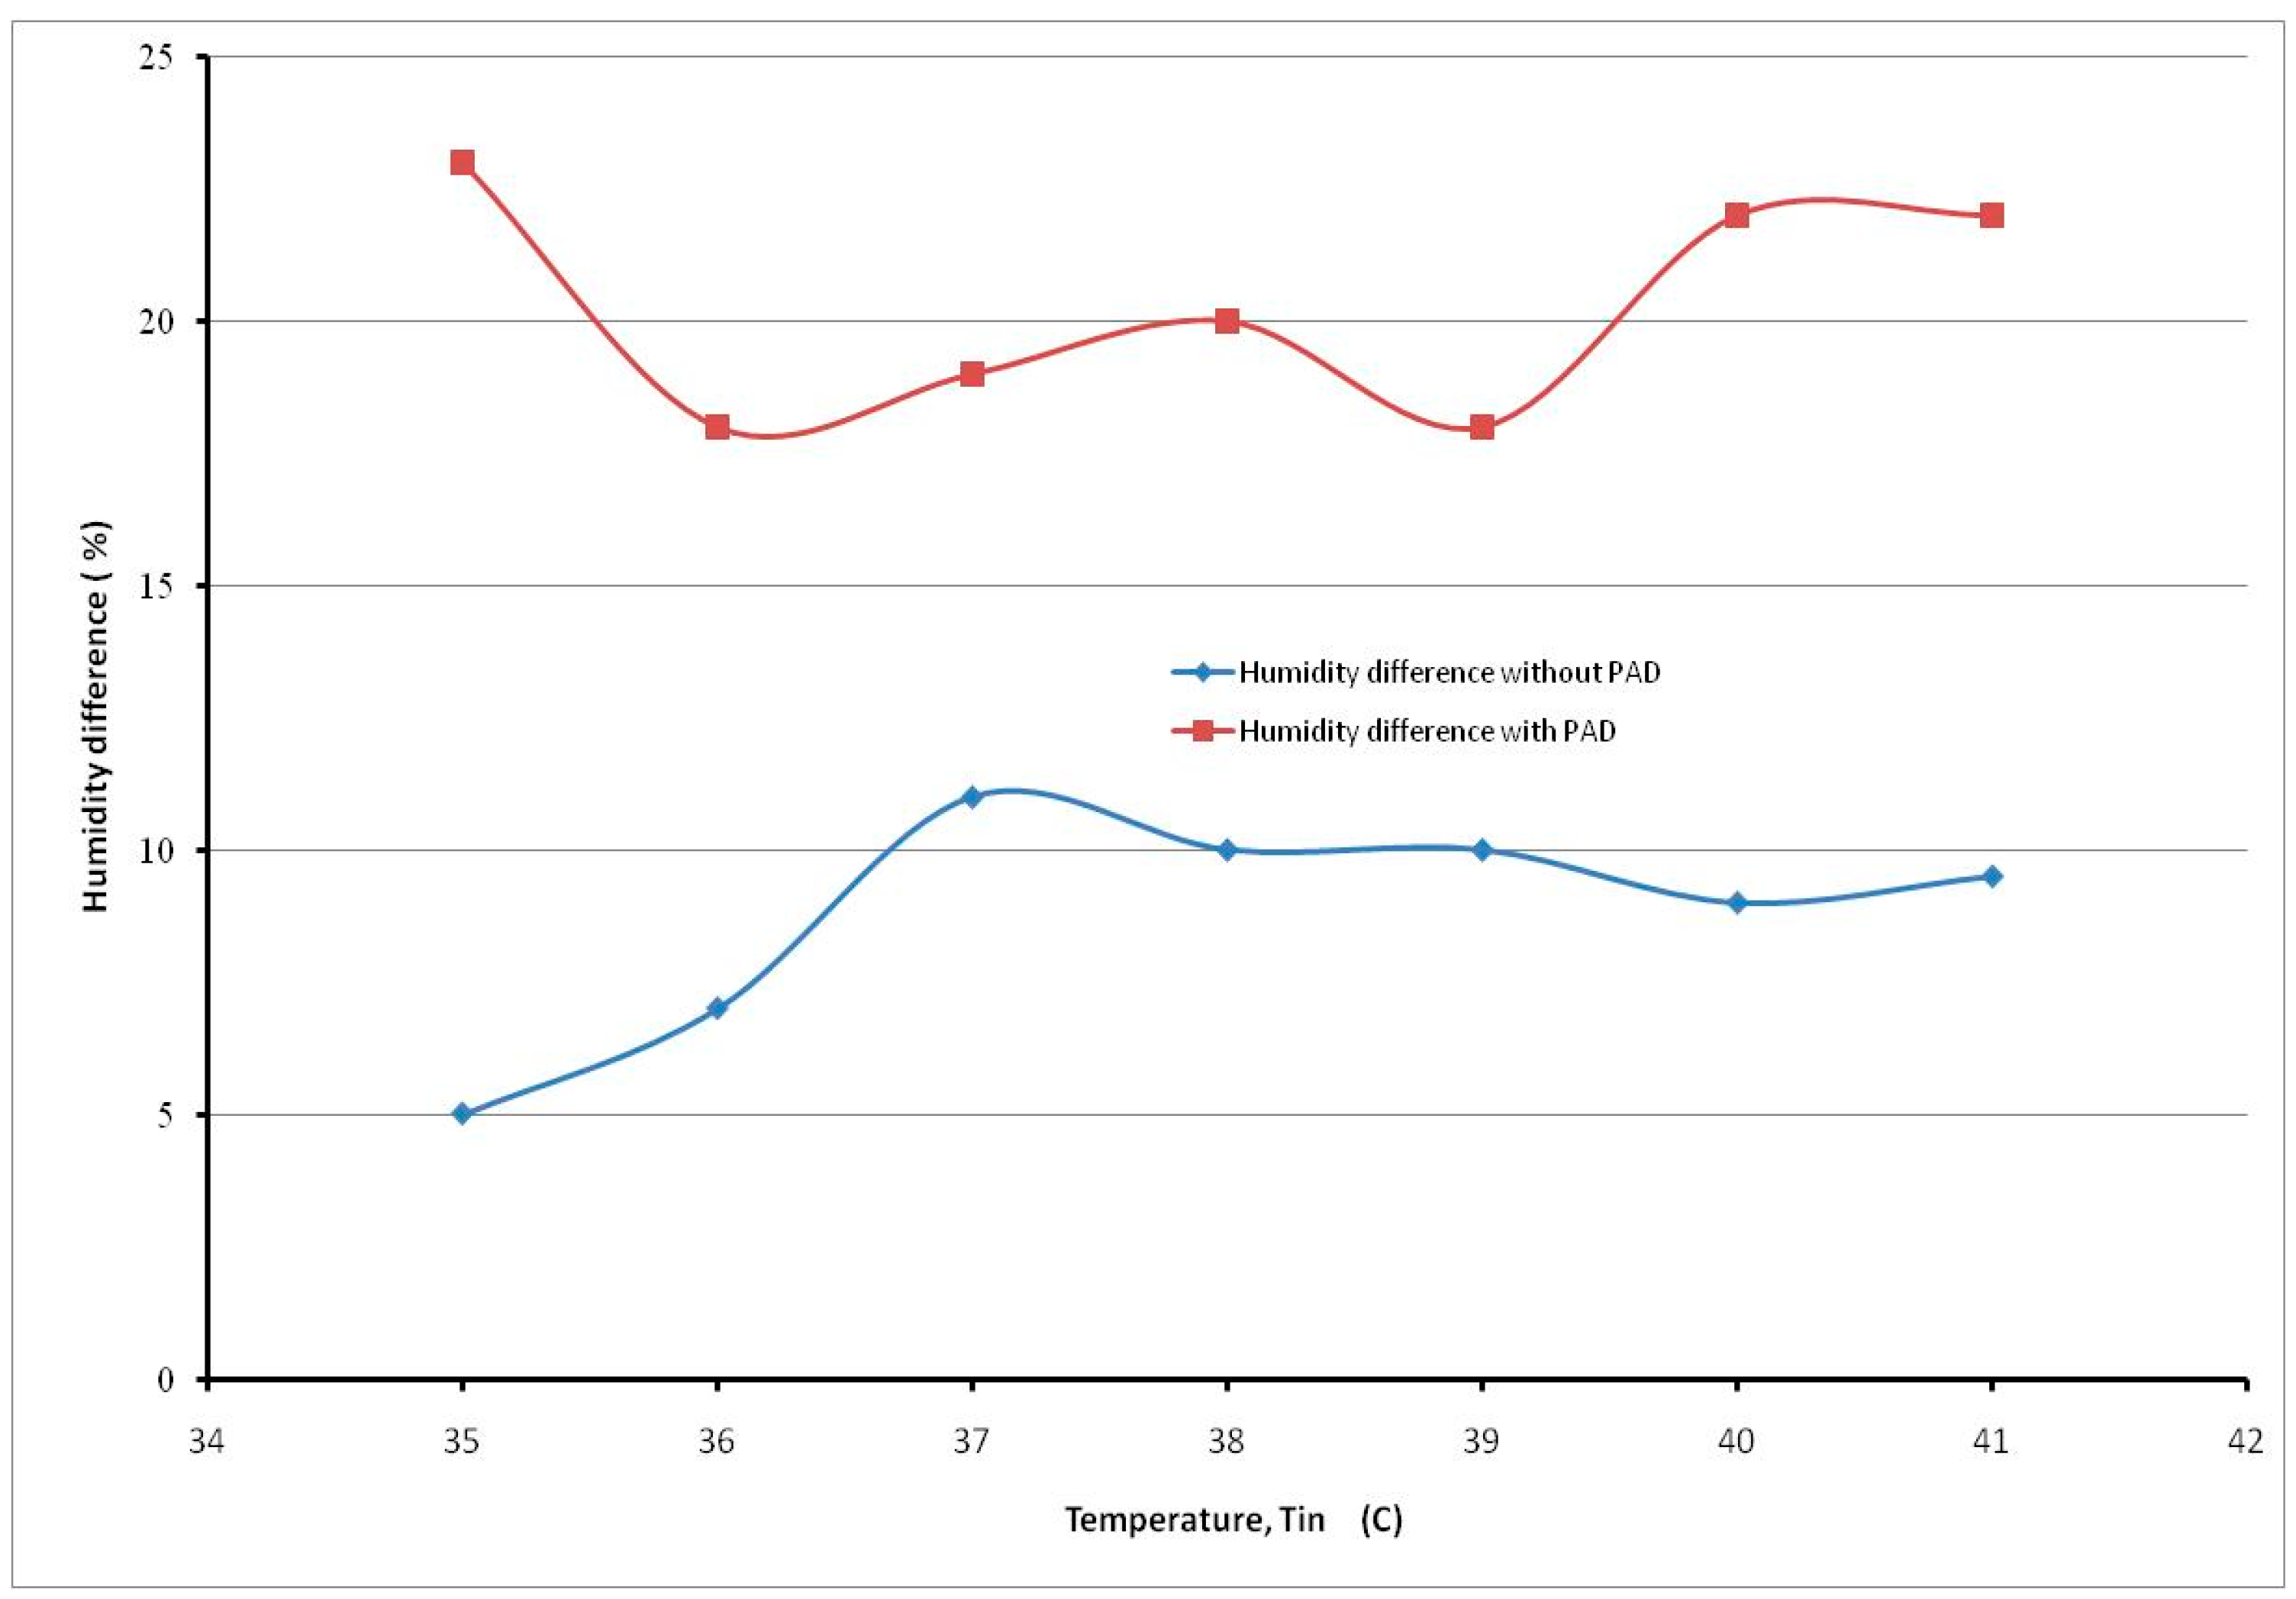
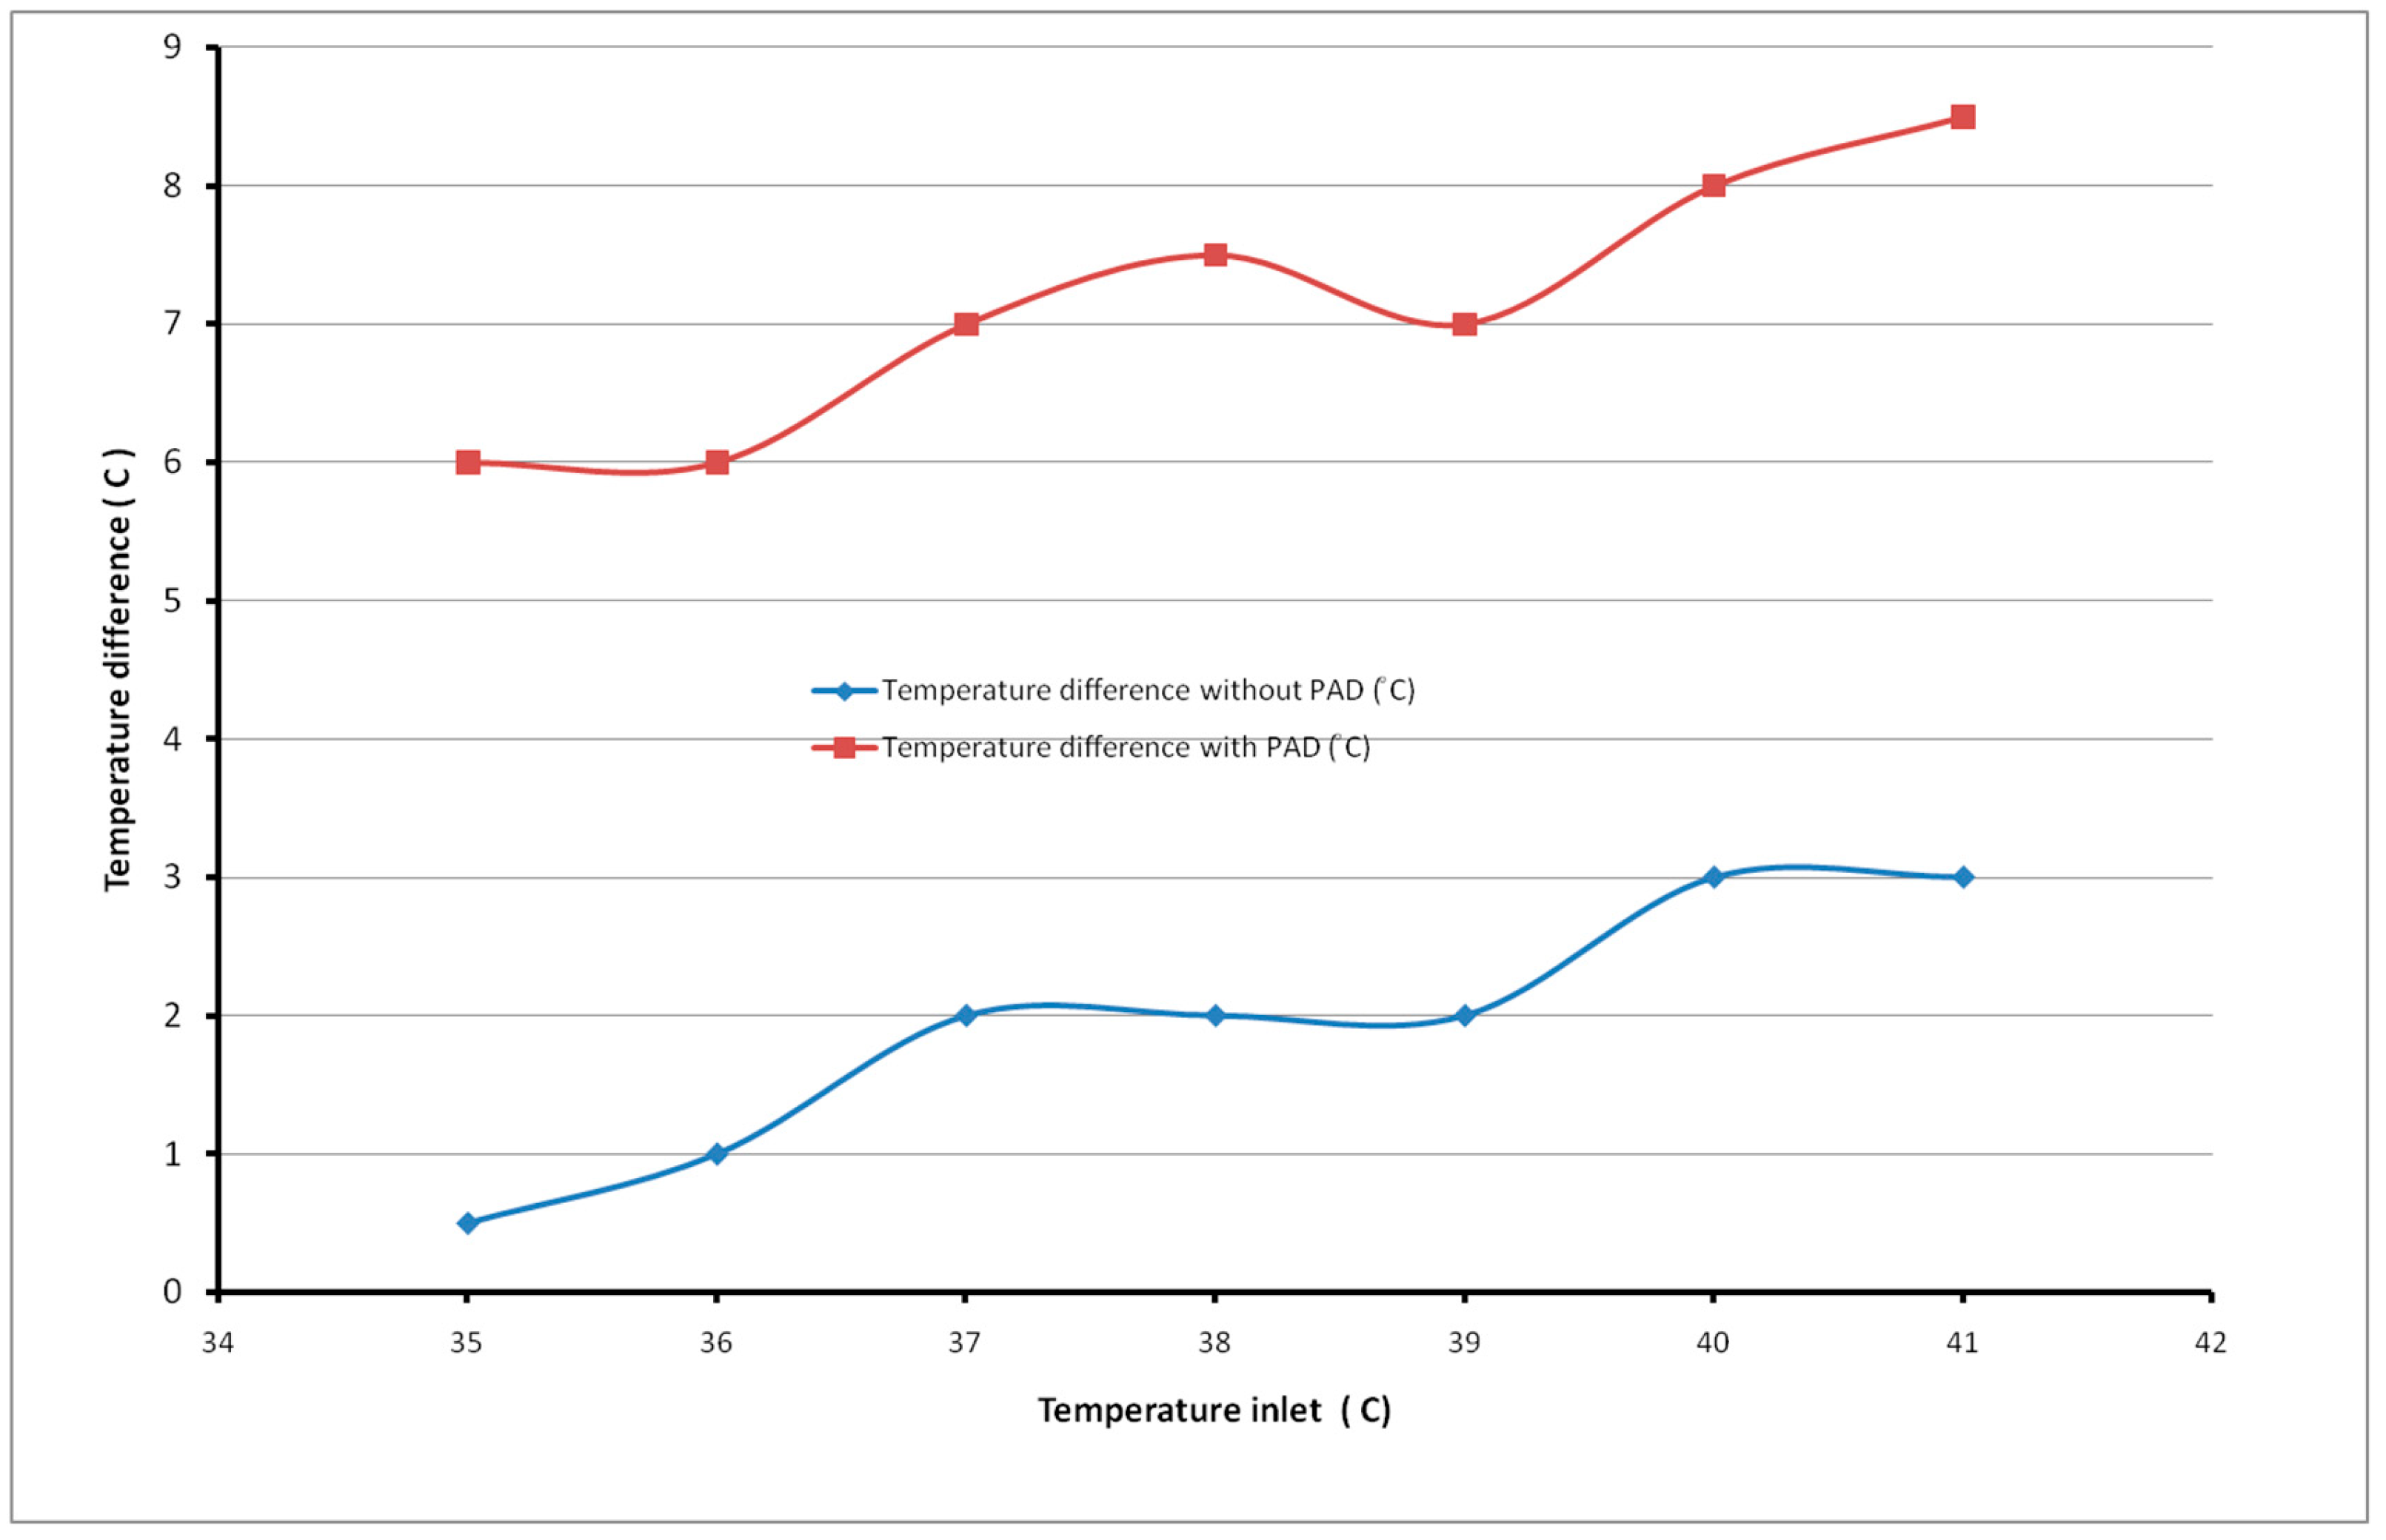
4.2. Humidification Study

To study air humidification, we used the loop presented in Figure 2. It was composed of the air blower, the humidifier, a water tank, and a water pump. The humidifier was composed essentially of porous media and spray nozzles. The porous media used in the humidifier as trickle surfaces under the water sprays, are essentially formed by reinforced cellulose papers by glass fibers (Figure 14). These papers are porous and resistant over a long period of time to repetitive wetting–drying cycles. They are wavy at different angles (such as 45° and 60°) and assembled alternately to form air channels. This aerodynamics architecture makes for minimum pressure losses during the flow of air and improves evaporation. The porous matrix is compact and heavy, providing a very large water evaporation surface for a given volume. Its compactness is about 200 m2/m3. The cooling pad materials are made of cellulose, fiberglass, coated non-ferrous metals, resins, and other additive chemical elements. The combination of these materials is carefully selected to create a component that offers high absorbency, structural integrity, and possibly other desired characteristics. The specific use of the pad, as well as the properties required for its intended application, influence the choice of materials and their proportions in the construction. The used pad material has a density of 1.6 g per cubic centimeter (g/cm3). It has a porosity exceeding 90%, allowing it to absorb and retain liquids efficiently. It can absorb up to 20 times its weight in water.
The pad surface consists of corrugated sheets of 0.7 mm thickness assembled on the matrix at 45/45 and 30/60 angles. This configuration increases the available surface area of the pad for fluid contact and provides improved wicking and liquid transport properties. The cross-section area of the pad is 0.335 × 390 m2 and the surface area per unit volume is 360 m2/m3. The thermal proprieties of the used pad humidifier, such as the heat and mass transfer coefficients, with rising air temperature and water flow rate to the humidifier are h c = 45 W / and h m = 0.23   m / s .

4.3. Measuring Instruments

During the carried out tests, we mainly used the following measuring instruments:
-
Float water flow meter that can measure water flow from 0 up to 50 L/min. Hygrometer which measures both temperature and relative humidity.
-
OMRON E5AW type temperature display controller.
-
TDL (Tegnologic) type temperature displays.
-
Thermocouple: Type K in nature (Chromelle-Allumelle).
-
Pt100 type thermistors.
-
Vane probe type vane to measure the air flow.
-
An “HP Agilent Data Logger” type acquisition channel for the acquisition and data processing.

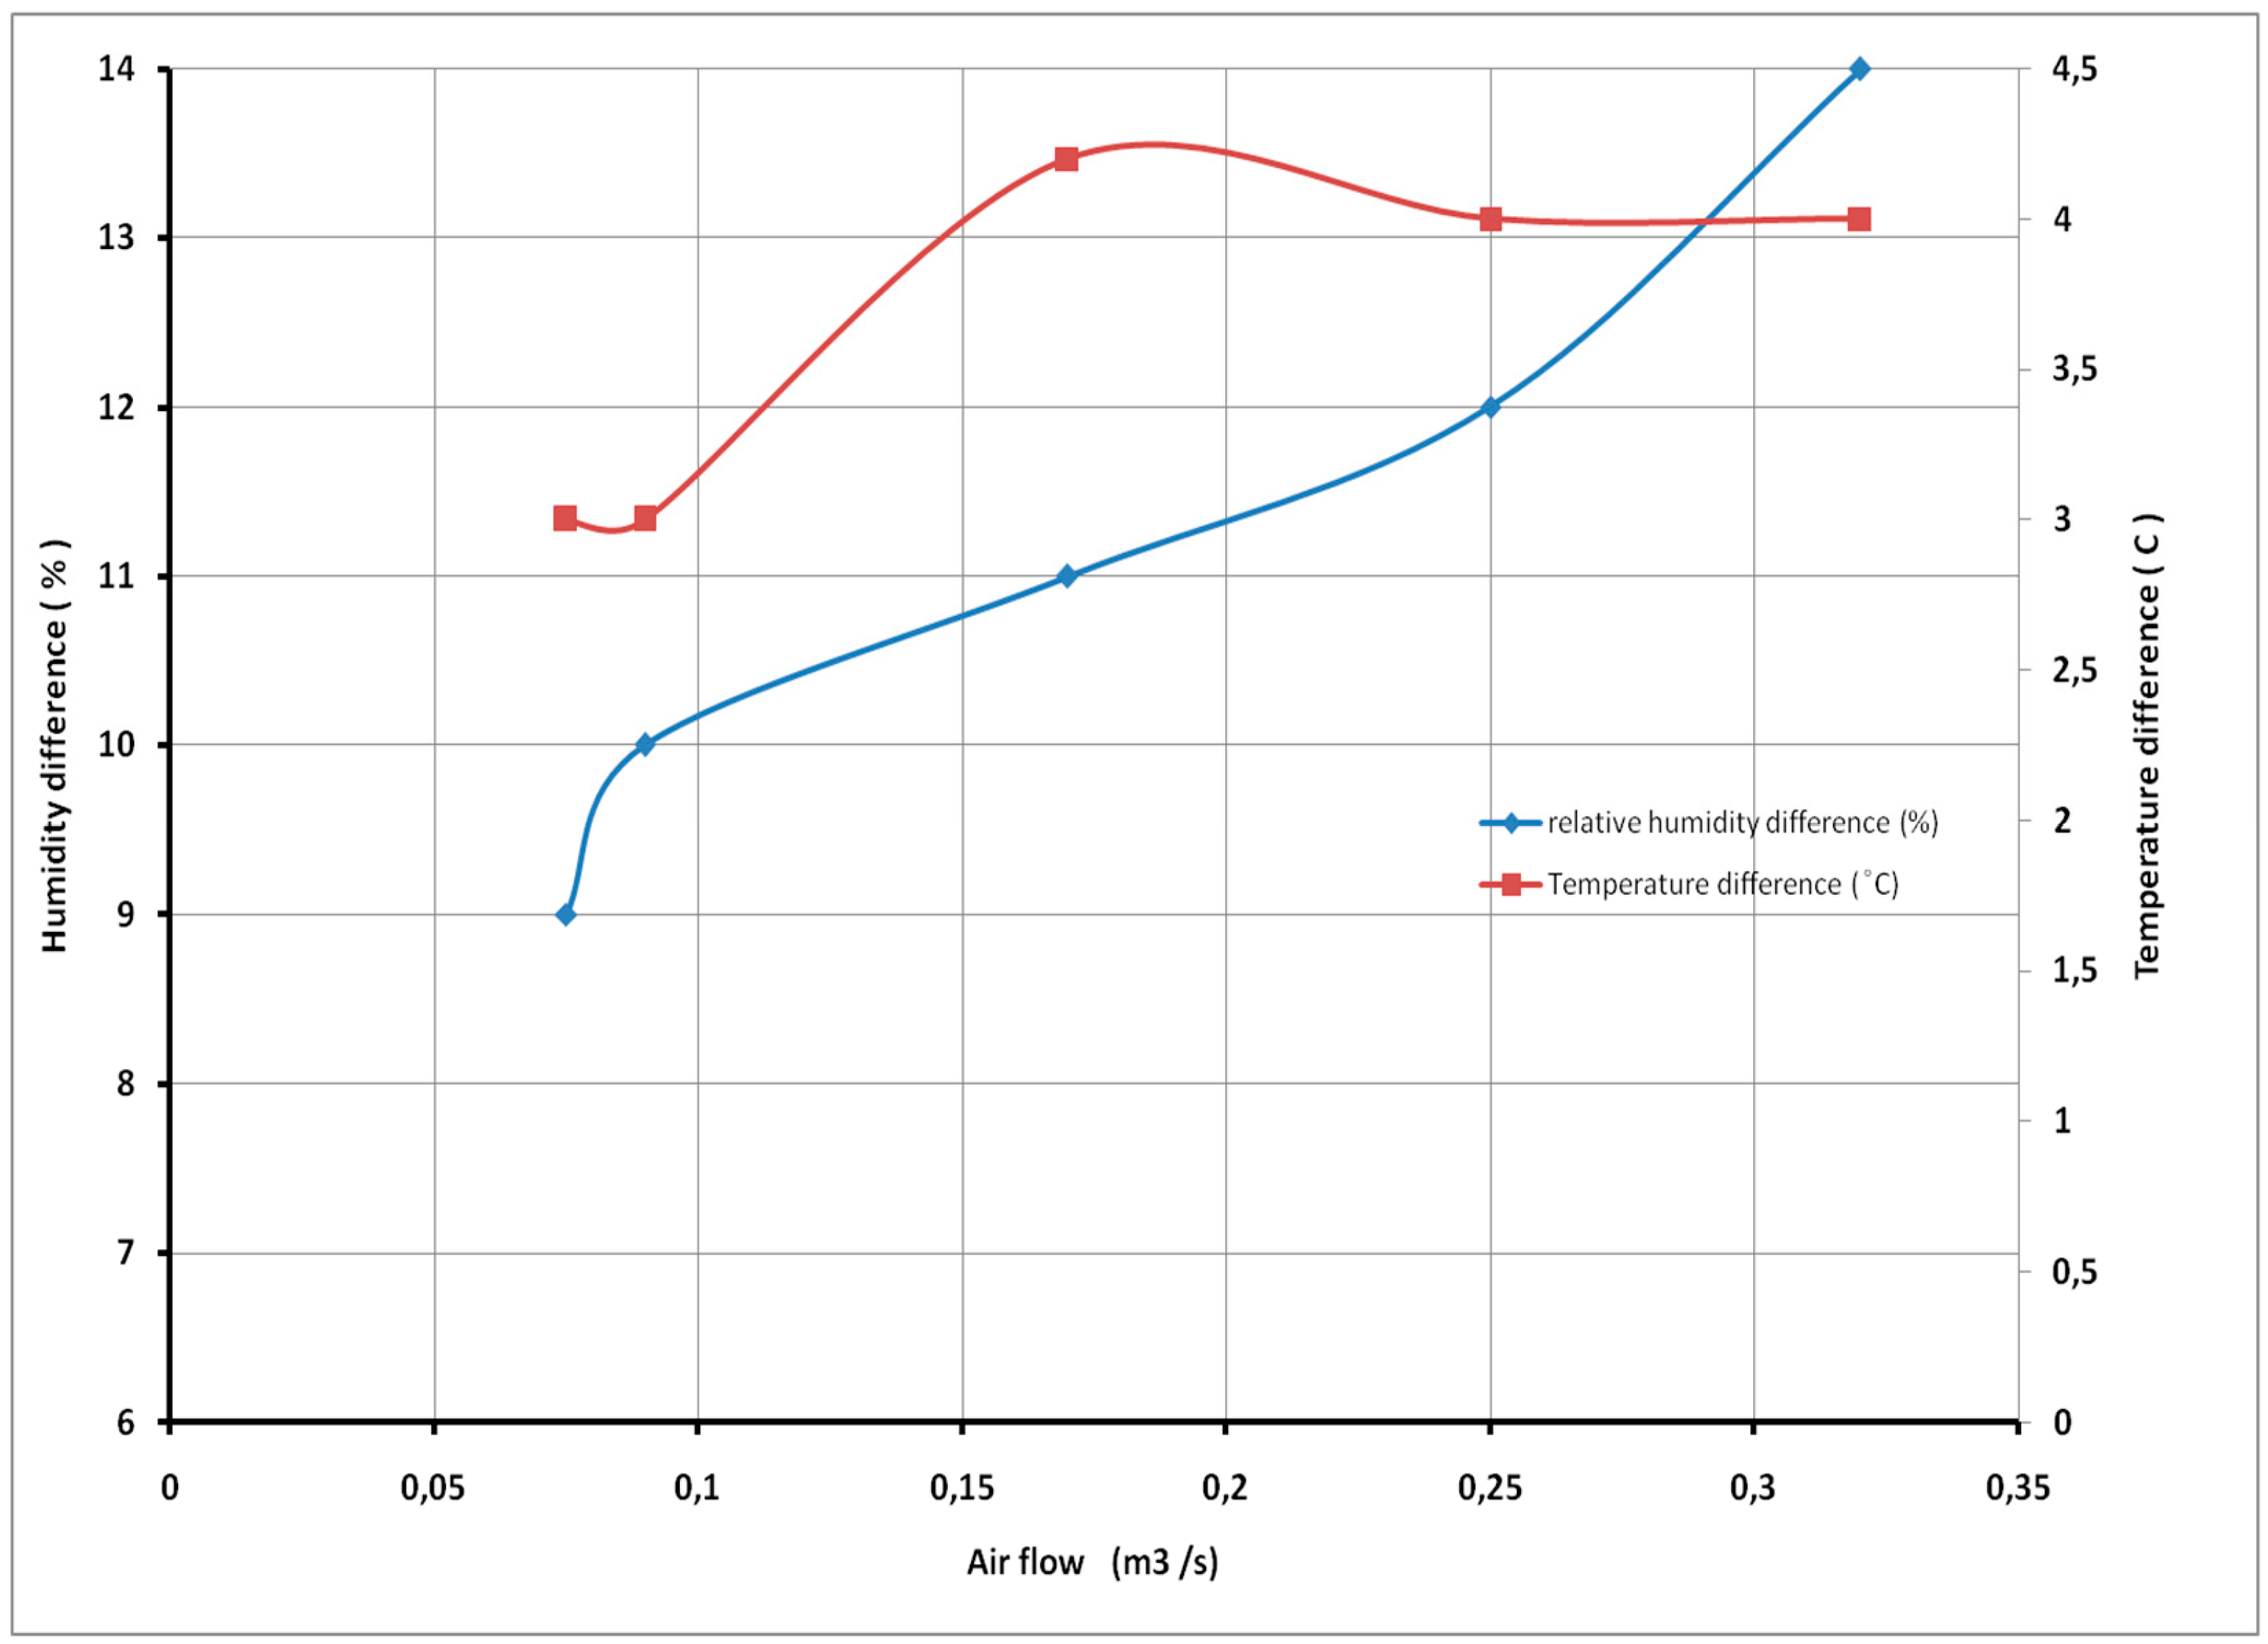
4.4. Tests and Experimentation

After the development of the installation and the preliminary tests, we carried out a parametric study on the humidifier to test the effects of ambient conditions operation on its performance. We tried two configurations, in the first the humidifier sprays without porous media, and in the second, we added the porous medium “pad”. To determine the influence of the air flow rate on its temperature and its humidity at the humidifier output, we set the air inlet temperature: Te = 42 °C and spray water flow: Qwater = 25 L/min We varied the air flow while measuring the temperature and humidity of the air leaving the humidifier.
The obtained results (Figure 15) show that the air outlet temperature decreases and the humidity increases if air flow is increased. Beyond a flow rate of 0.1 m3/s, the transport of water droplets by the air becomes perceptible. We chose the flow rate of 0.077 m3/s as the optimal throughput for the other experiments. In order to determine the influence of the porous matrix on the temperature and humidity of the air leaving the humidifier, we have set a spray water rate Qwater = 25 L/min and supply air flow QVair = 0.077 m3/s. The air temperature at the inlet of the humidifier was varied for the configurations with and without a porous matrix. The air temperature was measured at the outlet of the humidifier. The air relative humidities entering and leaving the humidifier were also measured.
Figure 16 shows that the difference between the relative humidity of the air at the inlet and the outlet of the humidifier is more important in the case where the porous matrix is added. This gap is around 10% without the matrix and it exceeds 20% with the porous matrix.
Figure 17 shows that the temperature difference is greater when using the porous matrix. This difference is around 2 °C and 7 °C without and with the porous matrix, respectively. After the measurement campaign that we carried out, we noticed that the porous matrix installed under the humidifier water sprays improves air humidification. It increases evaporation by increasing the contact surface between the air and water. The decrease in temperature at the outlet of the humidifier is more important in the case of the use of the porous matrix. Using the optimized air flow rate and porous media with spray water, many experiments were conducted at different ambient air temperatures and humidities, as represented in the humidity air diagram (Figure 18). For temperature ranges between 36 and 47 and relative air humidity between 15 and 50%, we can obtain by direct humidification air whose ranges of temperature and humidity are respectively between 25 °C and 29 °C and 55% and 85% [36]. Thus, evaporative cooling is feasible and suitable under Tunisian climate conditions during the hot season. For humid regions near the sea, we can add the desiccation phase to make this process suitable. The evaporative cooling process is suitable for air conditioning and cooling for human comfort [37], but also, we can extend the applications for animal breeding areas, and in particular chicken poultry, which suffer from the heating during the summer in Tunisia and consume a lot of energy for air conditioning.

5. Conclusions

In this work, modeling and simulations were developed to investigate the performance of an evaporative cooling system under different climate conditions in Tunisia. An experimental study based on the construction of an evaporative cooling prototype was also performed. The obtained results show that evaporative cooling systems can provide substantial relief from the high dry-bulb temperatures found in desert-type climates. The study showed the suitability of the process for most Tunisian regions and the dependence of the process performances on the humidity and temperature of the ambient air. The study of the performance and comfort obtained by this system under different real climate conditions allowed us to predict the efficiency of this technology for each climate zone. Using the steady state in modeling improves this prediction.

Author Contributions

All authors contributed to the study conception and design. Material preparation, data collection and analysis were performed by K.C., M.A.A., M.B.R. and M.B. Formal analysis by M.A.A. and M.B.R. The first draft of the manuscript was written by K.C. and M.A.A. data curation by K.C., M.A.A., M.B. and M.B.R. and supervision, K.C. All authors commented on previous versions of the manuscript. All authors have read and agreed to the published version of the manuscript.

Funding

This work was supported and funded by the Deanship of Scientific Research at Imam Mohammad Ibn Saud Islamic University (IMSIU) (Grant No. IMSIU-RG23098).

Institutional Review Board Statement

Not applicable.

Informed Consent Statement

Not applicable.

Data Availability Statement

Not applicable.

Conflicts of Interest

The authors declare no conflict of interest.

References

  1. World Energy Council. World Energy Resources 2016. Available online: https://www.worldenergy.org/assets/images/imported/2016/10/World-Energy-Resources-Full-report (accessed on 3 October 2016).
  2. International Energy Agency. Available online: https://www.iea.org/publications/ (accessed on 12 August 2019).
  3. Tang, J.; Ni, H.; Peng, R.L.; Wang, N.; Zuo, L. A review on energy conversion using hybrid photovoltaic and thermoelectric systems. J. Power Sources 2023, 562, 232785. [Google Scholar] [CrossRef]
  4. Kuboth, S.; Heberle, F.; König-Haagen, A.; Brüggemann, D. Economic model predictive control of combined thermal and electric residential building energy systems. Appl. Energy 2019, 240, 372–385. [Google Scholar] [CrossRef]
  5. Shukhobodskiy, A.A.; Colantuono, G. RED WoLF: Combining a battery and thermal energy reservoirs as a hybrid storage system. Appl. Energy 2020, 274, 115209. [Google Scholar] [CrossRef]
  6. Baniasadi, A.; Habibi, D.; Al-Saedi, W.; Masoum, M.A.S.; Dasa, C.K.; Mousavia, N. Optimal sizing design and operation of electrical and thermal energy storage systems in smart buildings. J. Energy Storage 2020, 28, 101186. [Google Scholar] [CrossRef]
  7. Moreno-Munoz, A. Nanogrids, Microgrids, and the Internet of Things (IoT): Towards the Digital Energy Network. Energies 2019, 12, 3878. [Google Scholar] [CrossRef]
  8. Hwang, Y.; Radermacher, R.; Alili, A.A.; Kubo, I. Review of Solar Cooling Technologies. HVACR Res. 2008, 14, 507–528. [Google Scholar] [CrossRef]
  9. Jan, A.; Kuhn, A.; Petersan, S.; Zieglar, F. Development and Progress in Solar Cooling Technologies with Sorption System. Chem. Ing. Tech. 2011, 83, 1853–1863. [Google Scholar] [CrossRef]
  10. Ghafoor, A.; Munir, A. Worldwide Overview of Solar Thermal Cooling Technologies. Renew. Sustain. Energy Rev. 2015, 43, 763–774. [Google Scholar] [CrossRef]
  11. Elmaaref, M.M. Solar Thermoelectric Cooling Technology. In Proceedings of the 3rd International Conference on Energy Engineering, Aswan, Egypt, 28–30 December 2015; pp. 1–8. [Google Scholar]
  12. Alazazmeh, A.J.; Mokheimer, E.M. Review of Solar Cooling Technologies. J. Appl. Mech. Eng. 2015, 4, 1–15. [Google Scholar] [CrossRef]
  13. Usman, M.; Ali, Q.S.; Bilal, M. Assessment of Solar Cooling Technologies using the Analytical Hierarchical Process. World J. Eng. 2017, 14, 84–90. [Google Scholar] [CrossRef]
  14. Ghatol, S.; Rajput, T. Hybrid Solar Desiccant Cooling System. International. J. Eng. Sci. Res. Technol. 2017, 6, 569–575. [Google Scholar] [CrossRef]
  15. Ajib, S.; Alahmer, A. Solar Cooling Technologies. In Energy Conversion—Current Technologies and Future Trends; Al-Bahadly, I.H., Ed.; Intech Open: Rijeka, Croatia, 2018. [Google Scholar] [CrossRef]
  16. Rishi, K.; Balachandran, M.; Ragul, G.; Srinivasagopalan, A.; Ramkiran, B.; Neelamagem, P. Solar Cooling Technologies-A Review. In Proceedings of the International Conference on Computation of Power, Energy, Information and Communication (ICCPEIC), Chennai, India, 28–29 March 2018; pp. 174–178. [Google Scholar] [CrossRef]
  17. Naskar, R.; Ghosh, A.; Mandal, R. Design and New Development of Solar Air Conditioner. Int. J. Sci. Res. Multidiscip. Stud. 2018, 4, 19–23. [Google Scholar]
  18. Velasco-Gómez, E.; Tejero-González, A.; Jorge-Rico, J.; Rey-Martínez, F.J. Experimental Investigation of the Potential of a New Fabric-Based Evaporative Cooling Pad. Sustainability 2020, 12, 7070. [Google Scholar] [CrossRef]
  19. Rasuli, M.A.; Torii, S. Feasibility of solar air conditioning system for Afghanistan’s climate. Int. J. Innov. Res. Sci. Stud. 2021, 4, 120–125. [Google Scholar] [CrossRef]
  20. Albatayneh, A.; Jaradat, M.; Al-Omary, M.; Zaquot, M. Evaluation of Coupling PV and Air Conditioning vs. Solar Cooling Systems—Case Study from Jordan. Appl. Sci. 2021, 11, 511. [Google Scholar] [CrossRef]
  21. Lai, L.; Wang, X.; Kefayati, G.; Hu, E. Evaporative Cooling Integrated with Solid Desiccant Systems: A Review. Energies 2021, 14, 5982. [Google Scholar] [CrossRef]
  22. Kassem, A.S. Energy and water management in evaporitive cooling systems in Saudi Arabia. Resources. Conserv. Recycl. 1994, 12, 135–146. [Google Scholar] [CrossRef]
  23. Ghiabaklou, Z.; Ballinger, J.A. A passive evaporative system by natural ventilation. Build. Environ. 1996, 31, 503–507. [Google Scholar] [CrossRef]
  24. Ghiabaklou, Z. Thermal comfort prediction for a new passive cooling system. Build. Environ. 2003, 38, 883–891. [Google Scholar] [CrossRef]
  25. Ibrahim, E.; Shao, L.; Riffat, S.B. Performance of porous ceramic evaporators for building cooling application. Energy Build. 2003, 35, 941–949. [Google Scholar] [CrossRef]
  26. Cheikh, H.B.; Bouchair, A. Passive cooling by evapo-reflective roof for hot dry climates. Renew. Energy 2004, 29, 1877–1886. [Google Scholar] [CrossRef]
  27. Dağtekin, M.; Karaca, C.; Yildiz, Y.; Başçetinçelik, A.; Paydak, Ö. The effects of air velocity on the performance of pad evaporative cooling systems. Afr. J. Agron. 2020, 8, 1–10. [Google Scholar]
  28. Kenghe, R.; Fule, N.; Kenghe, K. Design, development and performance evaluation of an on-farm evaporative cooler. Int. J. Sci. Technol. Soc. 2015, 3, 1–5. [Google Scholar]
  29. El-Awad, M.M. Feasibility of a solar-assisted winter air-conditioning system using evaporative air-coolers. Int. J. Energy Environ. 2011, 2, 277–286. [Google Scholar]
  30. Hussain, S.; AlMogbel, A.; Rafique, Z.; Almashaal, M. Experimental investigations of evaporative cooling system for buildings under hot and dry environmental conditions. Heat Transf. Res. 2020, 51, 825–835. [Google Scholar] [CrossRef]
  31. Hussain, I.; Bibi, F.; Bhat, S.A.; Sajjad, U.; Sultan, M.; Ali, H.M.; Azam, M.W.; Kaushal, S.K.; Hussain, S.; Yan, W.-M. Evaluating the parameters affecting the direct and indirect evaporative cooling systems. Eng. Anal. Bound. Elem. 2022, 145, 211–223. [Google Scholar] [CrossRef]
  32. ASHRAE Handbook: Heating, Ventilating, and Air-Conditioning Systems and Equipment, I-P ed.; Refrigerating and AC Engineers American Society of Heating: Peachtree Corners, GA, USA, 1992.
  33. CRETINON, B. Measurement of Humid Air Parameters. In Engineering Techniques, Measurement and Control Treatise; CRETINON, B.: London, UK, 1995; pp. 45–63. [Google Scholar]
  34. Ayad, T.M.; Hassan, S.J. Performance evaluation of a developed evaporative air cooler with solar irradiance effect. Int. J. Eng. Technol. 2018, 7, 4785–4791. [Google Scholar]
  35. Camargo, J.R.; Ebinuma, C.D.; Silveira, J.L. Experimental performance of a direct evaporative cooler operating during summer in a Brazilian city. Int. J. Refrig. 2005, 28, 1124–1132. [Google Scholar] [CrossRef]
  36. Nada, S.A.; Elattar, H.F.; Mahmoud, M.A.; Fouda, A. Performance enhancement and heat and mass transfer characteristics of direct evaporative building free cooling using corrugated cellulose papers. Energy 2020, 211, 118678. [Google Scholar] [CrossRef]
  37. Kapilan, N.; Isloor, A.M.; Karinka, S. A comprehensive review on evaporative cooling systems. Results Eng. 2023, 18, 101059. [Google Scholar] [CrossRef]
Figure 1. Relative air humidity in Tunisian governorates.
Coatings 13 01901 g001
Figure 2. Description of the evaporative cooling process.
Coatings 13 01901 g002
Figure 3. Wetted-pad evaporative cooler.
Coatings 13 01901 g003
Figure 4. Calculation flowchart.
Coatings 13 01901 g004
Figure 6. Effect of dry bulb temperature on dry air, wet air, and added water enthalpies.
Coatings 13 01901 g006
Figure 13. Photo of the experimental air cooling installation.
Coatings 13 01901 g013
Figure 14. Photo and 3D representation of the porous media used in the humidifier. (a) Photo of the porous medium pad; (b) 3D representation of the porous medium pad.
Coatings 13 01901 g014
Figure 15. Effect of airflow on temperature and humidity differences at the humidifier outlet.
Coatings 13 01901 g015
Figure 16. Relative humidity difference with and without porous media through the humidifier.
Coatings 13 01901 g016
Figure 17. Temperature difference with and without porous media through the humidifier.
Coatings 13 01901 g017
Figure 18. Humidification experiments for different temperatures and humidities of the air represented on the air psychometric diagram: condition at the inlet of the humidifier is shown by the red domain and at the outlet by the green domain.
Coatings 13 01901 g018
Disclaimer/Publisher’s Note: The statements, opinions and data contained in all publications are solely those of the individual author(s) and contributor(s) and not of MDPI and/or the editor(s). MDPI and/or the editor(s) disclaim responsibility for any injury to people or property resulting from any ideas, methods, instructions or products referred to in the content.

