Article

Preparation of Modified Biochar and Its Adsorption of Cr(VI) in Aqueous Solution

1
School of Food Engineering, Harbin University of Commerce, Harbin 150028, China
2
School of Light Industry, Harbin University of Commerce, Harbin 150028, China
*
Authors to whom correspondence should be addressed.
Coatings 2023, 13(11), 1884; https://doi.org/10.3390/coatings13111884
Submission received: 11 September 2023 / Revised: 31 October 2023 / Accepted: 31 October 2023 / Published: 2 November 2023

Abstract

:
In recent years, wastewater containing heavy metal chromium has been discharged into water bodies. Metal chromium not only destroys the water environment but also poses a threat to human life and health. In order to solve the problem of chromium pollution more effectively, this study used corn straw as raw material to prepare biochar (MB) and used three methods: acid (HCl), alkali (NaOH) and metal salt (FeCl3) to modify biochar (HMB, NaMB and FeMB) and investigated the strengthening effect of modified biochar on Cr(VI) adsorption. The morphology and surface chemical composition of biochar were studied by XRD, SEM, XPS, FITR and other characterization methods. It was found that the modification of HCl, NaOH and FeCl3 improved the physical and chemical properties of MB (such as crystal structure, specific surface area, pore size and surface composite film), thus promoting the adsorption of Cr(VI). At the same time, an adsorption single-factor experiment, adsorption kinetics experiment, isothermal adsorption experiment and cyclic regeneration experiment were carried out on the four adsorbents. The effects of biochar on Cr(VI) adsorption performance under different pH, Cr(VI) initial concentration, biochar dosage and time were compared, and the adsorption mechanism of four adsorbents on Cr(VI) in aqueous solution was studied. It was found that the FeCl3-modified biochar provided more adsorption sites for chromium ions due to the successful loading of Fe, Fe3+ and iron oxide particles onto the MB surface to form a composite film, and the Fe-O groups introduced by the composite film formed a coordinated adsorption with dichromate ions. At 25 °C and pH = 2, FeMB reached saturation at 1440 min, the maximum adsorption capacity was 23.4 mg/g and its removal rate of Cr(VI) remained above 45% after five cycles. The adsorption of Cr(VI) was significantly enhanced.

1. Introduction

With the development of industry and the rapid consumption of natural resources, Cr(VI) emissions from mining, metallurgy and manufacturing have increased significantly in the past few decades, seriously affecting the environment [1,2]. Heavy metal chromium ions bind to important cellular components in organisms, thereby affecting their functions. Heavy metal ions are not biodegradable [3], so it is challenging to clean up the polluted water. In the past few decades, several technologies, including ion exchange, membrane filtration, chemical precipitation and electrodeposition, have been tentatively applied to the removal of heavy metals. Some of these methods have been widely used in industry, but these treatments have significant disadvantages. For example, the thermal stability of ion exchange resin is poor, and the regeneration process is complex [4]; membrane filtration can effectively treat toxic heavy metal ions, but the maintenance cost is extremely high [5]; a large amount of sludge produced by the chemical precipitation method has secondary pollution [6] and electrodeposition will consume a lot of power [7]. Compared to the above methods, the adsorption method has a higher heavy metal removal capacity and good recycling ability [8]. Therefore, this method is a green and environmentally friendly ideal candidate for treating Cr(VI) in wastewater.
Biochar, diatomite, bentonite, silica gel, cellulose and graphene oxide can be used for the determination of heavy metals, and the relevant characteristics are shown in Table 1. Biochar has a relatively carbon-based structure, high porosity and large specific surface area. As a surface adsorbent, it is similar to activated carbon in some respects. As an environmentally friendly material, biochar is widely used in water environment treatment. It is considered to be one of the important adsorbents for removing heavy metal ions and removing organic pollutants [9,10].
Pyrolysis and hydrothermal carbonization are common methods for preparing biochar. We prepared native biochar by tube furnace pyrolysis. Pyrolysis is the preparation of biomass under anoxic conditions or inert gas heating and holding for a period of time. Pyrolysis parameters (such as heating rate, pyrolysis temperature and pyrolysis time) and raw materials will affect the yield and properties of biochar [11]. The hydrothermal method is to use water as the reaction medium, place the biomass in a sealed reactor, stay at a certain temperature (130~350 °C) for more than 1 h and accelerate the coalification reaction by dehydration and decarboxylation to prepare biochar [12]. The biochar prepared by pyrolysis has a strong surface adsorption capacity, which is suitable for most organic matter, with high conversion efficiency and environmental protection. The hydrothermal carbonization method is helpful in the treatment of raw materials with a high water content, as well as the retention of oxygen-containing and nitrogen-containing functional groups on the surface of biochar [13,14] However, the surface area, porosity and aromatic structure of biochar prepared by the hydrothermal method are limited, which has certain limitations in its application and development [15].
Some researchers have performed in-depth research on the removal of heavy metals by biochar and found that the adsorption capacity of traditional original biochar is poor. Therefore, it is necessary to regulate and modify biochar to strengthen its functional role and expand its use field. Biochar with special functions is often prepared by physical, chemical and biological methods [16].
The main purpose of acid modification is to remove impurities such as metals and increase oxygen-containing functional groups. After acid modification, the pore size of biochar will be changed, and the type and concentration of acid will affect the microstructure and specific surface area of biochar [17]. The main purpose of alkali modification is to increase the specific surface area and oxygen-containing functional groups of biochar. In the alkali treatment process, raw materials and preparation conditions have a certain influence on the modified biochar [18]. Metal salt and metal oxide-modified biochar have developed rapidly in recent years. This method directly changes the properties of biochar, so as to achieve the purpose of improving its performance (including adsorption, catalytic ability and magnetism). The modification of metal salts or metal oxides can be accomplished by the following two methods:
(1)
Metal salts or metal oxides are mixed with raw materials and co-pyrolyzed to synthesize modified biochar;
(2)
Biochar is prepared by the pyrolysis of raw materials, and biochar is soaked in metal salt or metal oxide solution under certain conditions.
In this paper, acid, alkali and metal salts were used to modify biochar, and the microstructures of three kinds of biochar were characterized and analyzed. The adsorption capacity of three kinds of materials for Cr(VI) was compared.

2. Materials and Methods

2.1. Preparation of Corn Stover Biochar

2.1.1. Preparation of Biochar Materials

Corn straw biomass was collected from the experimental field (from Harbin University of Commerce), cut into segments, crushed and cleaned with tap water to remove dust. The solid powder was dried in a porcelain boat at 80 °C until constant weight and placed in an atmosphere furnace. After the oxygen was driven off by nitrogen for 20 min, the pyrolysis was continued under nitrogen atmosphere at a pyrolysis rate of 15 °C-min−1. Five pyrolysis temperatures were set at 400 °C, 500 °C, 600 °C, 700 °C and 800 °C for 20 min. After carbonization, it was taken out and cooled to room temperature in a dry dish, ground through a 100 mesh sieve and stored for later use. The biochar sample was labeled as MB.

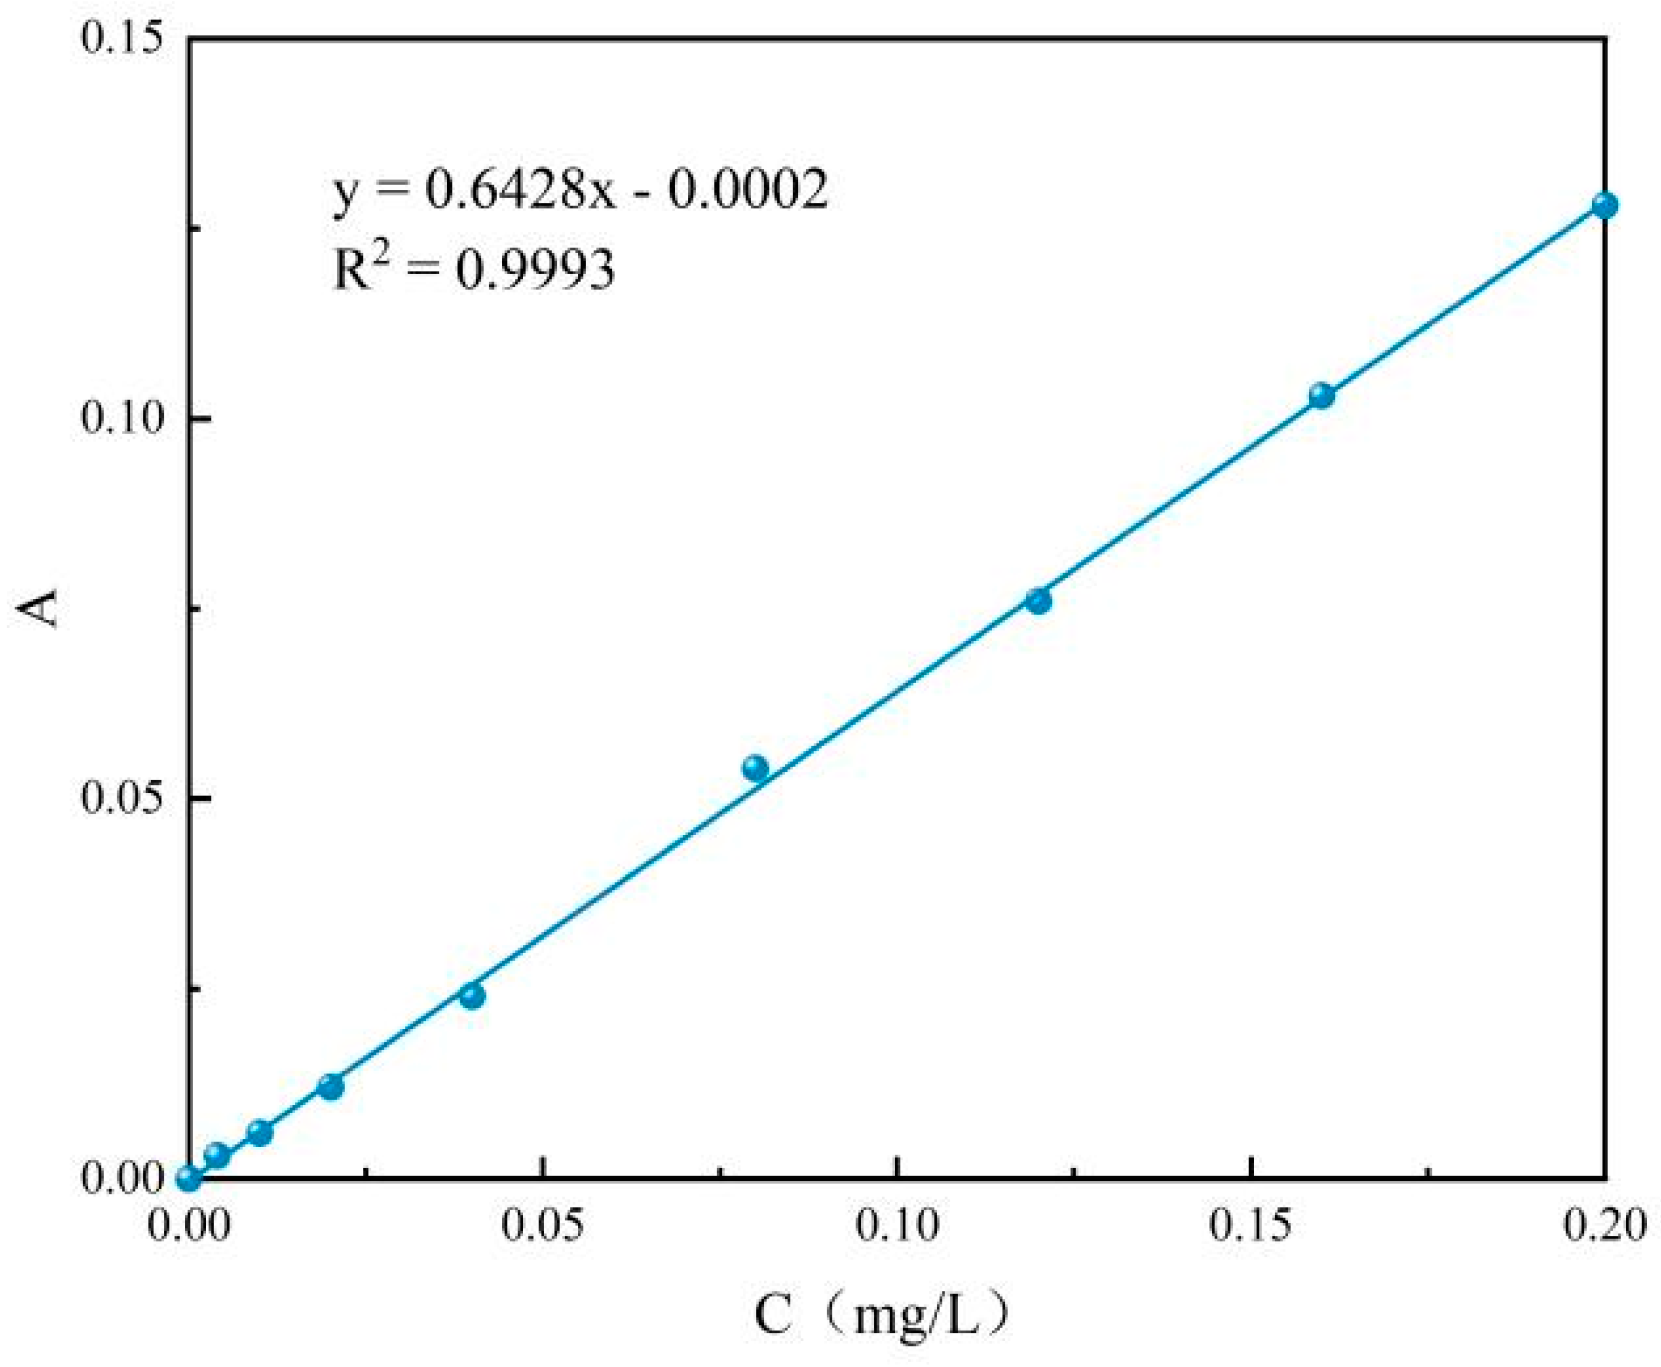
2.1.2. Determination of Cr(VI) Content in Solution by Native Biochar

Preparation of reagents: A small amount (0.2829 ± 0.001 g) of potassium dichromate (K2Cr2O7, excellent grade pure) dried at 110 °C for 2 h was weighed, dissolved in water, transferred into a 1000 mL volumetric flask, diluted with water to the standard line and shaken well. This solution was the 100 mg/L chromium standard stock solution. The 5 mL chromium standard stock solution was placed in a 500 mL volumetric flask, diluted with water to the line and shaken well. This solution was the 1 mg/L chromium standard solution. Prepare this solution on the day of use. Then, 2 g of C13H14N4O was dissolved in 50 mL of acetone, diluted with water to 100 mL and shaken well before storing in brown bottles and placing them in the refrigerator. After the color darkened, it could not be used.
Determination of Cr(VI) solution: A small amount (50 mL) of H2O was added to the colorimetric tube, 0.5 mL H3PO4 and 0.5 mL H2SO4 were added and 2 mL chromogenic agent was added after shaking evenly. Shake well and wait for 5~10 min. The absorbance was measured at 540 nm as a blank test. An appropriate amount of the sample to be tested (Cr(VI) concentration < 50 μg) was diluted with water to 50 mL, and the absorbance was measured according to the above method. After subtracting the absorbance value obtained by the blank test, the Cr(VI) concentration was obtained by comparing the standard curve.
Standard curve drawing: Under acidic conditions, Cr(VI) reacts with diphenyl carbazide to form a purple-red compound, and the solution color (measured by absorbance) is linearly related to the concentration of Cr(VI). Therefore, 0 mL, 0.2 mL, 0.5 mL, 1 mL, 2 mL, 4 mL, 6 mL, 8 mL and 10 mL Cr(VI) standard solution were added to a series of 50 mL colorimetric tubes and diluted with water to the standard line. The absorbance value was determined according to the above method. The concentration–absorbance curve was drawn, and the standard curve is shown in Figure 1.

2.1.3. Determination of Adsorption Content of Cr(VI) in Solution by Native Biochar at Different Temperatures

A small amount (0.1 g) of biochar was weighed and placed in a 100 mL conical flask, and a 50 mL, 50 mg-L−1, pH = 2 Cr(VI) solution was added. After sealing, it was immediately placed in a water bath oscillator for adsorption. The adsorption conditions were 25 ℃, 140 r-min−1, and the samples were taken after 24 h. The samples were filtered through a 0.22 μm membrane. The residual concentration of Cr(VI) was determined according to the standard curve. The adsorption performance of the biochar was measured by the removal rate and adsorption capacity.
The adsorption amount (the subsequent graph is represented by Qe) and removal rate of Cr(VI) by biochar were calculated based on the difference in mass concentration of Cr(VI) in the solution before and after adsorption.

2.2. Modification of Biochar and Analysis of Modified Biochar

2.2.1. Preparation of Modified Biochar

In this study, three different methods, HCL, NaOH and FeCl3, were selected to modify the biochar, and the adsorption properties of the biochar before and after modification were studied and analyzed in terms of microscopic mechanisms; the concentration of acid, alkali and salt used in the modification was the optimal concentration obtained by the modified single-factor experiment in the preliminary experiment, as shown in Figure 2.
Acid-modified biochar: A certain amount of MB was weighed and placed in a 100 mL beaker, impregnated in 2 mol/L HCL solution at a solid–liquid ratio of 1:50 (g/mL) for 24 h, washed repeatedly with deionized water to neutral and dried at 80 °C to obtain HCL-modified corn stalk biochar, which was labeled as HMB, sealed and stored for later use.
Alkali-modified biochar: A certain amount of MB was weighed, placed in a 100 mL beaker, impregnated in 6 mol/L NaOH solution at a solid–liquid ratio of 1:50 (g/mL), impregnated for 24 h, rinsed repeatedly with dilute hydrochloric acid and deionized water to neutral and dried at 80 °C to obtain NaOH-modified corn straw biochar, which was labeled as NaMB, sealed and stored for later use.
Metal salt-modified biochar: A certain amount of corn stalk biomass was weighed and placed in a 100 mL beaker, impregnated in 8 mol/L FeCl3 solution at a solid–liquid ratio of 1:10 (g/mL), magnetically stirred for 30 min and then continued in a water bath for 30 min. Then, the treated biomass was separated from the solution and dried, pyrolyzed in N2 atmosphere, cooled to room temperature, rinsed with deionized water repeatedly until Cl was washed and dried at 80 °C to obtain FeCl3-modified corn straw biochar, which was labeled as FeMB, sealed and stored for later use.

2.2.2. Material Characterization Method and Principle

XRD determination: In this experiment, the phase structure of the material was analyzed and studied using a D8 ADVANCE X-ray diffractometer. The test range was 2θ = 10–90°.
BET and pore size analysis: Different biochars have different pore structures. Nitrogen adsorption–desorption was used to analyze the specific surface area, total pore volume and average pore size of the samples, and the types of adsorption–desorption curves were analyzed.
SEM determination: In this experiment, the morphology of the sample was observed using a Supra55 scanning electron microscope from the German Zeiss Company (Oberhausen, Germany), EHT = 15 KV. Before the test, the sample was fully dried and sprayed with gold.
XPS determination: In this experiment, the elemental composition and valence state information of the samples were characterized using an ESCALAB 250 X-ray photoelectron spectrometer (Thermo Fisher Scientific Company, Waltham, MA, USA).
FTIR determination: The structure of the sample was characterized using a VERTEX 80 infrared Raman spectrometer (Bruker, Germany). The spectral range was 4000–400 cm−1, and the resolution was 0.07 cm−1.

2.2.3. Adsorption Experiments

Adsorption single-factor experiment: (1) A small amount (0.1 g) of biochar was added to a 50 mL Cr(VI) solution with initial concentration of 10, 20, 25, 30, 40, 50, 75 and 100 mg/L, and the pH value of the Cr(VI) solution was adjusted to 2. The solution was shaken in a constant temperature water bath oscillator at 25 °C and 140 r/min for 24 h. After filtration with a 0.22 μm filter membrane, the supernatant was taken to measure the concentration of Cr(VI) in each sample, and the removal rate and removal amount were calculated. (2) The effect of the biochar dosage on Cr(VI) removal was evaluated at different dosages of 1~5 g/L. The reaction conditions for Cr(VI) were 50 mL 50 mg/L Cr(VI) solution, pH 2, temperature 25 °C. (3) A small amount (0.1 g) of biochar was added to a 50 mL 50 mg/L Cr(VI) solution, the pH value of the Cr(VI) solution was adjusted to 1~10 and the temperature was 25 °C.
Adsorption kinetics experiment: A small amount (0.1 g) of adsorbent was added to a 50 mL 50 mg/L Cr(VI) solution; placed in a constant temperature water bath at 25 °C and 140 r/min and oscillated for 0 min, 10 min, 30 min, 60 min, 90 min, 120 min, 180 min, 360 min, 540 min, 720 min and 1440 min. The absorbance of the residual Cr(VI) in the solution was measured, and the removal rate and adsorption capacity were calculated.
Isothermal adsorption experiment: A series of Cr(VI) solutions with a pH of 2 were prepared with concentrations of 10 mg/L, 20 mg/L, 25 mg/L, 30 mg/L, 35 mg/L, 40 mg/L, 50 mg/L, 75 mg/L and 100 mg/L. After adding 0.1 g of adsorbent, the solution was shaken in a constant temperature water bath oscillator at 25 °C and 140 r/min for 24 h. After filtration with a 0.22 μm filter membrane, the removal rate and adsorption capacity were calculated.
Adsorption cycle regeneration experiment: A small amount (0.1 g) of adsorbent was added to a 50 mL, 50 mg/L, pH 2 Cr(VI) solution and shaken in a constant temperature water bath oscillator at 25 °C and 140 r/min for 24 h. After saturated adsorption, the adsorbent was placed in a 50 mL eluent (0.1 mol/L NaOH) under the same water bath oscillation conditions as the adsorption to fully release Cr(VI). Then, the regenerated adsorbent was used to remove Cr(VI), and the adsorption efficiency was determined.

3. Results and Discussion

3.1. Determination of Pyrolysis Temperature for the Preparation of Native Biomass Carbon

The results are shown in Figure 3. When the pyrolysis temperature is 400 °C, the removal rate of Cr(VI) by biochar reaches 52.2%, which proves that the biochar at this time has a good aromatic structure. With the increase in pyrolysis temperature, the pore volume, pore size and surface area increased, and the adsorption of Cr(VI) increased gradually and reached its peak at 500 °C. The removal rate of Cr(VI) was 61.9%, and the adsorption capacity (Qe in the following figure) reached 14.4 mg/g. However, when the pyrolysis temperature is higher than 500 °C, the high temperature causes the product to release a large amount of organic volatiles to replace the organic structure, resulting in the destruction of the porous structure and the weakening of the adsorption performance.
Considering the production cost of biochar and the adsorption performance of Cr(VI), MB prepared at 500 °C pyrolysis temperature was selected as the material for subsequent experiments in the next study.

3.2. Material Characterization Method and Principle

3.2.1. XRD Measurement

In this study, the effects of acid, alkali and metal salt modification on the structure and phase composition of biochar were analyzed by the X-ray diffraction (XRD) analysis of biochar before and after modification. As shown in Figure 4, 2θ = 16°–22° has a wide diffraction peak, indicating that MB, NaMB and FeMB are amorphous structures. The wide diffraction peaks here are cellulose and hemicellulose. The crystallinity of cellulose I (CI) was calculated using the Segal empirical method. After observation and calculation, it was found that the characteristic peak of the modified biochar was wider than that of MB, and the crystallinity decreased from 62% to 2%~10%, indicating that the crystalline structure of cellulose was destroyed and the volatile components were released during the modification process [19,20].
As shown in Figure 4, HMB, NaMB and MB are similar, but FeMB is quite different from the above three. The XRD pattern of FeMB has diffraction peaks at 2θ = 33.15°, 35.61°, 49.48°, 54.09° and 62.45°. Compared to the standard card, it corresponds to the (104), (110), (024), (116) and (214) crystal planes of the standard card PDF# 33-0664, respectively. It is proven that iron oxide ɑ-Fe2O3 exists on FeMB, indicating that FeCl3-modified biochar successfully loads Fe on the surface of biochar to form a composite film, and FeMB forms a stable crystal structure.

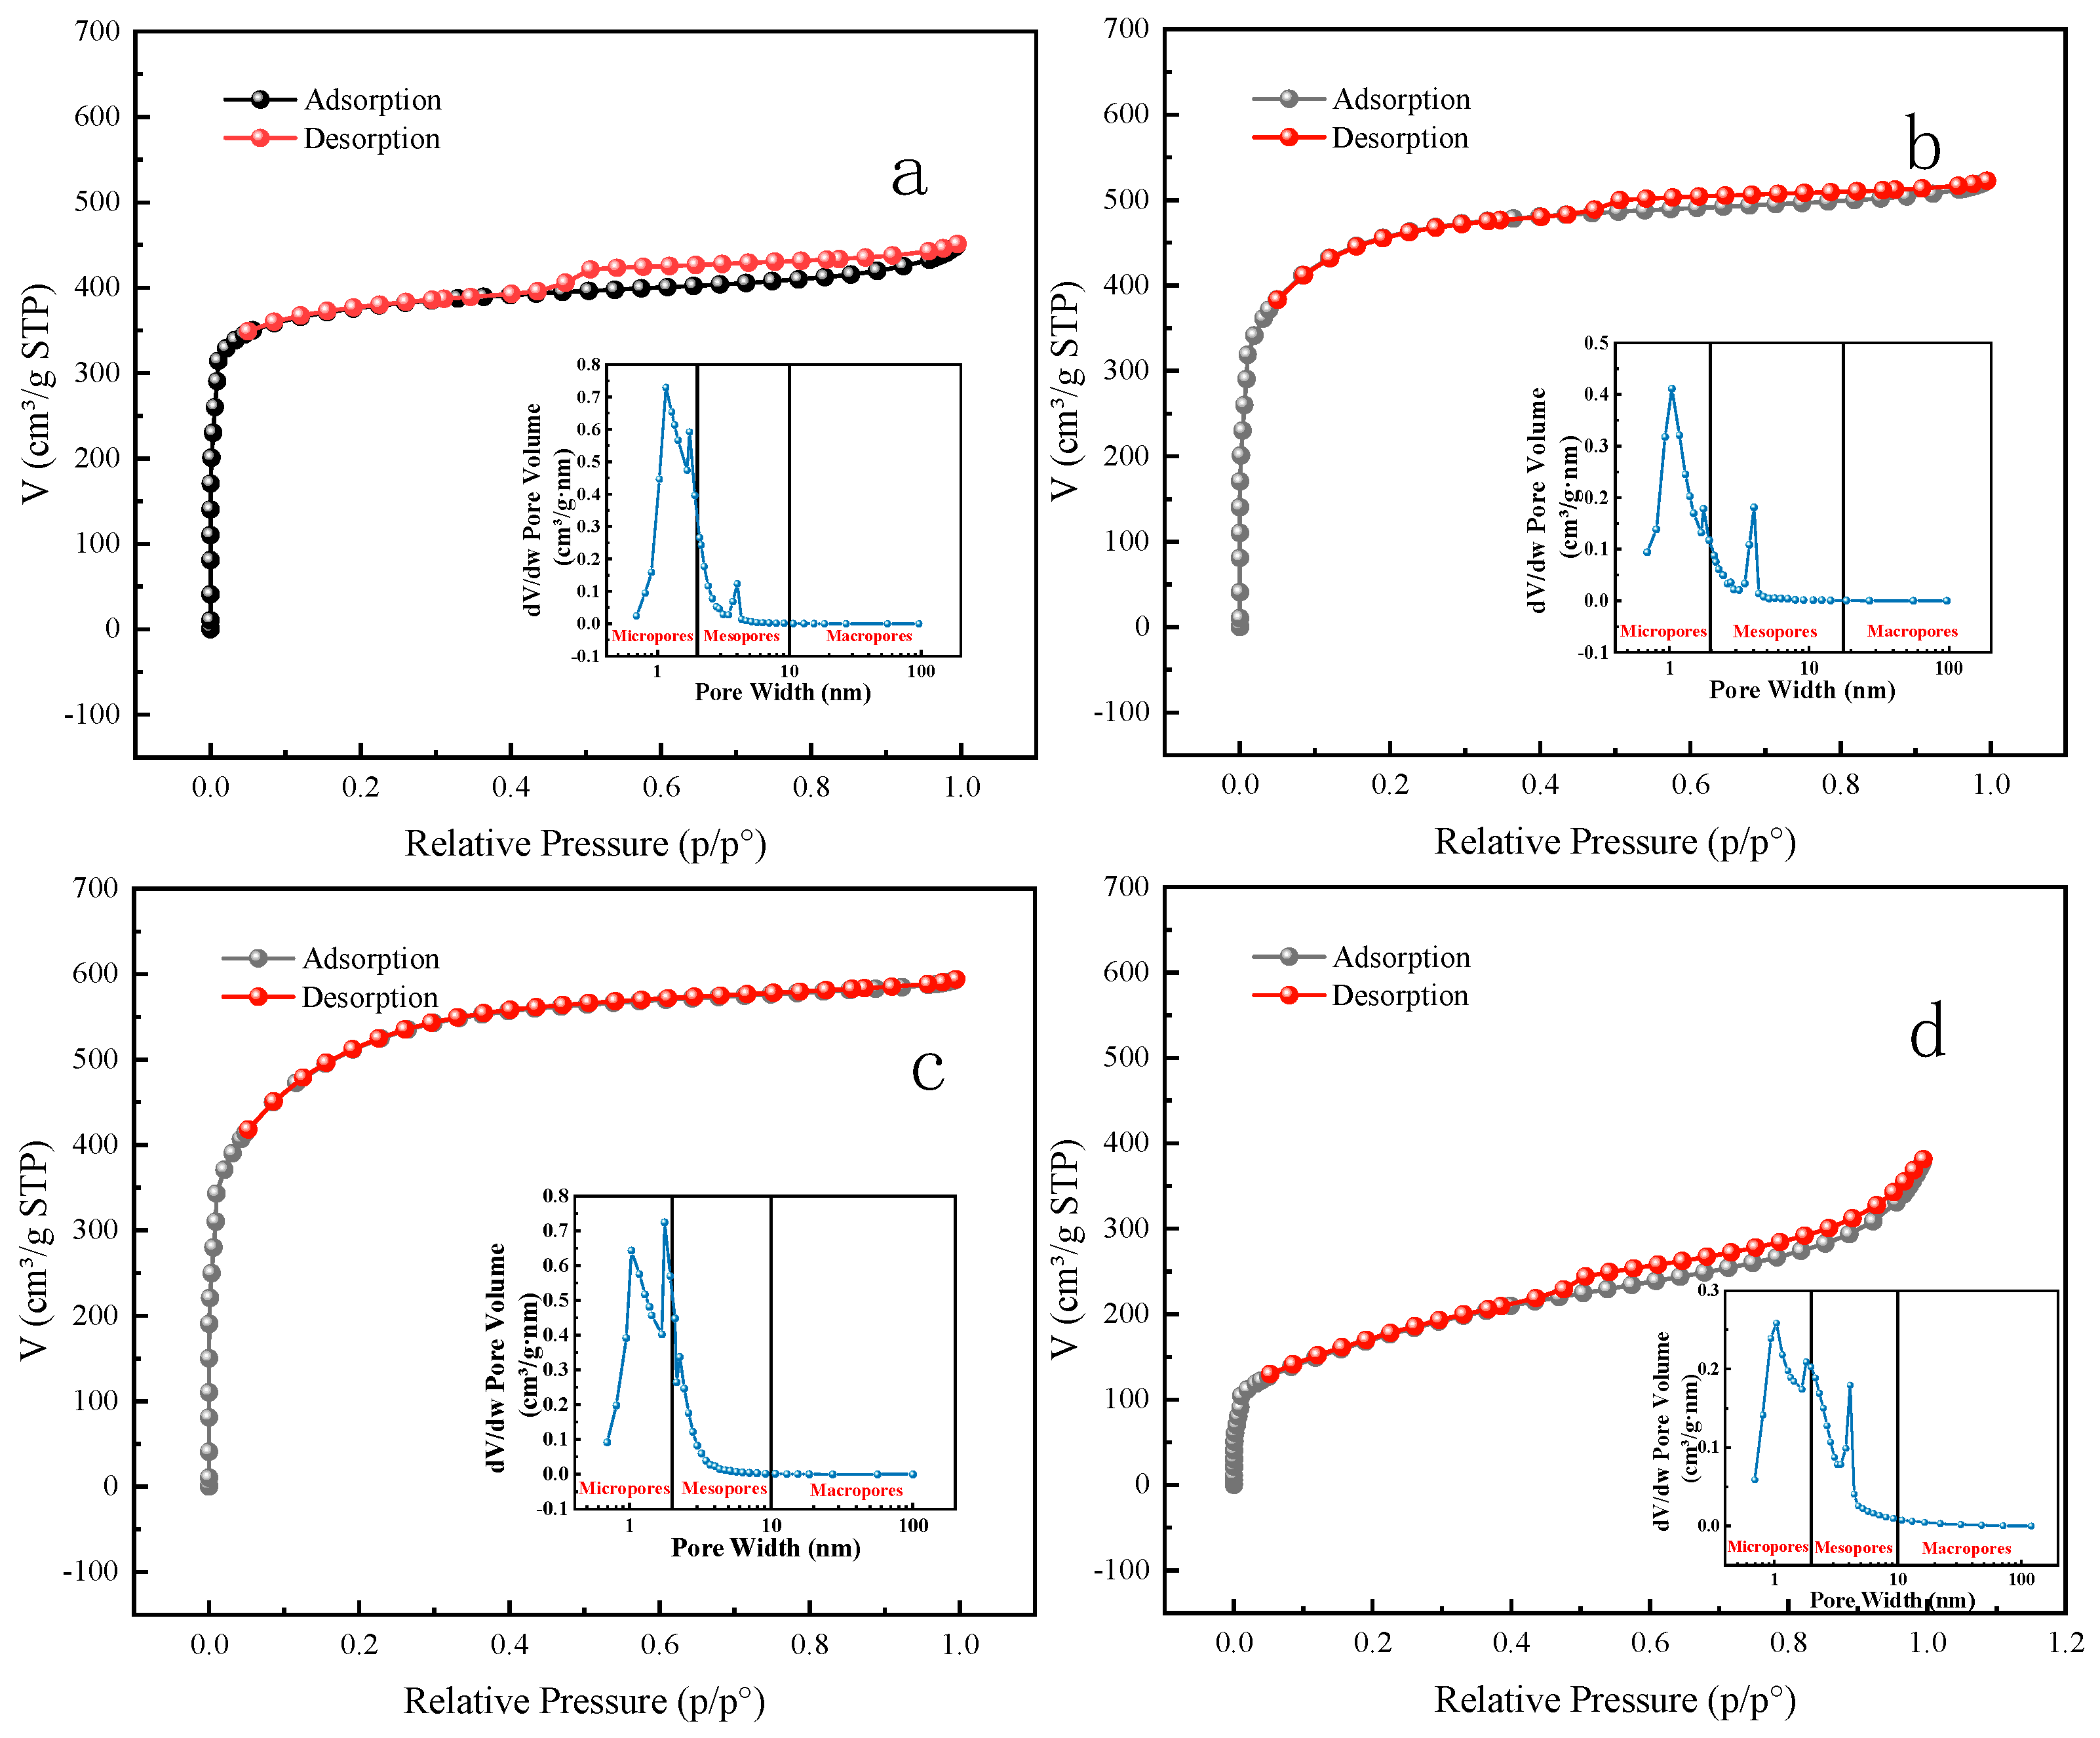
3.2.2. BET and Pore Size Analysis
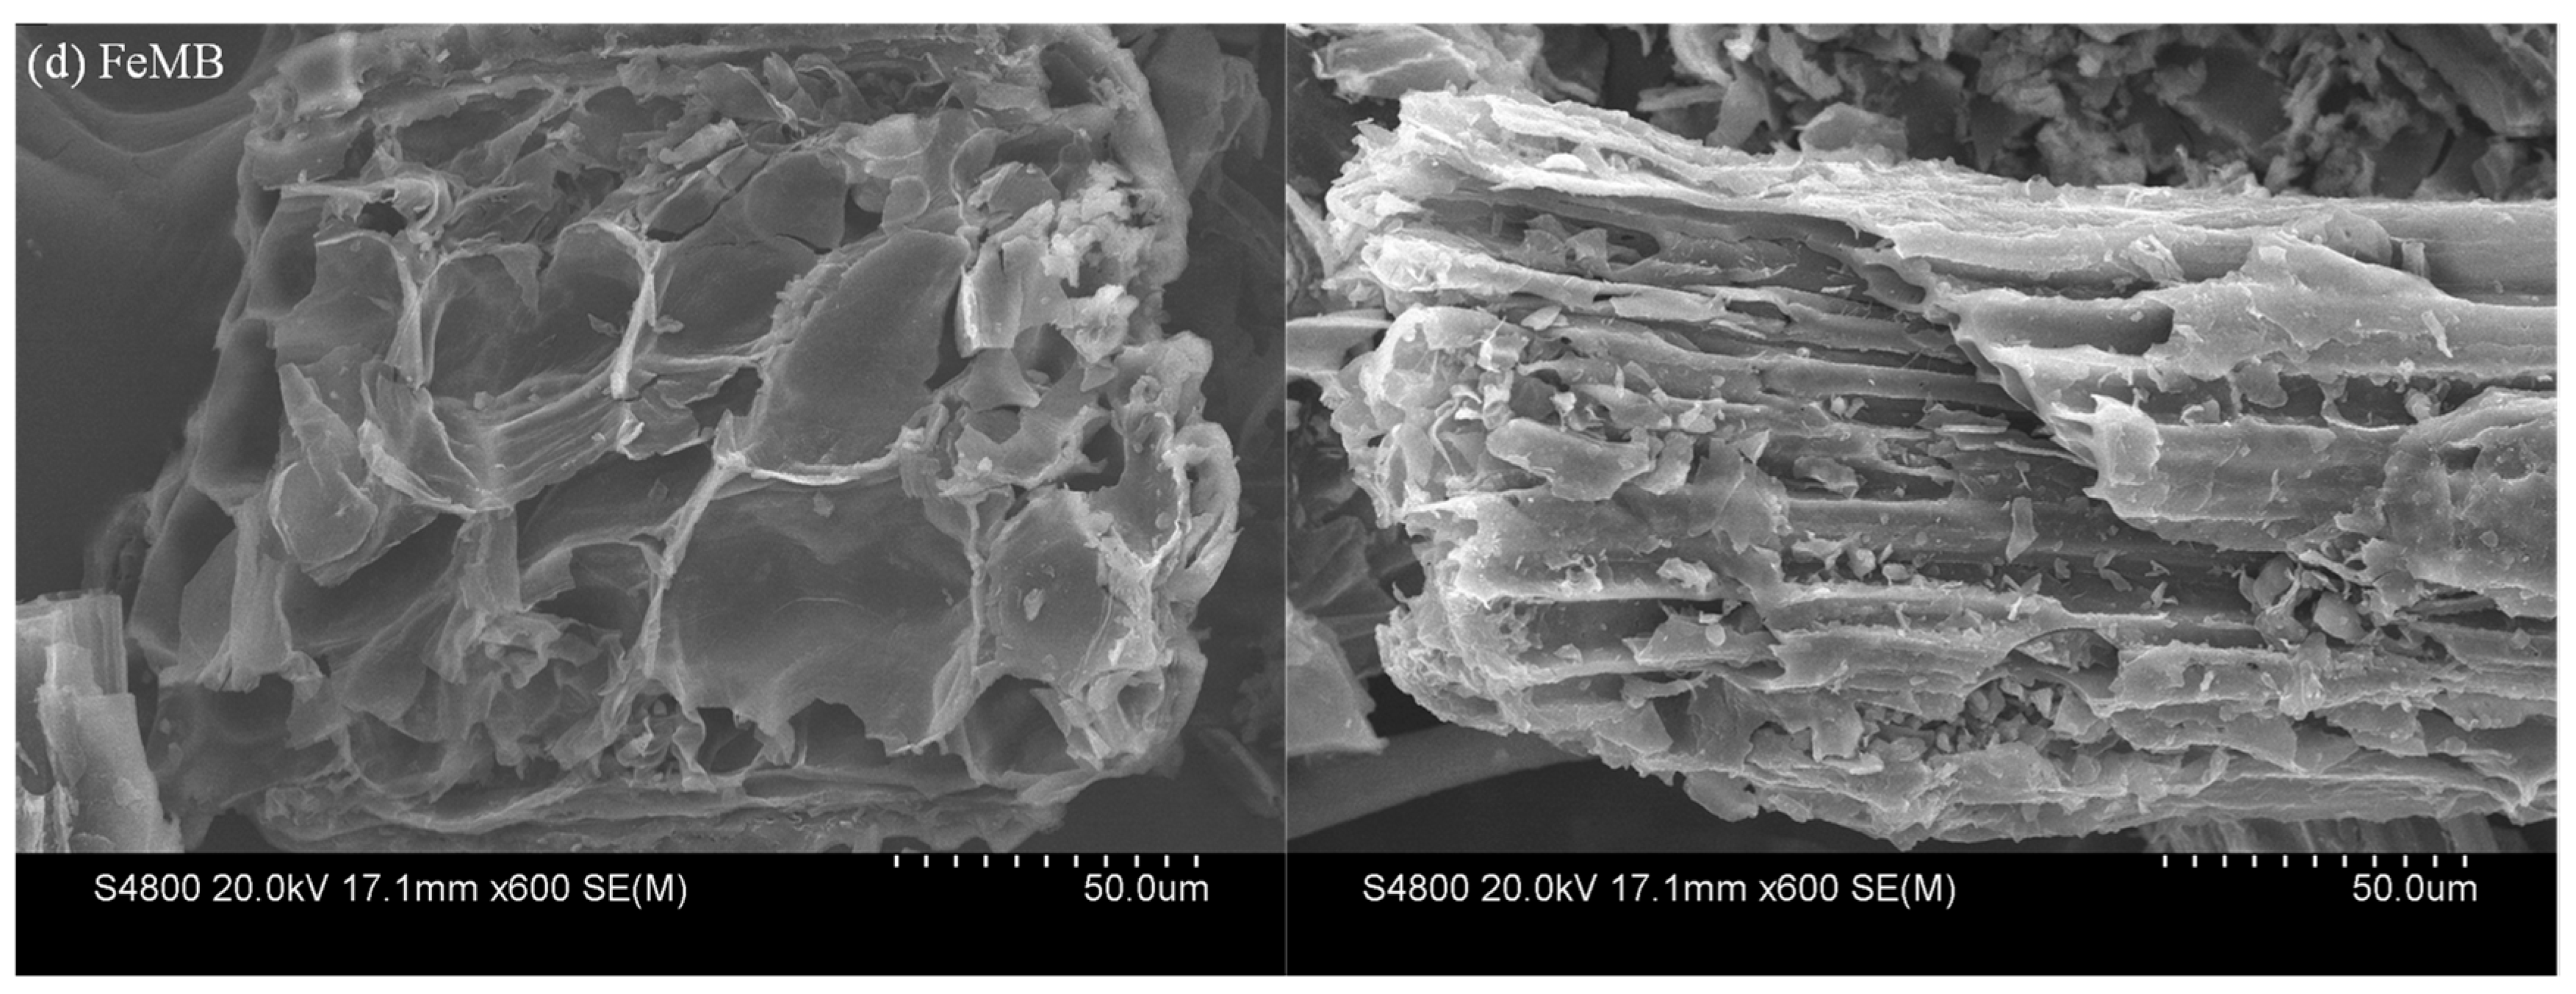
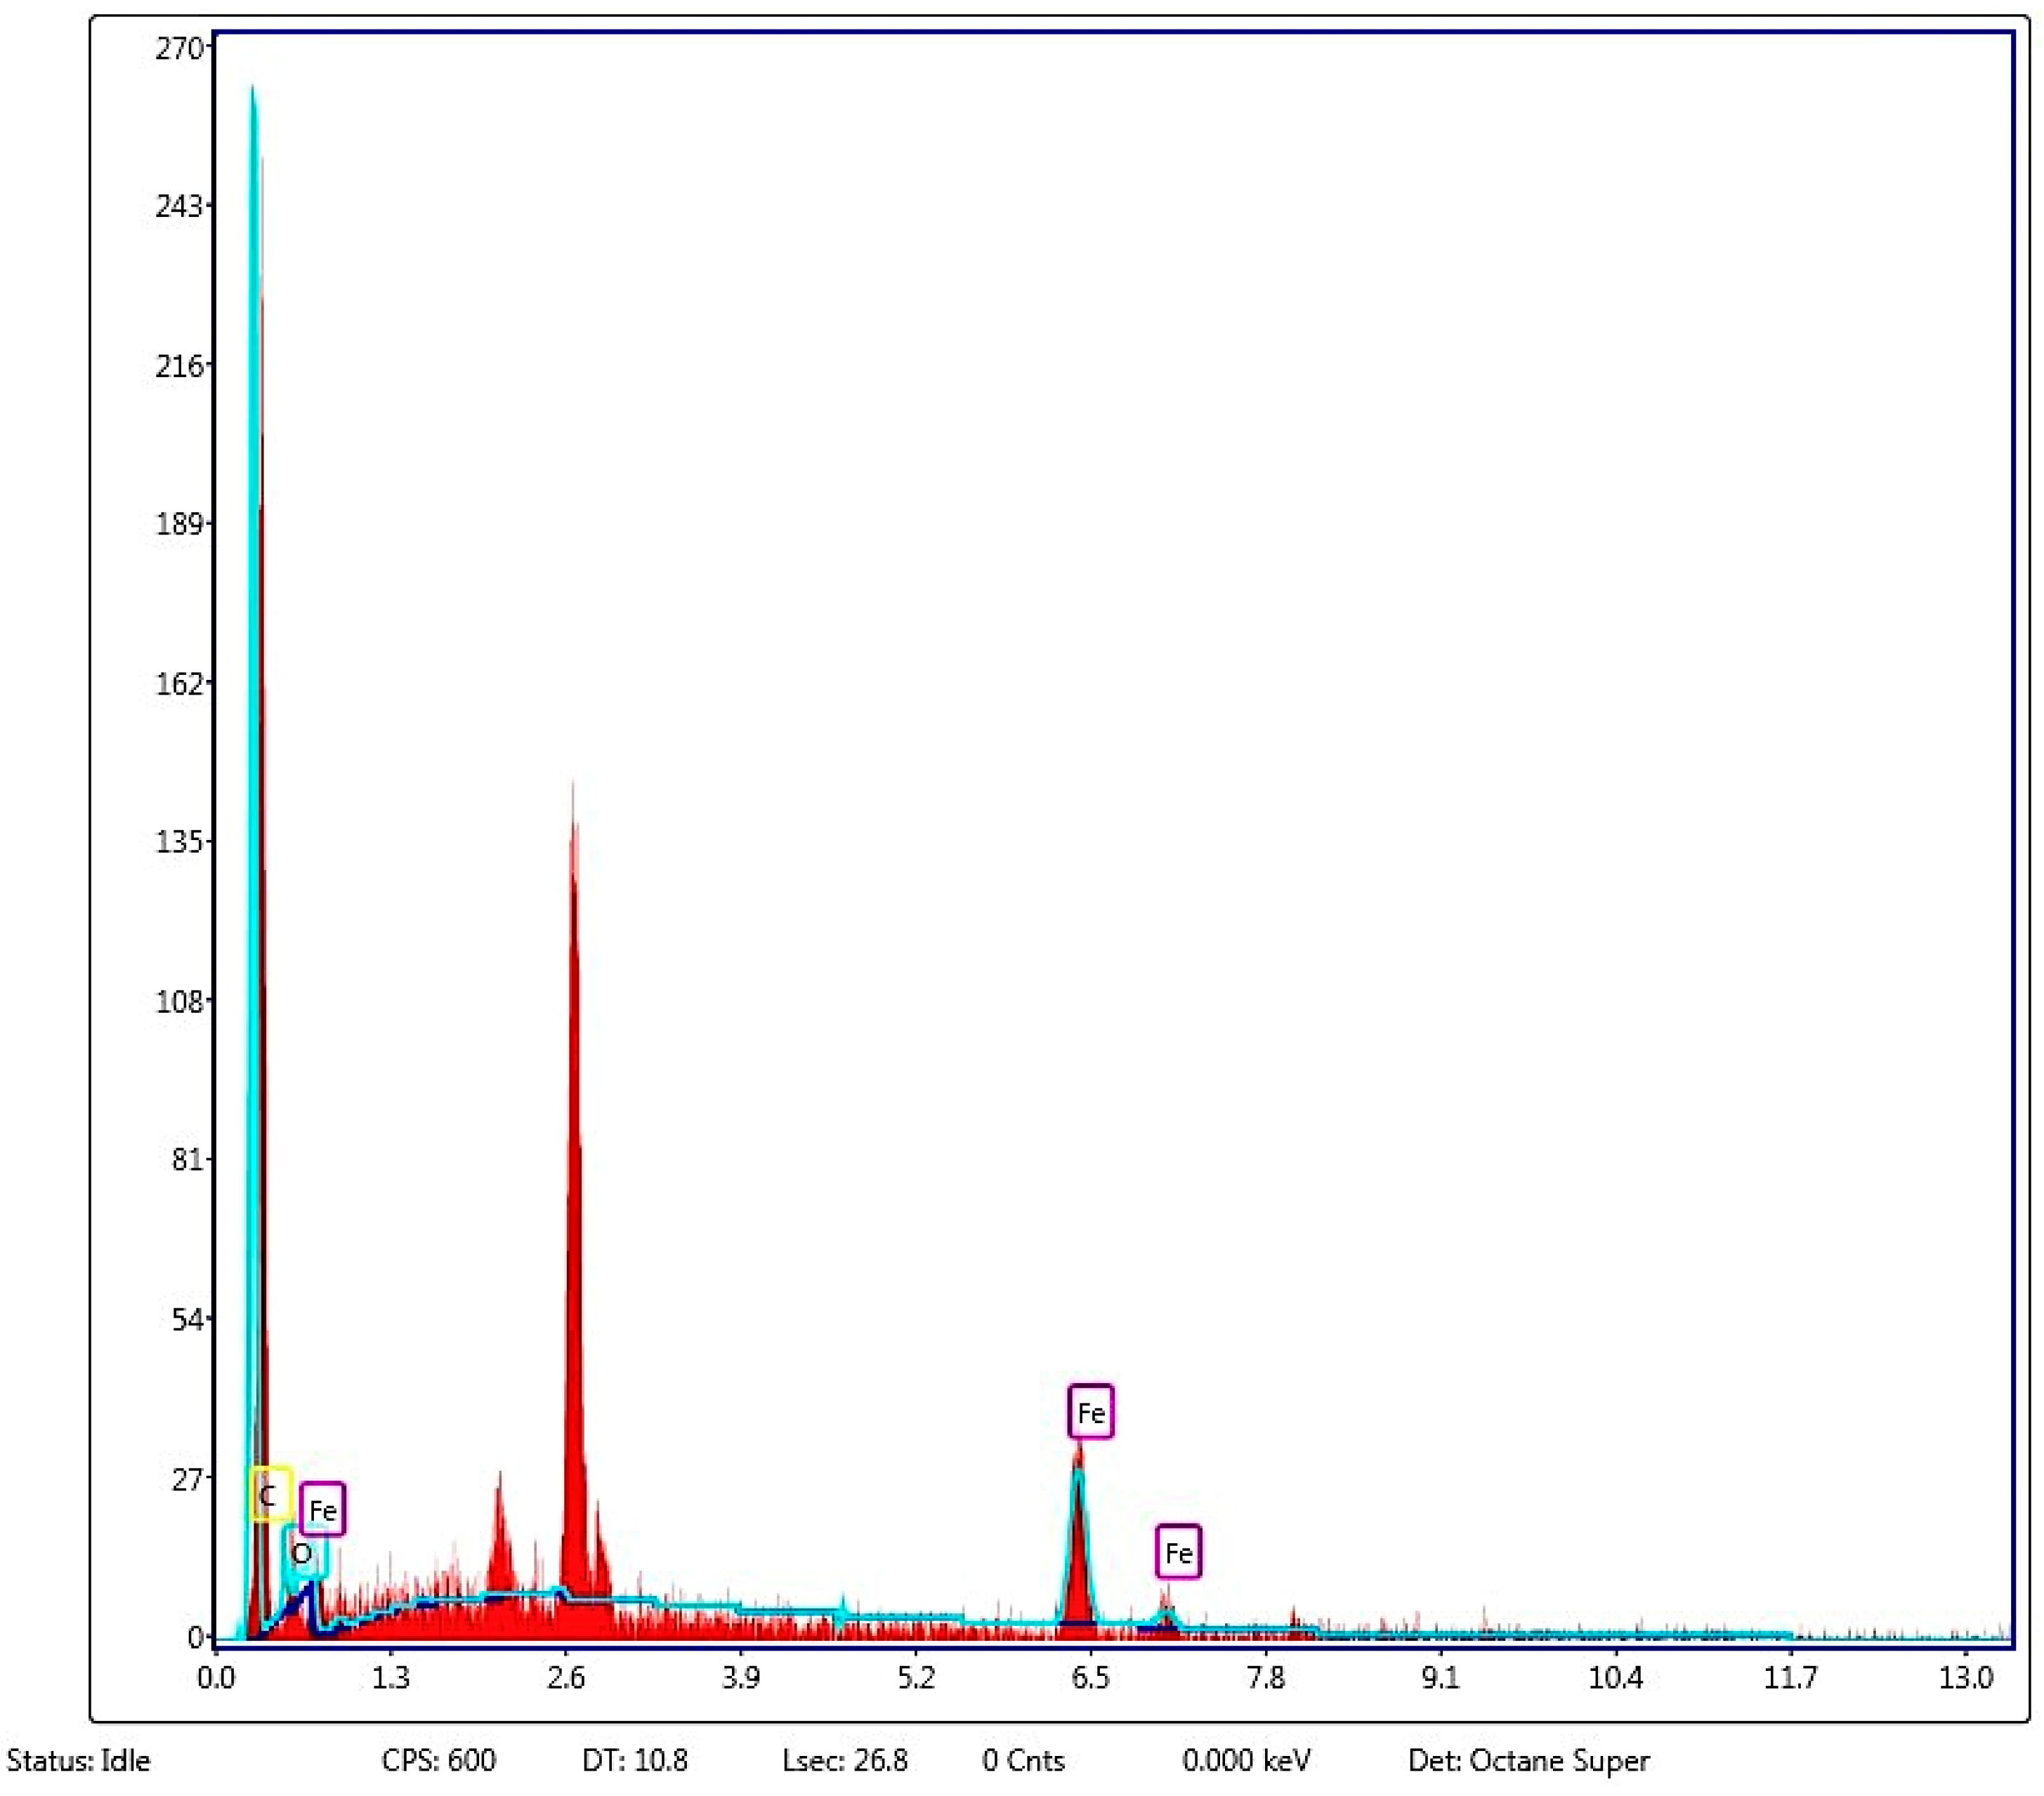
Studies have shown that the adsorption performance of biochar is affected by pore size, number, pore volume and specific surface area. As shown in Figure 5a–d, the N2 adsorption–desorption isotherms of biochars prepared under different conditions were basically consistent with the type IV isotherm defined by the International Union of Pure and Applied Chemistry (IUPAC). In the range of low relative pressure (<0.1), the adsorption curve is consistent with the desorption curve, and the adsorption capacity increases rapidly with the increase in relative pressure. This is because the developed micropore structure of biochar has a strong micropore-filling adsorption effect on N2 [21]. With the increase in relative pressure, the isotherm rises steadily in the middle- and high-pressure areas (>0.1), and the adsorption curve and the desorption curve begin to become inconsistent, which mainly manifests in the convex desorption curve, resulting in a closed-loop interval and forming a hysteresis loop. Among them, according to the graph, it is found that the adsorption–desorption amount (V) of FeMBN2 is significantly smaller than that of other biochars, indicating that native biochar can retain a large amount of iron nanoparticles in its pores [22].
The generation of hysteresis loops is closely related to the size of biochar pores [23]. Among them, the adsorption and desorption hysteresis loops of MB, HMB and NaMB belong to the H4 type, which indicates that MB, HMB and NaMB are composed of slit-like pores stacked in sheets structure [24]. The adsorption branch of FeMB is similar to a type II isotherm, so its adsorption and desorption hysteresis loop belongs to the H3 type, which indicates that the pore structure of FeMB is dominated by slit pore adsorption caused by a lamellar polymer, and mesoporous is in the majority, which is consistent with the results of SEM characterization.
The non-local density functional theory (NLDFT) was used to calculate the pore size and distribution of biochar. As shown in the illustrations from Figure 5a–d, the pore distribution of different biochars is generally concentrated in the region within 4 nm, with peaks near 1 nm and 4 nm, and the peak at 1 nm is higher, indicating that the number of pores at this pore size accounts for a larger proportion and the pore size is more uniform. A pore size less than 2 nm is a micropore, a pore size in the range of 2 nm–50 nm is a mesopore and a pore size greater than 50 nm is a macropore. Therefore, MB, HMB, NaMB and FeMB are all microporous and mesoporous mixed materials. It can be seen from Table 2 that the surface area of FeMB is smaller than that of other biochars, which indicates that the modification makes FeCl3 attach to the surface of biochar to form a composite film, occupying a part of the position and resulting in a decrease in the area of FeMB. The specific surface area of HMB and NaMB is higher than that of MB, which proves that acid–base modification cleans up the impurities in the pores of native biochar, improves the physical properties and increases the specific surface area.

3.2.3. SEM Analysis

The apparent image of biochar prepared by different modifiers can be analyzed by scanning electron microscopy. Figure 6 shows the scanning images of biochar modified by corn straw biochar under different conditions.
Figure 6a,b are the scanning electron micrographs of native biochar MB and acid-modified biochar HMB. The two graphs are similar, which proves that acid modification does not affect the surface morphology of MB. It can be observed from the cross-section that the pore walls of MB and HMB have no obvious lines, and there are a large number of tube bundle structures. This is because high-temperature pyrolysis leads to the destruction of the fiber structure of corn stover, and the biomass pyrolysis causes a large amount of volatile substances to escape [25], thus opening the blocked pores inside the corn stover and producing a certain regular tube bundle structure. It is worth noting that there is a certain amount of impurities in the tube bundle structure of MB and HMB. From the longitudinal view, it can be observed that the tube bundle structure is arranged in a regular order and is smooth and straight.
Figure 6c is the scanning electron microscope image of alkali-modified biochar NaMB. Compared to MB and HMB, its biochar materials become rough and collapsed. The pore wall of the cross-section of NaMB still has no obvious lines, but the tube bundle structure collapses obviously, more microporous structures are observed and there is no impurity in the gap, resulting in a more specific surface area. From the longitudinal section, it can be observed that a large number of concave and convex points appear in the tube bundle structure, and the roughness is deepened. It is proven that the NaOH solution will corrode the original biochar and change its surface morphology.
Figure 6d is the scanning electron microscope image of metal salt-modified biochar FeMB. Compared to MB, HMB and NaMB, the surface of FeMB becomes rougher. From the cross-section, it can be seen that more microporous structures appear on the surface of the whole pore wall, and the pores are clean and free of impurities, showing a larger specific surface area; it can be observed from the longitudinal section that the surface of the FeMB tube bundle structure is loaded with many irregular particles, which proves that Fe is successfully immersed in the surface and pores of biochar. This is also proven by XRD and the EDS energy spectrum (Figure 7).

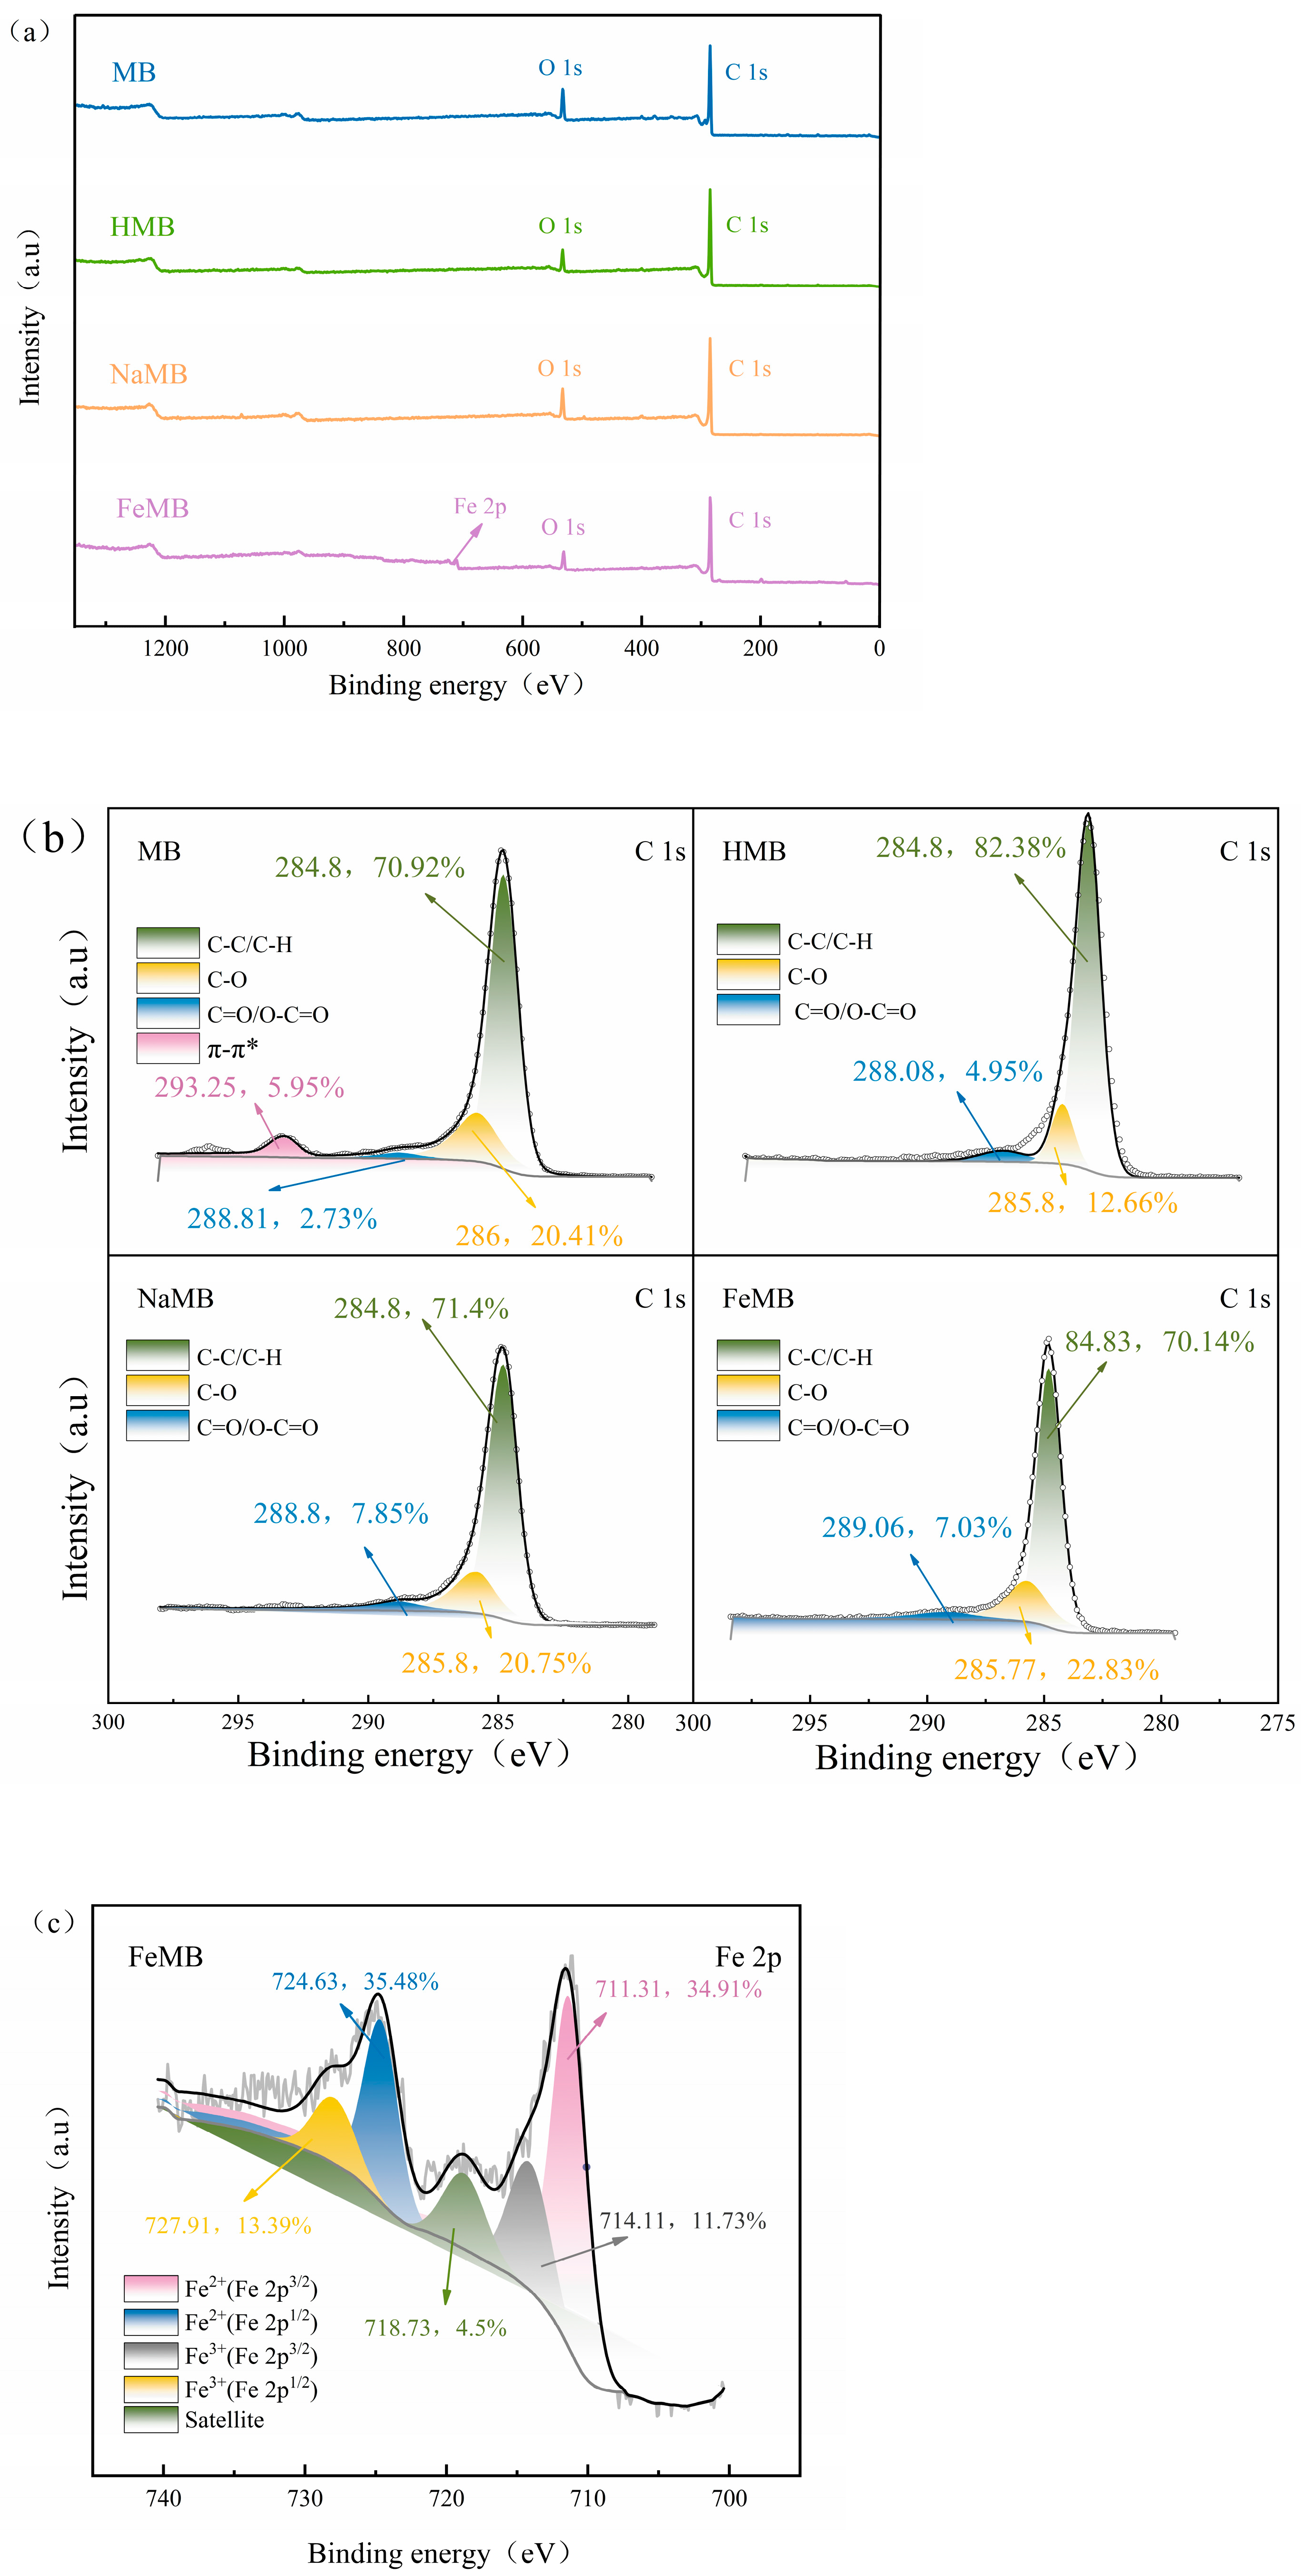
3.2.4. X-ray Photoelectron Spectroscopy (XPS) Measurement

Figure 8a shows the XPS spectra of MB, HMB, NaMB and FeMB, which all reflect the coexistence of the elements C and O, as seen in the full spectrum.
Figure 8b shows the C 1s spectrum of biochar before the adsorption of Cr(VI). Three similar peaks can be observed in MB, HMB, NaMB and FeMB, which are C-C/C-H at 284.6–284.8 eV, C-O at 285–286 eV and C=O at 288–289 eV, respectively. MB has a π–π* shake-up peak [26] at 293.25 eV, which is because MB has a graphite carbon structure [27,28].
The element Fe appeared in the full spectrum of FeMB, and the Fe 2p peak appeared at 711.44 eV in the FeMB spectrum. The content of Fe was 4.9%, indicating that Fe was successfully incorporated into FeMB. In order to further analyze the composition of the element iron, high-resolution scanning of Fe was performed to compare the binding energy positions. The analysis is shown in Figure 8c. There were four deconvolution peaks with binding energies of 711.31 eV, 724.6 eV, 714.11 eV and 727.91 eV, corresponding to Fe 2p3/2 and Fe 2p1/2 in Fe(II) and Fe 2p3/2 and Fe 2p1/2 in Fe(III), respectively. The satellite peak of Fe 2p3/2 was observed at 718.73 eV. The peak of Fe(III) belonged to the shock excitation spectrum of Fe(III), indicating that the sample contained FeO and Fe2O3 [29,30], which was consistent with the results of the XRD analysis.

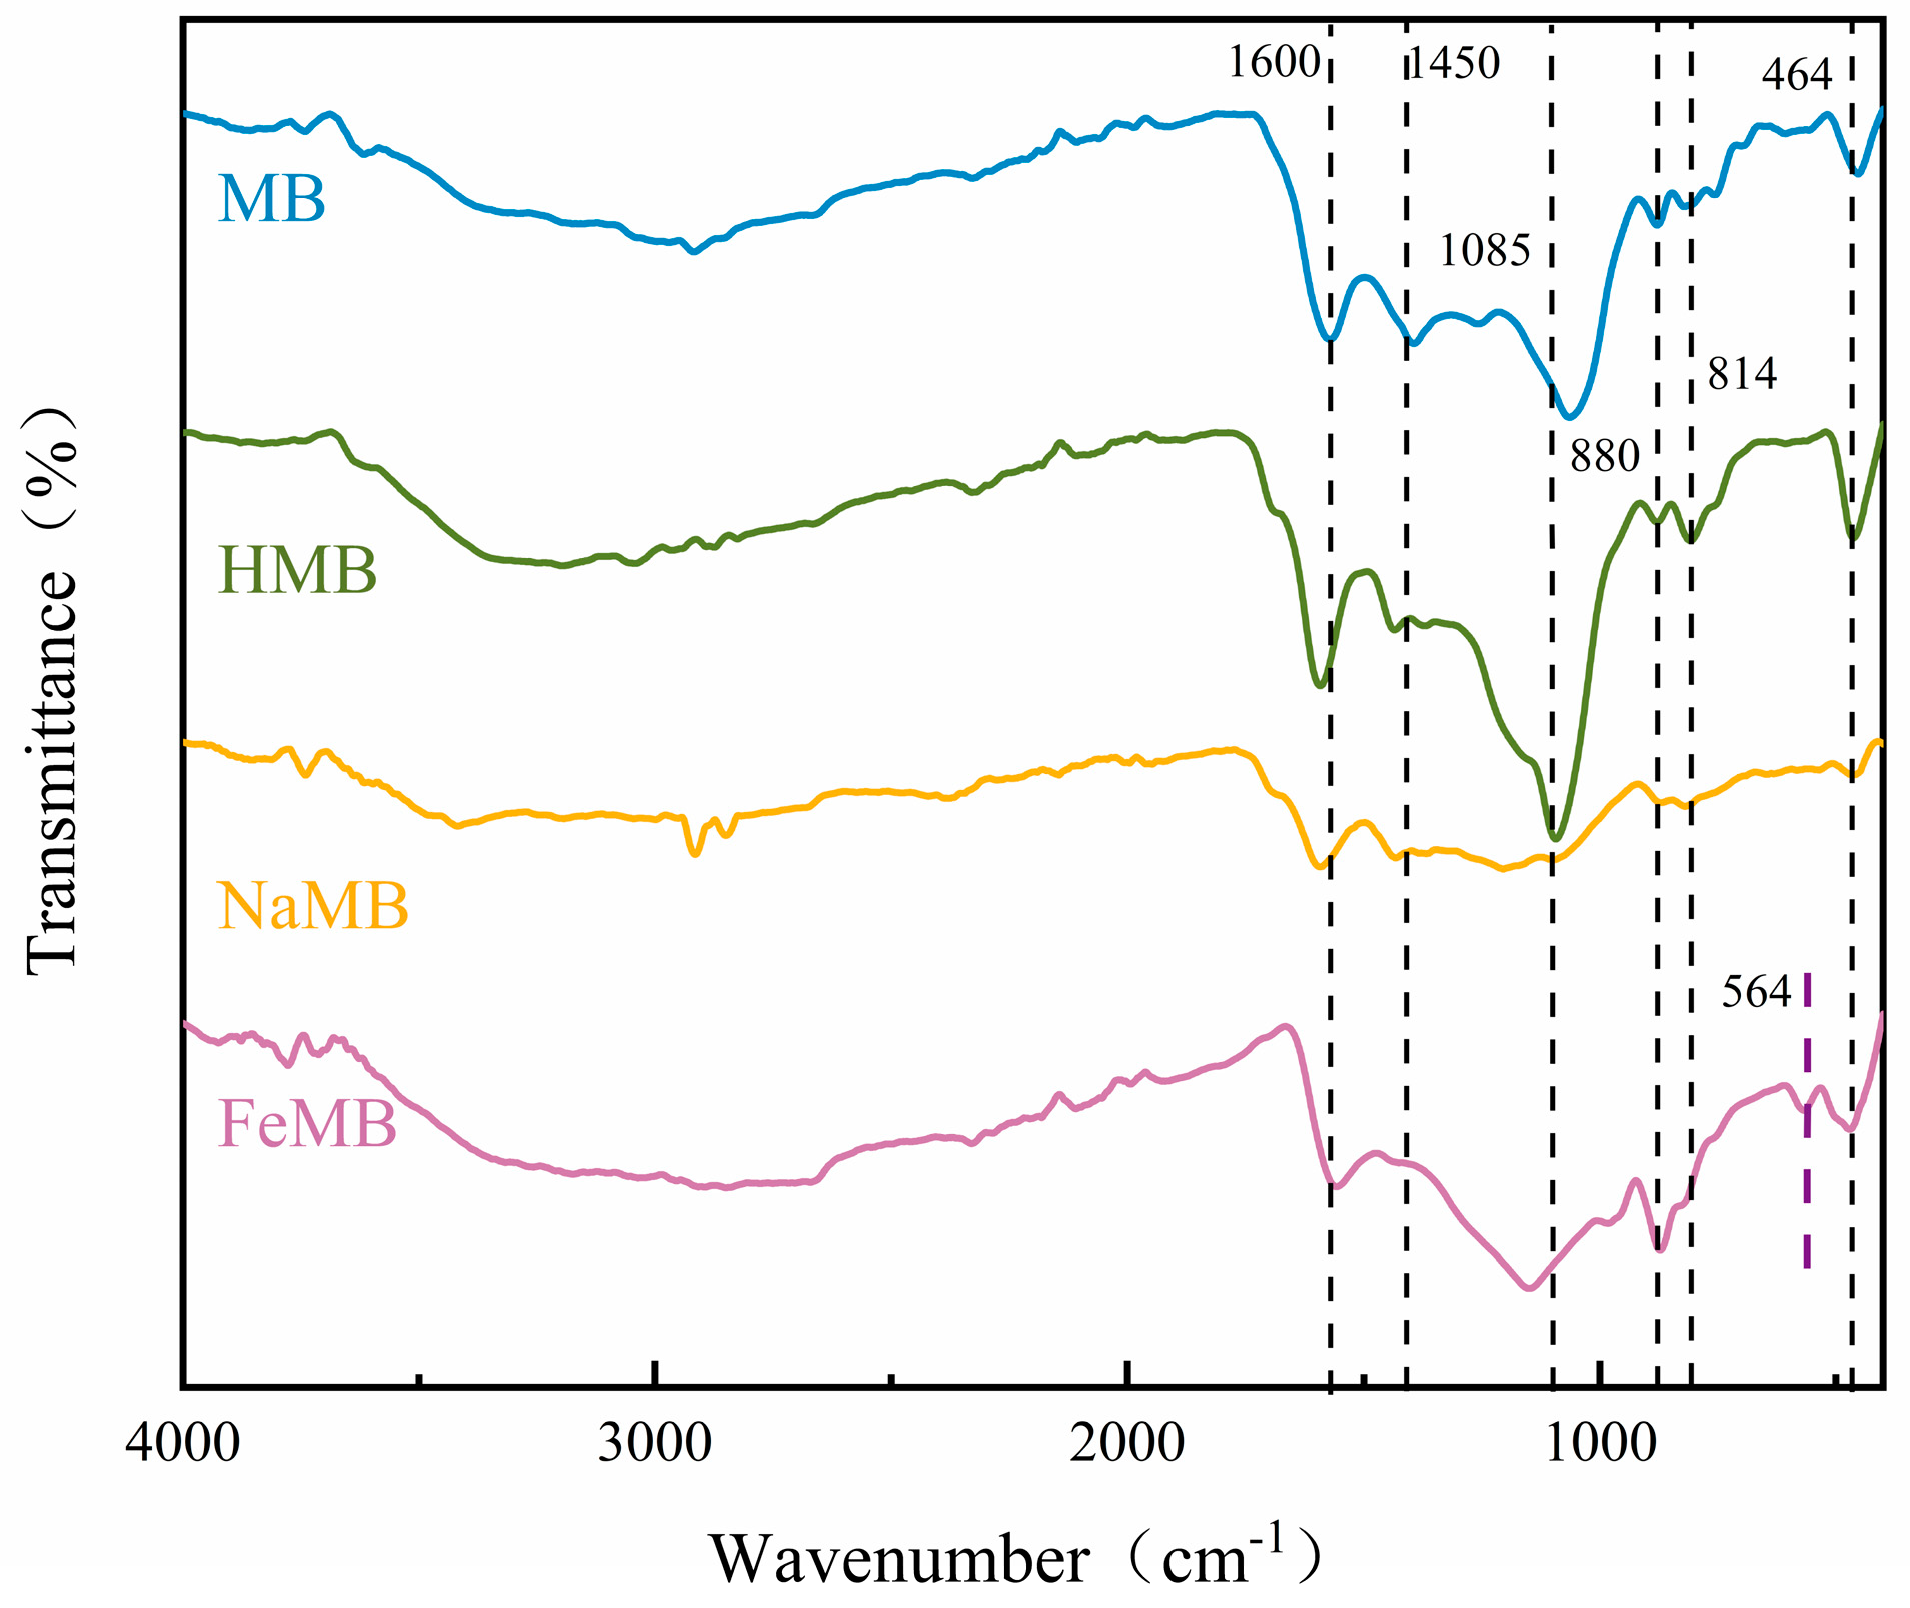
3.2.5. Fourier-Transform Infrared Spectroscopy (FTIR) Determination

The more oxygen-containing functional groups on the surface of the biochar, the higher the adsorption capacity of the biochar for heavy metals [31]. The chemical bonds and functional groups of the biochar materials were studied by FTIR, and the infrared spectral images of the MB, HMB, NaMB and FeMB materials were obtained, as shown in Figure 9.
The positions of the infrared characteristic peaks of HMB, NaMB and FeMB at 1600 cm−1, 1450 cm−1, 1085 cm−1, 880 cm−1, 814 cm−1 and 464 cm−1 were basically the same as those of MB, but the intensity was slightly different, indicating that acid–base modification could not change the type of biochar functional groups but could change the number of functional groups. As for the infrared spectra of FeMB and MB, it is proven that Fe particles have little effect on the functional groups in biochar. However, there is an obvious vibration peak at 564 cm−1, which corresponds to the stretching vibration of Fe-O [31], indicating that iron oxide particles are successfully loaded onto the surface of FeMB compared to MB.
The silicon in biochar comes from corn straw itself, and its main inorganic component is silicon. Its abundant silicon is due to the fact that crops absorb silicon from the soil and then deposit it on the site with strong transpiration, polymerize into hydrated amorphous silicon dioxide and, finally, exist in plants in the form of phytoliths [32]. The absorption peak at 814 cm−1 is the symmetric stretching vibration absorption peak of the Si-O-Si bond, the absorption peak at 464 cm−1 is caused by the bending vibration of the Si-O bond and the absorption peak at 1085 cm−1 is caused by the antisymmetric vibration of Si-O-Si [33,34]. The main absorption peaks of silica in NaMB and FeMB were significantly reduced, which proved that the ash was removed during the modification process. Correspondingly, in the process of removing Cr(VI), the effect was the best compared to the other modification methods.
The vibration of some aromatic functional groups at 800~1600 cm−1 proved the existence of a benzene ring [35]. For example, 880 cm−1 is the out-of-plane bending vibration peak of C-H on aromatic carbon, and 1600 cm−1 and 1450 cm−1 are the C=C stretching vibration of aromatic hydrocarbons—among which, FeMB has higher strength and shows good aromatic structure [35,36,37], indicating that iron modification enhances the aromaticity of biochar and enhances the role of cation–π, thus providing more active sites for biochar [38].

3.3. Adsorption Single-Factor Experiment

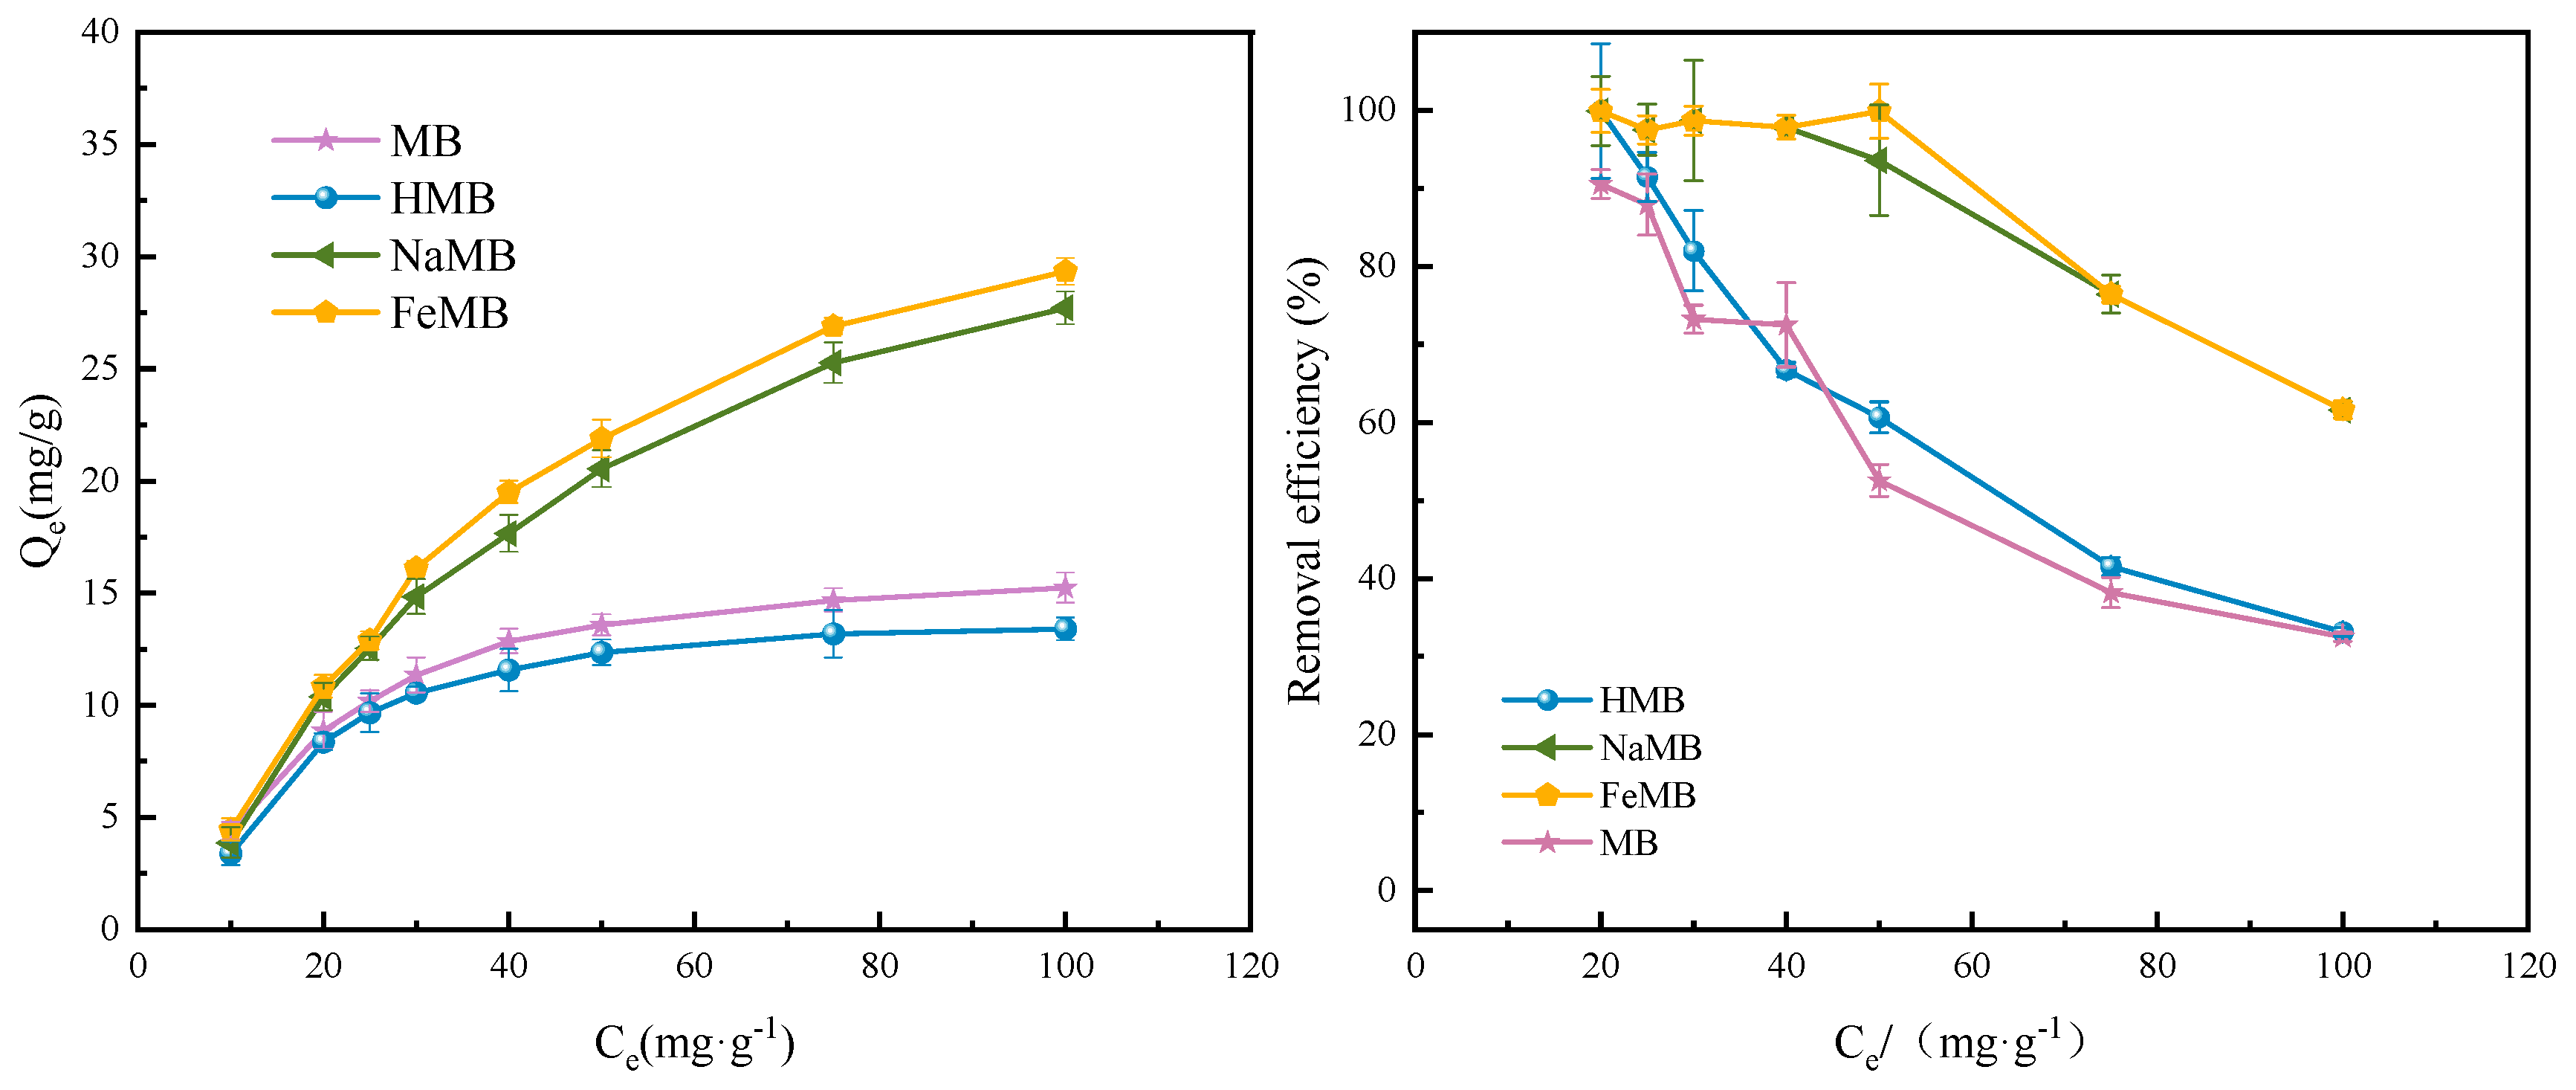
3.3.1. Initial Concentration
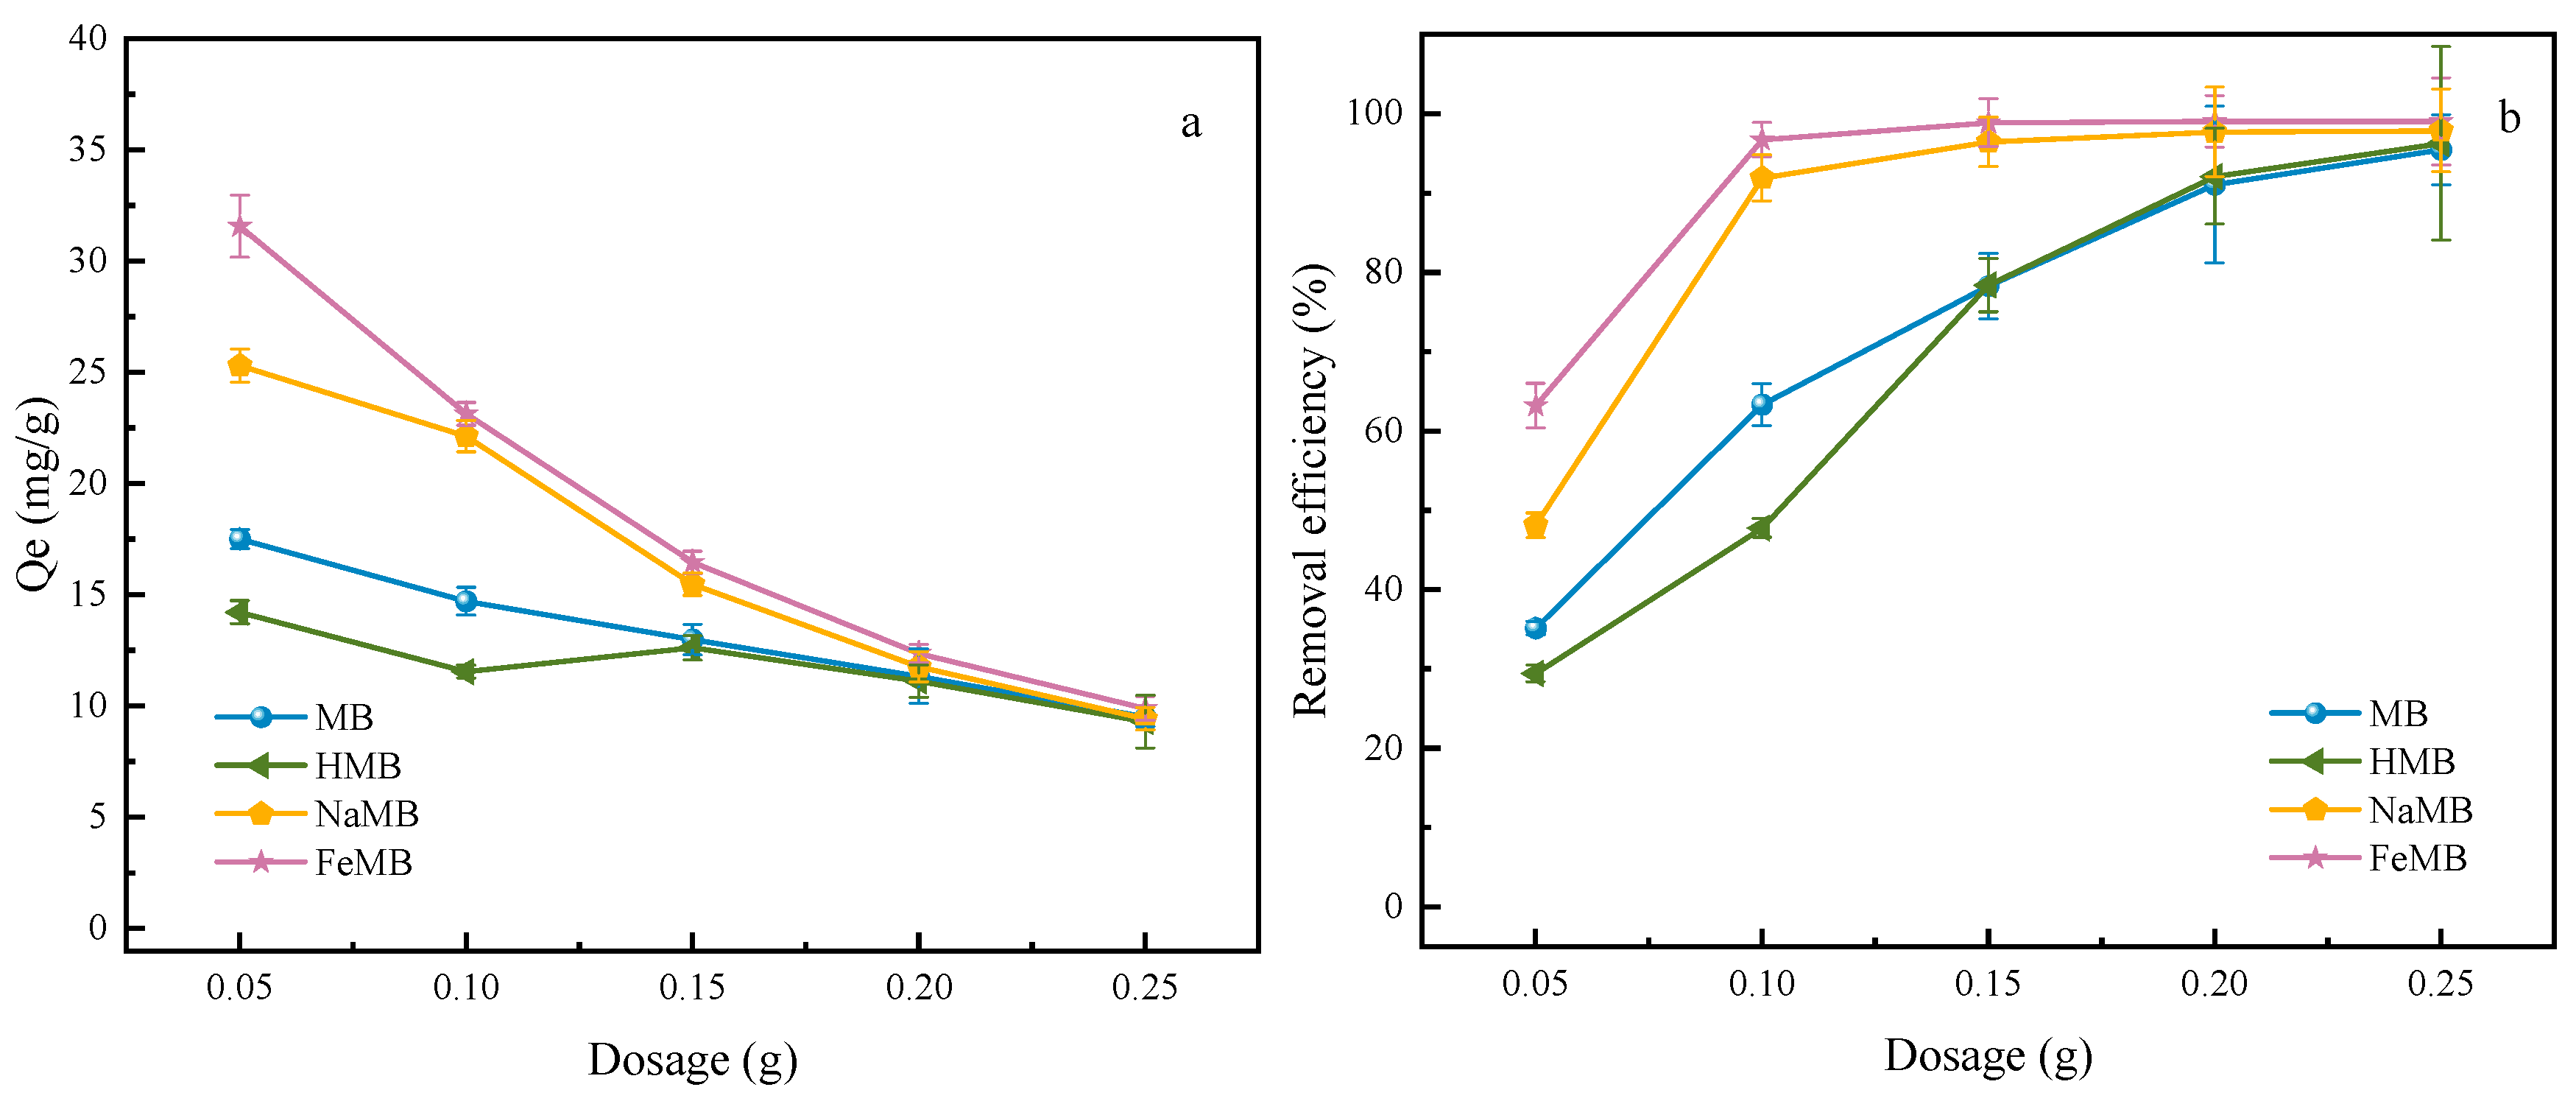
According to Figure 10, when the concentration of Cr(VI) increased from 10 mg/L to 100 mg/L, the removal rate of Cr(VI) by MB decreased from 99.82% to 33.19%, and the adsorption capacity increased from 4.39 mg/g to 15.25 mg/g. The removal rate of Cr(VI) by HMB decreased from 96.50% to 32.54%, and the adsorption capacity increased from 3.40 mg/g to 14.48 mg/g. The removal rate of Cr(VI) by NaMB decreased from 99.83% to 61.61%, and the adsorption capacity increased from 4.46 mg/g to 28.34 mg/g. The removal rate of Cr(VI) by FeMB decreased from 99.83% to 61.61%, and the adsorption capacity increased from 4.46 mg/g to 28.34 mg/g. This is because, when the concentration of Cr(VI) is low, the adsorption sites are more, and the probability of molecular collision is larger, so the removal effect is excellent. The initial concentration of Cr(VI) increased gradually, and the adsorption capacity of biochar to Cr(VI) increased with the increase in the initial concentration of Cr(VI), while the removal rate decreased with the increase in the initial concentration of Cr(VI). This is because the adsorption sites on the surface of biochar are limited. At a certain concentration, biochar reaches saturation.

3.3.2. Dosage

The correlation between heavy metals and adsorbent dosage is attributed to the increase in adsorption sites and adsorbent surface area. It can be seen from Figure 11 that, when the dosage of biochar increased from 1 g/L to 3 g/L, the removal rates of Cr(VI) by MB, HMB, NaMB and FeMB increased by 44.98%, 48.95%, 48.29% and 33.51%, respectively. When the dosage increased from 3 g/L to 5 g/L, the removal rates only increased by 17.18%, 17.87%, 1.45% and 0.16%.
It can be concluded that, in the initial stage, Cr(VI) has a high absorption rate for biochar due to the presence of empty adsorption sites for binding. The increase in adsorbent leads to saturated Cr(VI) adsorption at biochar sites, which indicates that the removal rate is significantly reduced. At higher than 3 g/L, due to the establishment of a balance or saturation between Cr(VI) ions and biochar, the increase in biochar concentration did not significantly change the removal efficiency. Therefore, in the equilibrium state, the adsorption is difficult due to the electrostatic repulsion between Cr(VI) ions and biochar surface.

3.3.3. pH

The pH value of the solution is an important factor in regulating the adsorption process. As shown in Figure 12, the removal rates of the two biochars have the same change trend with the pH. When the pH increased from 1.0 to 3.0, the removal rates of Cr(VI) by MB, HMB, NaMB and FeMB decreased sharply, which decreased by 90.63%, 54.85%, 57.06% and 14.66%, respectively. When the pH increased from 3.0 to 10.0, the adsorption capacity of Cr(VI) gradually slowed down and stabilized.
This is because the pH value will affect the existence of heavy metal ions in an aqueous solution. Cr(VI) mainly appears in the form of HCr2O7, CrO4−2, H2CrO4, HCrO4−1 and Cr2O7−2. When the pH is between 2 and 7, Cr(VI) mainly exists in the form of HCrO4, CrO4−2; H2CrO4 exists in aqueous solutions with pH > 1. When pH is less than 2, Cr2O7−2 appears. Under low pH conditions, Cr(VI) is easily reduced to Cr(III), which is one of the reasons why the adsorption effect shows the greatest advantage when pH < 2. Secondly, it leads to an electrostatic interaction between the positively charged adsorbent and the dichromate ion. With the increase in pH, the concentration of OH- in the solution increased, and these ions competed with Cr(VI) for adsorption sites on the surface of biochar, resulting in a decrease in removal rate and adsorption capacity.
The adsorption rate of Cr(VI) by FeMB is significantly higher than that of the other biochars. This is because the modified biochar surface forms a composite film due to the loading of Fe and Fe3+, which contains more positive charges and provides more adsorption sites for anions HCrO4 and Cr2O7−2. At the same time, due to the loading of trivalent iron, Fe-O groups were introduced into the surface of biochar, forming coordination adsorption with dichromate ions.

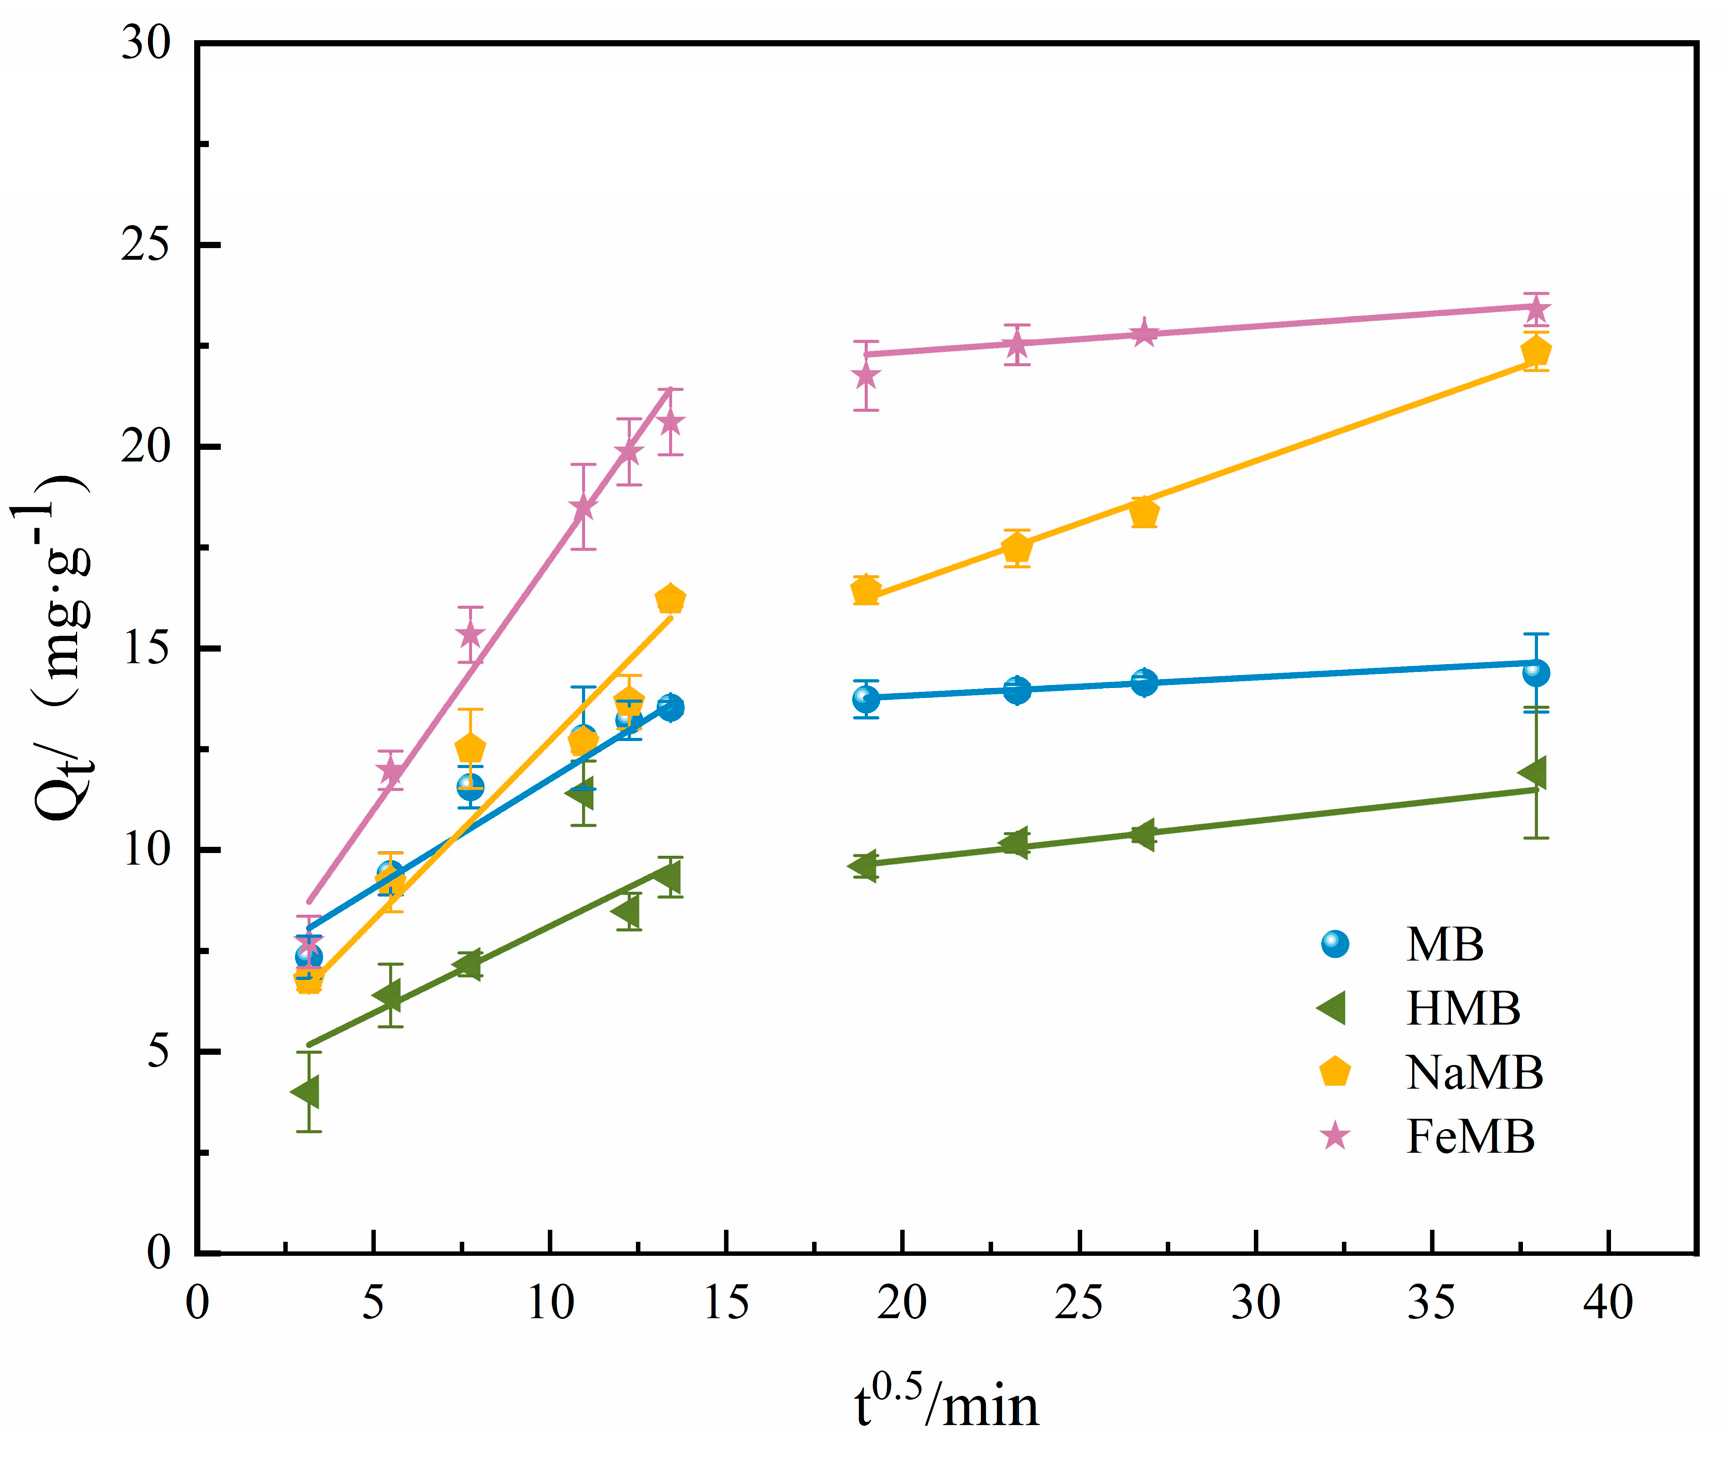
3.4. Adsorption Kinetics Experiment

It can be seen from Figure 13 and Table 3 that, by comparing the fitting parameters of the three biochars, the quasi-second-order fitting coefficient of MB is 0.99, which is extremely high above 0.9. The equilibrium adsorption capacity for MB = 13.48 mg/g, which is basically consistent with the MB = 14.39 mg/g obtained by model fitting. The quasi-second-order kinetic model assumes that the adsorption process is determined by the square of the unoccupied adsorption on the surface of the adsorbent. Therefore, it can be concluded that the adsorption of Cr(VI) by biochar is controlled by chemical interactions.
The quasi-second-order fitting coefficient of HMB was 0.928. The experimental results of the equilibrium adsorption capacity for HMB = 10.12 mg/g, the fitting for HMB = 11.92 mg/g, the NaMB quasi-second-order fitting coefficient was 0.92, the model fitting was 22.36 mg/g, the actual NaMB = 17.51 mg/g, the FeMB quasi-second-order fitting coefficient was 0.99, the equilibrium adsorption capacity for FeMB = 23.4 mg/g and the actual equilibrium adsorption capacity for FeMB = 21.71 mg/g. The difference was small. The R2 of the quasi-second-order kinetic model of all the biochars was higher than the value of the quasi-first-order kinetic equation, which also indicated that chemical reactions mainly occurred when HMB and FeMB adsorbed Cr(VI).
The adsorption capacity of different biochars for Cr(VI) in an aqueous solution was positively correlated with time. Within 90 min of the beginning of adsorption, the adsorption capacity of the adsorbent for Cr(VI) increased rapidly. This is because, at the beginning of adsorption, the surface functional groups of biochar are sufficient, the specific surface area is large and a large number of adsorption sites are provided. After 360 min, the adsorption sites were occupied, and the adsorption rate tended to be gentle until 1440 min, which was close to equilibrium.
As shown in Figure 14 and Table 4, the adsorption process can be divided into two processes. In the first stage, the rapid increase in adsorption amount belongs to membrane diffusion, and the second stage is the slow diffusion and adsorption of Cr(VI) in the membrane channel. Because the fitting line segments do not pass through the origin, it shows that intraparticle diffusion is not the only rate-controlling step, and the adsorption rate is controlled by both surface adsorption and intraparticle diffusion. Relatively speaking, the slope of the fitting line of FeMB is the largest, which indicates that Cr(VI) is more likely to diffuse to the surface of FeMB through the liquid film.

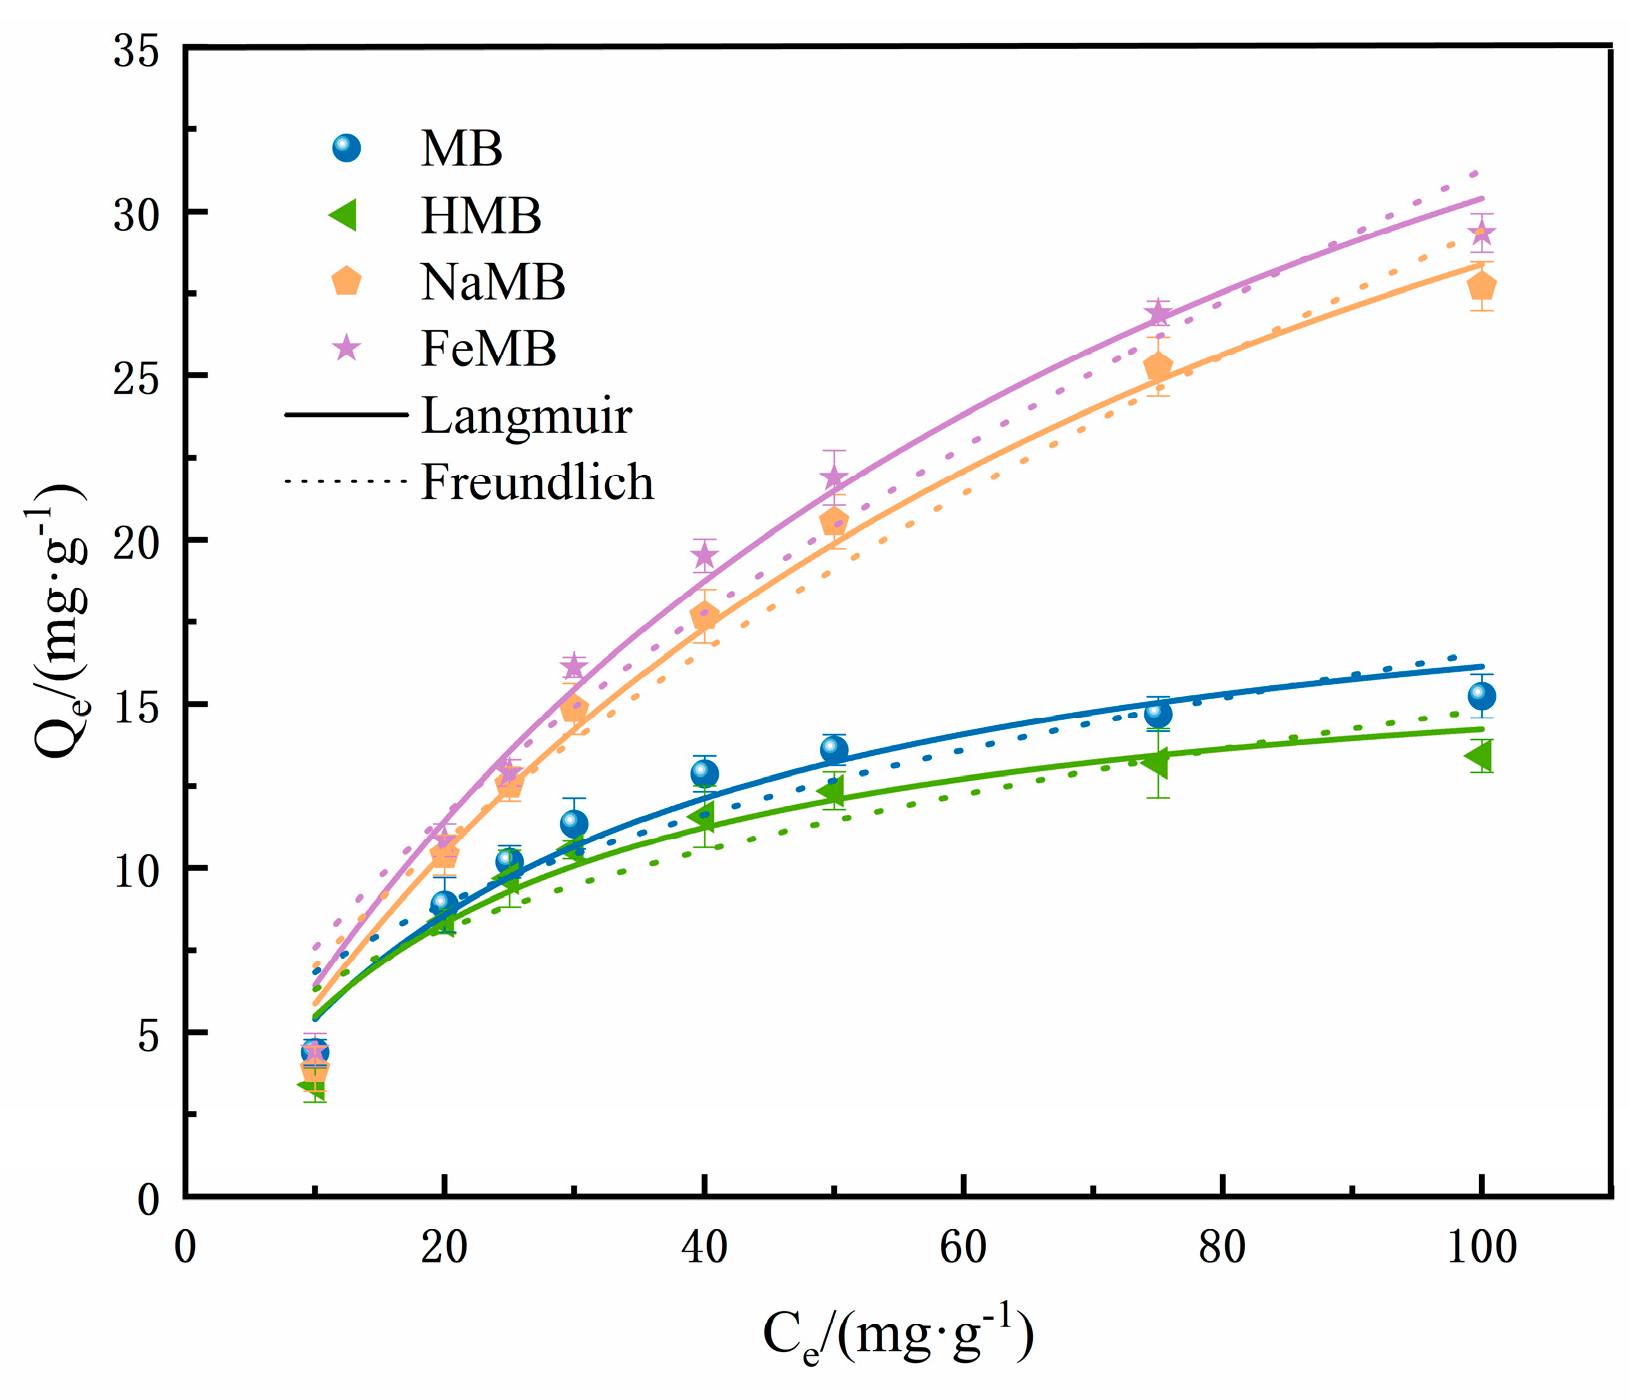
3.5. Isothermal Adsorption Experiments

The concentration relationship of biochar and Cr(VI) in the adsorption process can be further understood by the adsorption isotherm curve. In this study, the Langmuir adsorption isotherm model and Freundlich adsorption isotherm model were used to fit the experimental data of Cr(VI) adsorption by different biochars.
The Langmuir adsorption isotherm model describes the assumption that the adsorbates on the surface of the adsorbent are monolayer adsorptions, the adsorption sites are uniform and there is no interaction between the adsorbates. It is widely used in adsorption analysis, which can be used to describe the physical isothermal process or the chemical adsorption isothermal process. The Freundlich equation is an empirical equation. The two equations are expressed as follows:
Langmuir   equation :   C e q e = C e q m + 1 K L q m
Langmuir   separation   factor   r   expression :   R L = 1 1 + K L C 0
In the formula:
  • Ce—Cr(VI) solution equilibrium concentration, mg/L;
  • C0—Cr(VI) solution initial concentration, mg/L;
  • qm—Cr(VI) the maximum equilibrium adsorption capacity calculated by the adsorption isotherm model, mg/L;
  • KL—Langmuir adsorption equilibrium constant;
  • RL—Langmuir separation factor.
When RL = 0, the adsorption process is reversible; when 0 < RL < 1, the adsorption process is a preferential adsorption process; when RL = 1, the adsorption process is linear; when RL > 1, it indicates that the adsorption process is difficult to continue.
Freundlich   equation :   lg q e = lg K F + 1 n lg C e
In the formula:
  • KF—Freundlich adsorption equilibrium constant;
  • n—the constant of the adsorption trend.
When 0 < 1 n < 1, it indicates that the adsorption is easy to carry out; when 1 n > 1, it indicates that the adsorption is difficult to continue.
The data from the Cr(VI) adsorption were fitted by the Langmuir adsorption isotherm model and Freundlich adsorption isotherm model, as shown in Figure 15. Comparing the correlation coefficient R2 in Table 5, it can be seen that the adsorption process of Cr(VI) by all the biochars is more in line with the Langmuir adsorption isotherm model. It shows that the adsorption sites on the surface of the biochar are evenly distributed, and the number is limited. The adsorption process of Cr(VI) on the biochar is single-molecule adsorption. In addition, the RL of Cr(VI) in the initial concentration range of 10~100 mg/L is less than 1, which indicates that the adsorption process is easy to carry out, indicating that the biochar has the potential to be used as an efficient adsorbent in industry.

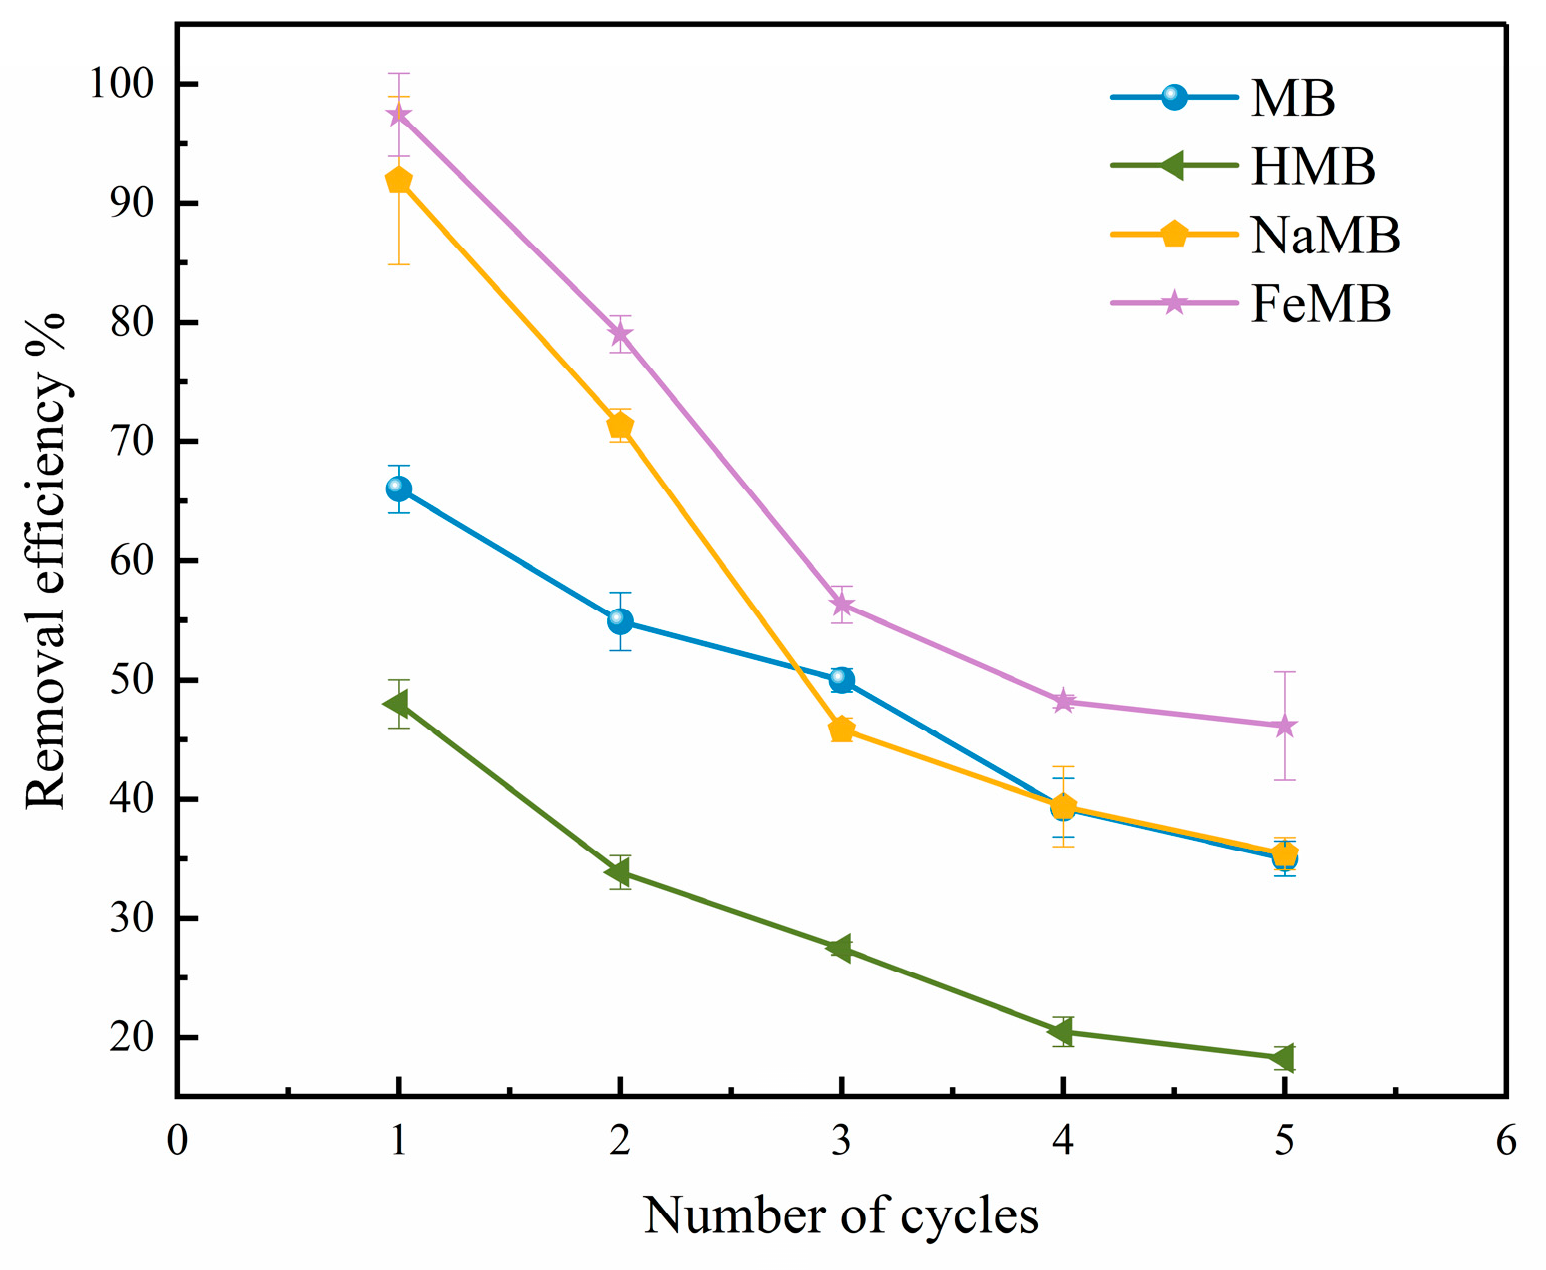
3.6. Adsorption Cycle Regeneration Experiment

In the practical application process, the criteria for evaluating biochar also need to take into account the reusability of biochar. From Figure 16, it can be concluded that, after five adsorption–desorption cycle experiments, the removal rate of Cr(VI) by the four biochars gradually decreased. Under the adsorption of MB, HMB and NaMB, the removal rate of Cr(VI) decreased by 31.01% (from 66.02% to 35.01%), 29.69% (from 47.99% to 18.29%) and 56.48% (from 91.91% to 35.42%), respectively.
The reusability and regeneration results of FeMB are shown in Figure 16, and its adsorption capacity maintained about 97% of the removal capacity at the first repetition. When repeated for the second time, the removal capacity of Cr(VI) was reduced by about 12%. The removal rates after three times of reuse were 56%, 48% and 46%, respectively. This is because the adsorption sites on the surface of FeMB were occupied by Cr(VI), and the pore structure was blocked to a certain extent. However, the removal rate of Cr(VI) by FeMB remained above 45%, so it still showed good adsorption performance compared to the other biochars. Therefore, in the practical application process, the use of FeMB as an adsorbent has economic applicability.
At the same time, it could be seen that the adsorption removal rate of Cr(VI) by FeMB decreased uniformly with the increase in the number of uses. The removal rate may be reduced for the following reasons: (1) During the reaction of the system, some iron ions were precipitated between the FeMB layers, resulting in a decrease in adsorption sites. (2) After repeated use, some of the adsorption sites on FeMB were occupied by Cr(VI), the number of sites capable of effective adsorption was continuously reduced and the adsorption effect became weaker.

3.7. Adsorption Mechanism Exploration

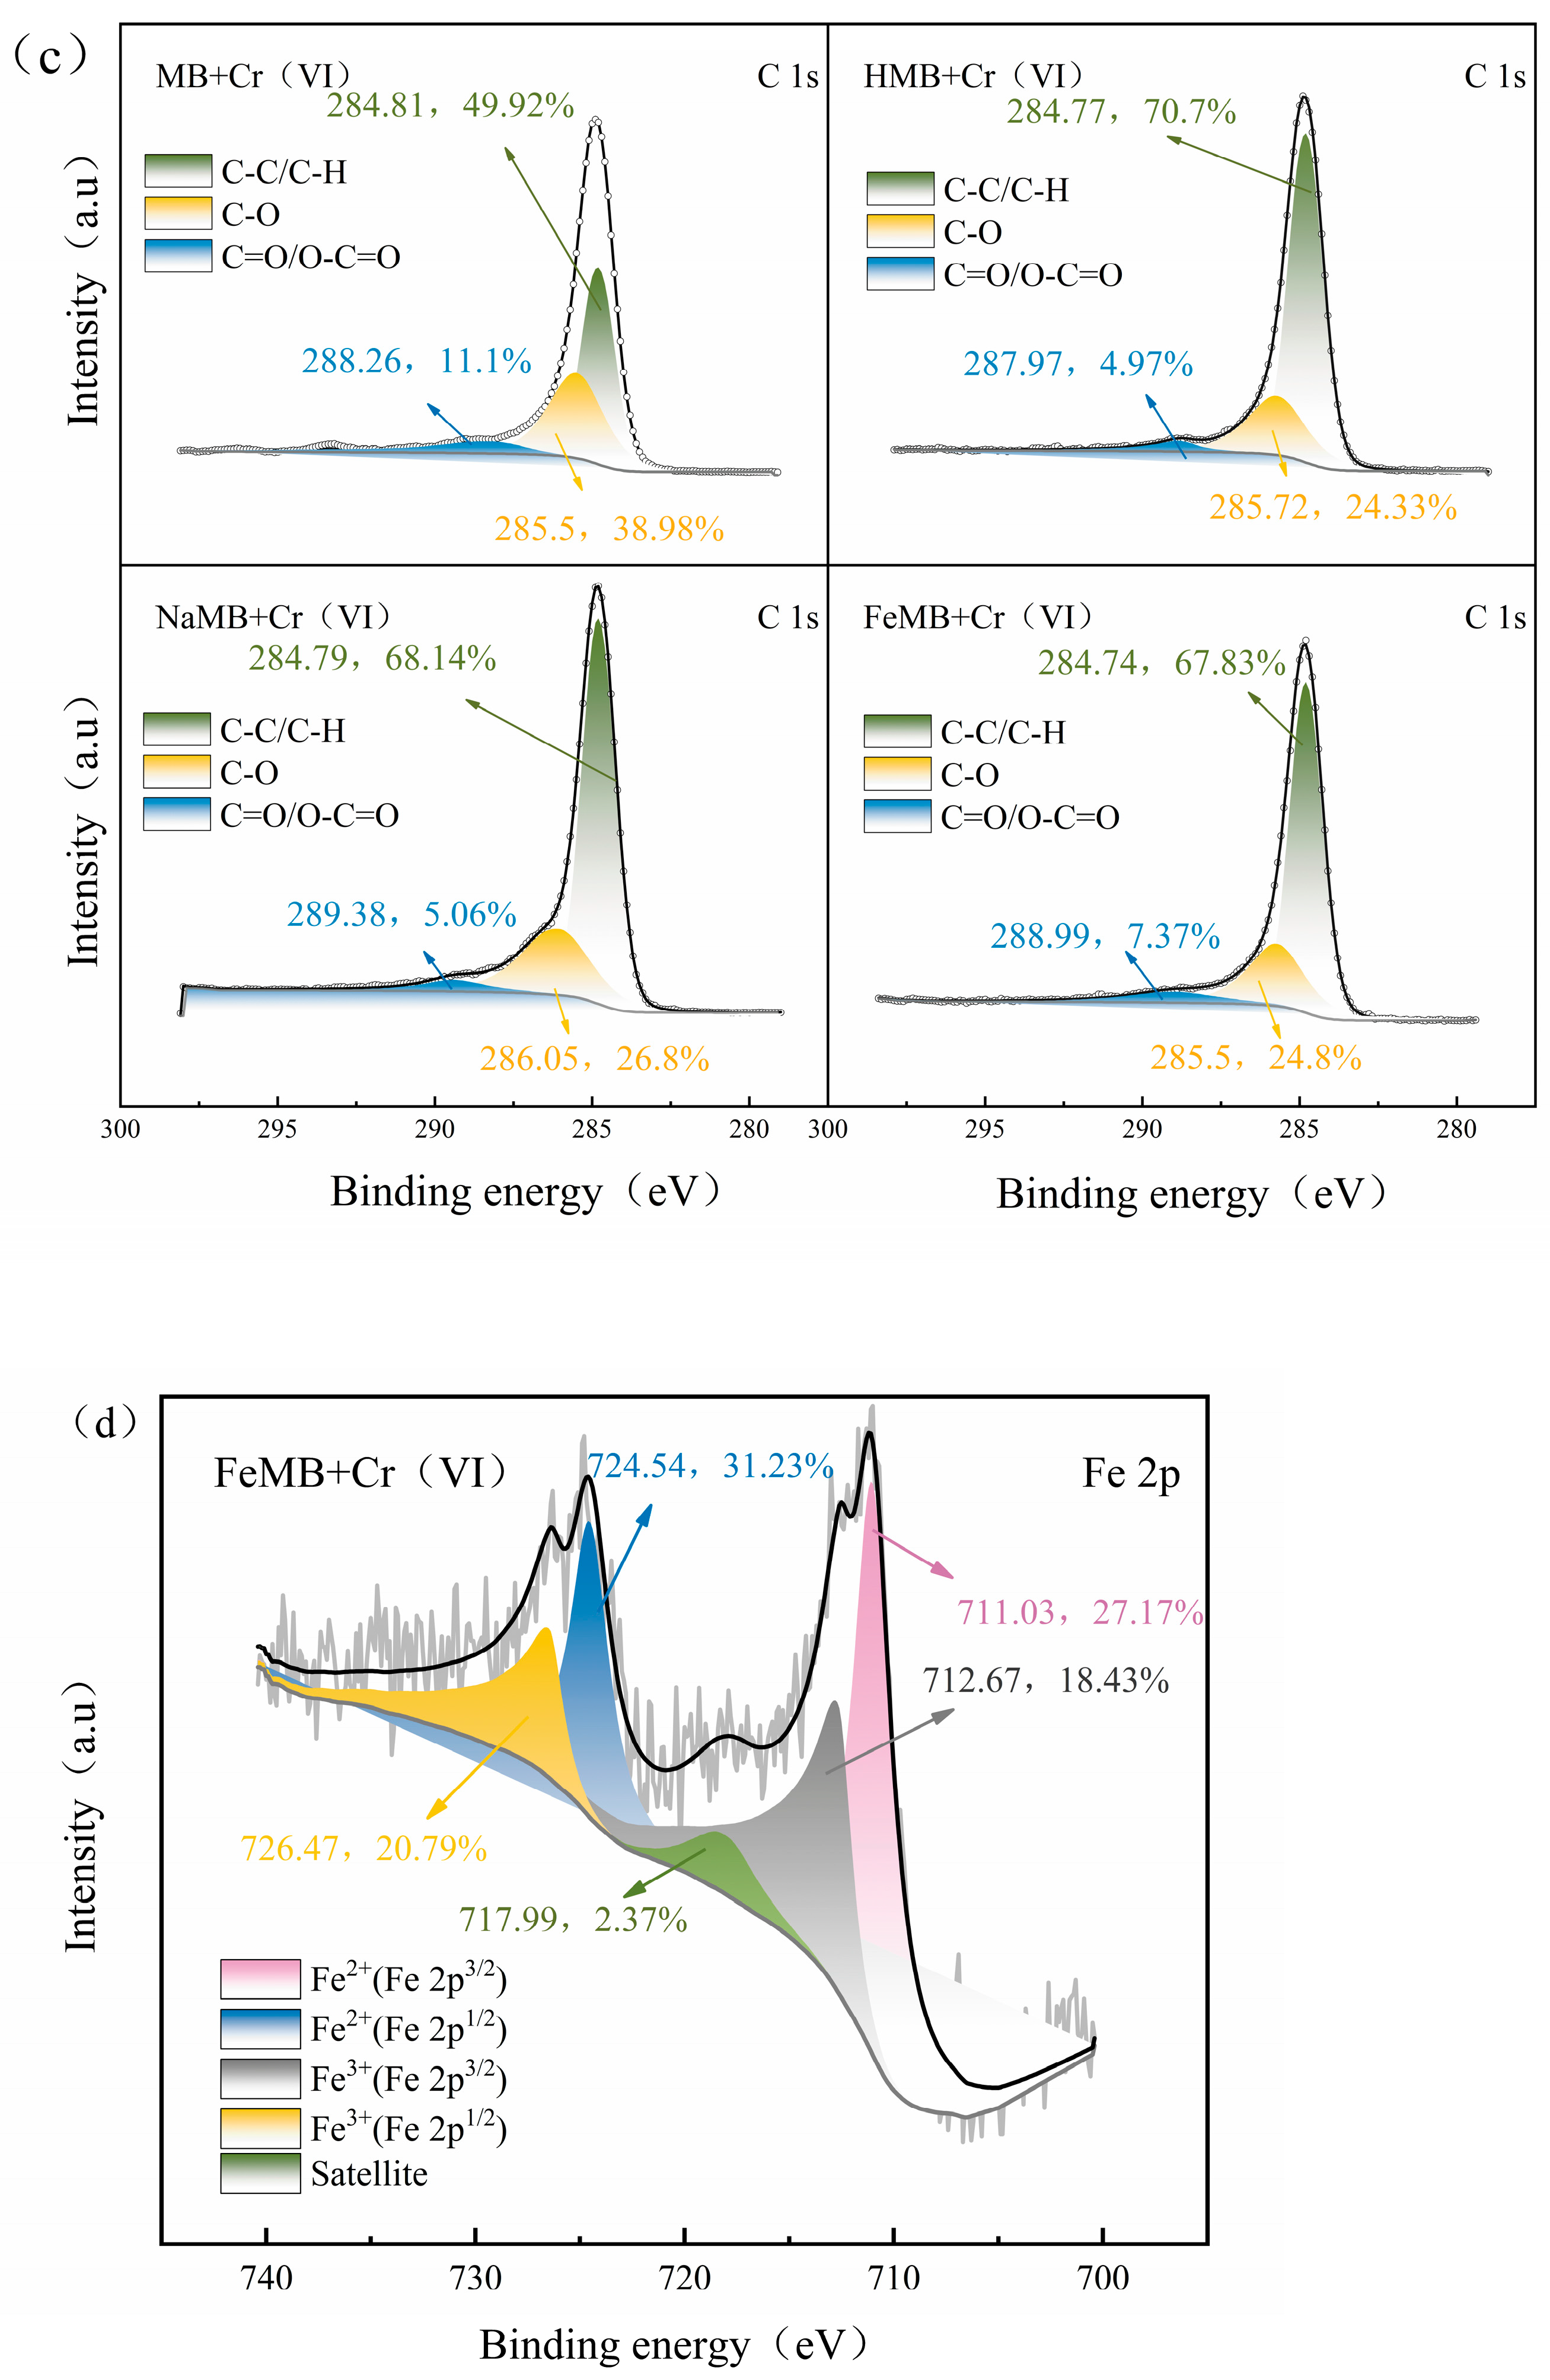
3.7.1. XPS Analysis after Cr(VI) Adsorption

The XPS spectra of biochar after the adsorption of Cr(VI) are shown in Figure 17a. The new Cr 2p peak indicates that Cr has accumulated on the surface of the biochar. Figure 17c is a fine spectrum of Cr 2p. The Cr on the biochar is attached to the surface in two valence states of trivalent and hexavalent, indicating that some Cr(VI) is reduced to less toxic Cr(III) after the adsorption reaction.
Compared to the C 1s spectrum shown in Figure 17b before adsorption, the positions of C=O and C-O binding energy were shifted, the content was changed and the π–π* shock peak of MB disappeared. This is because C=O, C-O and π–π* shock peaks are involved in the adsorption process.
Figure 17d is the Fe 2p spectrum of FeMB after the adsorption of Cr(VI). The Fe 2p3/2 and Fe 2p1/2 of Fe(II) and Fe(III) were shifted. The proportion of Fe(II) decreased from 70.39% to 58.42% after adsorption, and the proportion of Fe(III) increased from 29.61% to 41.58%. This indicates that Fe(II) is involved in the redox reaction of Cr(VI), which proves that the redox reaction is also one of the mechanisms of Cr(VI) adsorption.

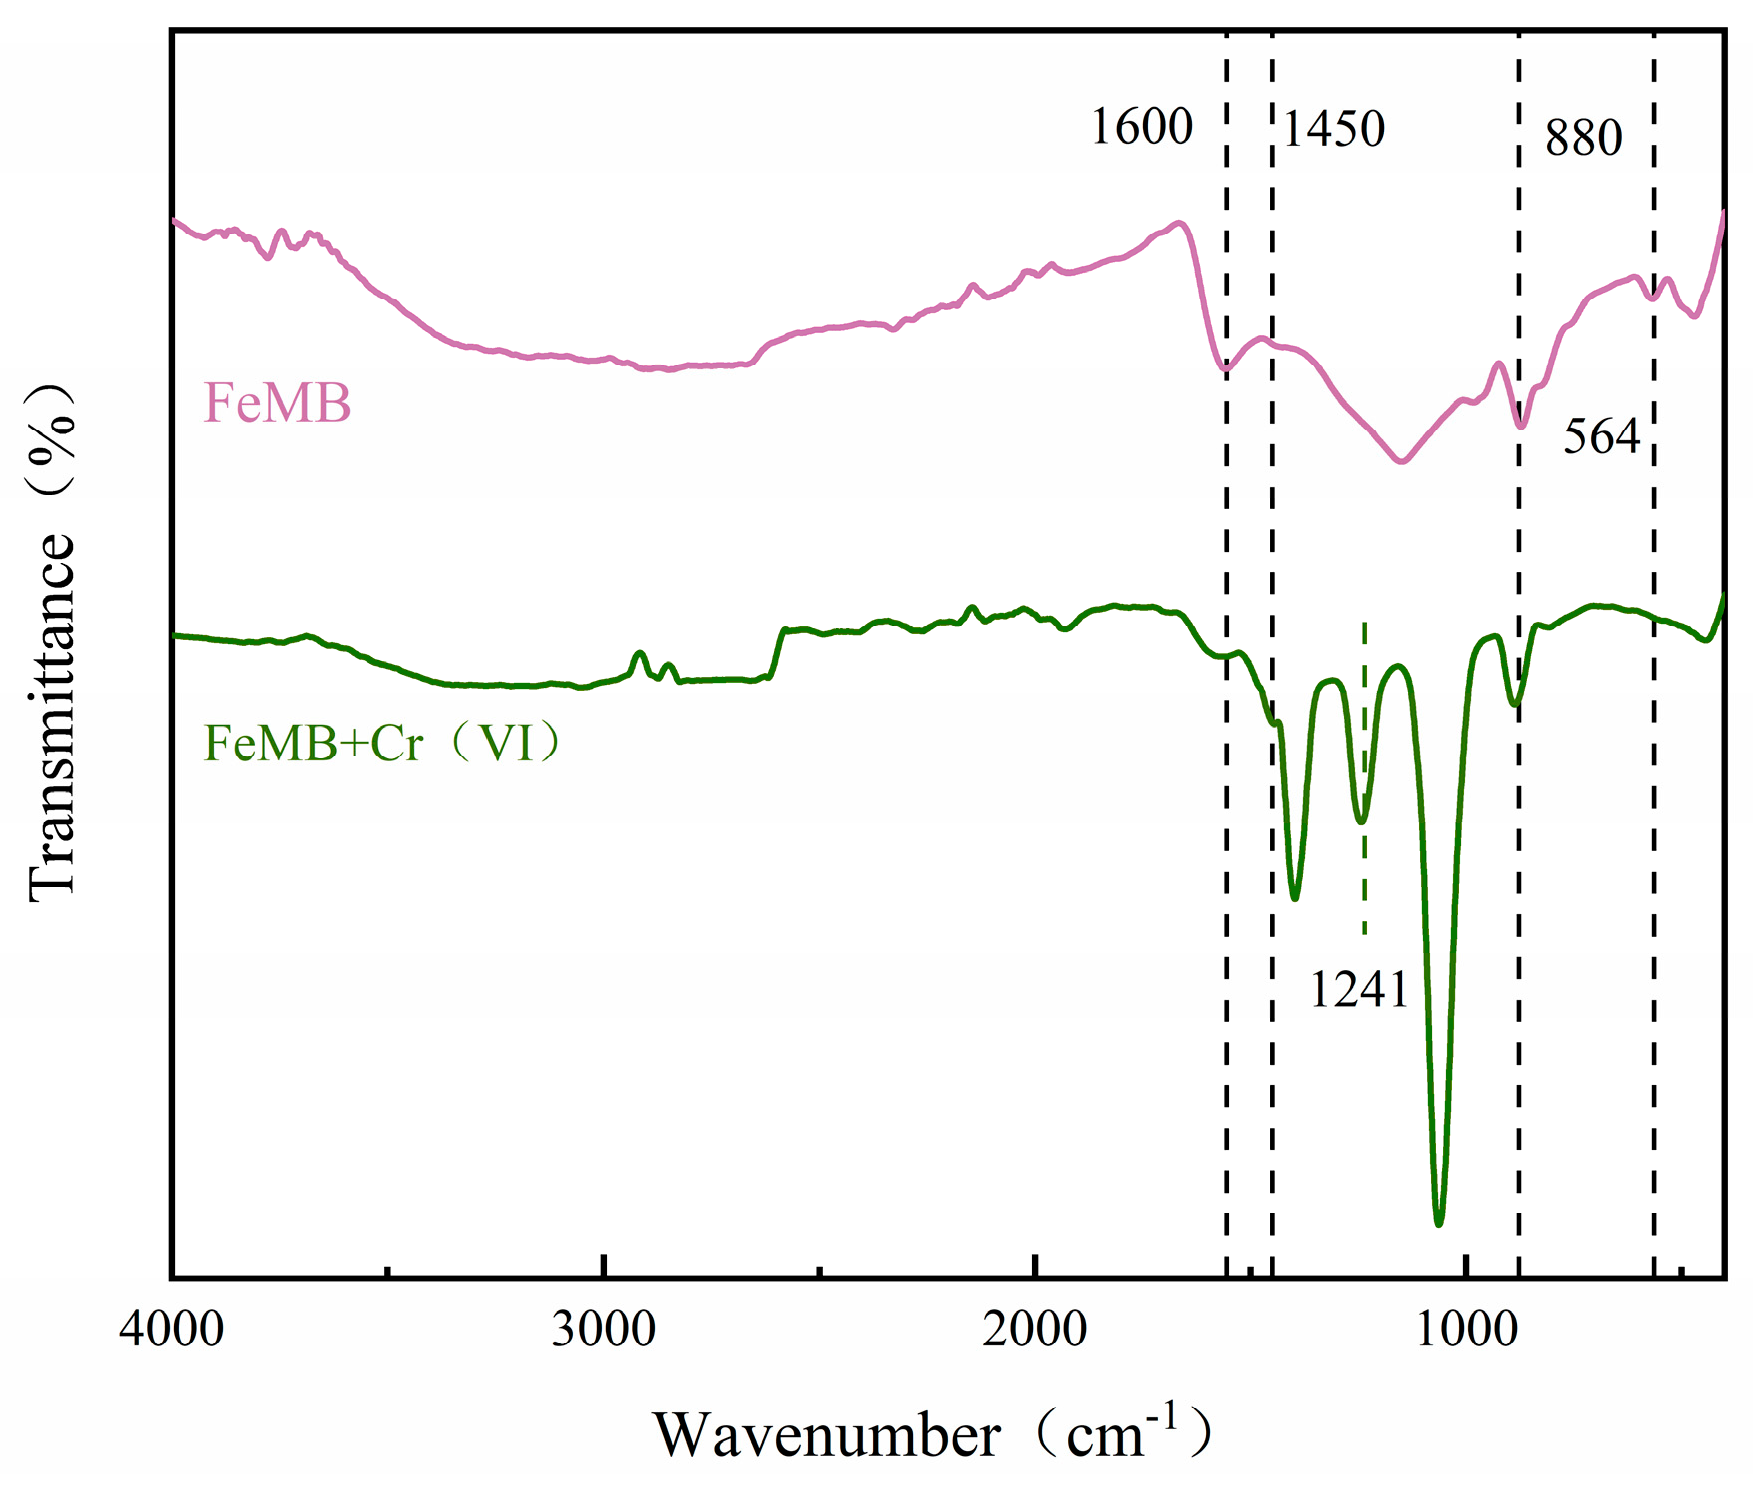
3.7.2. FTIR Analysis after Cr(VI) Adsorption

The FTIR of FeMB before and after the adsorption of Cr(VI) is shown in Figure 18, and the absorption peaks at 1600 cm−1, 1450 cm−1, 880 cm−1 and 464 cm−1 have different degrees of offset or amplitude increase or decrease, indicating that the adsorption is related to C=C, C-H and Fe-O, and the absorption peaks have a weakening trend. It is considered that FeMB undergoes electrostatic attraction and chemical adsorption during the adsorption process, resulting in dehydrogenation and deoxygenation reactions and weakening of the aromatic structure [39]. After adsorption, a new functional group, C=O, was generated at 1241 cm−1 on the surface of the biochar, which symbolized the formation of a complex or precipitate after the adsorption reaction [40].

4. Conclusions

  • Under the conditions of 25 °C and pH = 2, the adsorption process of Cr(VI) by MB, HMB, NaMB and FeMB conforms to the Langmuir adsorption isotherm model and the quasi-secondary kinetic model. Among them, FeMB has the best adsorption performance, and the removal rate of Cr(VI) remains above 45% after five cycles.
  • The results of SEM (the surface of FeMB is rough, and its surface is loaded with many irregular particles) and XRD (the presence of iron oxide ɑ-Fe2O3 on FeMB) showed that FeCl3-modified biochar successfully loaded Fe on the surface of biochar to form a composite film and made FeMB form a stable crystal structure.
  • FTIR and XPS analysis showed that there were FeO and Fe2O3 on the surface of FeMB, which proved that iron oxide particles were also successfully loaded onto the composite film on the surface of FeMB, and iron modification enhanced the aromaticity of biochar, enhanced the role of cations and provided more active sites. According to the BET analysis, the pore structure of FeMB is dominated by slit pore adsorption caused by layered polymers, and most of them are mesoporous, and all the biochars are microporous and mesoporous mixed materials.
  • The adsorption sites on the surface of the biochar are limited, and increasing the adsorption sites can effectively improve the adsorption efficiency. The modified biochar surface contains more positive charges due to the composite film formed by loading Fe and Fe3+, which provides more adsorption sites for anions HCrO4 and Cr2O7−2. At the same time, due to the loading of trivalent iron, Fe-O groups were introduced into the surface of the biochar, forming coordination adsorption with dichromate ions.
  • The adsorption of Cr(VI) by the biochar is from monolayer chemical adsorption. The adsorption mechanism includes electrostatic interaction, surface functional group complexation and reduction, and the adsorption performance is affected by the polarity and hydrophilicity of the biochar.

Author Contributions

Y.W. and J.Z. (writing—review and editing): preparation, creation and/or presentation of the published work by those from the original research group, specifically critical review, commentary or revision, including pre- or post-publication stages. W.L. (formal analysis): application of statistical, mathematical, computational or other formal techniques to analyze or synthesize the study data. Z.X. and J.L. (conceptualization): ideas; formulation or evolution of the overarching research goals and aims. T.Z. and C.T. (resources): provision of study materials, reagents, materials, patients, laboratory samples, animals, instrumentation, computing resources or other analysis tools. All authors have read and agreed to the published version of the manuscript.

Funding

This research was funded by 2023 Heilongjiang Natural Science Foundation Joint Guidance Project (LH2023E029).

Institutional Review Board Statement

Not applicable.

Informed Consent Statement

Not applicable.

Data Availability Statement

The data presented in this study are available in this article.

Conflicts of Interest

The authors declare no conflict of interest.

References

  1. Vardhan, K.H.; Kumar, P.S.; Panda, R.C. A review on heavy metal pollution, toxicity and remedial measures: Current trends and future perspectives. J. Mol. Liq. 2019, 290, 111197. [Google Scholar] [CrossRef]
  2. Ahmed, S.F.; Kumar, P.S.; Rozbu, M.R.; Chowdhury, A.T.; Nuzhat, S.; Rafa, N.; Mahlia, T.; Ong, H.C.; Mofijur, M. Heavy metal toxicity, sources, and remediation techniques for contaminated water and soil. Environ. Technol. Innov. 2022, 25, 102114. [Google Scholar] [CrossRef]
  3. Khalef, R.N.; Hassan, A.I.; Saleh, H.M. Heavy Metal’s Environmental Impact; Intech Open: London, UK, 2022. [Google Scholar]
  4. Hosseini, S.M.; Alibakhshi, H.; Jashni, E.; Parvizian, F.; Shen, J.; Taheri, M.; Ebrahimi, M.; Rafiei, N. A novel layer-by-layer heterogeneous cation exchange membrane for heavy metal ions removal from water. J. Hazard. Mater. 2020, 381, 120884. [Google Scholar] [CrossRef] [PubMed]
  5. Foong, C.Y.; Wirzal, H.; Bustam, M.A. A review on nanofibers membrane with amino-based ionic liquid for heavy metal removal. J. Mol. Liq. 2020, 297, 111793. [Google Scholar] [CrossRef]
  6. Wu, H.; Wang, W.; Huang, Y.; Han, G.; Yang, S.; Su, S.; Sana, H.; Peng, W.; Cao, Y.; Liu, J. Comprehensive evaluation on a prospective precipitation-flotation process for metal-ions removal from wastewater simulants. J. Hazard. Mater. 2019, 371, 592–602. [Google Scholar] [CrossRef]
  7. Allioux, F.; Kapruwan, P.; Milne, N.; Kong, L.; Fattaccioli, J.; Chen, Y.; Dumée, L.F. Electro-capture of heavy metal ions with carbon cloth integrated microfluidic devices. Sep. Purif. Technol. 2018, 194, 26–32. [Google Scholar] [CrossRef]
  8. Wang, J.; Chen, C. Biosorbents for heavy metals removal and their future. Biotechnol. Adv. 2009, 27, 195–226. [Google Scholar] [CrossRef]
  9. Marwa, E.; Ahmed, S.E.; Samer, F.; Rooney, D.W.; Osman, A.I. Competitive adsorptive removal of promazine and promethazine from wastewater using olive tree pruning biochar: Operational parameters, kinetics, and equilibrium investigations. Environ. Sci. Pollut. Res. Int. 2023, 30, 82387–82405. [Google Scholar]
  10. Thangagiri, B.; Sakthivel, A.; Jeyasubramanian, K.; Seenivasan, S.; Raja, J.D. Modeling and optimization of removal of Pb(II) in aqueous solutions by biochar derived from neem leaves using central composite design of response surface methodology. Biomass Convers. Biorefin. 2023. [Google Scholar] [CrossRef]
  11. Tag, A.T.; Duman, G.; Ucar, S.; Yanik, J. Effects of feedstock type and pyrolysis temperature on potential applications of biochar. J. Anal. Appl. Pyrolysis 2016, 120, 200–206. [Google Scholar] [CrossRef]
  12. Wang, T.; Zhai, Y.; Zhu, Y.; Li, C.; Zeng, G. A review of the hydrothermal carbonization of biomass waste for hydrochar formation: Process conditions, fundamentals, and physicochemical properties. Renew. Sustain. Energy Rev. 2018, 90, 223–247. [Google Scholar] [CrossRef]
  13. Li, Y.; Shan, S.; Yang, R.; Gai, X.; Mao, J.; Huang, N.; Tou, Y.; Meas, A. Preparation of bamboo biochars by low-temperature hydrothermal method and its adsorption of organics. Trans. Chin. Soc. Agric. Eng. 2016, 32, 240–247. [Google Scholar]
  14. Song, J.; Zhang, S.; Li, G.; Du, Q.; Yang, F. Preparation of montmorillonite modified biochar with various temperatures and their mechanism for Zn ion removal. J. Hazard. Mater. 2020, 391, 121692. [Google Scholar] [CrossRef] [PubMed]
  15. Ponnusamy, V.K.; Nagappan, S.; Bhosale, R.R.; Lay, C.-H.; Nguyen, D.D.; Pugazhendhi, A.; Chang, S.W.; Kumar, G. Review on sustainable production of biochar through hydrothermal liquefaction: Physico-chemical properties and applications. Bioresour. Technol. 2020, 310, 123414. [Google Scholar] [CrossRef] [PubMed]
  16. Liu, Z.; Xu, Z.; Xu, L.; Buyong, F.; Chay, T.C.; Li, Z.; Cai, Y.; Hu, B.; Zhu, Y.; Wang, X. Modified biochar: Synthesis and mechanism for removal of environmental heavy metals. Carbon Res. 2022, 1, 8. [Google Scholar] [CrossRef]
  17. Xie, Y.; Wang, L.; Li, H.; Westholm, L.J.; Carvalho, L.; Thorin, E.; Yu, Z.; Yu, X.; Skreiberg, Ø. A critical review on production, modification and utilization of biochar. J. Anal. Appl. Pyrolysis 2022, 161, 105405. [Google Scholar] [CrossRef]
  18. Lü, F.; Lu, X.; Li, S.; Zhang, H.; Shao, L.; He, P. Dozens-fold improvement of biochar redox properties by KOH activation. Chem. Eng. J. 2022, 429, 132203. [Google Scholar] [CrossRef]
  19. Zhang, X.; Zheng, H.; Wu, J.; Chen, W.; Chen, Y.; Xuezhi, G.; Yang, H.; Chen, H. Physicochemical and adsorption properties of biochar from biomass-based pyrolytic polygeneration: Effects of biomass species and temperature. Biochar 2021, 3, 657–670. [Google Scholar]
  20. Tomczyk, A.; Sokołowska, Z.; Boguta, P. Biochar physicochemical properties: Pyrolysis temperature and feedstock kind effects. Rev. Environ. Sci. Bio/Technol. 2020, 19, 191–215. [Google Scholar] [CrossRef]
  21. Qiu, B.; Tao, X.; Wang, H.; Li, W.; Ding, X.; Chu, H. Biochar as a low-cost adsorbent for aqueous heavy metal removal: A review. J. Anal. Appl. Pyrolysis 2021, 155, 105081. [Google Scholar] [CrossRef]
  22. Liu, Y.; Lonappan, L.; Brar, S.K.; Yang, S. Impact of biochar amendment in agricultural soils on the sorption, desorption, and degradation of pesticides: A review. Sci. Total Environ. 2018, 645, 60–70. [Google Scholar] [CrossRef] [PubMed]
  23. Xia, D.; Li, H.; Mannering, J.; Huang, P.; Zheng, X.; Kulak, A.; Baker, D.; Iruretagoyena, D.; Menzel, R. Electrically Heatable Graphene Aerogels as Nanoparticle Supports in Adsorptive Desulfurization and High-Pressure CO2 Capture. Adv. Funct. Mater. 2020, 30, 2002788. [Google Scholar] [CrossRef]
  24. Jing, F.; Pan, M.; Chen, J. Kinetic and isothermal adsorption-desorption of PAEs on biochars: Effect of biomass feedstock, pyrolysis temperature, and mechanism implication of desorption hysteresis. Environ. Sci. Pollut. Res. 2018, 25, 11493–11504. [Google Scholar] [CrossRef] [PubMed]
  25. Ma, X.; Zhou, B.; Budai, A.; Jeng, A.; Hao, X.; Wei, D.; Rasse, D. Study of biochar properties by scanning electron microscope–energy dispersive X-ray spectroscopy (SEM-EDX). Commun. Soil Sci. Plant Anal. 2016, 47, 593–601. [Google Scholar] [CrossRef]
  26. Herman, M.F.; Freed, K.F.; Yeager, D.L. Shake-up peak positions and intensities by many-body theory methods. Chem. Phys. 1978, 32, 437–449. [Google Scholar] [CrossRef]
  27. Cheng, Q.; Li, C.; Xu, L.; Li, J.; Zhai, M. Adsorption of Cr(Ⅵ) ions using the amphiphilic gels based on 2-(dimethylamino)ethyl methacrylate modified with 1-bromoalkanes. Chem. Eng. J. 2011, 173, 42–48. [Google Scholar] [CrossRef]
  28. Hou, S.; Su, S.; Kasner, M.L.; Shah, P.; Patel, K.; Madarang, C.J. Formation of highly stable dispersions of silane-functionalized reduced graphene oxide. Chem. Phys. Lett. 2010, 501, 68–74. [Google Scholar] [CrossRef]
  29. Zhang, M.; Gao, B.; Varnoosfaderani, S.; Hebard, A.; Yao, Y.; Inyang, M. Preparation and characterization of a novel magnetic biochar for arsenic removal. Bioresour. Technol. 2013, 130, 457–462. [Google Scholar] [CrossRef]
  30. Yamashita, T.; Hayes, P. Analysis of XPS spectra of Fe2+ and Fe3+ ions in oxide materials. Appl. Surf. Sci. 2008, 254, 2441–2449. [Google Scholar] [CrossRef]
  31. Wysokinski, A.; Kalembasa, S.; Kuziemska, B. The content of chromium and copper in plants and soil fertilized with sewage sludge with addition of various amounts of CaO and lignite ash. Soil Sci. Annu. 2016, 67, 117. [Google Scholar] [CrossRef]
  32. Wang, Y.; Xiao, X.; Xu, Y.; Chen, B. Environmental Effects of Silicon within Biochar (Sichar) and Carbon-Silicon Coupling Mechanisms: A Critical Review. Environ. Sci. Technol. 2019, 53, 13570–13582. [Google Scholar] [CrossRef] [PubMed]
  33. Van Quy, D.; Hieu, N.M.; Tra, P.T.; Nam, N.H.; Hai, N.H.; Son, N.T.; Nghia, P.T.; Van Anh, N.T.; Hong, T.T.; Luong, N.H. Synthesis of silica-coated magneticnanoparticles and application in the detection of pathogenic viruses. J. Nanomater. 2013, 2013, 603940. [Google Scholar]
  34. Liu, L.; Yang, X.; Ahmad, S.; Li, X.; Ri, C.; Tang, J.; Ellam, R.M.; Song, Z. Silicon (Si) modification of biochars from different Si-bearing precursors improves cadmium remediation. Chem. Eng. J. 2023, 457, 141194. [Google Scholar] [CrossRef]
  35. Zhang, S.; Yang, X.; Liu, L.; Ju, M.; Zheng, K. Adsorption behavior of selective recognition functionalized biochar to Cd(II) in wastewater. Materials 2018, 11, 299. [Google Scholar] [CrossRef]
  36. Hf, A.; Xm, B.; Sz, A.; Ju, M.; Zheng, K. Highly efficient removal of heavy metal ions by carboxymethyl cellulose-immobilized Fe3O4 nanoparticles prepared via high-gravity technology. Carbohydr. Polym. 2019, 213, 39–49. [Google Scholar]
  37. Solomons, T.W.G.; Fryhle, C. Organic Chemistry; Wiley: New York, NY, USA, 2001. [Google Scholar]
  38. Guo, N.; Lv, X.; Yang, Q.; Xu, X.; Song, H. Effective removal of hexavalent chromium from aqueous solution by ZnCl2 modified biochar: Effects and response sequence of the functional groups. J. Mol. Liq. 2021, 334, 116149. [Google Scholar] [CrossRef]
  39. Pan, R.; Bu, J.; Ren, G.; Zhang, Z.; Li, K.; Ding, A. Mechanism of removal of hexavalent chromium from aqueous solution by Fe-modified biochar and its application. Appl. Sci. 2022, 12, 1238. [Google Scholar] [CrossRef]
  40. Bashir, S.; Zhu, J.; Fu, Q.; Hu, H. Comparing the adsorption mechanism of Cd by rice straw pristine and KOH-modified biochar. Environ. Sci. Pollut. Res. 2018, 25, 11875–11883. [Google Scholar] [CrossRef]
Figure 1. Standard curve of the Cr(VI) solution.
Coatings 13 01884 g001
Figure 2. The effect of the acid and alkali salt concentrations on the adsorption of Cr(VI) by modified biochar (C0 = 50 mg/L, m = 0.1 g, V = 50 mL, pH = 2.0, T = 25 °C): (a) HCl; (b) NaOH; (c) FeCl3.
Coatings 13 01884 g002
Figure 3. Adsorption effect of MB on Cr(VI) prepared at different temperatures (C0 = 50 mg/L, m = 0.1 g, V = 50 mL, pH = 2.0, T = 25 °C).
Coatings 13 01884 g003
Figure 4. XRD spectrums of biochars.
Coatings 13 01884 g004
Figure 5. (a) Nitrogen adsorption–desorption curves and pore size distribution of MB. (b) Nitrogen adsorption–desorption curves and pore size distribution of HMB. (c) Nitrogen adsorption–desorption curves and pore size distribution of NaMB. (d) Nitrogen adsorption–desorption curves and pore size distribution of FeMB.
Coatings 13 01884 g005
Figure 6. Scanning electron of biochars: (a) MB, (b) HMB, (c) NaMB and (d) FeMB.
Coatings 13 01884 g006aCoatings 13 01884 g006b
Figure 7. EDS spectrum of FeMB.
Coatings 13 01884 g007
Figure 8. XPS spectrums of the biochars. (a) MB, NaMB, HMB, FeMB full spectrum. (b) MB, NaMB, HMB, FeMB C 1s spectrum. (c) FeMB Fe 2p spectrum.
Coatings 13 01884 g008
Figure 9. FTIR spectra of the biochars.
Coatings 13 01884 g009
Figure 10. Effect of the initial concentration on Cr(VI) adsorption by the biochars (m = 0.1 g, V = 50 mL, pH = 2.0, T = 25 °C).
Coatings 13 01884 g010
Figure 11. (a,b) Effect of Cr(VI) dosage on adsorption by the biochars (C0 = 50 mg/L, V = 50 mL, pH = 2.0, T = 25 °C).
Coatings 13 01884 g011
Figure 12. (a,b) Effect of pH on Cr(VI) adsorption of biochars (C0 = 50 mg/L, m = 0.1 g, V = 50 mL, T = 25 °C).
Coatings 13 01884 g012
Figure 13. Kinetics curves of biochars adsorbing Cr(VI).
Coatings 13 01884 g013
Figure 14. Particle diffusion fitting curves of biochars adsorbing Cr(VI).
Coatings 13 01884 g014
Figure 15. Isothermal adsorption curves of biochars adsorbing Cr(VI).
Coatings 13 01884 g015
Figure 16. Elution profile of Cr(VI) adsorption on the biochars.
Coatings 13 01884 g016
Figure 17. (ad) XPS spectrums of Cr(VI) adsorbed by the biochars.
Coatings 13 01884 g017aCoatings 13 01884 g017b
Figure 18. FTIR spectra of Cr(VI) adsorbed by FeMB.
Coatings 13 01884 g018
Table 1. Different adsorbents and their performance characteristics.
AdsorbentPerformance Characteristics
BiocharDeveloped pore structure, Simple process, Renewable recycling use
KieselguhrNon-toxic, Chemically stable, Water absorption, Strong permeability
BentonitePorous structure, Adsorptive, Expansibility
Silica gelHigh activity, Non-toxic, Chemically stable
CelluloseFirmness, Biodegradable, Mechanicalness, Thermal stability
Graphene oxideRich functional groups, Hydrophilicity
Table 2. Parameters of the specific surface area and pore structure of biochars.
SampleBET Surface Area (m2·g−1)Vmicropore
(cm3·g−1)
Vmesoporous
(cm3·g−1)
Average Pore Size
(nm)
MB1215.620.250.692.27
HMB1505.920.460.6592.14
NaMB1716.760.480.592.13
FeMB600.36 0.210.523.82
Table 3. Quasi-first-order and quasi-second-order kinetic fitting parameters of Cr(VI) adsorption by the biochars.
BiocharQe/
(mg·g−1)
Quasi First Order DynamicsQuasi Second Order Dynamics
Qt/
(mg·g−1)
k1/
min−1
R2Qt/
(mg·g−1)
k1/
(g·mg−1·min−1)
R2
MB14.3913.480.0510.9514.230.00600.99
HMB11.9210.120.0380.9010.880.00440.93
NaMB22.3617.510.0190.8419.320.00140.92
FeMB23.4021.710.0240.9623.500.00160.99
Table 4. Particle diffusion kinetic fitting parameters of Cr(VI) adsorption by the biochars.
BiocharRd12kid1/
(mg∙g−1∙h−0.5)
C′1
(mg·g−1)
Rd22kid2/
(mg∙g−1∙h−0.5)
C′2
(mg·g−1)
MB0.960.546.360.930.04612.90
HMB0.700.433.810.940.0977.81
NaMB0.970.893.830.990.30010.38
FeMB0.971.244.810.8890.06321.09
Table 5. Isotherm model parameters of Cr(VI) adsorption by the biochars.
BiocharLangmuir ModelFreundlich Model
Qm/
(mg·g−1)
KL/
(L·mg−1)
RLR2Chi SquareKF/
(L·mg−1)
1 n R2Chi Square
MB20.710.0360.21–0.870.970.502.820.38 0.881.85
HMB17.290.0460.18–0.69 0.930.922.680.37 0.812.37
NaMB49.520.0130.47–0.900.990.911.670.620.962.90
FeMB51.940.0140.45–0.890.991.141.840.62 0.963.55
Disclaimer/Publisher’s Note: The statements, opinions and data contained in all publications are solely those of the individual author(s) and contributor(s) and not of MDPI and/or the editor(s). MDPI and/or the editor(s) disclaim responsibility for any injury to people or property resulting from any ideas, methods, instructions or products referred to in the content.

