Article

Phase Transformations of Iron Nitrides during Annealing in Nitrogen and Hydrogen Atmosphere

by
Tadeusz Frączek
1,
Jerzy Michalski
2,*,†,
Agata Dudek
1,*,
Magdalena Kowalewska-Groszkowska
3 and
Justyna Owczarek
1
1
Faculty of Production Engineering and Materials Technology, Częstochowa University of Technology, Al. Armii Krajowej 19, 42-201 Częstochowa, Poland
2
Institute of Precision Mechanics, Duchnicka 3, 01-796 Warszawa, Poland
3
Museum and Institute of Zoology of the Polish Academy of Sciences, Palmiry, ul. Wiśniowa 22, 05-152 Czosnów, Poland
*
Authors to whom correspondence should be addressed.
Retired.
Coatings 2023, 13(11), 1882; https://doi.org/10.3390/coatings13111882
Submission received: 13 September 2023 / Revised: 29 October 2023 / Accepted: 30 October 2023 / Published: 1 November 2023

Abstract

:
The aim of the research discussed in the manuscript was to check the availability of control of nitrogen decomposition processes on nitrided AISI 52100 and AISI 1010 steels during annealing at 520 °C in N2 and at 600 °C in H2. The tests have shown that when annealing AISI 1010 steel at a temperature of 520 °C in N2 under a pressure of 200 Pa for 2 h, an ε γ’ + N2 phase transformation occurs. Over the next 3 h, the ε phase disappears and the γ’ phase gradually transforms into Feα(N). When annealing AISI 52100 steel, the denitrification process is faster; after 2 h there is a complete transformation of ε γ’ + N2, and in the next 3 h, there is a complete transformation of γ’-Feα(N). During annealing in H2 at a temperature of 600 °C, the denitrification processes are most intense; the complete transformation of γ’ Feα(N) + N2 occurs after 45 min of the process. When annealing nitrided AISI 1010 steel in nitrogen at atmospheric pressure, phase transformation (ε γ’ + N2) and weight loss of the sample are observed only in the first 20 min of the process, then the sample weight increases. This was the result of the formation of iron oxide, which also inhibited the denitrification process of the iron nitride layer.

1. Introduction

Iron nitrides play an important role in metallurgy, especially in the nitriding of iron and its alloys; these processes can significantly improve the tribological properties, fatigue limits, and corrosion resistance of nitrided elements [1,2]. In the process of gaseous nitriding, the nitrogen potential of the nitriding atmosphere can be regulated by changing the gaseous atmosphere composition, i.e., the proportions of ammonia and hydrogen or dissociated ammonia. Iron nitride layers with varied phase compositions are found in the vast majority of nitrided steels, and the phase transformations of iron nitrides are an important element of the gas nitriding process [3,4,5].
An important issue related to the phases of iron nitrides is their durability at elevated temperatures in inert or reactive gases. During annealing of previously nitrided iron and its alloys, the processes of phase transformation or decomposition of the iron nitrides forming the surface layer may take place. The thermal stability of the phase composition of iron nitrides depends on their form and size (thin layers, films, micro-powders, nano-powders, etc.) [6] and external conditions, the gas atmosphere composition during annealing, and the total and partial pressure of the gas atmosphere components in terms of their activity. Among others, oxygen makes it difficult to denitrify iron nitrides [7]. The results of theoretical and experimental works most often concern the phase transformations of iron nitrides with their magnetic properties [8,9,10].
The durability of iron nitrides and phase transformations in ammonia and hydrogen atmospheres has been systematically studied for many years. The first such research was conducted by Lehrer, who nitrated iron powder in a stream of a flowing mixture of ammonia and hydrogen [11]. Moszyńska et al. and Arabczyk et al. demonstrated that during nitriding, phase transformations in the iron nitride layer can be induced by changing the value of the nitrogen potential [12,13].
Under normal conditions, iron nitrides are unstable and should decompose, releasing gaseous nitrogen [14], and the loss of nitrogen to the atmosphere is irreversible. According to Du et al. [15], the equilibrium pressure of gaseous nitrogen for Fe4N nitride is approximately 1500 atmospheres. However, it should be emphasized that the nitrogen removal rate from the crystal lattice depends on the diffusion of nitrogen atoms to the surface, the formation of gaseous nitrogen, and the subsequent desorption of gas molecules from the surface. The high activation energy of the N + N N2 reaction hinders denitrification; therefore, iron nitrides are stable up to approximately 420 °C. The metastability of the nitride phases of the Fe-N system is analogous to the metastability of cementite (Fe3C) in relation to iron and graphite in the iron–carbon (Fe-C) equilibrium system [1].
Iron nitrides belong to an important group of magnetic materials. The iron nitride γ′-Fe4N meets the requirements for soft magnetic materials very well and, at the same time, is resistant to corrosion. The magnetization saturation of γ′-Fe4N is slightly lower (about 4%) than that of α-Fe, and its coercion is negligibly small [16,17].
Among the iron nitrides, the largest range of homogeneity in the Fe-N system is shown by the ε phase with a variable ratio of Fe:N Fe2-3N [18]. Depending on the nitrogen concentration, ε nitride may have ferromagnetic ε-FexN (2 < x < 3) or paramagnetic (Fe2N) properties [19]. Compared to α″-Fe16N2 nitride, ε-Fe3N nitride has much better thermal stability coercion and slightly worse magnetic properties [20].
Obtaining iron nitride layers of the assumed composition in the nitriding process requires constant control of the nitrogen potential. It is much more convenient to create a layer of iron nitrides with a dominant share of the ε phase and then shape its required phase composition of the layer in the process of controlled annealing.
Controlled decomposition of the ε phase can be used to produce a monophase γ′ layer, which has more plastic than the ε phase. Obtaining a monophase γ′ layer in a standard nitriding process requires maintaining the value of the nitrogen potential within the stability of the γ′ phase, and the process time is almost twice as long as the method discussed in the article. As mentioned, the γ′ phase meets the requirements for soft magnetic materials well.
After the decomposition process of the ε phase, a γ′ phase is formed with significant porosity. This layer, after impregnation with corrosion inhibitors, perfectly protects the steel substrate against corrosion. These layers can replace impregnated, brittle layers with a dominant share of the ε phase.
The registration of changes in the sample mass during annealing enables continuous control of the degree of denitrification of the iron nitrides forming the layer. For this reason, the use of a thermobalance in these processes is justified in the long run.
There are no reports in the available literature regarding studies of phase transformations in nitrided layers nor the use of a thermobalance in these studies.
The research conducted was aimed at examining the possibility of controlling iron nitride decomposition processes on AISI 52100 and AISI 1010 steels during annealing at 520 and 600 °C in nitrogen and hydrogen.

2. Materials and Methods

2.1. Nitriding and Annealing Materials and Procedures

The tests were conducted on previously nitrided AISI 1010 steel and AISI 52100 steel formed into the shape of a sphere. The chemical composition of the steel and the sample dimensions are compiled in Table 1.
Before annealing, the samples were nitrided in a single-stage process at 570 °C or in a two-stage process at 580 °C in the first stage and 600 °C in the second stage. Some of the samples were subjected to metallographic research after nitriding, and the remaining part was annealed. In the first series of tests, the nitrided samples were annealed at a temperature of 520 °C for 2 and 5 h in a nitrogen atmosphere at 200 Pa. The samples were weighed before and after the annealing process. In the second series, the iron nitride annealing processes were conducted in a differential tubular reactor. The reactor was equipped with a measuring system that recorded the sample weight changes and temperatures [12]. The parameters of the nitriding and annealing processes are given in Table 2.

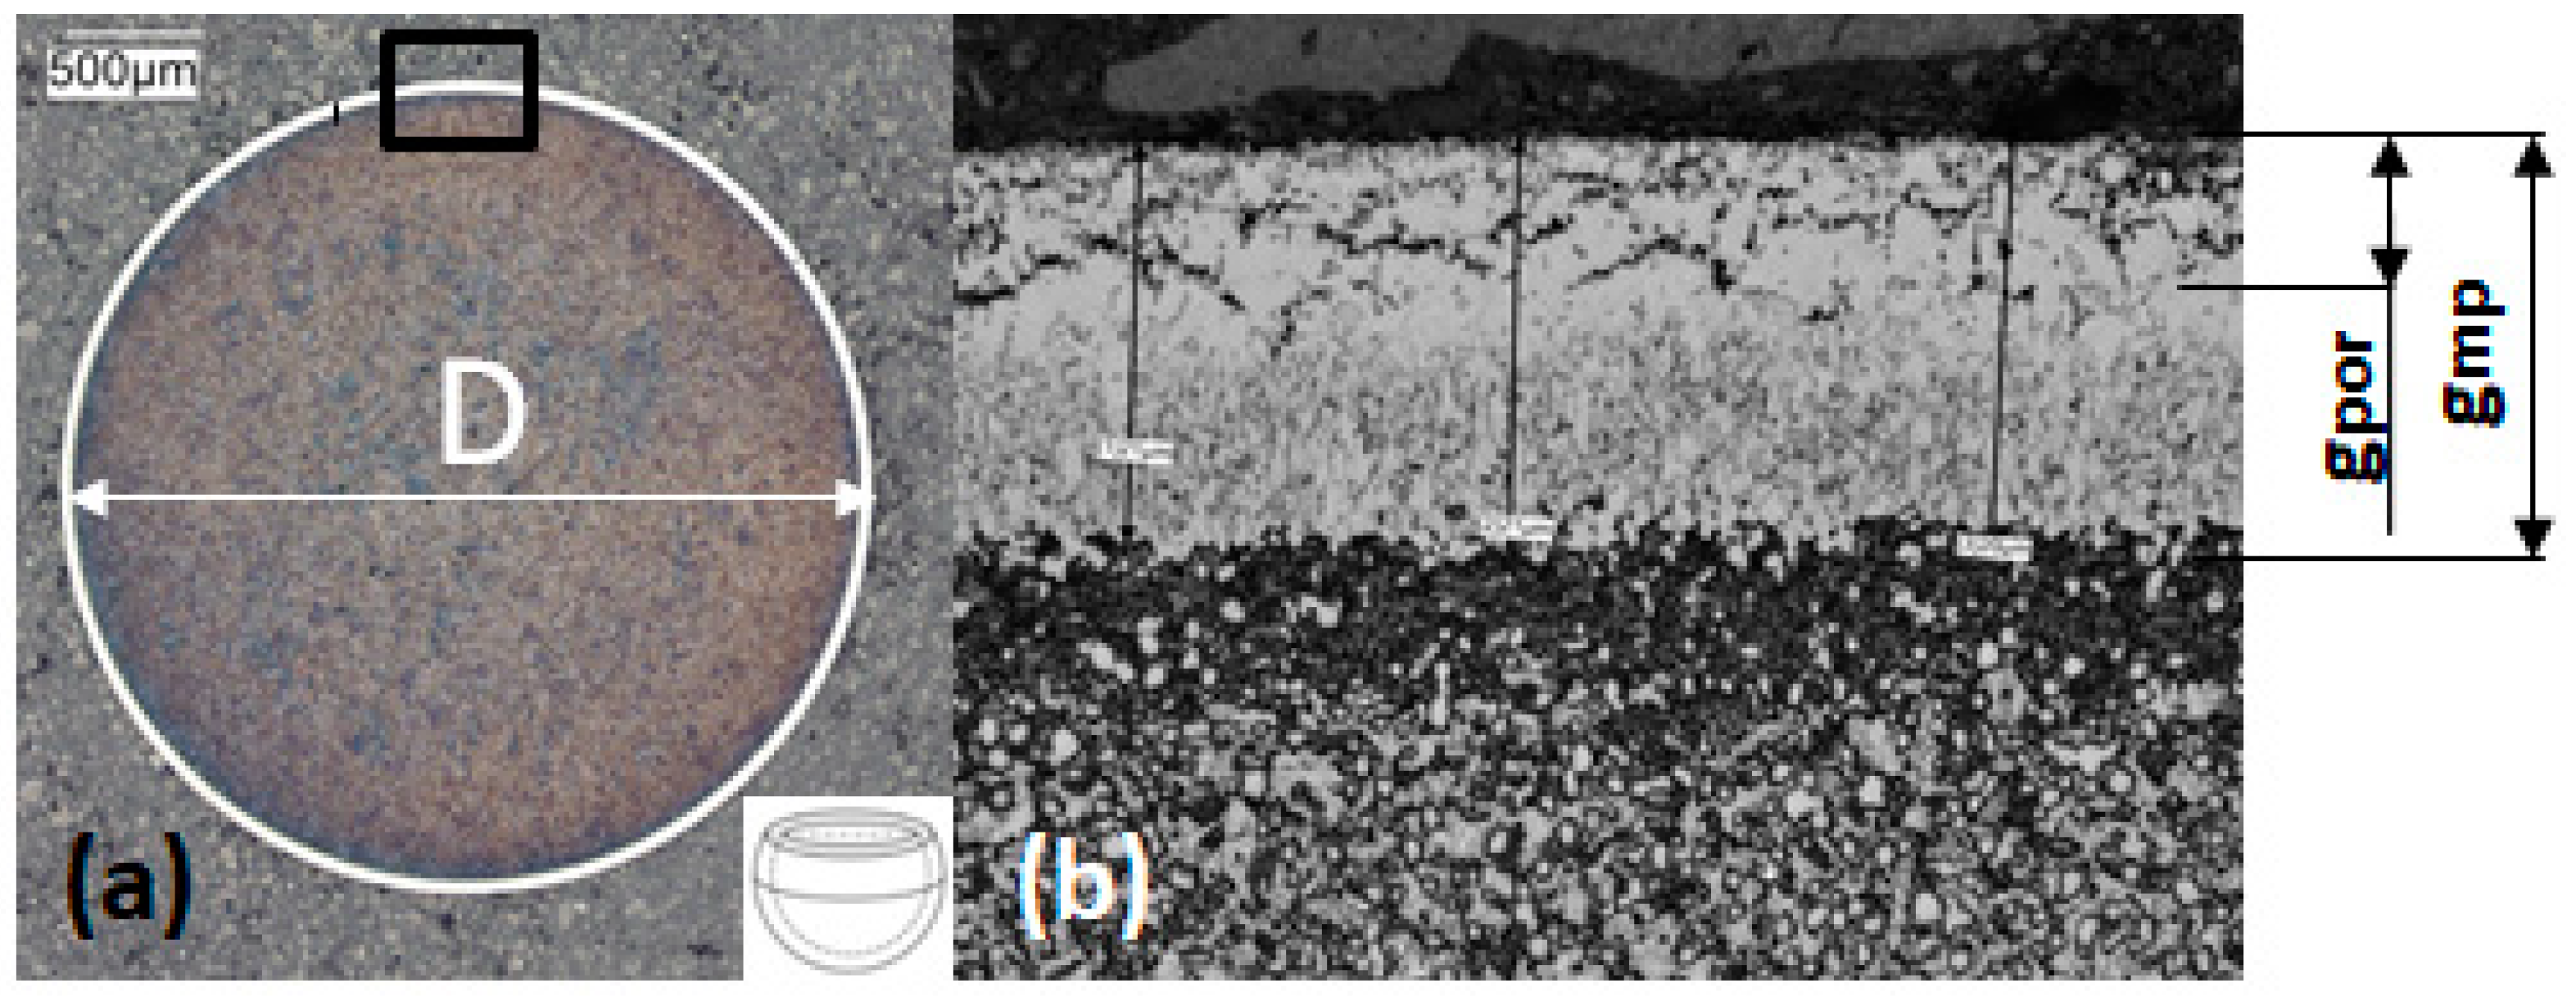
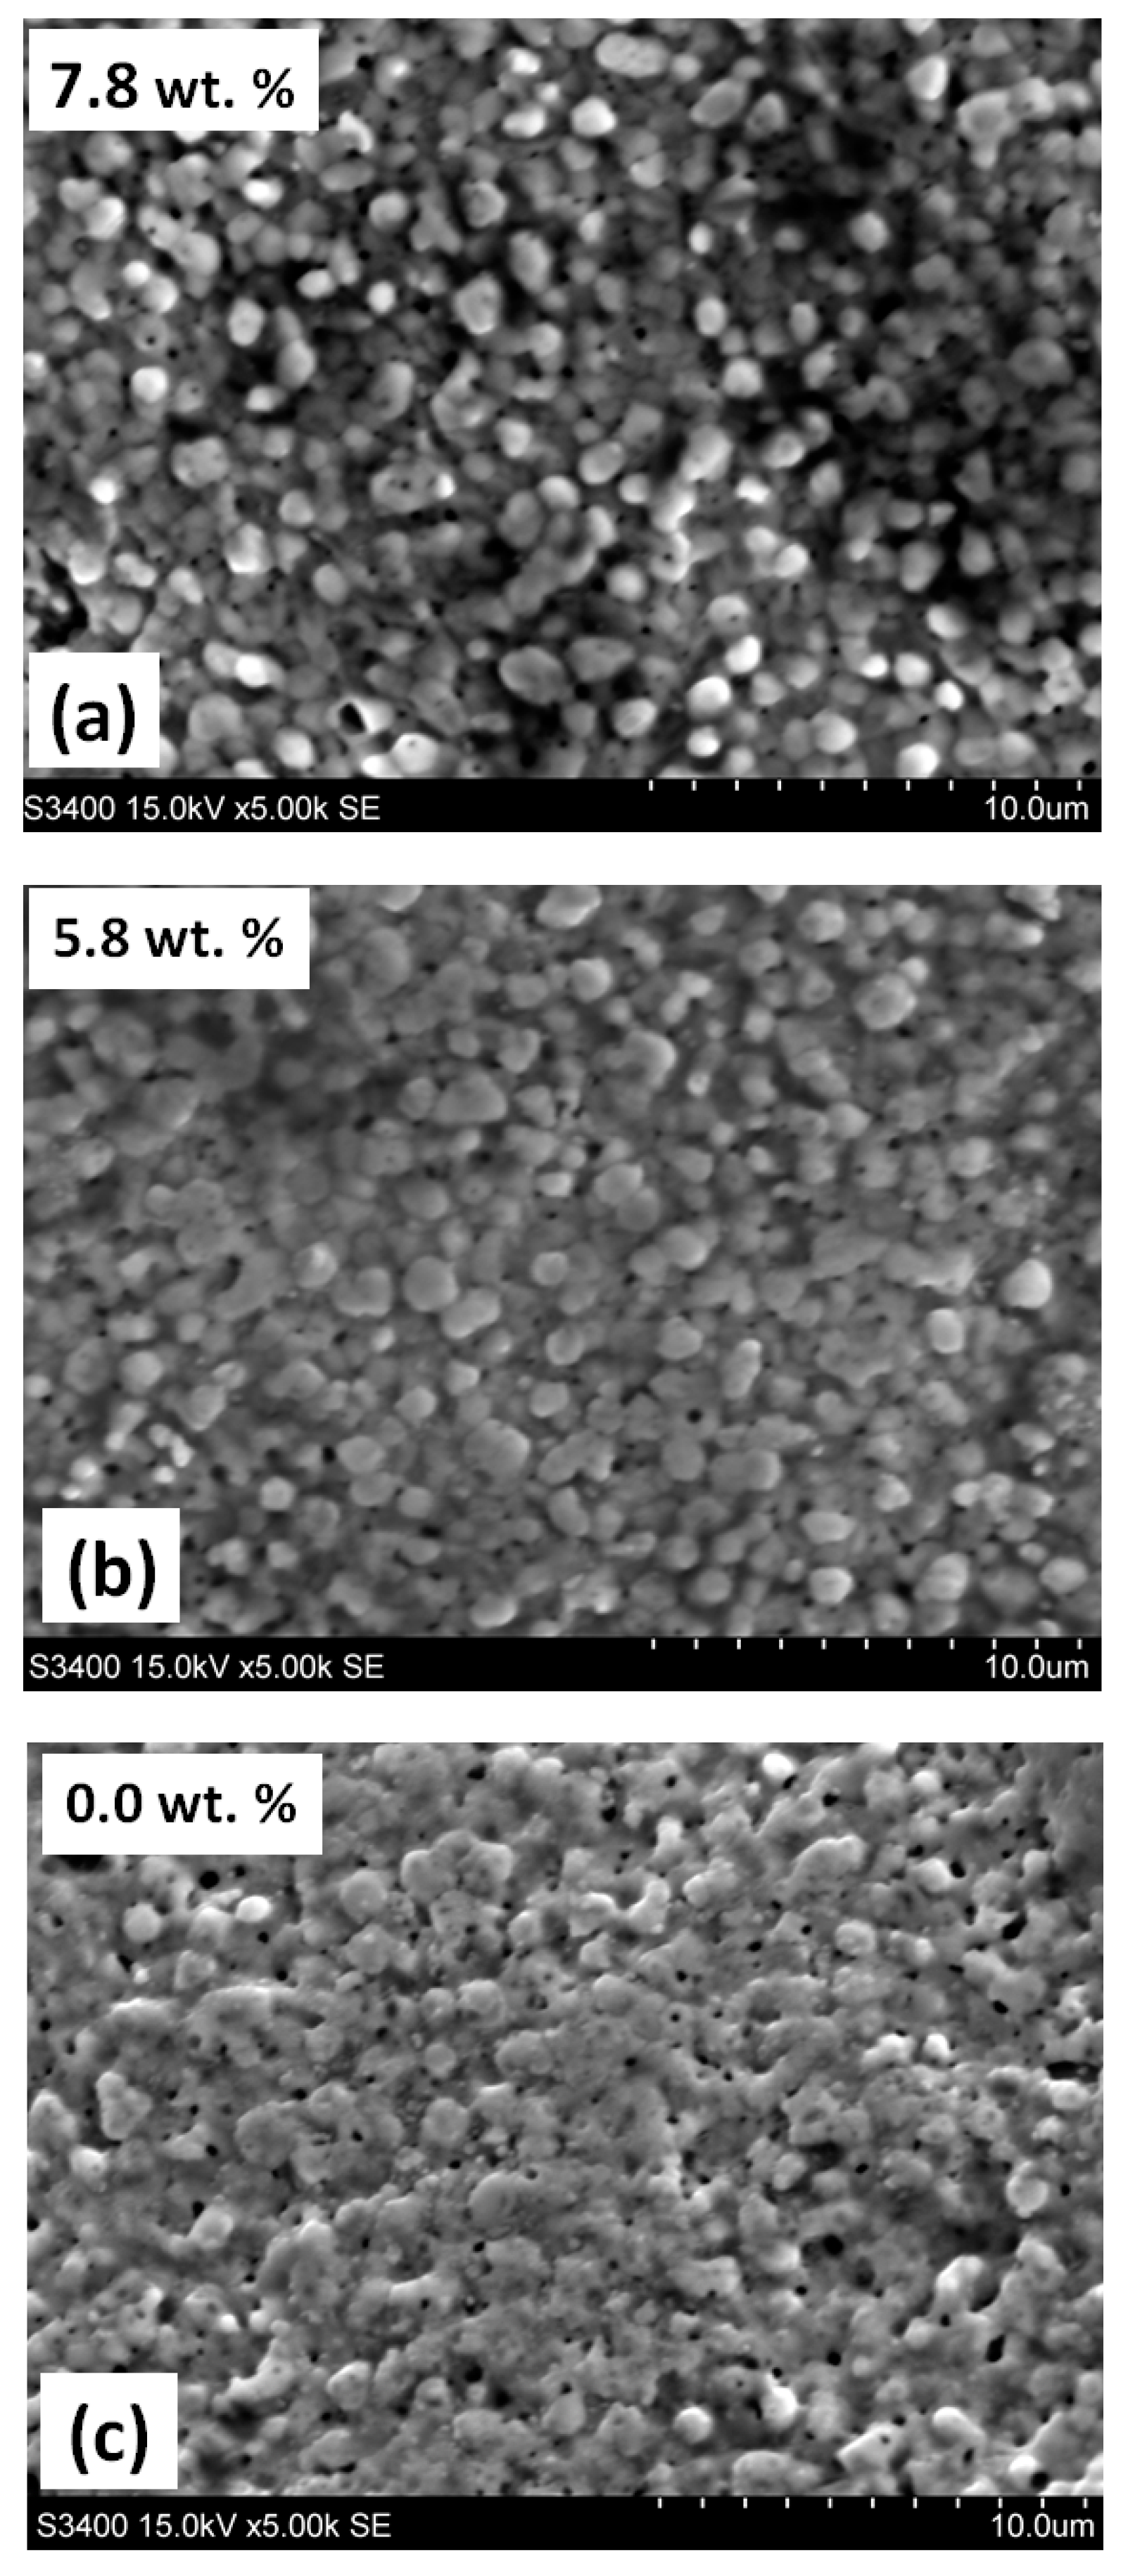
2.2. Metallographic Research

The metallographic cross-sections were made by grinding the spheres to their diameter, which made it possible to measure the actual thickness of the iron nitride layer.
Figure 1 shows the metallographic cross-section of a sphere sample in its diameter and microstructure of AISI 52100 steel with a layer of iron nitrides.
The ball diameter and thicknesses of the nitride layer and porous zone observed after nitriding and annealing are given in Table 3.

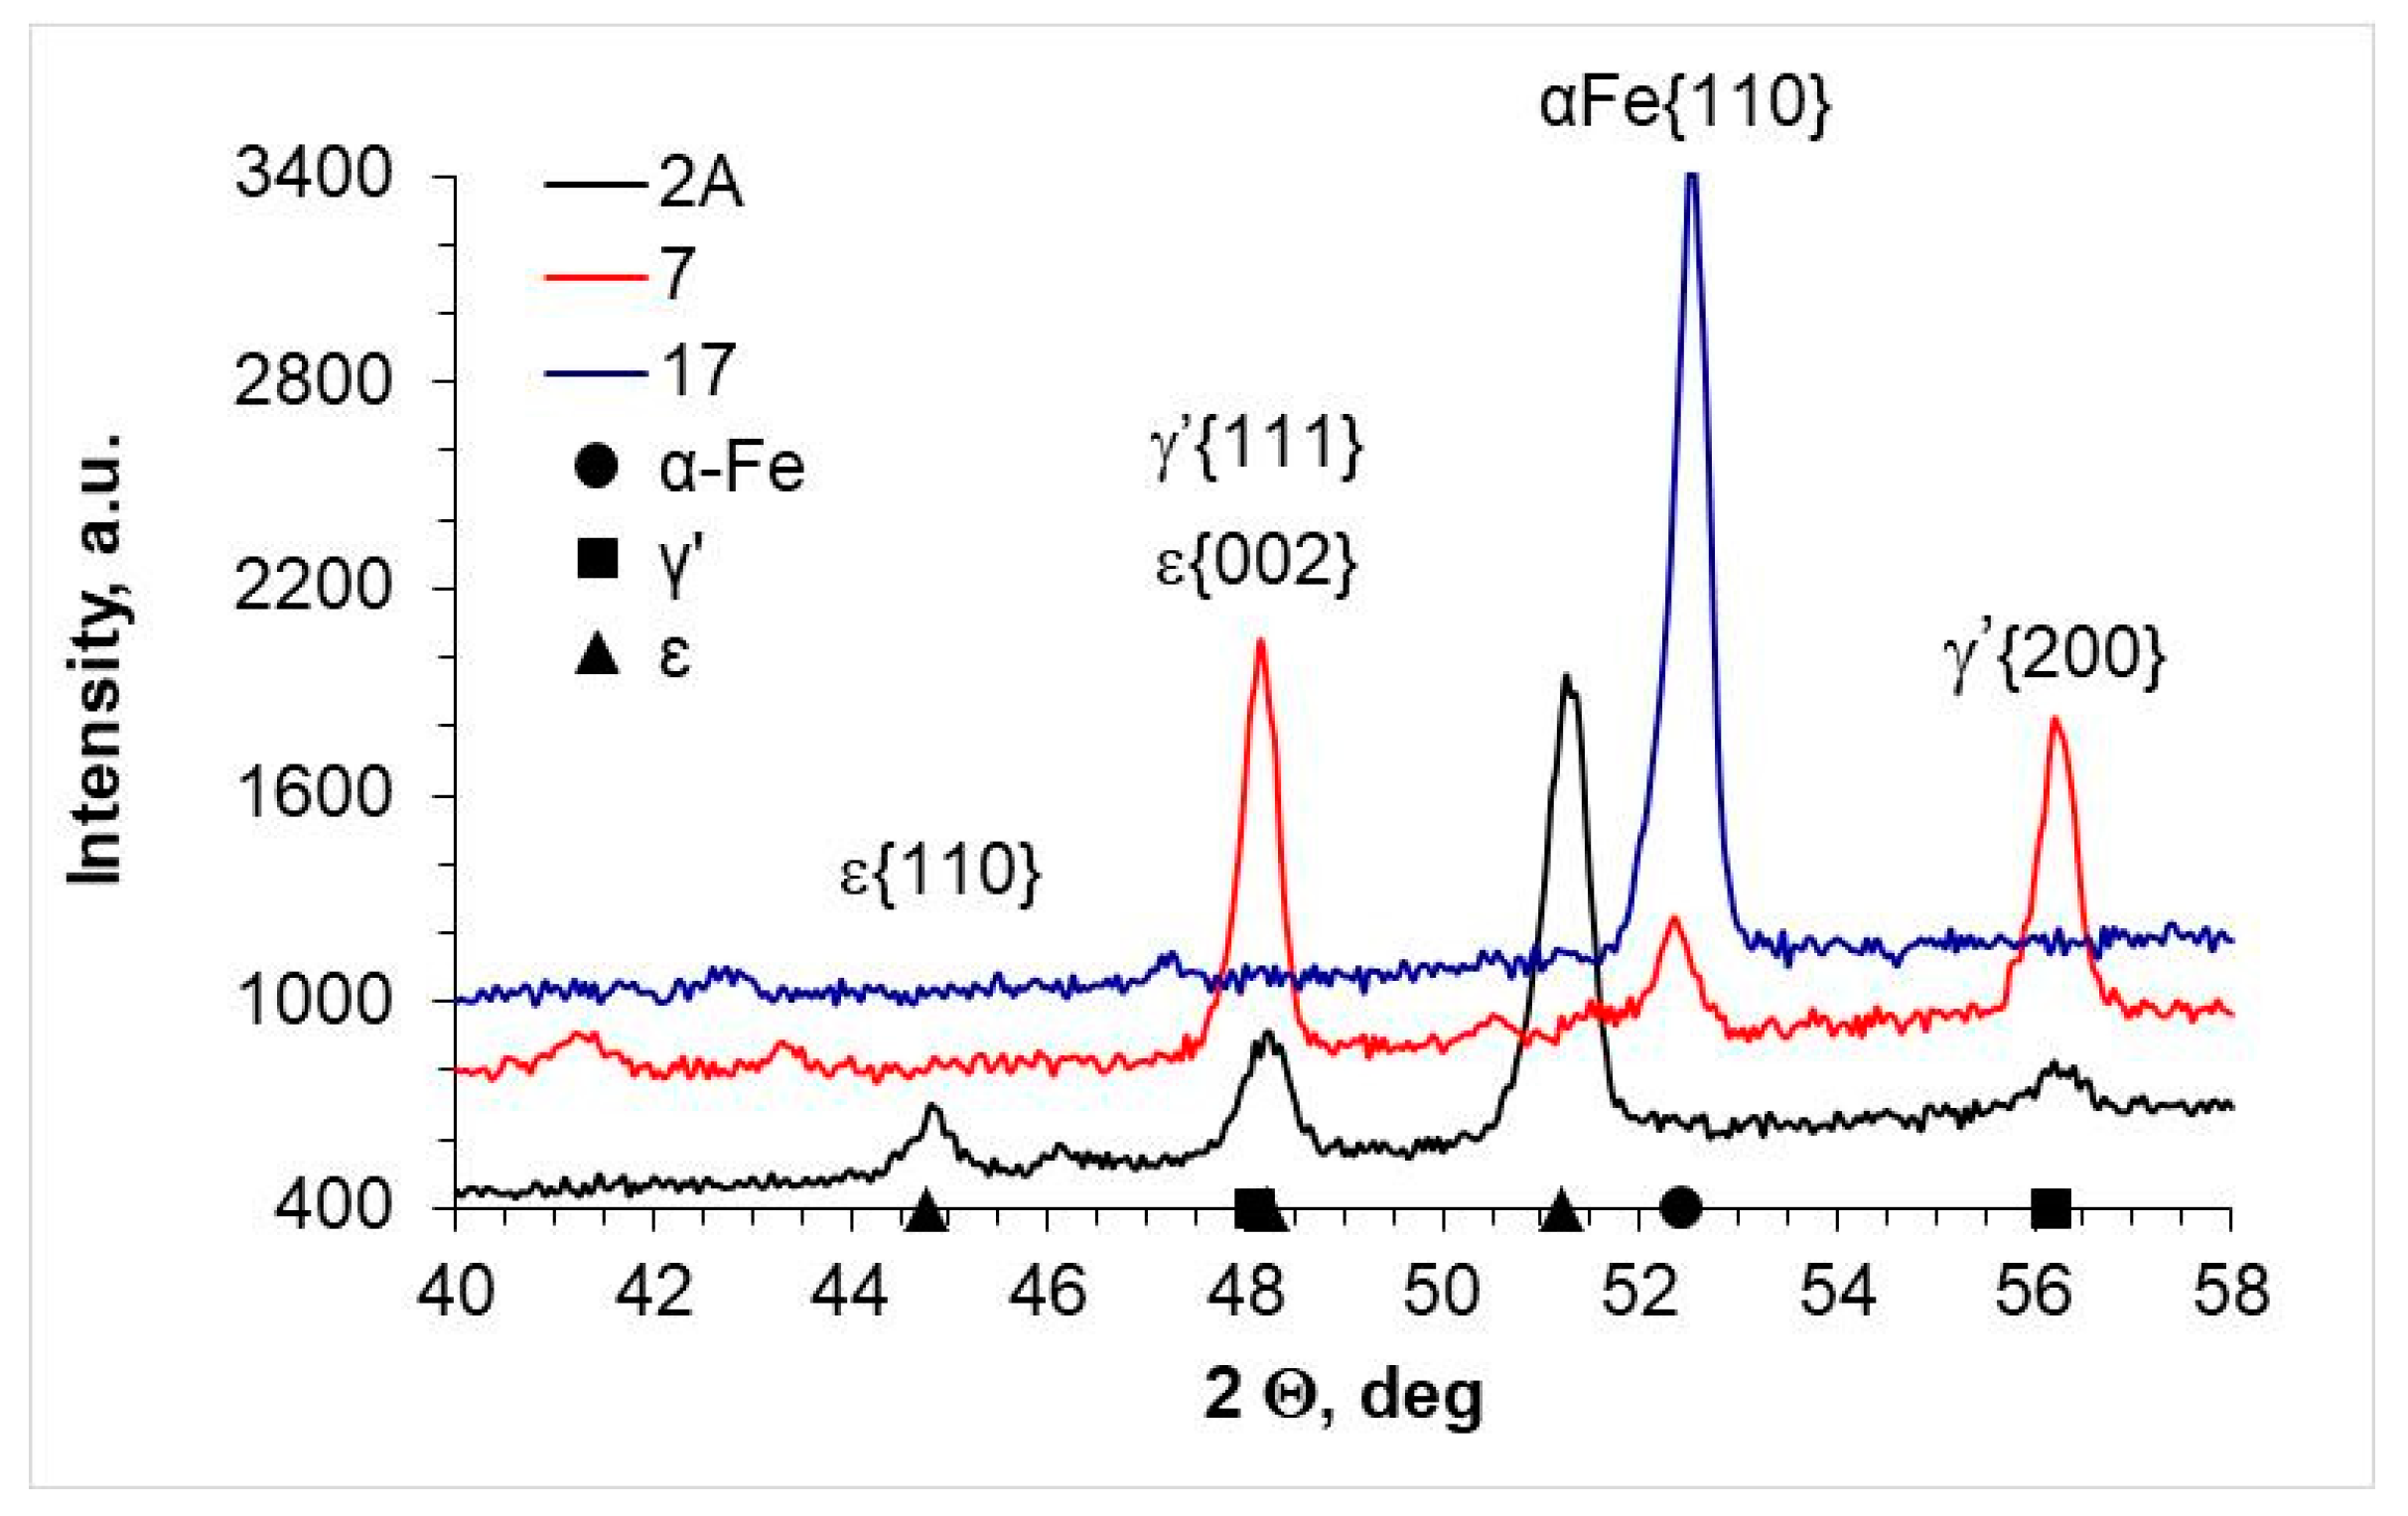
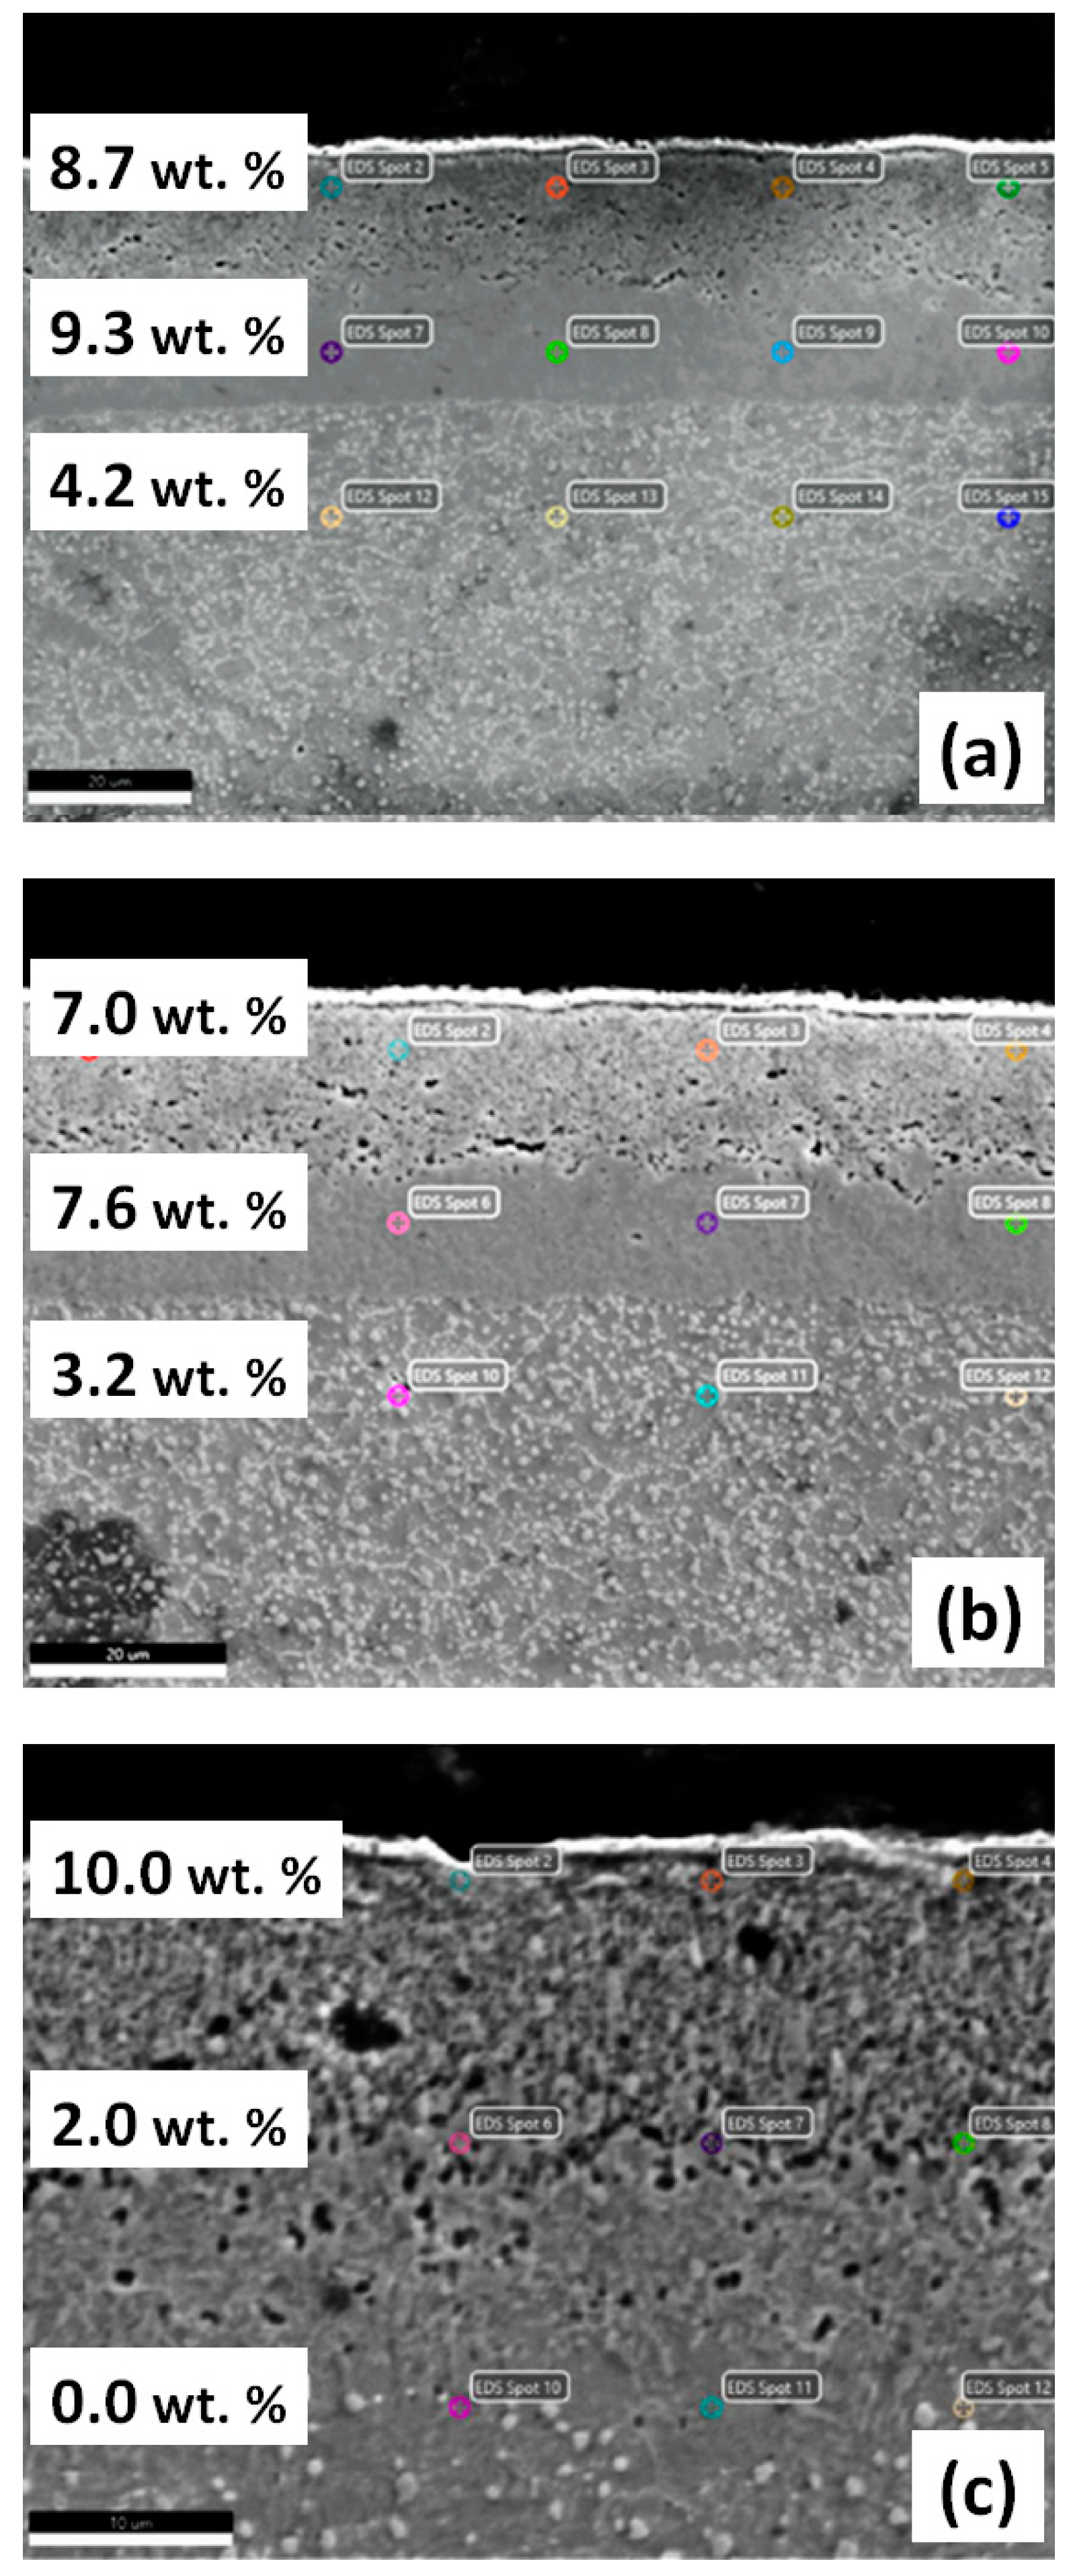
2.3. X-ray Phase Analysis and Chemical Composition Research

The phase composition of the iron nitride layer on the spheres was determined by X-ray diffraction using the Seifert 3003TT X-ray diffractometer, applying KαCo radiation and symmetrical measurement geometry.
Studies of the nitride morphology and distribution in the cross-section of materials were conducted using a scanning electron microscope by Hitachi S-3400N. The acceleration voltage during performed tests was 15 keV. The depth of penetration of electrons depends i.a. from their energy. Beam penetration depth into the materials at 15 KV is about 1 µm. The chemical composition was tested using a scanning electron microscope equipped with an EDS X-ray analyzer by AMETEK GmbH. Qualitative and quantitative analyses were performed using the EDS Element X-ray energy spectrometer and analyzed by APEX™ software using the eZAF correction method. The EDS detector used to test the chemical composition enables the detection of minimum elements from beryllium (Be) and has a minimum resolution of 129 eV for the Mn (Kα) line. The EDS detector window is made of silicon nitride—Si3N4, with a thickness of less than 100 nm—thanks to which it is characterized by increased sensitivity for detecting light elements.

3. Results

3.1. Annealing in a Nitrogen Atmosphere at 200 Pa

The surface appearance of nitrided AISI 52100 steel is illustrated in Figure 1, nitrided (Figure 2a) and annealed at 520 °C for 2 h (Figure 2b) and 5 h (Figure 2c). The photographs show the average nitrogen concentration on the surface of the iron nitride layer. The concentration of nitrogen on the surface of the iron nitride layer (Figure 2a) indicates that the dominant phase is the ε phase, while after annealing for 2 h, it is the γ′ phase. No nitrogen was found on the surface of the nitrided steel after annealing for 5 h, which indicates its complete denitrification of the iron nitride layer. It should also be noted that the surface porosity increased as a result of denitrification.
Figure 3 shows the diffractograms of the nitrided surface of AISI 52100 steel (Figure 3—“2A”), nitrided and annealed at a temperature of 520 °C for 2 h (Figure 3—“7”) and 5 h (Figure 3—“17”). The iron nitride layer obtained by nitriding is a mixture of the ε and γ′ phases, with the predominant phase being the ε phase, as evidenced by the high peak intensity ε (111) and the low peak intensity from γ′ (111).
The results of the X-ray structural examination including the phase composition of the nitriding layer (WL) are shown in Table 4.
During the 2 h of annealing, the phase ε gradually passes into phase γ′; this transformation is accompanied by nitrogen emission into the atmosphere (ε γ′ + N2), resulting in a loss of sample mass of 0.9 g/m2. On the diffractogram, a reflection from the Feα{110} substrate was observed, which indicates that after a complete reduction of the ε phase to γ′, the reduction of γ′ to iron with emissions of nitrogen to the atmosphere begins. After 5 h of annealing, a loss of mass of 1.6 g/m2 was observed. After this time, the γ′ phase was completely decomposed; as a result, the nitrided layer was deprived of the near-surface layer of iron nitrides.
Figure 4 illustrates the microstructure of the nitrided layer (Figure 4a), after the nitriding subjected to annealing at a temperature of 520 °C for 2 h (Figure 4b) and 5 h (Figure 4c). Prior to annealing, the predominant phase in the iron nitride layer was the ε phase. Considering the concentration of nitrogen in the iron nitride layer, it can be concluded that this layer can be a mixture of ε and γ′ phases.
After 2 h of annealing, due to nitrogen emission into the atmosphere, the ε phase was transformed into the γ′ phase ε + γ′ + N2, and as a consequence, the ε + γ′ layer transformed into a monophasic γ′ layer. The nitrogen concentration under the nitride layer underwent a slight change compared to the concentration in the sample after nitriding.
After 5 h of annealing, the iron nitrides forming the near-surface layer were thermally reduced to iron. There is visible porosity in the microstructure of steel in the iron nitride layer area and the border between the nitride layers. Additionally, the substrate was not visible. The area under the iron nitride layer was also denitrified (Figure 3c). After annealing for 5 h, oxygen was present in the porous area of the sample from 10% wt. at the surface to 2% wt. at the substrate.
Figure 5 shows the surface appearance of AISI 1010 steel nitrided (Figure 5a) and then annealed at a temperature of 520 °C for 2 h (Figure 5b) and 5 h (Figure 5c). The images show the average nitrogen concentration on the surface of the iron nitride layer. The nitrogen content on the surface of the nitrided layer (Figure 5a) indicates that the dominant phase is ε, while after annealing for 2 h and 5 h, the dominant phase is γ′. After 2 h of annealing, the iron nitride mass loss was 2.2 g/m2, and after 5 h, it was 3.5 g/m2. Despite the nitrogen emission from the iron nitride layer into the atmosphere during annealing, there is no significant difference observed in the appearance of the steel surface after nitriding and after annealing.
Figure 6 presents compiled diffractograms from the nitrided surface of AISI 1010 steel (Figure 6—“1A”), nitrided and annealed at a temperature of 520 °C, for 2 h (Figure 6—“6”) and 5 h (Figure 6—“16”). The iron nitride layer obtained by nitriding is a mixture of the ε and γ′ phases, with the predominant phase being the ε phase, as evidenced by the high peak intensity ε(111) and the low peak intensity of γ′(111). After 2 h of annealing, the ε phase underwent reduction to the γ′ phase (Figure 6—“6”), and after 5 h of reduction to iron, the γ′ phase is formed.
The results of the X-ray structural examination, including the phase composition of the nitriding layer (WL), are shown in Table 5.
Figure 7 illustrates the microstructure of the nitrided layer of AISI 1010 steel (Figure 7a), nitrided and annealed at 520 °C, for a duration of 2 h (Figure 7b) and 5 h (Figure 7c). In the iron nitride layer before annealing, the dominant phase was the ε phase, and its content decreased from the surface to the substrate. Taking into account the concentration of nitrogen in the zone near the surface of the iron nitride layer, the layer has the structure of ε + (ε + γ′). The nitrogen concentration in the area of the middle layer of iron nitrides indicates that the predominant phase is ε and that the layer in these areas can be a mixture of phases ε and γ′. In the zone next to the substrate, the dominant phase is the γ′ phase.

3.2. Annealing in Nitrogen and Hydrogen at Atmospheric Pressure with Recording of Sample Mass Change

Figure 8 illustrates a change in the mass of nitrided AISI 1010 steel samples annealed at a temperature of 520 °C in a nitrogen atmosphere at atmospheric pressure conditions (Figure 8a—“m_exp.”) and a diffractogram from the steel surface after nitriding (Figure 7b—“2A”) and annealing (Figure 8b—“37N”). Figure 8a also shows the course of temperature changes during the annealing process.
The results of the X-ray structural examination, including the phase composition of the nitriding layer (WL), are shown in Table 6.
During the annealing of AISI 1010 steel samples in nitrogen, at up to 20 min into the process, a loss in sample mass of 2.6 g/m2 was recorded. After 20 min of annealing, an increase in mass to 4.8 g/m2 was recorded. On the diffractogram of sample surfaces annealed in nitrogen, the characteristic lines from the γ′ phase {200} and the characteristic line from the iron oxide Fe2O3 were identified (Table 4). The occurrence of the characteristic line from the γ′ phase proves that in the initial stage of annealing, until the formation of a layer of iron oxides, part of the ε phase was decomposed. This process was accompanied by nitrogen emissions—hence the loss of mass. At a further stage of the process, the formation of iron oxides inhibited the decomposition of the ε phase and, as a result of oxidation during annealing, an increase in the sample mass was recorded.
Figure 9 shows the appearance of the surface of AISI 1010 steel after nitriding (Figure 9a) and after nitriding and annealing at a temperature of 520 °C in a nitrogen atmosphere (Figure 9b).
Figure 10 shows the microstructure of the nitrided layer (Figure 10a), nitrided and annealed at a temperature of 520 °C, for 2 h (Figure 10b). In the layer of iron nitrides prior to annealing, the ε phase was the dominant one. The concentration of nitrogen in the layer of iron nitrides was confirmed by the results of X-ray tests, which indicated that the layer of iron nitrides may be a mixture of phases ε and γ′. After annealing in a nitrogen atmosphere and in atmospheric pressure conditions, no significant change in the concentration of nitrogen occurred in the layer of iron nitrides. The result is confirmed by literature reports; iron oxide on the surface of iron nitrides inhibits the reduction of iron nitrides during annealing [2].
Figure 11 presents the change in the mass of the nitrided AISI 1010 steel samples annealed at a temperature of 600 °C in a hydrogen atmosphere in atmospheric pressure conditions (Figure 11a—“m_exp.”), the mass change rate (Figure 11a—“dm/dt”) (a), and a diffractogram of the steel surface after nitriding (Figure 11b—“33A”) and after annealing in hydrogen (Figure 11b—“35H”).
After 45 min of annealing, the monophasic iron nitride layer underwent reduction to iron (Figure 10b—“35H”), and the reduction process was accompanied by nitrogen emissions (γ′ Feα + N2). The loss of mass due to the nitrogen emissions amounted to 21.8 g/m2 (Figure 10a—“m_exp.”).
Figure 12 shows the appearance of the surface of AISI 1010 steel after nitriding (Figure 12a) and after nitriding and annealing at a temperature of 520 °C in a hydrogen atmosphere for 45 min (Figure 12b). The photographs show the average concentration of nitrogen on the surface of the iron nitride layer. No nitrogen was found on the surface of the nitrided steel after annealing for 45 min, which proves complete denitrification of the iron nitride layer. The surface porosity also increased as a result of denitrification.
Figure 13 presents the microstructure of nitrided AISI 1010 steel with a monophasic layer of iron nitrides (Figure 13a), nitrided and annealed at a temperature of 600 °C for 45 min in a hydrogen atmosphere (Figure 13b). As a result of the reaction of Fe4N + 1.5H2  4Feα + NH3, during the annealing of previously nitrided samples in hydrogen, due to the nitrogen emissions to the atmosphere, there was a significant decrease in the concentration of nitrogen in the layer, which indicates a chemical reduction of iron nitrides in the annealing temperature.

4. Discussion of Results

Our studies have shown that iron nitride layers in a nitrogen atmosphere at a pressure of 200 Pa dissociate at a temperature of 520 °C. The process of the dissociation of nitrides proceeds gradually; the ε phase dissociates first and then the γ′ phase. The dissociation process during the annealing of nitrided AISI 52100 steel can be written as ε γ′ + N2 and then γ′ αFe + N2. After the complete dissociation of γ′, a porous αFe zone remains in the place where the layer of iron nitrides used to be (Figure 3—“17”, Figure 4c). The porosity of the iron nitride layer increases as the dissociation of the iron nitrides progresses (Figure 4). Unlike AISI 52100 steel, the iron nitride layer on AISI 1010 steel did not dissociate completely. Since only the ε phase dissociated completely, the monophasic γ′ layer remained after the annealing process (Figure 5—“16”). The porosity of the annealed layer increased compared to the initial state, but to a much lesser extent than in the case of AISI 52100. The kinetics of denitrification of the nitride layers on the above-mentioned steels was different because the layers differed in thickness and phase composition. Nitrogen, before it reaches the atmosphere, moves in the nitride layer as a result of diffusion. The thicknesses of the iron nitrides on AISI 52100 and AISI 1010 steels were 30 and 34 µm, respectively, and the percentages of the ε phase were 78% and 97%. The parameters characterizing the iron nitrides layers explain the differences in the kinetics of their denitrification.
During the annealing of samples in nitrogen at atmospheric pressure, a loss of sample weight was recorded in the first 20 min, while an increase in sample weight was recorded from 20 to 80 min of annealing. A characteristic line from the γ′ {200} phase and a characteristic line from Fe2O3 iron oxide were identified on the diffractogram. The characteristic line from the γ′ phase indicates that in the initial stage of annealing, until the formation of the iron oxide layer, a part of the ε phase underwent decomposition. The iron oxides inhibited further decomposition and, consequently, an increase in the sample mass was recorded.
During the annealing of nitrided AISI 1010 steel in hydrogen at 600 °C at atmospheric pressure, the largest weight loss of the sample was recorded. After 45 min of annealing, the mass loss due to nitrogen emissions to the atmosphere was 21.8 g/m2. During annealing in a nitrogen atmosphere, denitrification of the iron nitride layer occurs as a result of thermal dissociation of the iron nitrides. However, during annealing in a hydrogen atmosphere, denitrification of the iron nitride layer occurs as a result of the reduction of iron nitrides with hydrogen, Fe4N + 1.5H2  4Feα + NH3.
Our research meets the needs of the machinery industry in the field of anti-corrosion nitriding and the electronics industry in terms of shaping the magnetic properties of iron nitride.

5. Conclusions

Our research has shown that the process of annealing in reduced pressure (200 Pa), nitrogen, and hydrogen can be used for controlled decomposition of iron nitrides. During the annealing of nitrided steel at a temperature of 520 °C, the percentage of the ε phase in the ε + γ′ iron nitride layer changes and, consequently, its magnetic properties change.
In the future, further studies of iron nitride decomposition processes are planned in order to investigate the difference between thermal reduction during annealing in a nitrogen atmosphere and in a vacuum and chemical reduction during annealing in hydrogen.
Based on the research carried out, the following conclusions were drawn:
  • During annealing in nitrogen, iron nitrides undergo thermal reduction.
  • During annealing of nitrided steel with a layer of nitrides with the structure of ε + γ′, in the first instance, ε undergoes reduction according to the reaction ε γ′ + N2; then after the complete transformation of the ε phase, the γ′ phase undergoes reduction according to the reaction γ′ Feα + N2.
  • During annealing in hydrogen, iron nitrides are reduced due to the chemical reaction: Fe3N + 1.5H2  3Feα + NH3, Fe4N + 1.5H2  4Feα + NH3
  • Reduction of the ε phase to γ′ and reduction of the γ′ phase to iron is accompanied by nitrogen emission into the atmosphere and, consequently, a loss of mass of the annealed samples.

Author Contributions

Conceptualization, J.M. and T.F.; investigation T.F., A.D., M.K.-G. and J.O.; methodology J.M. and T.F.; resources T.F.; writing—original draft preparation, J.M.; writing—review and editing, J.M. All authors have read and agreed to the published version of the manuscript.

Funding

This research received no external funding.

Institutional Review Board Statement

Not applicable.

Informed Consent Statement

Not applicable.

Data Availability Statement

Data are contained within the article.

Conflicts of Interest

The authors declare no conflict of interest.

References

  1. Borgioli, F. The Corrosion Behavior in Different Environments of Austenitic Stainless Steels Subjected to Thermochemical Surface Treatments at Low Temperatures: An Overview. Metals 2023, 13, 776. [Google Scholar] [CrossRef]
  2. Godec, M.; Ruiz-Zepeda, F.; Podgoenik, B.; Donik, C.; Kocijan, A.; Balantic, D.A.S. The influence of the plasma-nitriding temperature on the microstructure evolution and surface properties of additive-manufactured 18Ni300 maraging steel. Surf. Coat. Technol. 2022, 4333, 12808. [Google Scholar] [CrossRef]
  3. Kaczmarek, S.M.; Michalski, J.; Leniec, G.; Fuks, H.; Frączek, T.; Dudek, A. Applying the FMR Technique to Analyzing the Influence of Nitriding on the Magnetic Properties of Steel. Materials 2022, 15, 4080. [Google Scholar] [CrossRef] [PubMed]
  4. Kucharska, B.; Michalski, J.; Wójcik, G. Mechanical and microstructural aspects of C20-steel blades subjected to gas nitriding. Arch. Civ. Mech. Eng. 2019, 19, 147–156. [Google Scholar] [CrossRef]
  5. Michalski, J.; Tacikowski, J.; Wach, P.; Lunarska, E.; Baum, H. Formation of single-phase layer of γ’-nitride in controlled gas nitriding. Met. Sci. Heat Treat. 2005, 47, 516–519. [Google Scholar] [CrossRef]
  6. Sugita, Y.; Takahashi, H.; Komuro, M. Magnetic and Mössbauer studies of single-crystal Fe16N2 and Fe-N martensite films epitaxially grown by molecular beam epitaxy. J. Appl. Phys. 1994, 76, 6637–6641. [Google Scholar] [CrossRef]
  7. Jutte, R.H.; Kooi, B.J.; Somers, M.A.; Jutte, R.H.; Mittemeijer, E.J. On the oxidation of α-Fe andε-Fe2N1−z II. Residual strains and blisters in the oxide layer. Oxid. Met. 1997, 48, 111–128. [Google Scholar] [CrossRef]
  8. Peltzer Blanca, E.L.; Desimoni, J.; Christensen, N.E.; Emmerich, H.; Cottenier, S. The magnetization of γ’-Fe4N: Theory versus experiment. Phys. Status Solidi B-Basic Solid State Phys. 2009, 246, 909–928. [Google Scholar] [CrossRef]
  9. Yamashitaa, S.; Masubuchia, Y.; Nakazawab, Y.; Okayamab, T.; Tsuchiya, M.; Kikkawa, S. Crystal structure and magnetic properties of “α′′-Fe16N2 containing residual α-Fe prepared by low-temperature ammonia nitridation. J. Solid State Chem. 2012, 194, 76–79. [Google Scholar] [CrossRef]
  10. Tayal, A.; Gupta, M.; Kumar, D.; Reddy, V.R.; Gupta, A.; Amir, S.M.; Korelis, P.; Stahn, J. Correlation between iron self-diffusion and thermal stability in doped iron nitride thin films. J. Appl. Phys. 2014, 116, 222206. [Google Scholar] [CrossRef]
  11. Lehrer, E. Über das Eisen—Wasserstoff—Ammoniak Gleichgewicht. Z. Elektrochem. 1930, 36, 383–393. [Google Scholar] [CrossRef]
  12. Moszyńska, I.; Moszyński, D.; Arabczyk, W. Hysteresis in nitriding and reduction in the nanocrystalline iron-ammonia-hydrogen system. Przem. Chem. 2009, 88, 526–529. [Google Scholar]
  13. Arabczyk, W.; Pelka, R.; Kocemba, I.; Brzoza-Kos, A.; Wyszkowski, A.; Lendzion-Bieluń, Z. Study of Phase Transformation Processes Occurring in the Nanocrystalline Iron/Ammonia/Hydrogen System by the Magnetic Permeability Measurement Method. J. Phys. Chem. C 2022, 126, 7704–7710. [Google Scholar] [CrossRef]
  14. Kardonina, N.I.; Yurovskikh, A.S.; Kolpakov, A.S. Transformations in the Fe-N System. Met. Sci. Heat Treat. 2010, 52, 457–467. [Google Scholar] [CrossRef]
  15. Van Voorthuysen, E.D.; Boerma, D.O.; Chechenin, N.C. Low-temperature extension of the Lehrer diagram and the iron-nitrogen phase diagram. Metall. Mater. Trans. A 2002, 33, 2593–2598. [Google Scholar] [CrossRef]
  16. Yamaguchi, T.; Sakita, M.; Nakamura, M.; Kobira, T. Synthesis and Characteristics of Fe4N Powders and Thin Films. J. Magn. Magn. Mater. 2000, 215–216, 529–531. [Google Scholar] [CrossRef]
  17. Wojciechowski, P.; Lewandowski, M. Iron Nitride Thin Films: Growth, Structure, and Properties. Cryst. Growth Des. 2022, 22, 4618–4639. [Google Scholar] [CrossRef] [PubMed]
  18. Liapina, T.; Leineweber, A.; Mittemeijer, E.J.; Kockelmann, W. The lattice parameters of ɛ-iron nitrides: Lattice strains due to a varying degree of nitrogen ordering. Acta Mater. 2004, 52, 173–180. [Google Scholar] [CrossRef]
  19. Gupta, M.; Tayal, A.; Gupta, A.; Gupta, R.; Stahn, J.; Horisberger, M.; Wildes, A. Iron and Nitrogen Self-diffusion in Non-Magnetic Iron Nitrides. J. Appl. Phys. 2011, 110, 123518. [Google Scholar] [CrossRef]
  20. Lei, X.; Wang, J.; Peng, R.; Wang, W. The controllable magnetic properties of Fe3N nanoparticles synthesized by a simple urea route. Mat. Res. Bul. 2020, 122, 110662. [Google Scholar] [CrossRef]
Figure 1. Metallographic cross-section of a sphere sample in its diameter (a) and microstructure of AISI 52100 steel with a layer of iron nitrides (b).
Coatings 13 01882 g001
Figure 2. Image of the surface of AISI 52100 steel, nitrided (a) then annealed at 520 °C for 2 h (b) and 5 h (c). The photos show the concentration of nitrogen on the surface of the iron nitride layer.
Coatings 13 01882 g002
Figure 3. Diffractograms of the AISI 52100 steel surface, nitrided (2A) then annealed at 520 °C, for 2 h (7) and 5 h (17).
Coatings 13 01882 g003
Figure 4. The microstructure of nitrided layer on AISI 52100 steel (a) and annealed at a temperature of 520 °C, for 2 h (b) and 5 h (c). The photos (a,b) show the concentration of nitrogen in the iron nitride layer; picture (c) shows the concentration of oxygen.
Coatings 13 01882 g004
Figure 5. Image of the surface of AISI 1010, nitrided (a) and later annealed at a temperature of 520 °C, for 2 h (b) and 5 h (c). The photos show the concentration of nitrogen on the surface of the iron nitride layer.
Coatings 13 01882 g005
Figure 6. Diffractograms of the surface of AISI 1010 steel, nitrided then annealed at a temperature of 520 °C, for 2 h and 5 h.
Coatings 13 01882 g006
Figure 7. The microstructure of the nitrided layer of AISI 1010 steel (a), nitrided and annealed at a temperature of 520 °C for 2 h (b) and 5 h (c). The photos show the nitrogen concentration values in of the iron nitride layer.
Coatings 13 01882 g007aCoatings 13 01882 g007b
Figure 8. Change in the mass of nitrided AISI 1010 steel samples annealed at a temperature of 520 °C in a nitrogen atmosphere at atmospheric pressure ((a)—m_exp.), diffractogram of the steel surface after nitriding ((b)—1A) and after annealing ((b)—37N).
Coatings 13 01882 g008
Figure 9. Image of the surface of AISI 1010 steel after nitriding (a) and after nitriding and annealing at a temperature of 520 °C in a nitrogen atmosphere (b). The photos show the nitrogen concentration (a) and oxygen concentration (b) on the surface of the samples.
Coatings 13 01882 g009
Figure 10. The microstructure of the nitrided layer (a), nitrided and annealed at a temperature of 520 °C, for 2 h (b). The photos show the nitrogen concentration values of the iron nitride layer.
Coatings 13 01882 g010
Figure 11. Change in mass of nitrided AISI 1010 steel samples annealed at a temperature of 600 °C in a hydrogen atmosphere and under atmospheric pressure conditions (m), temperature change of the annealing process (a), diffractogram of steel surface after nitriding (33A) and annealing in hydrogen (35H) (b).
Coatings 13 01882 g011
Figure 12. Image of the surface of AISI 1010 steel after nitriding (a) and after nitriding and annealing at a temperature of 520 °C in a hydrogen atmosphere (b). The photos show the concentration of nitrogen on the surface of the iron nitride layer.
Coatings 13 01882 g012
Figure 13. The structure of the nitrided layer (a), nitrided and annealed at a temperature of 520 °C, for 2 h in a hydrogen atmosphere (b). The photos show the nitrogen concentration values of the iron nitride layer.
Coatings 13 01882 g013
Table 1. The chemical composition of steel used in the tests.
Steel GradeSample No.D 1
(mm)
Element Content in wt.%
CSiMnSPCrFe
AISI 521002A, 7, 173.91.00.30.450.0140.021.5rest
AISI 10101A, 8, 16, 37N, 33A, 35H2.5, 3.90.10.300.800.0450.04-rest
1 Ball diameter.
Table 2. Parameters of nitriding and annealing processes.
Sample No.Nitriding ParametersAnnealing Parameters
Stage IStage IIInlet
Atmosphere
T (°C)t (min)Inlet
Atmosphere/
Pressure
T (°C)t (h)Np (atm−0.5)T (°C)t (h)1 Np (atm−0.5)
2A, 1A57052.5-------
7, 657052.5----520120N2/200 Pa
17, 1657052.5----520300N2/200 Pa
37N57052.5----52090N2/1033 Pa
33A58053.5600110.52 NH3/NH3zd---
35H58053.5600110.5NH3/NH3zd60045H2/1033 Pa
1 Nitriding potential. 2 Mixing ammonia and dissociated ammonia (N2 + H2).
Table 3. Geometry of samples after nitriding and annealing.
Steel GradeSample No.D (mm)1 gmp (µm)2 gpor (µm)
AISI 521002A3.929–3014–15
AISI 5210073.929–3014–15
AISI 52100173.9--
AISI 10101A3.933–3414–15
AISI 101063.933–3414–15
AISI 1010163.933–3414–15
AISI 101037N3.932–3314–15
AISI 101033A2.578–8050–60
AISI 101035H2.5--
1 Thickness of the iron nitride layer. 2 Thickness of the porous zone in the iron nitride layer.
Table 4. Phase composition (PC) of the iron nitride layer (WL) on AISI 52100 steel after nitriding (2A) and annealing 2 h (7) and 5 h (17).
Steel GradeSample No.1 PC WLPC WL (%)
γ′ε
AISI 521002AFe4N-γ′; Fe2-3N-ε22 ± 278 ± 2
7Fe4N-γ′97 ± 2Below 5
17-Below 5Below 5
1 Phase composition of the iron nitride layer.
Table 5. Phase composition (PC) of the iron nitride layer (WL) on AISI 1010 steel after nitriding (1A) and annealing 2 h (6) and 5 h (16).
Steel GradeSample No.PC WLPC (%)
γ′ε
AISI 10101AFe4N-γ′; Fe2-3N-ε5 ± 296 ± 2
6Fe4N-γ′35 ± 265 ± 2
16Fe4N-γ′98 ± 2Below 5
Table 6. Phase composition (PC) of the iron nitride layer (WL) on AISI 1010 steel after nitriding (1A) and annealing (37N).
Steel GradeSample No.PC WLPC (%)
γ′ε
AISI 10101AFe4N-γ′; Fe2-3N-εBelow 598 ± 2
37NFe4N-γ′; Fe2-3N-εAbove 596 ± 2
Disclaimer/Publisher’s Note: The statements, opinions and data contained in all publications are solely those of the individual author(s) and contributor(s) and not of MDPI and/or the editor(s). MDPI and/or the editor(s) disclaim responsibility for any injury to people or property resulting from any ideas, methods, instructions or products referred to in the content.

