Article

Defective ZnO Nanoflowers Decorated by Ultra-Fine Pd Clusters for Low-Concentration CH4 Sensing: Controllable Preparation and Sensing Mechanism Analysis

1
NEST Lab, Department of Physics, Department of Chemistry, College of Sciences, Shanghai University, Shanghai 200444, China
2
NMPA Key Laboratory for Respiratory and Anaesthetic Equipment, Shanghai Institute of Medical Device Testing, Shanghai 200431, China
*
Authors to whom correspondence should be addressed.
Coatings 2022, 12(5), 677; https://doi.org/10.3390/coatings12050677
Submission received: 29 March 2022 / Revised: 1 May 2022 / Accepted: 12 May 2022 / Published: 15 May 2022
(This article belongs to the Special Issue Surface Modified Nanoparticles: For Gas and Chemical Sensors)

Abstract

:
To detect low concentration of CH4 is indeed meaningful in industrial manufacturing, such as the petrochemical industry and natural gas catalysis, but it is not easy to detect low concentration of CH4 due to its high symmetrical and stable structure. In this work, defect-rich ZnO1−x nanoflowers (NFs) were synthesized by a two-step route so as to obtain defect-enhanced gas-sensing performance, namely hydrothermal synthesis followed by H2 treatment. In order to achieve low-concentration detection of CH4, the ultra-thin Pd clusters’ (Cs, diameter about 1–2 nm) sensitizer was synthesized and decorated onto the surface of ZnO1−x NFs. It is found that Pd Cs-2/ZnO1−x gas sensors show enhanced gas-sensing properties to CH4, even at ppm concentration level. At its optimal working temperature of 260 °C, the gas response to 50 ppm CH4 can reach 5.0 with good gas selectivity; the response and recovery time is only 16.2 and 13.8 s, respectively. In the Results, we discussed the CH4 gas-sensing mechanism deeply. Overall, it is very necessary to detect low-concentration methane safely. It is possible for further safe detection of low-concentration methane gas in the future.

1. Introduction

Methane (CH4) is a kind of dangerous gas. If the concentration in the air was as high as 5% to 15%, it would cause a severe explosion accident, which poses a great threat to life. In addition, it is a powerful greenhouse gas and a major component of natural gas. It is also released from coal mines, landfills, biomass combustion, and intestinal fermentation of ruminants such as cattle, sheep, and pigs. In addition, it is also a significant biomarker of some diseases [1,2,3]. Therefore, the detection of CH4 is very important. However, there are few studies on the detection of ultra-low-concentration CH4, mainly due to its stable structure. However, it is indeed essential to develop gas sensors for detecting low-concentration CH4, which is of great significance for industrial production, methane transportation, and household daily methane leakage detection.
One of the most popular candidates is metal oxide semiconductor (MOS) gas sensors, due to their high sensitivity, easiness to integrate, etc., such as SnO2, ZnO, TiO2, and WO3 [4,5,6]. Compared with other sensing materials, many advantages of MOS could be found in gas sensors. Firstly, MOS has high chemical and thermal stability in the air atmosphere even at a temperature of several hundred degrees, meaning its working environment can be harsh, however, many other gas-sensing materials do not have such functions, such as MOFs sensing material. Besides, the MOS sensors are resistant to humidity even working at more than 100 °C, but some sensors, such as quartz crystal microbalance (QCM) working at room temperature, could not work stably under the influence of humidity. At least, MOS sensors are sensitive to most gases, and their sensing performances could be tuned by element doping, noble metal decorating, compositing with other sensing materials, and a different exposed crystal face. Whereas graphene-based and molecularly imprinted polymer-based sensors are too delicate to do so [7,8,9,10]. Among them, ZnO is a classic n-type MOS gas-sensing material because it is easy to produce lattice defects and oxygen vacancy defects on the surface, resulting in a great gas-sensing performance [11,12]. Nevertheless, sensors based on pure ZnO cannot satisfy daily demands of real time and rapid detection of low concentration of CH4 because of its high symmetry structure.
Noble metals, such as Pt, Pd, Au, and Rh, often exhibit some novel features and functions owing to their excellent catalysis effect, so they have a broad application in different fields, such as energy storage, energy conversion, and biomedical diagnosis [13,14]. Thus, it is meaningful to enhance ZnO gas-sensing performance by adding noble metals such as Pd, Au, Pt, etc. Among them, Pd is an important catalyst because it has distinctive catalytic properties and electron sensitization [15]. The ZnO nanowires decorated with Pd nanoparticles reported by Yuan Zhang et al. show a much better response to H2S, compared with the gas sensors from pure ZnO nanowires [16]. Zhanying Zhang et al. declaimed that ZnO nanosheets could improve the sensing properties because Pd can catalyze the activation of CH4 molecules [17].
Besides, the structure of the noble metals is another important factor that can affect the sensing properties of MOS materials to some extent. This is because the microstructure of noble metals greatly affects the gas adsorption, desorption, surface reaction, and electron transfer processes. Hence, synthesizing smaller noble metals, which have large specific surface areas and excellent dispersion, can always improve their properties [18,19]. However, there are few reports on MOS gas sensors sensitized by ultra-fine Pd clusters with a smaller size (<2 nm).
In this work, we synthesized ZnO1−x with more defects by a two-step route method, and then modified ultra-fine Pd Cs on the surface. Through the gas-sensing test, we found that Pd Cs-2/ZnO1−x show a good response to low concentration of CH4, due to excellent sensitization and catalysis of ultrafine Pd Cs.

2. Materials and Methods

All of the chemicals were purchased from Tianjin Kermel Chemical Reagent Co., Ltd., Tianjin, China and used as received without further purification.

2.1. Synthesis of ZnO NFs

We prepared ZnO NFs using a two-step route, as illustrated in Scheme 1. In the first hydrothermal step, 0.54 g Zn(CH3COO)2·2H2O and 1.50 g Na3C6H5O7·2H2O were dissolved into 30 mL distilled water, and after that 1.20 mL NaOH aqueous solution (0.38 mol/L) was added under vigorous stirring drop by drop. Then, the mixed solution was sealed in an X Teflon-lined stainless-steel autoclave (50 mL) and kept heating at 160 °C for 20 h. Then the material was cooled down to room temperature (RT) in a natural way. After several times of centrifugation, washed with distilled water and ethanol several times, the product was collected then dried at 70 °C for 12 h. As a result, we obtained the Zn-precursor. In the next step, the Zn-precursor was put into a horizontal tube furnace and heated at 500 °C in air for 2 h; finally, we got the ZnO NFs sample.

2.2. Synthesis of ZnO1−x NFs

In a reducing atmosphere (1 bar, 5% H2, 95% AR), we put a 100.0 mg ZnO sample into a tube furnace, heated at 500 °C for 1 h. Then after cooling down to RT, the dark brown powder ZnO1−x was collected.

2.3. Synthesis of Pd Cs/ZnO1−x

An amount of 50.0 mg of ZnO1−x NFs were dispersed into a 5.0 mL H2PdCl4 solution (1.0 mg/mL) and treated with ultrasound for 90 min. After several centrifugations, washing by distilled water and ethanol, and dried at 60 °C for 8 h, we collected the product. The product was put into the reduced atmosphere (1 bar, 5% H2, 95% AR). Then the Pd Cs/ZnO1−x was obtained by heating at 200 °C for 1 h; we kept the heating rate at 5 °C/min. In this step, the concentration of H2PdCl4 solution was 0.8, 1.0, and 1.2 mg/mL, respectively. Therefore, in these three different Pd Cs/ZnO1−x samples, the mass fraction of Pd Cs is 3.0%, 5.0% and 8.0 wt%, and they are named as Pd Cs-1/ZnO1−x, Pd Cs-2/ ZnO1−x, and Pd Cs-3/ZnO1−x, respectively.

2.4. Characterizations

We used a Rigaku D/max2500 apparatus by using Cu Kα1 radiation (40 mA, 40 kV, 6° min−1 from 10 to 80°, Rigaku, Tokyo, Japan) to record the powder X-ray diffraction patterns (PXRD), Field emission scanning electron microscopy (FESEM) images and energy-dispersive X-ray (EDX) mapping were collected on a Hitachi S-4800 SEM (Hitachi, Tokyo, Japan), equipped with an energy-dispersive X-ray (EDX) spectroscope at 5 kV. Samples for SEM imaging were deposited on a conductive adhesive before the test. Transmission Electron Microscope (TEM) and High-resolution Transmission Electron Microscope and (HRTEM) images were recorded on a JEM-2010F electron microscope (JEOL, Tokyo, Japan), operating at 200 kV. X-ray photoelectron spectroscopy (XPS) studies were carried out on a WSCALAB 250Xi (Thermofisher Scientific, Waltham, MA, USA) using an Al Kα mono-chromated (150 W, 20 eV pass energy, 500 μm spot size). The C1s signal at 284.6 eV was used to calibrate the binding energy scale.

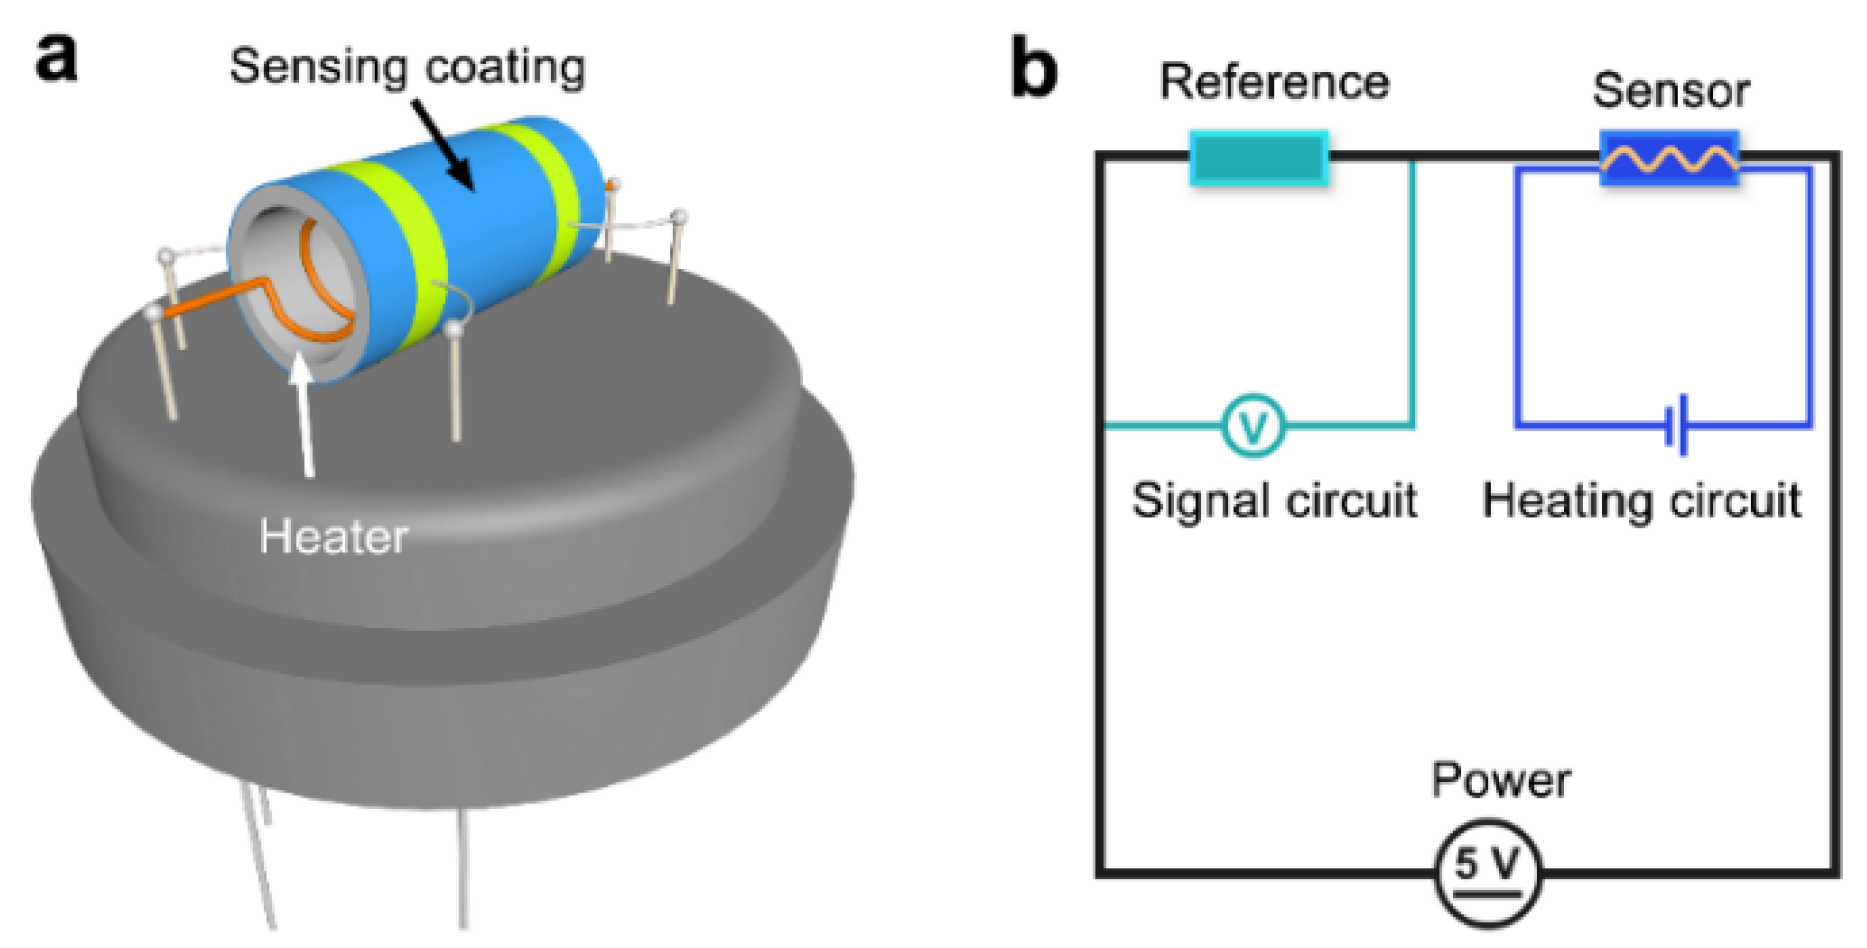
2.5. Fabrication and Performance Testing of Gas Sensors

The sensing nanomaterials (ZnO, ZnO1−x, Pd Cs-1/ZnO1−x, Pd Cs-2/ZnO1−x, and Pd Cs-3/ZnO1−x) were grounded with terpineol to form a paste and coated onto the ceramic tubes’ surface which was printed with Au electrodes and Pt wires in advance. To remove the adhesive, it was kept sintering at 300 °C for 3 h, then a Ni–Cr alloy coil was inserted into the tube; it was used as a heater to control the operating temperature. The illustration of sensor structure is shown in Scheme 2a. We aged the as-fabricated sensors at 290 °C for 7 days; the aim was to enhance their stability. We used a WS-30A tester (Hanwei Electronics Co. Ltd., Zhengzhou, China) to evaluate the performance of MOS gas sensors. The test circuit illustration is shown in the Scheme 2b. The response of the sensors was Ra/Rg; the Ra and Rg is the resistance of the sensor in the air and in the test gas, respectively. The response and recovery time is counted as the time taken by the sensors output to achieve 90% of the total resistance change after injecting or releasing the test gas. The data are collected at 40% relative humidity (RH) and 25 °C (room temperature). Then, we tested the effect of RH on the gas-sensing properties of the sensor, and we explored the impact of RH from 40% to 90% on gas sensing. The calculation formula is as follows:
V s e n s o r = 5 V o u t
R s e n s o r = V s e n s o r V o u t × R L
Response : S = R a R g   ( r e d u c i n g   g a s )
We repeat all experiments independently for three times.

3. Results

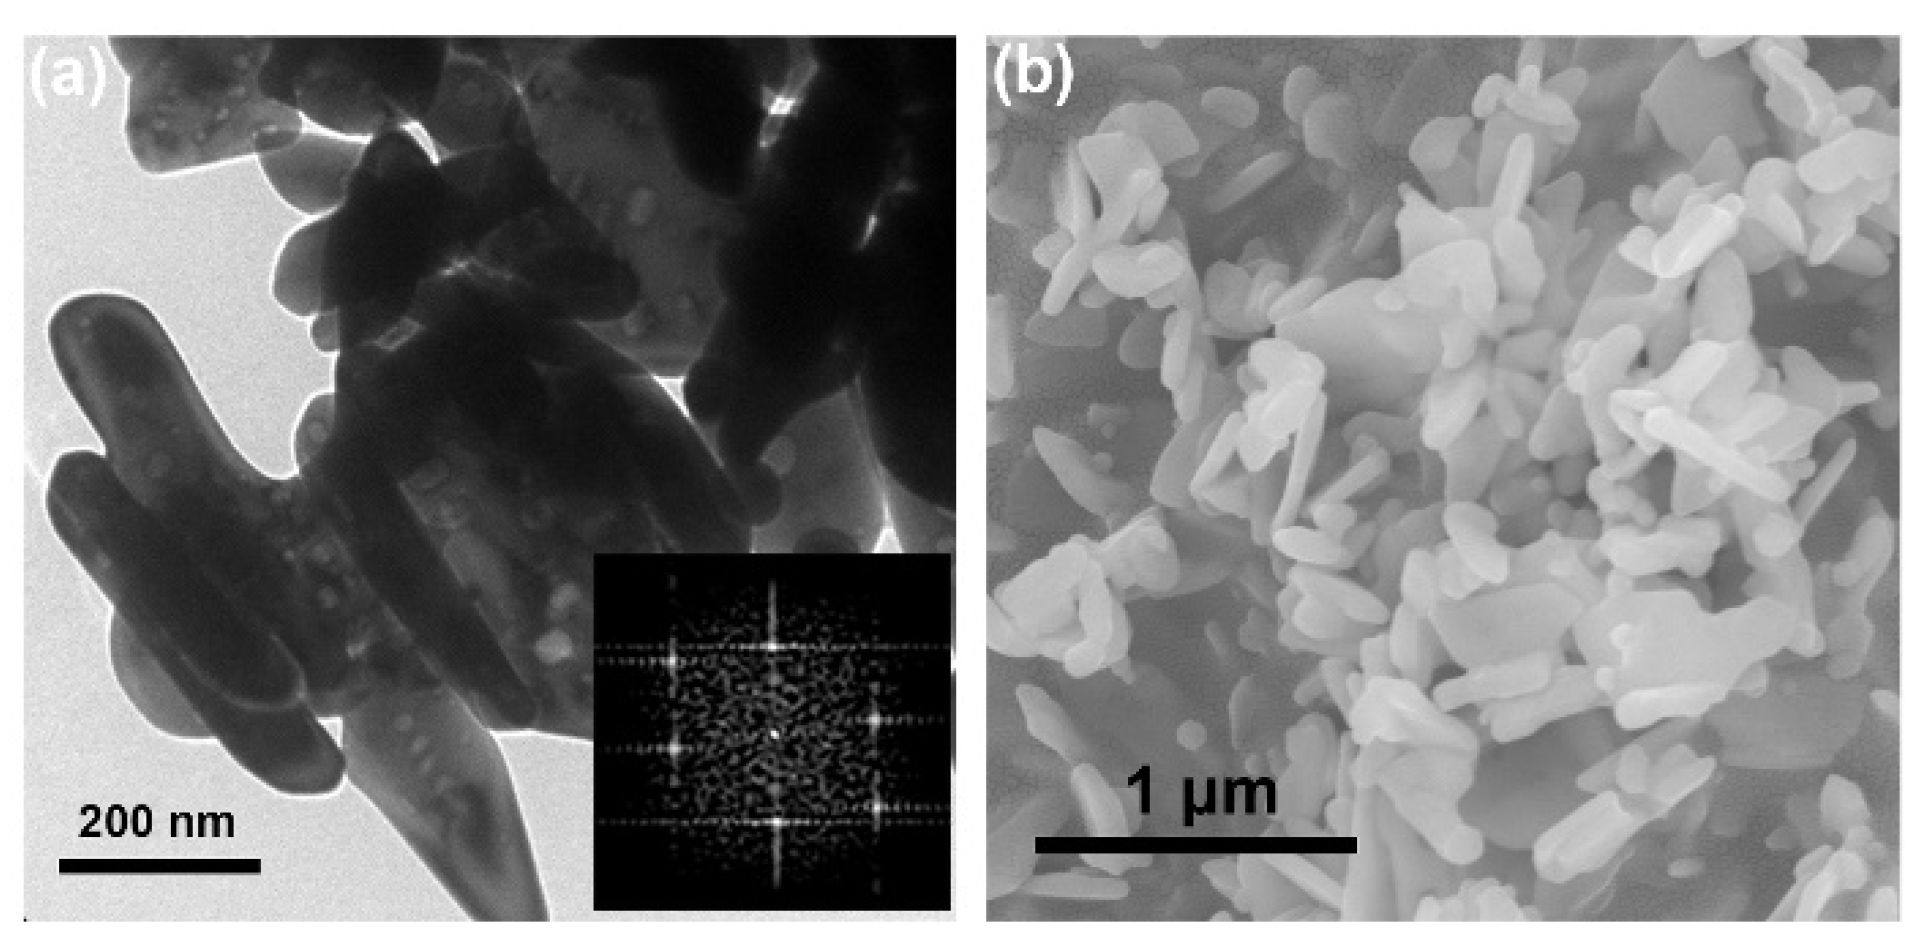
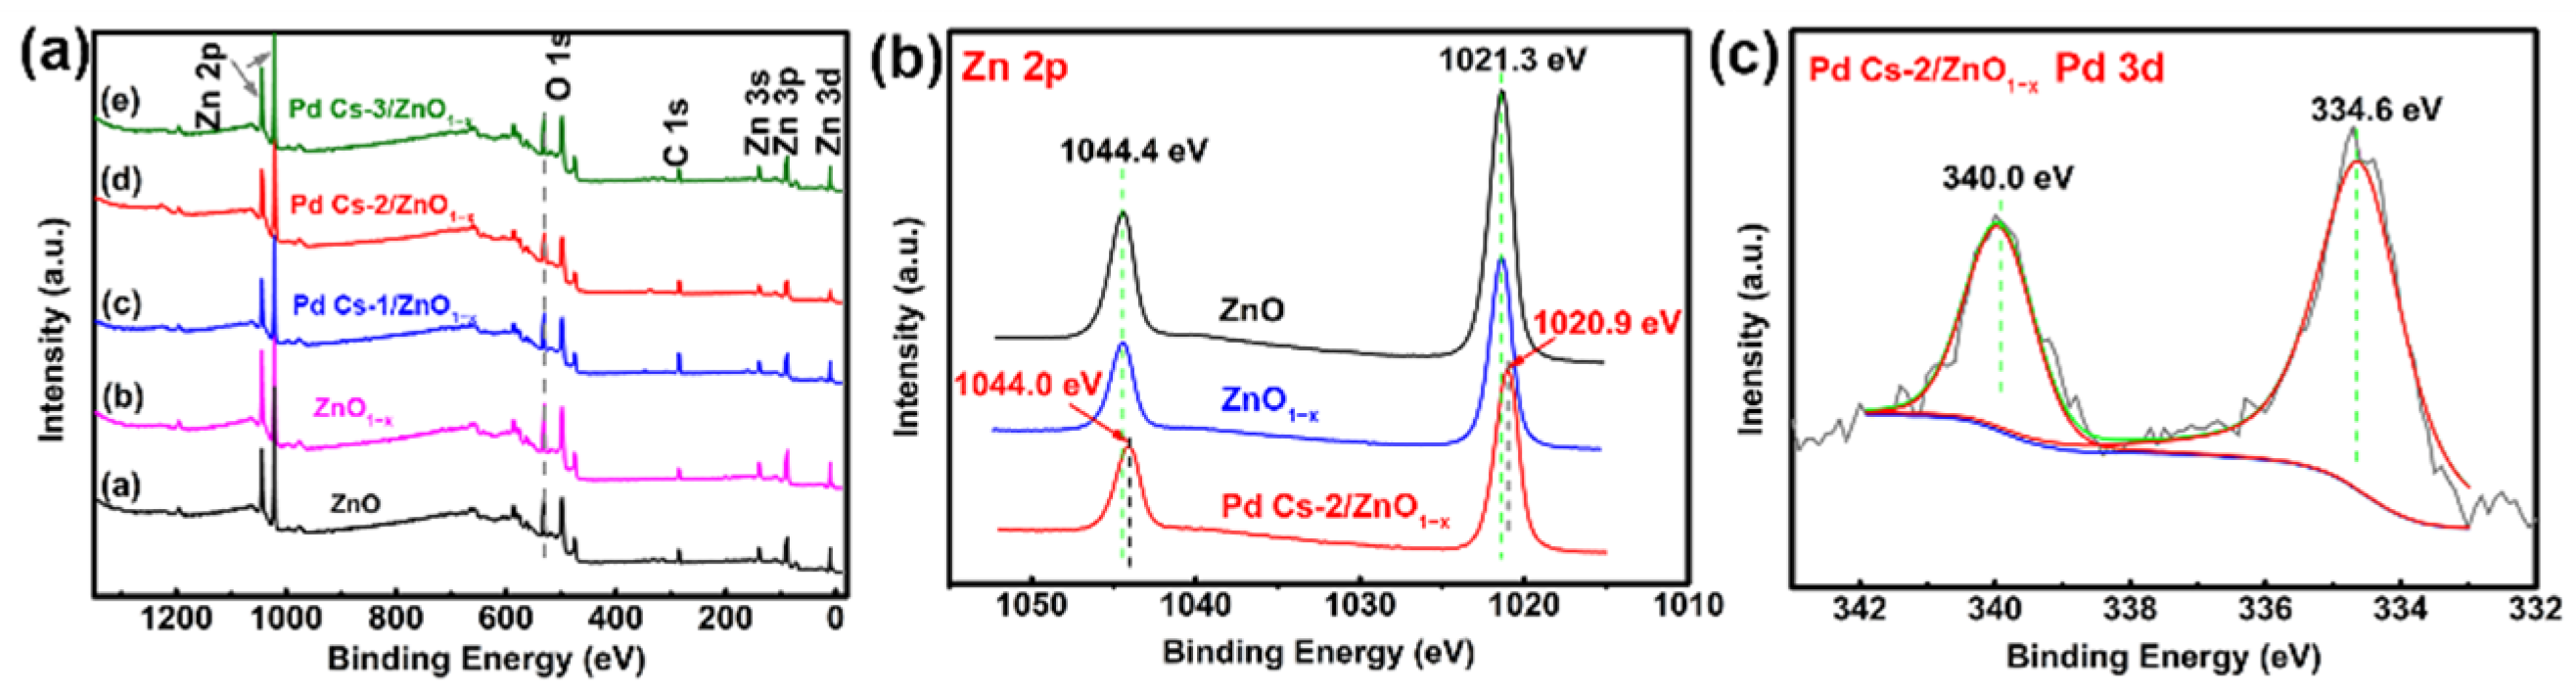
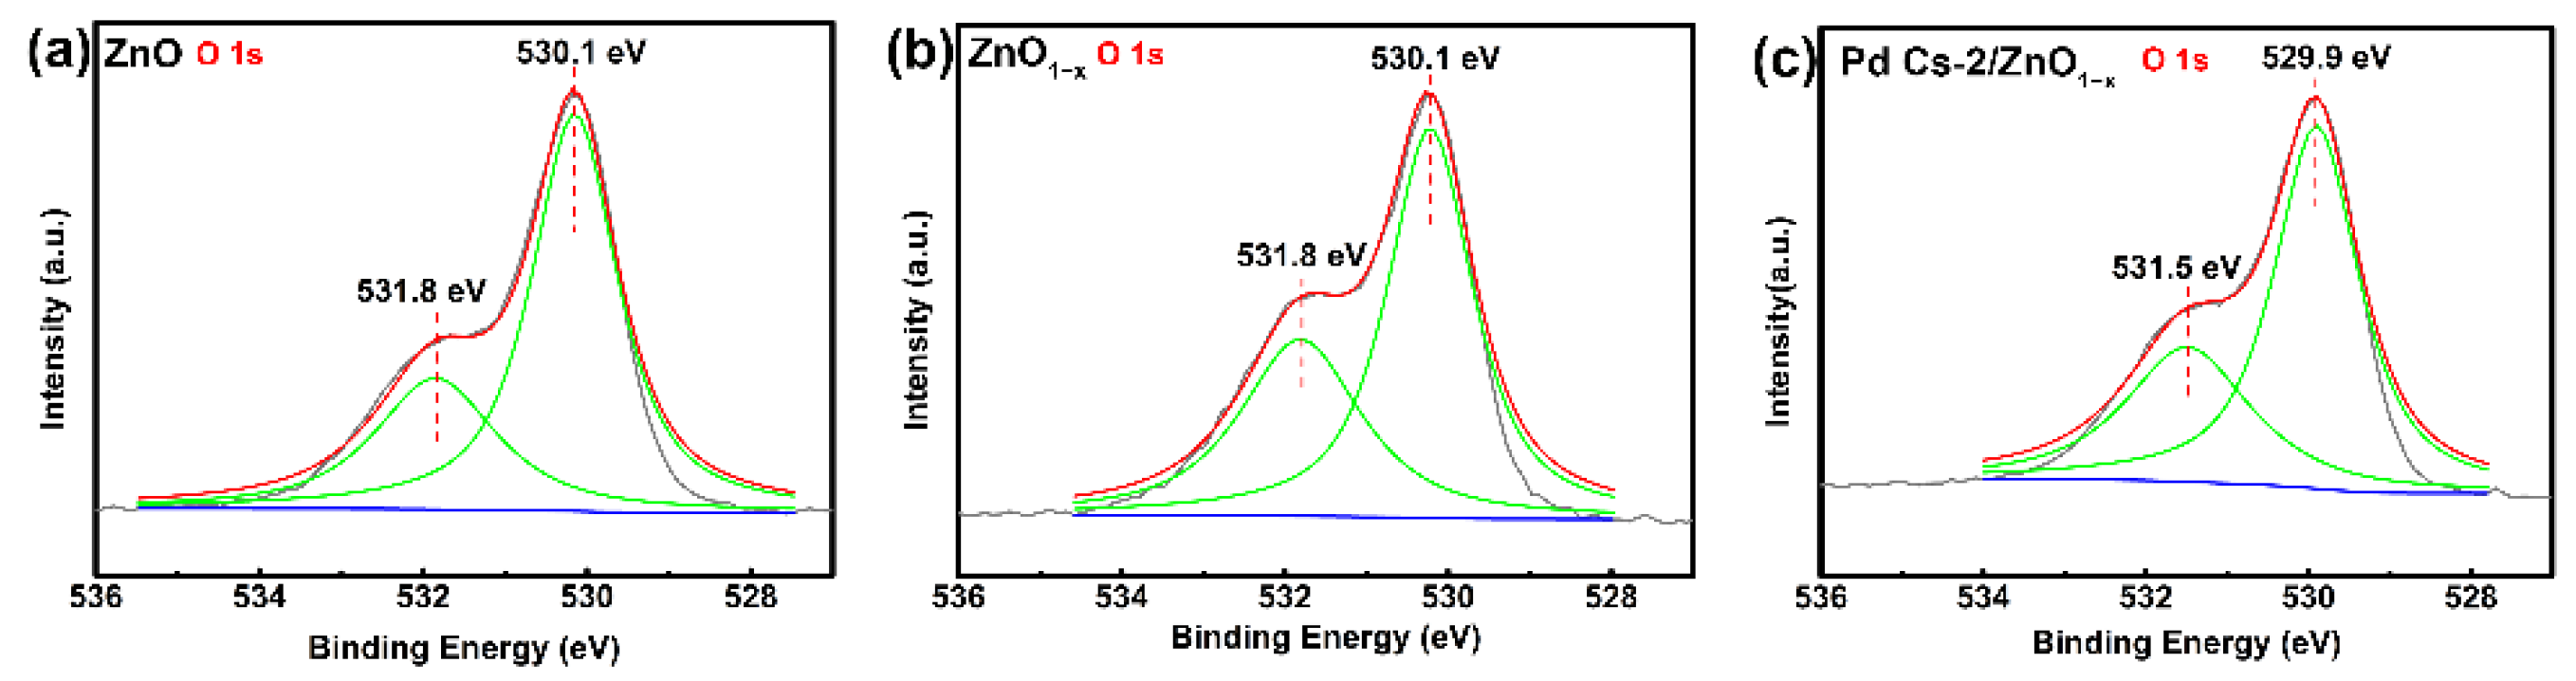
3.1. Characterizations and Analysis

The crystal phase and purity of the ZnO, ZnO1x, and Pd Cs-1~3/ZnO1x samples were characterized by XRD. As we can see from Figure 1, the peaks at 31. 8°, 34. 4°, 36. 3°, 47. 5°, 56. 6°, 62. 9°, 66. 4°, 68.0°, and 69. 1°can be indexed to the (100), (002), (101), (102), (110), (103), (200), (112), and (201) planes of a ZnO crystal given by the standard data files (JCPDS file no. 36-1451), repectively, and we did not find any peaks of other impurities, indicating the high purity of the ZnO NFs sample [20,21]. At the same time, we could not find an obvious change in the intensity of the peaks compared with the pristine ZnO. Besides the ZnO peaks, the peaks of the hexagonal Pd (JCPDS no. 65–3411) are not observed due to extremely small doses and ultra-thin size of Pd Cs, the inspection depth of the instrument, as well as the relative much higher intensity of the ZnO NFs. However, we can prove the existence of Pd Cs exactly in the later experiments (data of TEM images, HRTEM images, XPS, and EDX).
The crystal type of ZnO here is hexagonal with the point group P63mc(186), and the parameters of the crystal cell are (a, b, c) = (3.24982, 3.24982, 5.20661) and (α, β, γ) = (90°, 90°, 120°). The lattice distances can be calculated by Bragg equation d = nλ/2sinθ (λ = 0.15406 nm), shown in Table 1, and the grain size can be obtained from the Debye–Scherrer formula D = Kγ/Bcosθ (K = 0.89). Here we used Jade software to grab the information of full width at half maxima, and then calculated the grain sizes of each crystal plane, which are listed in Table 1. The grain sizes distribute from 4.65 to 5.39 nm, and the strongest signal yield crystal plane is (101) with 4.95 nm grain size.
FESEM and TEM were applied to characterize the morphologies and microstructures of ZnO, ZnO1−x, and Pd Cs-1~3/ZnO1−x. Firstly, Figure 2a,b exhibit the images of ZnO samples with different magnifications. We can see that ZnO is composed of many flowers with the size around 1 μm. Figure 2b reveals that these NFs are assembled by numerous nanorods with the average length of ~100 nm. We can see the TEM images of the ZnO NFs in Figure 2c. Similar to the above SEM images, these NFs are assembled from many nanorods with diameters of less than 100 nm.
Figure 3 shows the SEM and TEM images of ZnO1−x. It is found that the morphologies of ZnO1−x NFs have deteriorated a little compared with the ZnO NFs. Figure 3a reveals the building block of ZnO1−x NFs is nanorods with a diameter of ~100 nm. However, when we observe carefully, we can find part of the structure collapse of NFs (Figure 3b), but it is favorable for creating more defects at the same time. The suggestion can be proved by the XPS data in Figure 3. As a result, it can optimize the sensing performances of the ZnO1−x NFs. We can see the fast Fourier transform (FFT) in the insert; the data is in good agreement with the XRD (Figure 1).
Figure 4 displays the morphology and microstructure of our Pd Cs-2/ZnO1−x. We can see from Figure 4a,b that Pd Cs are evenly dispersed on the surface of ZnO1−x without aggregation. In addition, the diameter of Pd Cs is just about 1~2 nm, which is significant to enhance its gas-sensing performance by a quantum size effect. In addition, the interplanar spacing information of ZnO1−x and Pd Cs can be seen from Figure 4c, respectively. The measured d spacing (0.260 nm) between the adjacent lattice planes is corresponded to the distance of ZnO (002) crystal planes [22,23,24]. Another d value of about 0.225 nm can be attributed to (111) planes of Pd Cs [25,26].
After that, we can get the information of the EDX elemental mapping data of Pd Cs-2/ZnO1−x to show the distribution of the elements. From Figure 5, it can be seen that this sample is mainly composed of the Zn, O, and Pd elements, and they are distributed uniformly. We can see from Figure 5b,c that the O and Zn elements distribute evenly, which matches the properties of the ZnO nanomaterial. It is worth noting that Pd Cs are homogeneously distributed around the whole ZnO1−x material and have good dispersion without obvious accumulation and aggregation, which will be beneficial to the gas sensing of the material.
Next, Figure 6 shows the TEM images of these three Pd Cs 1~3/ZnO1−x nanomaterials. From the figure, we know that with the increase in precursor H2PdCl4, the content of Pd Cs in the synthesized nanomaterials increases gradually, and we can see from Figure 6b that they are uniformly distributed on the surface of ZnO1−x. However, with the further increase in it, the Pd Cs aggregate on the surface of ZnO1−x, resulting in a negative effect on the gas-sensing performances of the synthesized nanomaterials, as shown in Figure 6c.
Next, we tested these gas-sensing materials’ surface chemical compositions using X-ray photoelectron spectroscopy (XPS) and show them in Figure 7a. We can clearly see the Zn, O, and Pd peaks, with no other peaks (except C) appearing. After that we analyzed and discussed the valence states of them. Figure 7b exhibits the Zn 2p spectra of ZnO, ZnO1−x, and Pd Cs-2/ZnO1−x. Figure 7b shows that the peaks of Zn 2p3/2 of ZnO and ZnO1−x is about 1021.3 eV, and the peaks of Zn 2p1/2 of ZnO and ZnO1−x are 1044.0 eV, showing that Zn element is in the formal Zn2+ valence state. At the same time, we know that the two peaks of Pd Cs-2/ZnO1−x shift to a low binding energy of about 1020.9 eV and 1044.0 eV for Zn 2p3/2 and Zn 2p1/2. This shift is mainly due to the interaction between ZnO1−x and Pd Cs, which can change ZnO1−x’s surface electronic structure and as a result, enhance its sensing performance. For Pd element, as we can see from Figure 7c, the peaks at 334.6 and 340.0 eV are Pd 3d5/2 and Pd 3d3/2, respectively, which only belongs to Pd0 state [27,28,29].
The O 1s spectra in Figure 8 reveal the states of surface O of three gas-sensing materials. OI and OII are two states of O (OI is lattice oxygen; OII is oxygen defects). For ZnO as well as ZnO1−x, the peaks at 530.1 eV and 531.8 eV are OI and OII, respectively. We can find that the OII proportion in ZnO and ZnO1−x is 31.60% and 38.82%, respectively (shown in Table 1), proving there is more oxygen defects existing on the surface of these materials that will influence their sensing materials. As such, the O 1s peaks of Pd Cs-2/ZnO1−x shift to low binding energy at 529.9 eV and 531.5 eV for the reason we discussed earlier. Table 2 gives the specific proportion of O 1s peaks among ZnO, ZnO1−x and Pd Cs-2/ZnO1−x [30].
Further, we performed photoluminescence (PL) spectra on the samples ZnO, ZnO1−x, and Pd Cs-2/ZnO1−x, as we can see in Figure 9. From the original curves, we know that the whole PL spectrum in the range 380~500 nm can be Gaussian deconvoluted into different parts; these parts represent different defects. Particularly, Zni and VO are electron donors in different materials, and the donors have a huge impact on its sensitivity. Firstly, we nearly could not find the signals of Zni and VO in ZnO because of a few contents as well as the detection depth of the instrument. However, we found that after calcination in a reduced atmosphere in the tubular furnace, oxygen vacancy defects in ZnO1−x are more than that of ZnO (the purple line and the blue line in Figure 9). Furthermore, after another calcination step in the reduced atmosphere, there are many more oxygen defects generated in Pd Cs-2/ZnO1−x. In addition, we calculated the ratio of VO/Zni in different samples; the data of ZnO1−x and Pd Cs-2/ZnO1−x are 3.54 and 12.17, respectively, proving more oxygen vacancies existed in Pd Cs-2/ZnO1−x [31].

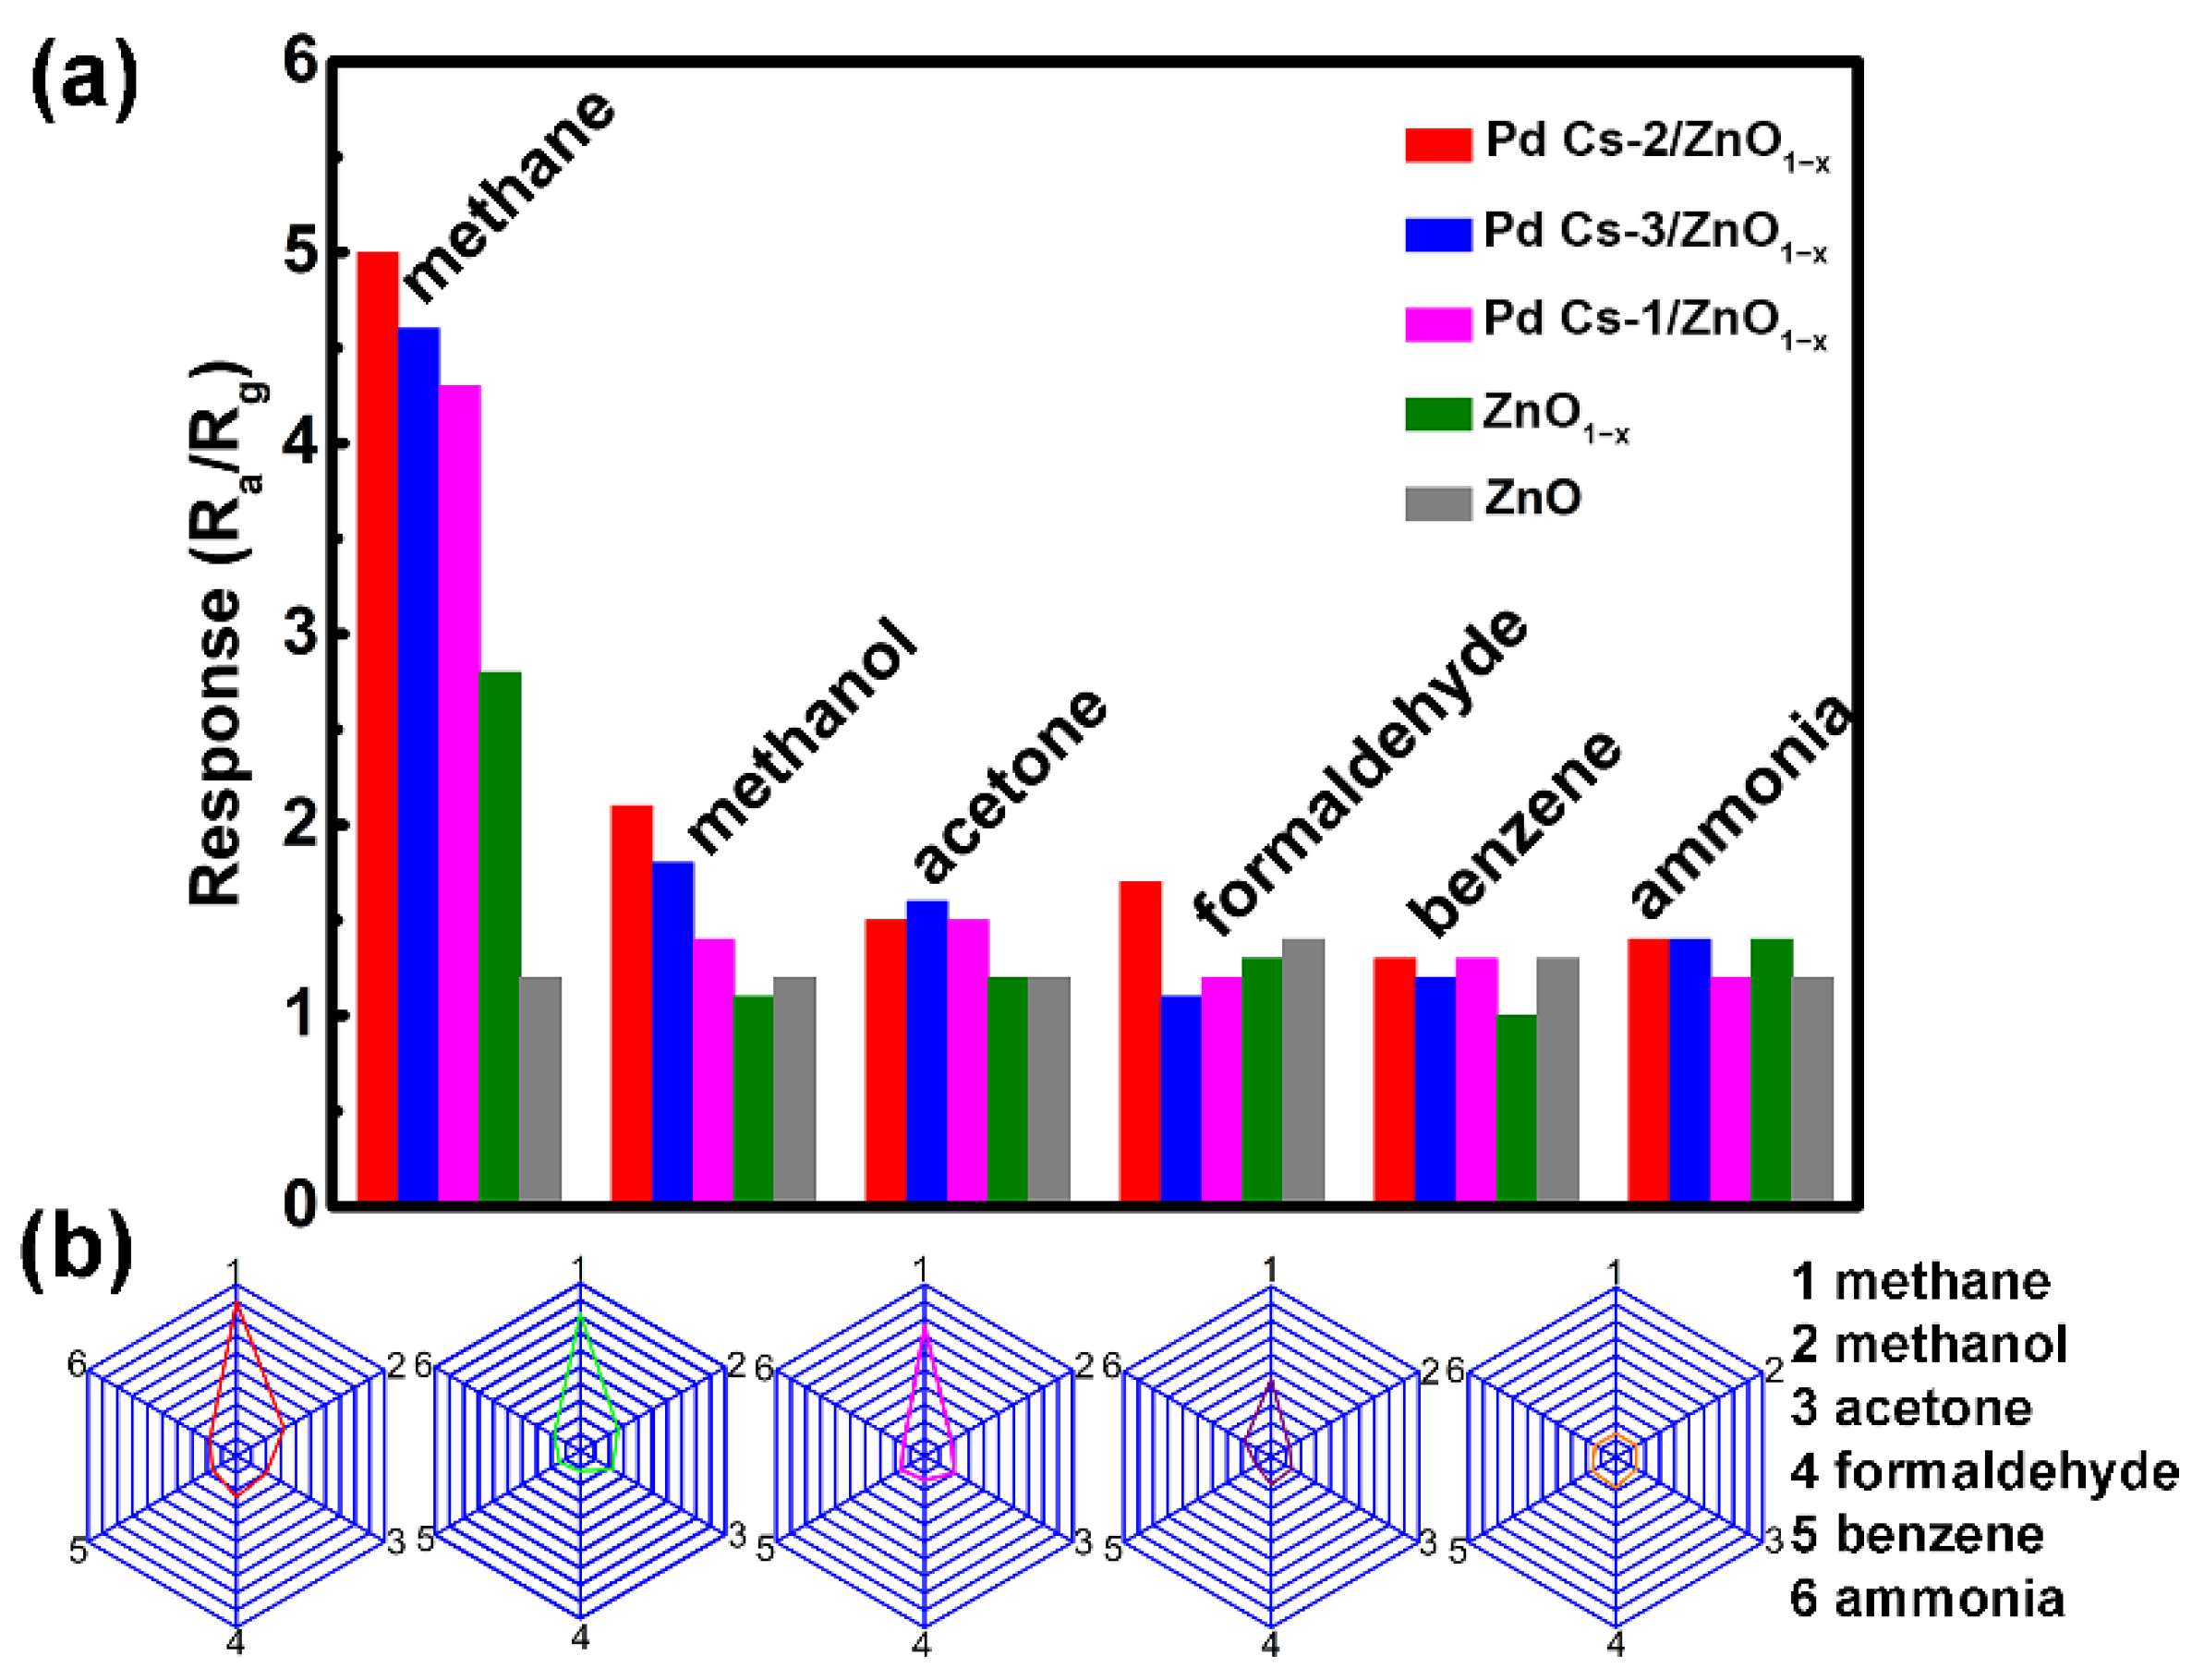
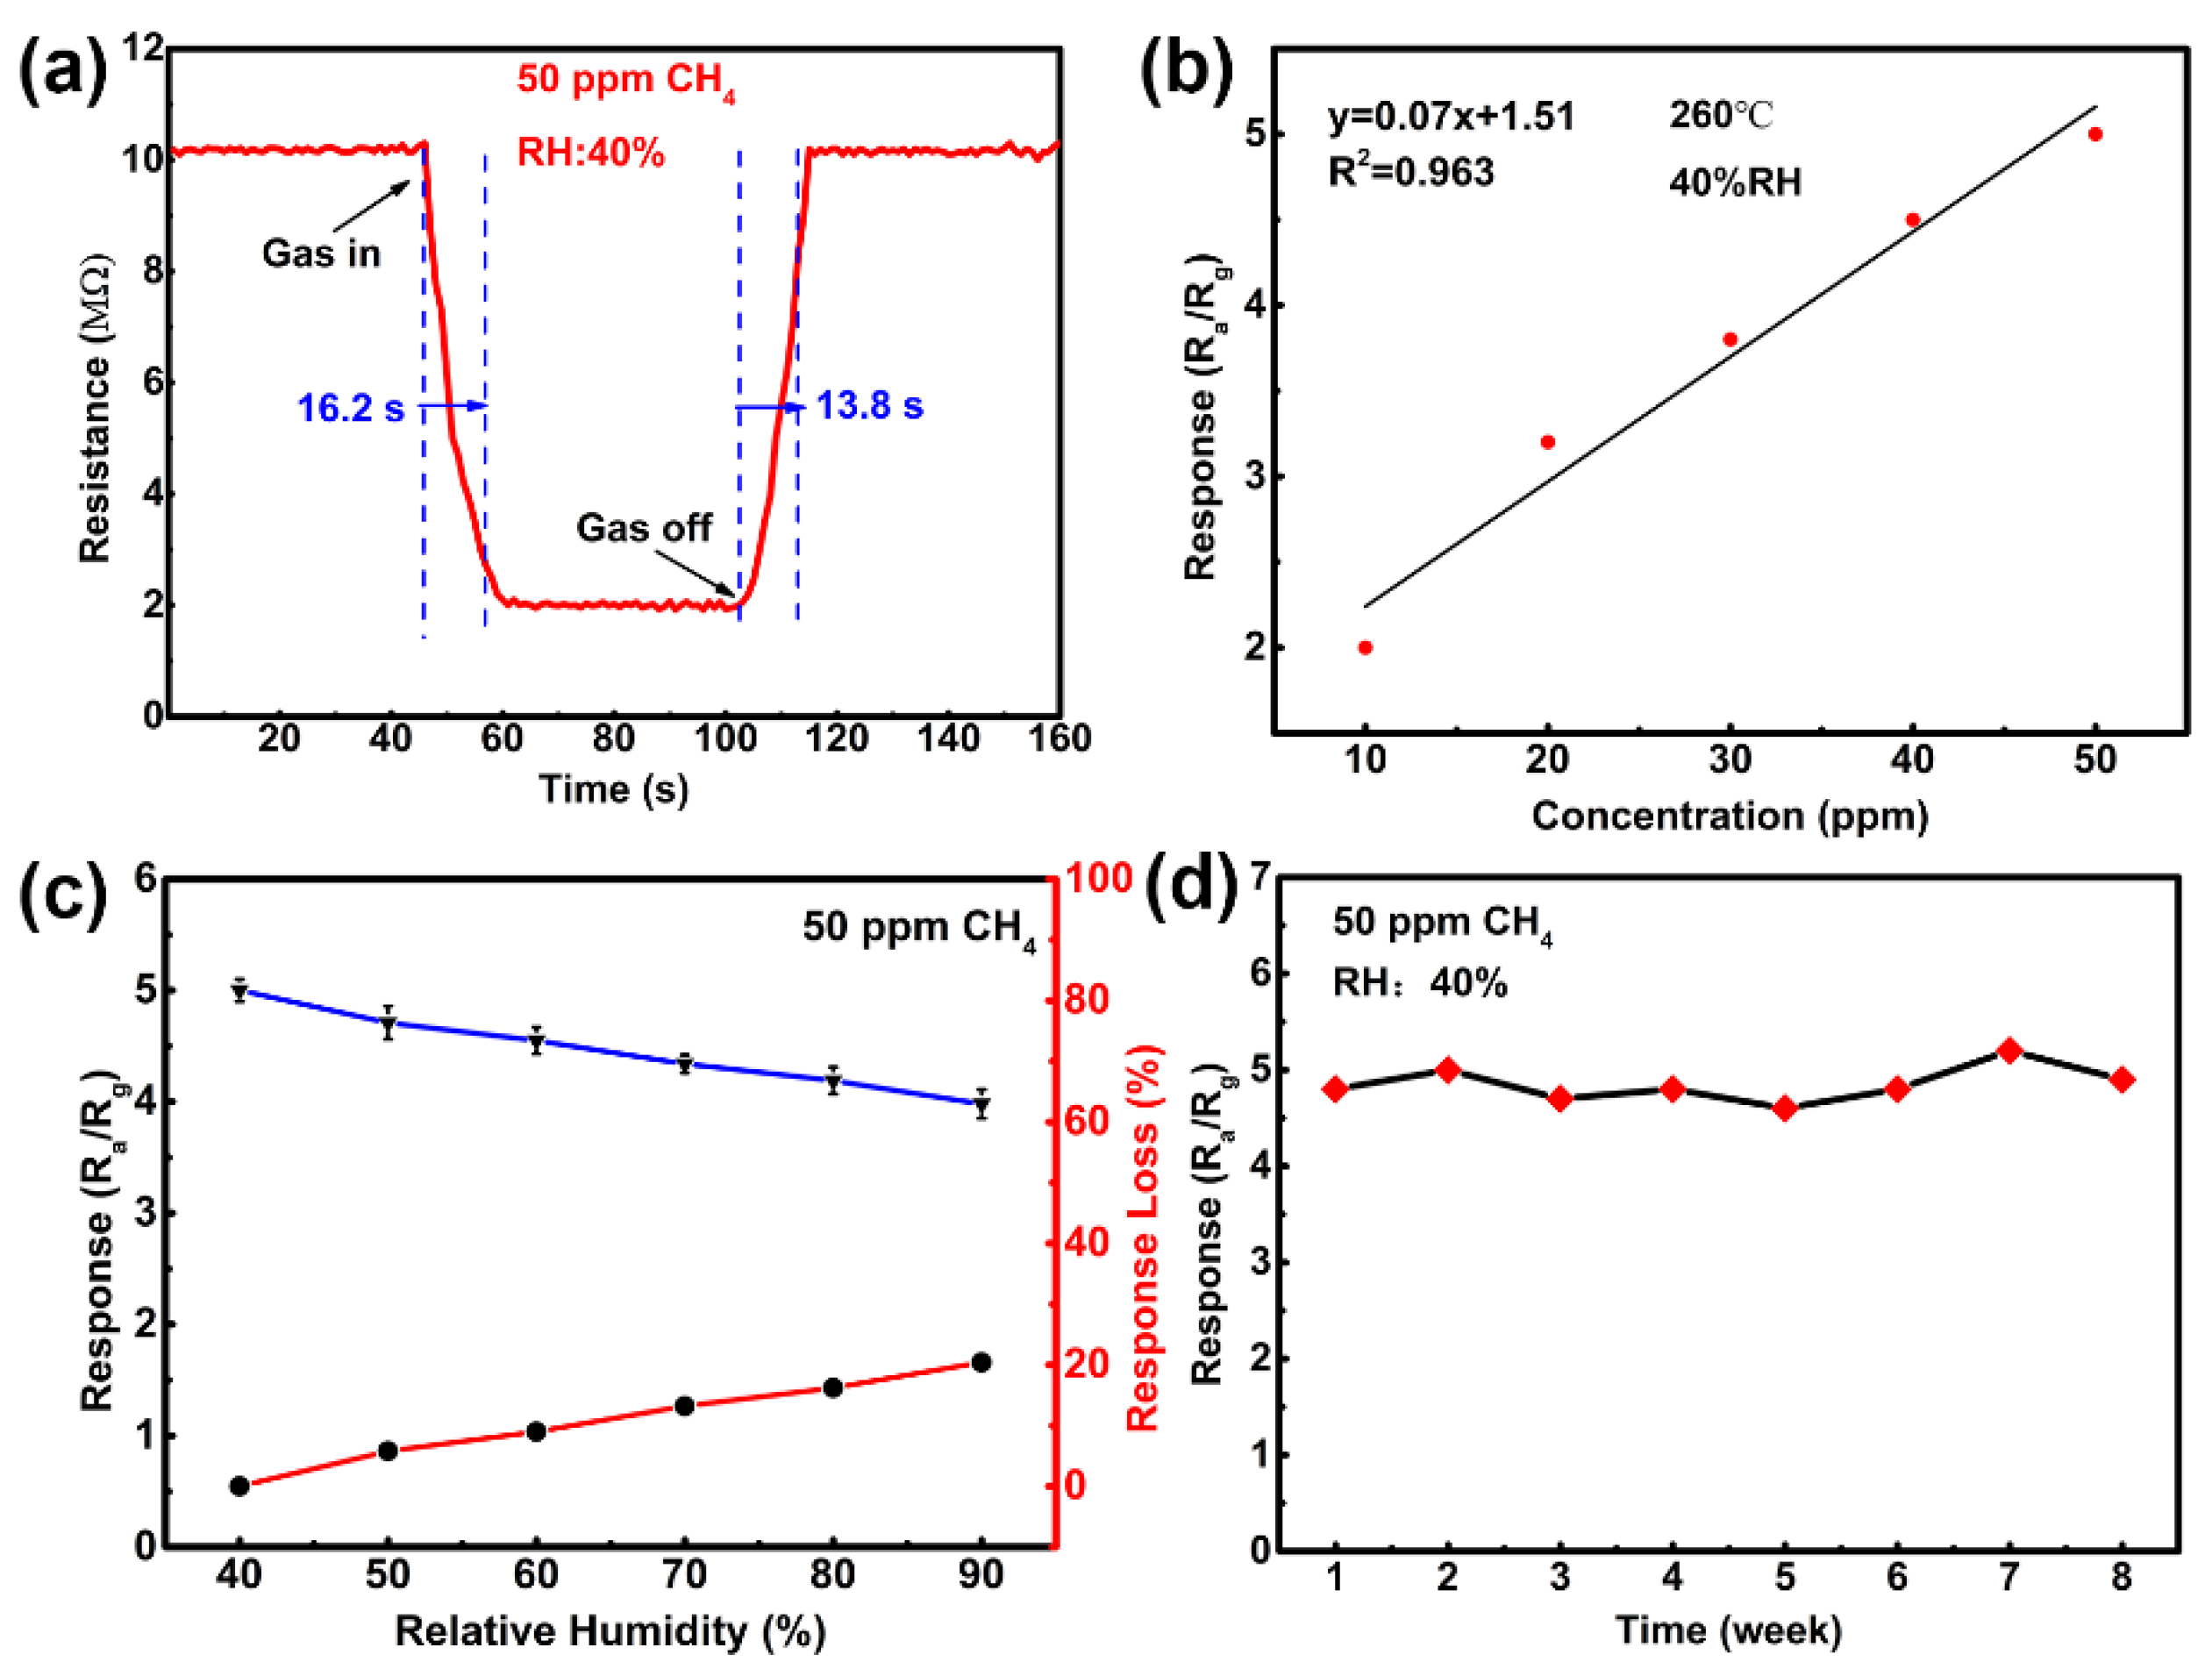
3.2. Gas-Sensing Properties

Firstly, the operating temperature could influence the gas-sensing process to a large extent. Therefore, it is necessary for us to determine their optimum working temperature [32]. Because of the high symmetry and stability of CH4 molecules, a relative high working temperature for CH4 sensing is required. Hence, we tested temperature-dependent gas responses from 200 to 300 °C. In this process, we found that the responses to different gases change significantly with working temperature, as shown in Figure 10. The detected gases include methane, methanol, acetone, formaldehyde, benzene, and ammonia. When the operating temperature increases, the responses of all the sensors increase gradually, then reaching a maximum at a specific temperature. For ZnO and ZnO1−x gas sensors, the maximum gas response appears at 280 °C (2.5 and 3.0 to 50 ppm CH4, respectively). The response of Pd Cs-1~3/ZnO1−x gas sensors reach the highest gas response at 260 °C, indicating Pd Cs have catalytic activity to CH4 oxidization, thus decreasing its reactive and sensing temperature. Their responses to 50 ppm CH4 are 5.0, 4.6, and 4.3 for Pd Cs-2/ZnO1−x, Pd Cs-3/ZnO1−x, and Pd Cs-1/ZnO1−x, respectively. After that, the responses of all the gas-sensing materials decrease slowly. So, we selected 260 °C as the optimal working temperature to further study the gas-sensing performance of Pd Cs-2/ZnO1−x gas sensors.
To study the gas selectivity of the sensors [33], we also tested their gas responses to the other 50 ppm gases as we mentioned earlier at 260 °C at the same time. As we can see from Figure 11a, the sensor Pd Cs-2/ZnO1−x has better gas selectivity than any other counterparts. The responses to 50 ppm methane, methanol, acetone, formaldehyde, benzene, and ammonia is 5.0, 2.1, 1.5, 1.7, 1.3, and 1.4, respectively, indicating a good selectivity to methane. Therefore, the decoration of ZnO1−x with certain content Pd Cs not only improved their gas responses, but also optimized their gas selectivity. Figure 11b shows the illustration of relative selectivity of these five different sensors.
It is meaningful to determine the dynamic sensors’ response [34]. The response and recovery curve of Pd Cs-2/ZnO1−x gas sensor to CH4 at 260 °C is shown in Figure 12a. We know that the response and recovery times of 50 ppm CH4 are 16.2 s and 13.8 s, respectively. In addition, we can see that with the concentration changes, the response increases from 2.3 (10 ppm CH4) to 5.0 (50 ppm CH4) gradually, and it conforms to an excellent linear relationship (the R2 is 0.963), as we can see from Figure 12b.
We should not ignore that relative humidity (RH) has an impact on their gas-sensing performance [35]. Therefore, it is indeed necessary to explore their gas-sensing properties at a high-humidity environment. We can see the sensing performance ranging from 40% to 90% in Figure 12c. When RH varies, the sensors’ response to methane decreases conversely, showing that RH truly influences methane detection. When RH was 90%, the response decreased by 20.4% (to 50 ppm CH4 at its optimum temperature). As a result, we should focus on the influence of RH, and do a good job of compensation and protection for the sensor devices. For example, compensating it through the circuit when fabricating devices.
Last, we analyzed the long-term stability of the sensor (260 °C, 40% RH); the results are shown in Figure 12d [36]. We can see from the figure that the responses of the sensor are stable within 8 weeks; the response is fluctuant between 4.7~5.2 for 50 ppm CH4. In a word, the ZnO1−x/Pd Cs-2 gas sensor has a great response; good selectivity, response and recovery properties; and a satisfactory long-term sensing property, meaning it is an ideal candidate for detecting low-concentration CH4.

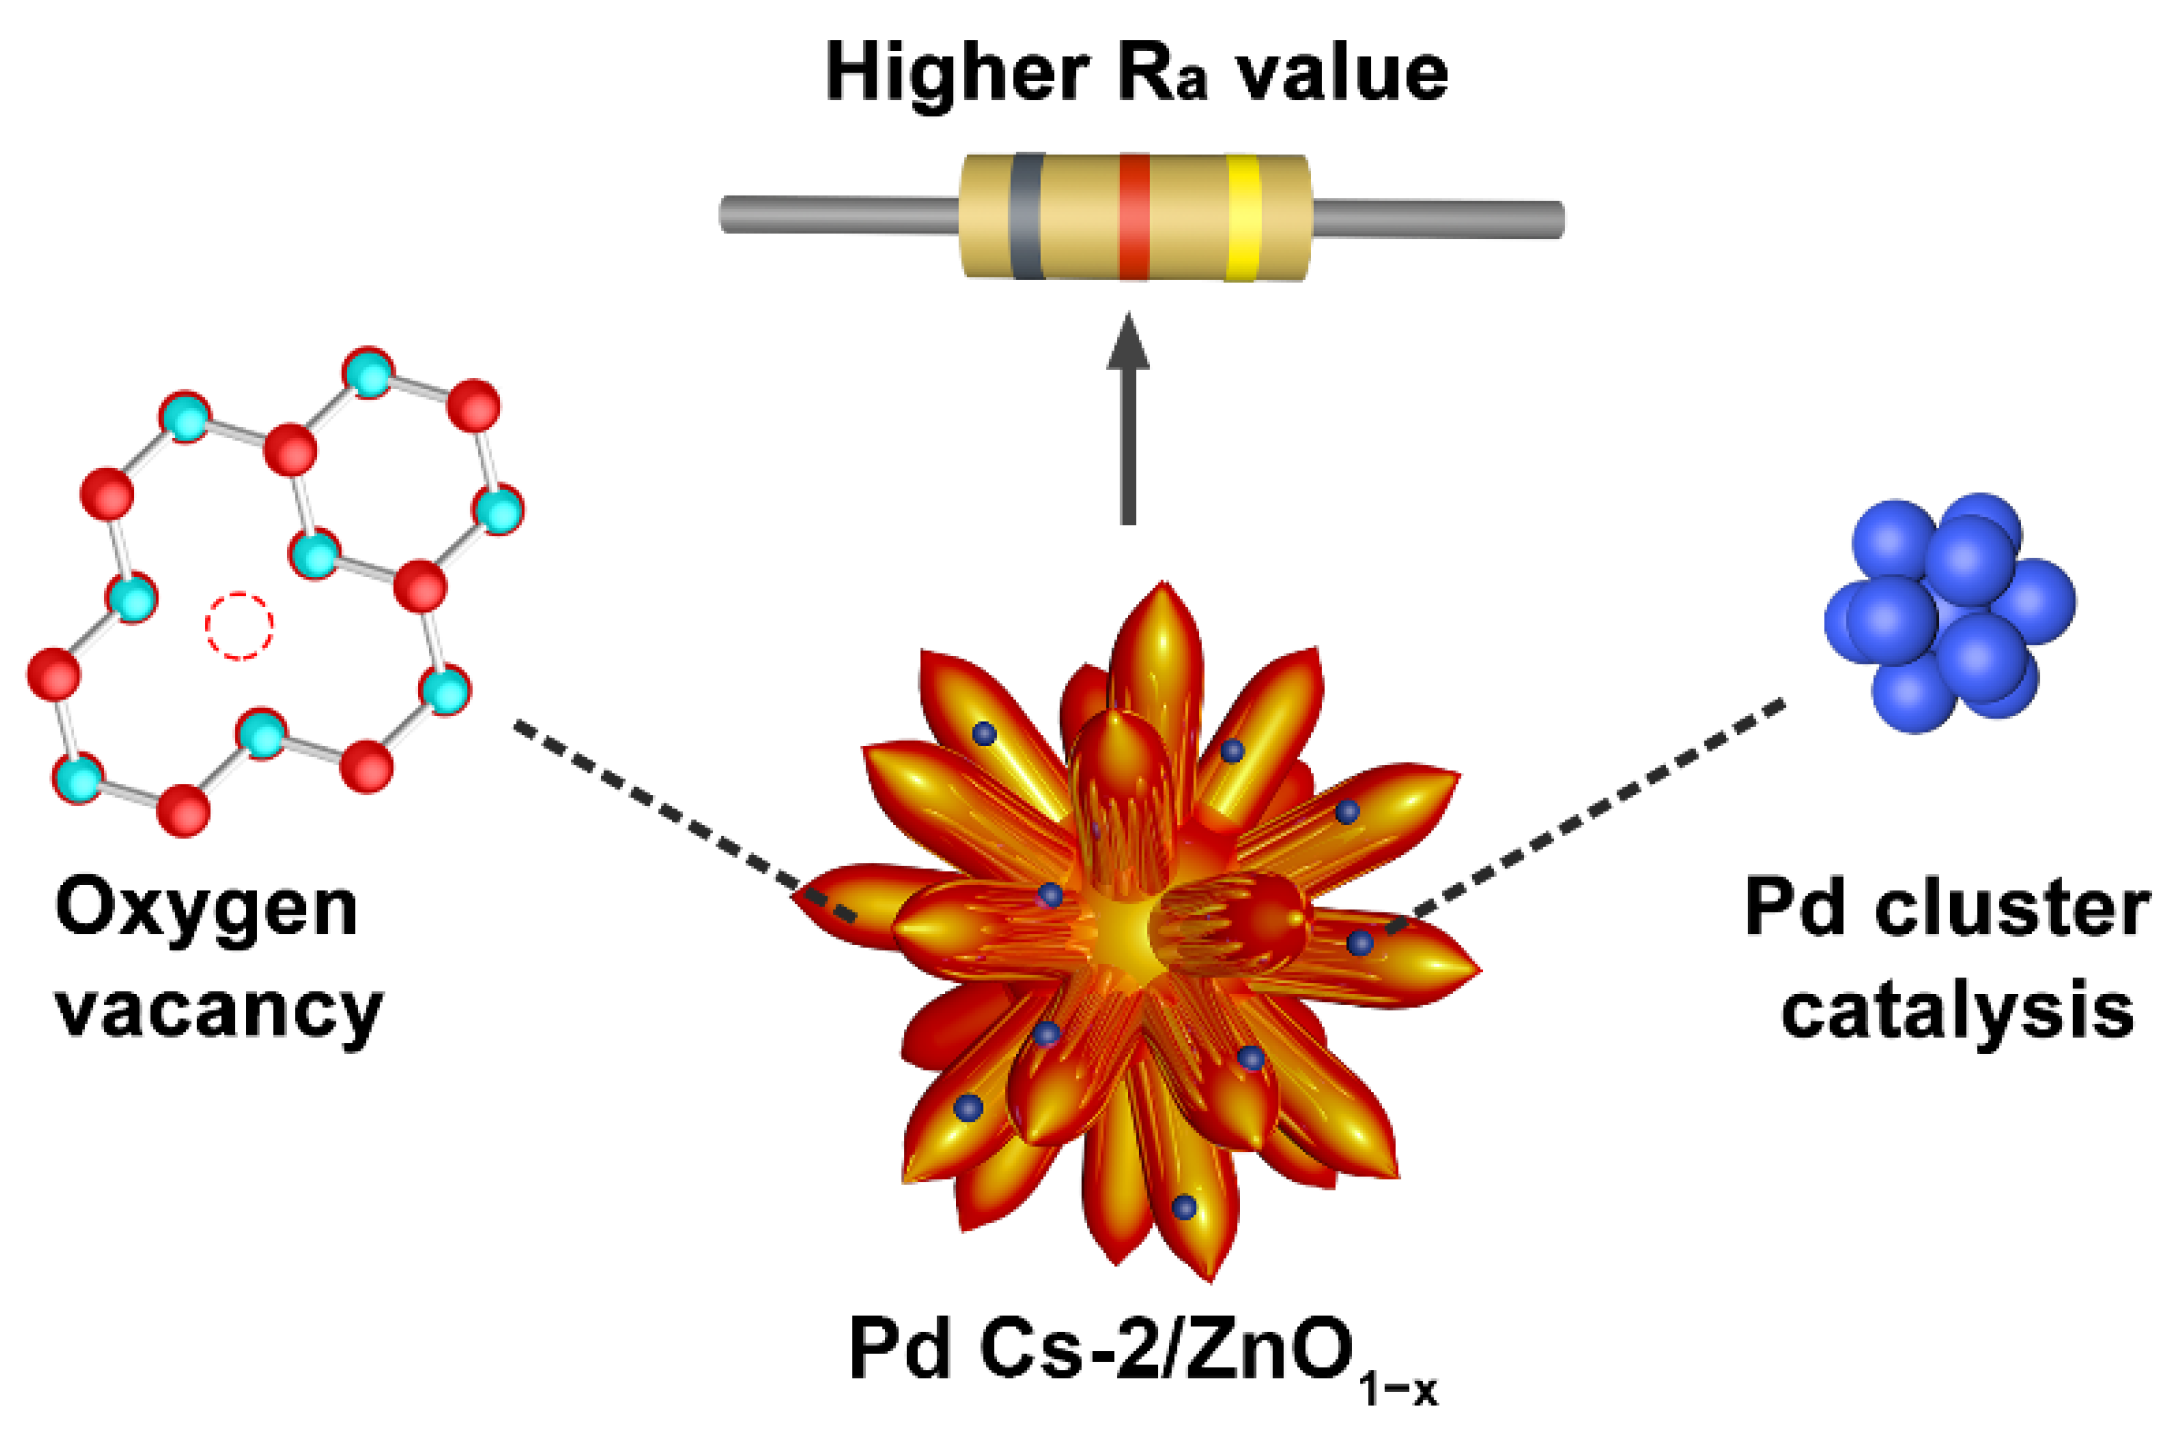
3.3. Mechanism of Gas-Sensing Performance

We know that the sensing mechanism of MOS mainly depends on its resistance to the surface change where the surface states and adsorbing capacity of oxygen play important roles, for example, the redox reaction of the detected gas on the MOS surface with the chemisorbed oxygen species, such as O2, O and O2− [37,38].
Firstly, the sensing material is Pd Cs/ZnO1−x with many more oxygen defects than ZnO NFs, so it has many more adsorption sites and a low transport barrier. As a result, we can see that the Ra of ZnO1−x is much less than that of ZnO, proving there are many more carriers in ZnO1−x [39,40]. Secondly, the decoration of Pd Cs is essential in optimizing its performance. We all know that the high catalytic ability of Pd Cs can improve the gas-sensing properties, including increase in gas response and decrease in the working temperature [41,42]. In addition, the electronic sensitization of Pd Cs is clear for improving the gas response and selectivity to CH4. Due to different functions of Pd (5.6 eV) and ZnO (5.2 eV), the electron flow to Pd Cs from ZnO, lead to an increase in the electron depletion layer thickness at the interface between ZnO and Pd, as we can see in Figure 13. The Ra of Pd Cs-2/ZnO1−x is about 10.52 MΩ, which is much higher than that of ZnO and ZnO1−x (4.3 and 2.2 MΩ, respectively). In general, for an n-type MOS sensor, a relative high Ra is good to achieve a higher response; the reason is that the gas response was Ra/Rg. The more Pd Cs that exist on the surface, the more the Ra of the material increases.
Finally, the small sizes of Pd Cs cannot be ignored to improve the performance of our gas-sensing materials [43,44]. As the size of Pd Cs decreases to less 2 nm, the number of exposed surface atoms increases significantly. At the same time, it is accompanied by the changes of surface atomic structure, electronic structure, and surface defects; almost every Pd atom of Pd Cs is participant in the gas-sensing process, resulting in the utilization ratio being much higher. Consequently, there will be more electrons moving to Pd Cs, resulting in a thicker electronics depletion layer of ZnO1−x. In addition, because of the quantum size effect, the surface activity of Pd Cs increases rapidly with a decrease in its size, thus leading to further performance improvement. Figure 14 is the schematic diagram of the gas-sensing mechanism of this process [45].

4. Conclusions

In summary, ZnO1−x NFs with more oxygen vacancies were synthesized by treatment of a H2 atmosphere and decorated with ultra-thin Pd clusters to prepare Pd Cs-2/ZnO1−x gas-sensing materials. It has been found that Pd Cs-2/ZnO1−x gas sensors show enhanced gas-sensing properties to low-concentration CH4 at 260 °C, to 50 ppm CH4, and the response is 5.0; the time of response and recovery are just 16.2 s and 13.8 s, respectively. These enhanced sensing properties are due to catalytic, electronic sensitization and the quantum size effect of ultra-thin Pd clusters, defect engineering, convenient gas diffusion, and the high specific surface area of ZnO nanoflowers as well as their synergistic effect. This work has excellent potential in the detection of low concentration of CH4 for cancer diagnosis.

Author Contributions

Methodology, Y.C.; software, Y.C.; validation, Y.C., W.Z. and N.L.; formal analysis, W.W.; resources, W.W.; writing—original draft preparation, W.Z.; writing—review and editing, J.X.; visualization, W.Z.; project administration, J.X.; funding acquisition, J.X. All authors have read and agreed to the published version of the manuscript.

Funding

This work was supported by Key Basic Research Program of Science and Technology Commission of Shanghai Municipality (20JC1415300).

Institutional Review Board Statement

Not applicable.

Informed Consent Statement

Not applicable.

Data Availability Statement

Not applicable.

Conflicts of Interest

The authors declare no conflict of interest.

References

  1. Ghosh, S.; Roy Chaudhuri, C.; Bhattacharya, R.; Saha, H.; Mukherjee, N. Palladium–Silver-Activated ZnO Surface: Highly Selective Methane Sensor at Reasonably Low Operating Temperature. ACS Appl. Mater. Interfaces 2014, 6, 3879–3887. [Google Scholar] [CrossRef] [PubMed]
  2. Dong, L.; Li, C.; Sanchez, N.P.; Gluszek, A.K.; Tittel, F.K. Compact CH4 sensor system based on a continuous-wave, low power consumption, room temperature interband cascade laser. Appl. Phys. Lett. 2016, 108, 011106. [Google Scholar] [CrossRef] [Green Version]
  3. Zhang, W.; Yuan, T.; Wang, X.; Cheng, Z.; Xu, J. Coal mine gases sensors with dual selectivity at variable temperatures based on a W18O49 ultra-fine nanowires/Pd@Au bimetallic nanoparticles composite. Sens. Actuators B Chem. 2021, 354, 131004. [Google Scholar] [CrossRef]
  4. Haridas, D.; Gupta, V. Enhanced response characteristics of SnO2 thin film based sensors loaded with Pd clusters for methane detection. Sensors Actuators B: Chem. 2012, 166–167, 156–164. [Google Scholar] [CrossRef]
  5. Yuan, T.; Li, Z.; Zhang, W.; Xue, Z.; Wang, X.; Ma, Z.; Fan, Y.; Xu, J.; Yuen, W. Highly sensitive ethanol gas sensor based on ultrathin nanosheets as-sembled Bi2WO6 with composite phase. Sci. Bull. 2019, 64, 595–602. [Google Scholar] [CrossRef] [Green Version]
  6. Li, G.; Wang, X.; Yan, L.; Wang, Y.; Zhang, Z.; Xu, J. PdPt Bimetal-Functionalized SnO2 Nanosheets: Controllable Synthesis and its Dual Selectivity for Detection of Carbon Monoxide and Methane. ACS Appl. Mater. Interfaces 2019, 11, 26116–26126. [Google Scholar] [CrossRef]
  7. Rianjanu, A.; Fauzi, F.; Triyana, K.; Wasisto, H.S. Electrospun Nanofibers for Quartz Crystal Microbalance Gas Sensors: A Review. ACS Appl. Nanomater. 2021, 4, 9957–9975. [Google Scholar] [CrossRef]
  8. Rezki, M.; Septiani, N.L.W.; Iqbal, M.; Adhika, D.R.; Wenten, I.G.; Yuliarto, B. Review—Recent Advance in Multi-Metallic Metal Organic Frameworks (MM-MOFs) and Their Derivatives for Electrochemical Biosensor Application. J. Electrochem. Soc. 2022, 169, 017504. [Google Scholar] [CrossRef]
  9. Tian, W.; Liu, X.; Yu, W. Research Progress of Gas Sensor Based on Graphene and Its Derivatives: A Review. Appl. Sci. 2018, 8, 1118. [Google Scholar] [CrossRef] [Green Version]
  10. Pra, C.; Cra, B.; Is, A.; Jgp, A.; Hpan, A.; Mndsc, C. Molecularly imprinted polymer-based electrochemical sensors for en-vironmental analysis—ScienceDirect. Biosens. Bioelectron. 2010, 172, 112719–112727. [Google Scholar]
  11. Zhou, Q.; Zeng, W.; Chen, W.; Xu, L.; Kumar, R.; Umar, A. High sensitive and low-concentration sulfur dioxide (SO2) gas sensor application of heterostructure NiO-ZnO nanodisks. Sens. Actuators 2019, 298, 126870. [Google Scholar] [CrossRef]
  12. Xu, F.; Zhou, C.; Ho, H.P. A rule for operation temperature selection of a conductometric VOC gas sensor based on ZnO nan-otetrapods. J. Alloy. Compd. 2020, 858, 158294. [Google Scholar] [CrossRef]
  13. Suematsu, K.; Watanabe, K.; Tou, A.; Sun, Y.; Shimanoe, K. Ultraselective Toluene-Gas Sensor: Nanosized Gold Loaded on Zinc Oxide Nanoparticles. Anal. Chem. 2018, 90, 1959–1966. [Google Scholar] [CrossRef]
  14. Qin, Y.; Liu, D.; Zhang, T.; Cui, Z. Ultrasensitive Silicon Nanowire Sensor Developed by a Special Ag Modification Process for Rapid NH3 Detection. ACS Appl. Mater. Interfaces 2017, 9, 28766–28773. [Google Scholar] [CrossRef]
  15. Kim, J.C.; Jun, H.K.; Huh, J.; Lee, D.D. Tin oxide-based methane gas sensor promoted by alumina-supported Pd catalyst. Sens. Actuators B Chem. 1997, 45, 271–277. [Google Scholar] [CrossRef]
  16. Zhang, Y.; Xiang, Q.; Xu, J.; Xu, P.; Pan, Q.; Li, F. Self-assemblies of Pd nanoparticles on the surfaces of single crystal ZnO nan-owires for chemical sensors with enhanced performances. J. Mater. Chem. 2009, 19, 4701–4706. [Google Scholar] [CrossRef]
  17. Wang, Y.; Meng, X.; Yao, M.; Sun, G.; Zhang, Z. Enhanced CH4 sensing properties of Pd modified ZnO nanosheets. Ceram. Int. 2019, 45, 13150–13157. [Google Scholar] [CrossRef]
  18. He, H.; Xue, Y.-Q.; Wang, S.-Q.; Zhu, Q.-Q.; Chen, J.; Li, C.-P.; Du, M. A Double-Walled Bimetal–Organic Framework for Antibiotics Sensing and Size-Selective Catalysis. Inorg. Chem. 2018, 57, 15062–15068. [Google Scholar] [CrossRef]
  19. Su, P.-G.; Yu, J.-H. Enhanced NO2 gas-sensing properties of Au-Ag bimetal decorated MWCNTs/WO3 composite sensor under UV-LED irradiation. Sens. Actuators A Phys. 2019, 303, 111718. [Google Scholar] [CrossRef]
  20. Xing, L.; Ma, C.; Chen, Z.-H.; Chen, Y.-J.; Xue, X.-Y. High gas sensing performance of one-step-synthesized Pd–ZnO nanoflowers due to surface reactions and modifications. Nanotechnology 2011, 22, 215501. [Google Scholar] [CrossRef]
  21. Singh, B.V.; Sapana, R.; Saravanan, R.; Kumari, K.; Raliya, R.; Biswas, P.; Kumar, M. Improved Sensitivity with Low Limit of Detection of a Hydrogen Gas Sensor Based on rGO-Loaded Ni-Doped ZnO Nanostructures. ACS Appl. Mater. Interfaces 2018, 10, 11116–11124. [Google Scholar]
  22. Kim, H.; Jin, C.; Park, S.; Lee, C. Enhanced H2S gas sensing properties of multiple-networked Pd-doped SnO2-core/ZnO-shell nanorod sensors. Mater. Res. Bull. 2012, 47, 2708–2712. [Google Scholar] [CrossRef]
  23. Ning, Y.; Fielding, L.A.; Nutter, J.; Kulak, A.N.; Meldrum, F.C.; Armes, S.P. Spatially Controlled Occlusion of Polymer-Stabilized Gold Nanoparticles within ZnO. Angew. Chem. 2019, 131, 4346–4351. [Google Scholar] [CrossRef]
  24. Zabilskiy, M.; Sushkevich, V.L.; Newton, M.A.; Krumeich, F.; Nachtegaal, M.; Bokhoven, J.A.V. Mechanistic study of carbon dioxide hydrogenation over Pd/ZnO-based catalysts: The role of palladium-zinc alloy in selective methanol synthesis. Angew. Chem. 2021, 133, 17190–17196. [Google Scholar] [CrossRef]
  25. Shon, G.Y.S. Controlling Surface Ligand Density and Core Size of Alkanethiolate-Capped Pd Nanoparticles and Their Effects on Catalysis. Langmuir 2012, 28, 14502–14508. [Google Scholar]
  26. Zhou, H.; Yang, X.; Li, L.; Liu, X.; Huang, Y.; Pan, X.; Wang, A.; Li, J.; Zhang, T. PdZn Intermetallic Nanostructure with Pd–Zn–Pd Ensembles for Highly Active and Chemoselective Semi-Hydrogenation of Acetylene. ACS Catal. 2016, 6, 1054–1061. [Google Scholar] [CrossRef]
  27. Chang, Y.; Xu, J.; Zhang, Y.; Ma, S.; Xin, L.; Zhu, L.; Xu, C. Optical Properties and Photocatalytic Performances of Pd Modified ZnO Samples. J. Phys. Chem. C 2009, 113, 18761–18767. [Google Scholar] [CrossRef]
  28. Platonov, V.; Rumyantseva, M.; Khmelevsky, N.; Gaskov, A. Electrospun ZnO/Pd Nanofibers: CO Sensing and Humidity Effect. Sensors 2020, 20, 7333. [Google Scholar] [CrossRef]
  29. Zhu, Q.; Xie, C. Comparative study of ZnO nanorod array and nanoparticle film in photoelectric response and charge storage. J. Alloys Compd. 2014, 585, 267–276. [Google Scholar] [CrossRef]
  30. Geng, Z.; Kong, X.; Chen, W.; Su, H.; Liu, Y.; Cai, F.; Wang, G.; Zeng, J. Oxygen Vacancies in ZnO Nanosheets Enhance CO 2 Electrochemical Reduction to CO. Angew. Chem. 2018, 130, 6162–6167. [Google Scholar] [CrossRef]
  31. Xue, Z.; Cheng, Z.; Xu, J.; Xiang, Q.; Wang, X.; Xu, J. Controllable Evolution of Dual Defect Zni and VO Associate-Rich ZnO Nanodishes with (0001) Exposed Facet and Its Multiple Sensitization Effect for Ethanol Detection. ACS Appl. Mater. Interfaces 2017, 9, 41559–41567. [Google Scholar] [CrossRef] [PubMed]
  32. Zhang, W.; Fan, Y.; Yuan, T.; Lu, B.; Liu, Y.; Li, Z.; Li, G.; Cheng, Z.; Xu, J. Ultrafine Tungsten Oxide Nanowires: Synthesis and Highly Selective Acetone Sensing and Mechanism Analysis. ACS Appl. Mater. Interfaces 2019, 12, 3755–3763. [Google Scholar] [CrossRef] [PubMed]
  33. Rong, Q.; Xiao, B.; Zeng, J.; Yu, R.; Zi, B.; Zhang, G. Pt Single Atom-Induced Activation Energy and Adsorption En-hancement for an Ultrasensitive ppb-Level Methanol Gas Sensor. ACS Sens. 2021, 7, 199–206. [Google Scholar] [CrossRef] [PubMed]
  34. Drobek, M.; Kim, J.-H.; Bechelany, M.; Vallicari, C.; Julbe, A.; Kim, S.S. MOF-Based Membrane Encapsulated ZnO Nanowires for Enhanced Gas Sensor Selectivity. ACS Appl. Mater. Interfaces 2016, 8, 8323–8328. [Google Scholar] [CrossRef]
  35. Kuang, Q.; Lao, C.; Wang, Z.L.; Xie, Z.; Zheng, L. High-Sensitivity Humidity Sensor Based on a Single SnO2 Nanowire. J. Am. Chem. Soc. 2007, 129, 6070–6071. [Google Scholar] [CrossRef] [Green Version]
  36. Lu, Y.; Jiang, Y.; Gao, X.; Wang, X.; Chen, W. Strongly Coupled Pd Nanotetrahedron/Tungsten Oxide Nanosheet Hybrids with Enhanced Catalytic Activity and Stability as Oxygen Reduction Electrocatalysts. J. Am. Chem. Soc. 2014, 136, 11687–11697. [Google Scholar] [CrossRef]
  37. Koo, W.-T.; Yu, S.; Choi, S.-J.; Jang, J.-S.; Cheong, J.Y.; Kim, I.-D. Nanoscale PdO Catalyst Functionalized Co3O4 Hollow Nanocages Using MOF Templates for Selective Detection of Acetone Molecules in Exhaled Breath. ACS Appl. Mater. Interfaces 2017, 9, 8201–8210. [Google Scholar] [CrossRef]
  38. Barsan, N.; Koziej, D.; Weimar, U. Metal oxide-based gas sensor research: How to? Sens. Actuators B Chem. 2007, 121, 18–35. [Google Scholar] [CrossRef]
  39. Luo, N.; Wang, C.; Zhang, D.; Guo, M.; Wang, X.; Cheng, Z.; Xu, J. Ultralow detection limit MEMS hydrogen sensor based on SnO2 with oxygen vacancies. Sens. Actuators B Chem. 2021, 354, 130982. [Google Scholar] [CrossRef]
  40. Xu, Y.; Zheng, L.; Yang, C.; Zheng, W.; Liu, X.; Zhang, J. Oxygen Vacancies Enabled Porous SnO2 Thin Films for Highly Sensitive Detection of Triethylamine at Room Temperature. ACS Appl. Mater. Interfaces 2020, 12, 20704–20713. [Google Scholar] [CrossRef]
  41. Bhardwaj, R.; Selamneni, V.; Thakur, U.N.; Sahatiya, P.; Hazra, A. Detection and discrimination of volatile organic compounds by noble metal nanoparticle functionalized MoS2 coated biodegradable paper sensors. New J. Chem. 2020, 44, 16613–16625. [Google Scholar] [CrossRef]
  42. Baek, D.-H.; Kim, J. MoS2 gas sensor functionalized by Pd for the detection of hydrogen. Sens. Actuators B Chem. 2017, 250, 686–691. [Google Scholar] [CrossRef]
  43. Penza, M.; Rossi, R.; Alvisi, M.; Cassano, G.; Signore, M.; Serra, E.; Giorgi, R. Pt- and Pd-nanoclusters functionalized carbon nanotubes networked films for sub-ppm gas sensors. Sens. Actuators B Chem. 2008, 135, 289–297. [Google Scholar] [CrossRef]
  44. Ayesh, A.I. Linear hydrogen gas sensors based on bimetallic nanoclusters. J. Alloy. Compd. 2016, 689, 1–5. [Google Scholar] [CrossRef]
  45. Luo, N.; Zhang, B.; Zhang, D.; Xu, J. Enhanced CO sensing properties of Pd modified ZnO porous nanosheets. Chin. Chem. Lett. 2020, 31, 2033–2036. [Google Scholar] [CrossRef]
Scheme 1. Illustration of the synthesis of all gas-sensing materials (ZnO, ZnO1−x, Pd Cs-1/ZnO1−x, Pd Cs-2/ZnO1−x, Pd Cs-3/ZnO1−x).
Coatings 12 00677 sch001
Scheme 2. The illustration of (a) basic sensor structure, and (b) test circuit.
Coatings 12 00677 sch002
Figure 1. XRD patterns of several nanomaterials ((a) ZnO, (b) ZnO1−x, (c) Pd Cs-1/ ZnO1−x, (d) Pd Cs-2/ZnO1−x, (e) Pd Cs-3/ZnO1−x, respectively).
Coatings 12 00677 g001
Figure 2. SEM (a,b), and TEM (c) images of ZnO NFs.
Coatings 12 00677 g002
Figure 3. (a) TEM images of ZnO1x and (b) SEM images of ZnO1x (insert: FFT of ZnO1x).
Coatings 12 00677 g003
Figure 4. (a) TEM, (b,c) HRTEM images of Pd Cs-2/ZnO1−x.
Coatings 12 00677 g004
Figure 5. The EDX elemental mapping data of Pd Cs-2/ZnO1x: (a) TEM image, (b) O element, (c) Zn element, and (d) Pd element.
Coatings 12 00677 g005
Figure 6. TEM images of three nanomaterials ((a) Pd Cs-1/ZnO1x, (b) Pd Cs-2/ZnO1x, and (c) Pd Cs-3/ZnO1x, respectively).
Coatings 12 00677 g006
Figure 7. (a) XPS survey scan for five gas-sensing materials, (b) Zn 2p spectrum of ZnO, ZnO1x and Pd Cs-2/ZnO1x, and (c) Pd 3d spectrum of Pd Cs-2/ZnO1x, respectively.
Coatings 12 00677 g007
Figure 8. O 1s spectra of (a) ZnO, (b) ZnO1x and (c) Pd Cs-2/ZnO1x.
Coatings 12 00677 g008
Figure 9. Photoluminescence spectroscopy of different products (ZnO, ZnO1−x and Pd Cs-2/ZnO1−x, respectively).
Coatings 12 00677 g009
Figure 10. Response of all the sensors to CH4 at different operating temperatures (to 50 ppm, from 200 to 300 °C), 40% RH.
Coatings 12 00677 g010
Figure 11. (a) Sensors’ selectivity: the representative responses of five different gas-sensing materials to different VOCs (50 ppm) at 260 °C, 40% RH. (b) Illustration of relative selectivity of five different sensors (Pd Cs-2/ZnO1−x, Pd Cs-3/ZnO1−x, Pd Cs-1/ZnO1−x, ZnO1−x, and ZnO, respectively).
Coatings 12 00677 g011
Figure 12. (a). Response and recovery curve of Pd Cs-2/ZnO1−x sensor (50 ppm CH4 at 260 °C, 40% RH); (b) The responses to different concentrations of CH4(260 °C, 40% RH, 10~50 ppm) as well as their fitting curve; (c) The relationship between response and response loss ratio, as well as RH (50 ppm CH4 at 260 °C); and (d) The stability of Pd Cs-2/ZnO1−x gas sensor to 50 ppm CH4 within 8 weeks, 40% RH.
Coatings 12 00677 g012
Figure 13. Base resistance in the air of the obtained sensors at 260 °C, 40% RH.
Coatings 12 00677 g013
Figure 14. Illustration of the gas-sensing mechanism.
Coatings 12 00677 g014
Table 1. Details of ZnO XRD characterization information.
(hkl)d (Å)I (f)Grain Size (nm)
31.77(100)2.8451.75.05
34.32(002)2.6342.55.22
36.21(101)2.501004.95
47.23(102)1.9325.15.16
56.30(110)1.6439.24.65
62.22(103)1.4941.25.39
66.38(200)1.426.94.84
67.36(112)1.39325.20
68.62(201)1.3713.85.33
Table 2. Corresponding Percentage of O 1s Peaks among ZnO, ZnO1−x and Pd Cs-2/ZnO1−x, respectively (%).
Type of OxygenZnOZnO1−xPd Cs-2/ZnO1−x
OI (lattice oxygen)68.4061.1862.15
OII (oxygen defects)31.6038.8237.85
Publisher’s Note: MDPI stays neutral with regard to jurisdictional claims in published maps and institutional affiliations.

