Abstract
Thermal-sprayed ceramic coatings are widely used in industry due to their favorable mechanical properties. However, traditional ceramic coatings are prone to failure due to the differences in physical properties between the bonding coating and the ceramic coating. In order to solve this problem, a continuous transition zone was introduced between the ceramic coating and the bonding coating, then air plasma spraying was used to prepare traditional coatings and continuous transition coatings. The Vickers hardness analysis results show that the existence of the continuous transition zone made the change of hardness between the ceramic coating and the bonding coating more gradual. To understand the stress distribution inside the continuous transition coating, models were established to express the interface between ceramic and metal in the continuous transition zone. Simulation analysis found that the existence of the continuous transition zone can significantly reduce the stress gradient inside the coating, and the gradient index of the continuous transition zone also has a great influence on the stress distribution inside the coating model. SEM (Scanning Electron Microscope) analysis found many pores inside the coating; modeling the pores and simulating the influence of pores on the internal stress of the coating showed that the existence of pores inside the coating can reduce the stress gradient at the interface.
1. Introduction
Thermal barrier coatings (TBCs) serving as a thermal insulating layer on the surface of Ni-base superalloys have been widely employed in combustion chambers and turbine blades of gas turbine engines to improve the working temperature and service life of hot section components [1,2]. A typical TBC system has a two-layer structure. Yttria partially stabilized zirconia (YSZ) at 6 wt.%–8 wt.% as a top coat (TC) provides insulation from hot gases, and a metallic bond coat (BC) offers resistance against oxidation [3,4]. Unfortunately, weak bond strengths and high residual stresses between the bond coating and ceramic coating resulting from material properties still remain problems, which can lead to failure of large-scale spallation under thermal load [5,6]. Eventually, the thermal barrier coatings prematurely lose their protective property. In order to reduce the mismatch between BC (bonding coating) and TC (top ceramic coating) and to increase the service life of the coatings, the introduction of thermal barrier coatings with a continuous transition between BC and TC has been proposed. These are commonly known as continuous transition thermal barrier coatings (CT-TBCs) [7], and operate in such a way that there is a continuous change in the properties of the coatings from substrate metal to ceramic coating. At the same time, computer simulation provides a valuable way to investigate the influence on TBCs of coating structure, service conditions and thermomechanical variables. Therefore, in order to predict the life of traditional TBC and CT-TBC and understand their failure mechanisms, computer simulation of thermal stress is an essential tool [8]. A comprehensive study of critical factors in simulating the stress and failure in TBCs was reported by Baker and Seiler [9]. Besides the thermal mismatch and TGO growth, the residual stress depends on several other factors such as microstructure, temperature distribution, interface delamination and preparation method. Based on wavelet analysis of acoustic emission signals, a previous study [10] monitored the fracture process of TBCs under cyclic heating and cooling, and found that under the effect of thermal stress, vertical cracks are prone to occur in the heating stage and interface cracks are prone to appear in the cooling stage. Baig [11] used ANSYS 14.5 to perform finite element analysis to estimate the thermal residual stress generated in the spray coating system. It was found that the axial, radial, and shear stresses of FG-TBC were lower than those of traditional double-layer coatings, and the bonding strength of FG-TBC was almost 1.5 times that of double-layer TBC. Burov [12] used finite element analysis to study the behavior of interfacial cracks in a single-layer thermal barrier coating (TBC). It was found that the interface morphology not only affected the size and distribution of residual stress, but also determined the failure mechanism of the coating. Previous studies have shown that various methods such as air plasma spraying (APS), high-velocity oxygen-fuel (HVOF), low-pressure plasma spraying (LPPS) and electron beam physical vapor deposition (EB-PVD), have been developed to fabricate TBCs [13,14,15]. Different methods have different effects on the structure of the TBCs; particularly, the effects of residual stress on the mechanical properties of TBCs produced by APS have been widely investigated. Qiao [16] found that a plasma-sprayed 8YSZ thermal barrier coating contained many defects such as microcracks and pores. As high temperature heat exposure time increases, the average pore diameter gradually increases. Finite element analysis shows that the complex pore structure inside the coating caused stress concentration, which affected the mechanical properties of the 8YSZ coating. These defects at high temperature and stress concentrations can be considered as the initiation of crack damage and the local source of defect propagation [17]. Wang [18] used the finite element method to simulate the heat transfer behavior of TBC with different pore spaces and geometric characteristics, and the results showed that the thermal insulation effect of TBCs increased with the increase of pore size. Other studies [19] have also shown that the existence of voids can increase the thermal insulation properties of the coating. It should be noted that the computed stress state is governed by simulation parameters. A metal–ceramics mix in a certain ratio of interface geometry with a constant thickness is generally used to represent a unit of continuous transition area. However, the real continuous transition area is very complicated, comprising regions with pores of different sizes and convex or concave phase interfaces of metal–ceramics mix. The use of an idealized geometry may therefore underestimate the stress state. Furthermore, based on previous research, we found that the phase boundary inside the coating is the area most prone to failure. However, current research on residual stresses of thermal barrier coatings has focused on single gradient coatings, the phase boundary of metal–ceramic mix in the gradient region was often neglected in evaluation of properties and internal stress of coatings.
Based on the fact that the continuous transition ceramic–metal area is comprised of regions with pores and phase boundary, the main motivation of this work has been to investigate the influence of gradient index and pores on the properties and internal stress of continuous transition ceramic–metal coating by computer simulation and experimental data. In this work, a traditional coating and a continuous transition coating were prepared by air plasma spraying and the Vickers hardness of the different structures (traditional coating and continuous transition coating) was investigated. ANSYS was employed to simulate the thermal stress in continuous transition ceramic-metal coating. To evaluate the effect of gradient index and pores on the properties and stress of the coating, two models of the continuous transition ceramic–metal coating were analyzed: an idealized structure (S1) and a considering phase boundary structure (S2).
2. Experimental Procedure
2.1. Materials and Methods
The substrate used in this study was a Ni-based superalloy GH4099 disc with a thickness of 3 mm and a diameter of 25 mm. Before spraying, the surface of the substrate was sandblasted. CoNiCrAlY (AMDRY 9954, Oerlikon Metco, Shanghai, China) was used as the bonding coating powder, with particle size distribution in the range of 11–63 µm. 8YSZ (Metco 204B-NS, Oerlikon Metco, Shanghai, China) was used as the ceramic coating powder, with particle size distribution in the range of 45–75 µm. The nominal compositions of GH4099 and CoNiCrAlY are given in Table 1 and Table 2. An SX-80 air plasma spraying system (Guangzhou Sanxin Metal S&T COM, LTD, Guangzhou, China) was used to prepare the 8YSZ duplex-coating and continuous transformation thermal barrier coatings. The plasma spray parameters used for depositing coatings are given in Table 3. Bonding coating and a continuous transformation zone with a thickness of 100 µm, and ceramic top coating with a thickness of about 200 µm were each sprayed on the substrate, respectively. After spraying, all samples were heated to 1373 K at a heating rate of 5 K/min and kept there for 5 h, then cooled in the furnace.

Table 1.
Physical parameters of metal and ceramic bonding coatings [13,14,17,18].

Table 2.
The nominal composition of GH4099.

Table 3.
The specific spraying process parameters.
2.2. Microstructure and Hardness Characterization
All specimens were cut using a metallographic cutting machine, and the cross sections were ground and polished. The coatings were characterized by a scanning electron microscope (JEOL, Tokyo, Japan, Model JSM 6490 LA) operated at 20 kV and coupled with an energy dispersive spectrometer (EDS). The samples were also gold sputtered (~290 Å thick) using an ion sputtering device (JEOL-Japan, Model JFC-1500), after observation under SEM. Vickers hardness testing of the coatings was carried out using a Vickers Indenter (Jiangsu Nanguang Electronic Technology Co., Ltd., Jiangsu, China, Model DHV-1000Z) with 1 N load and 15 s loading time.
2.3. Finite Element Analysis (FEA) Modelling
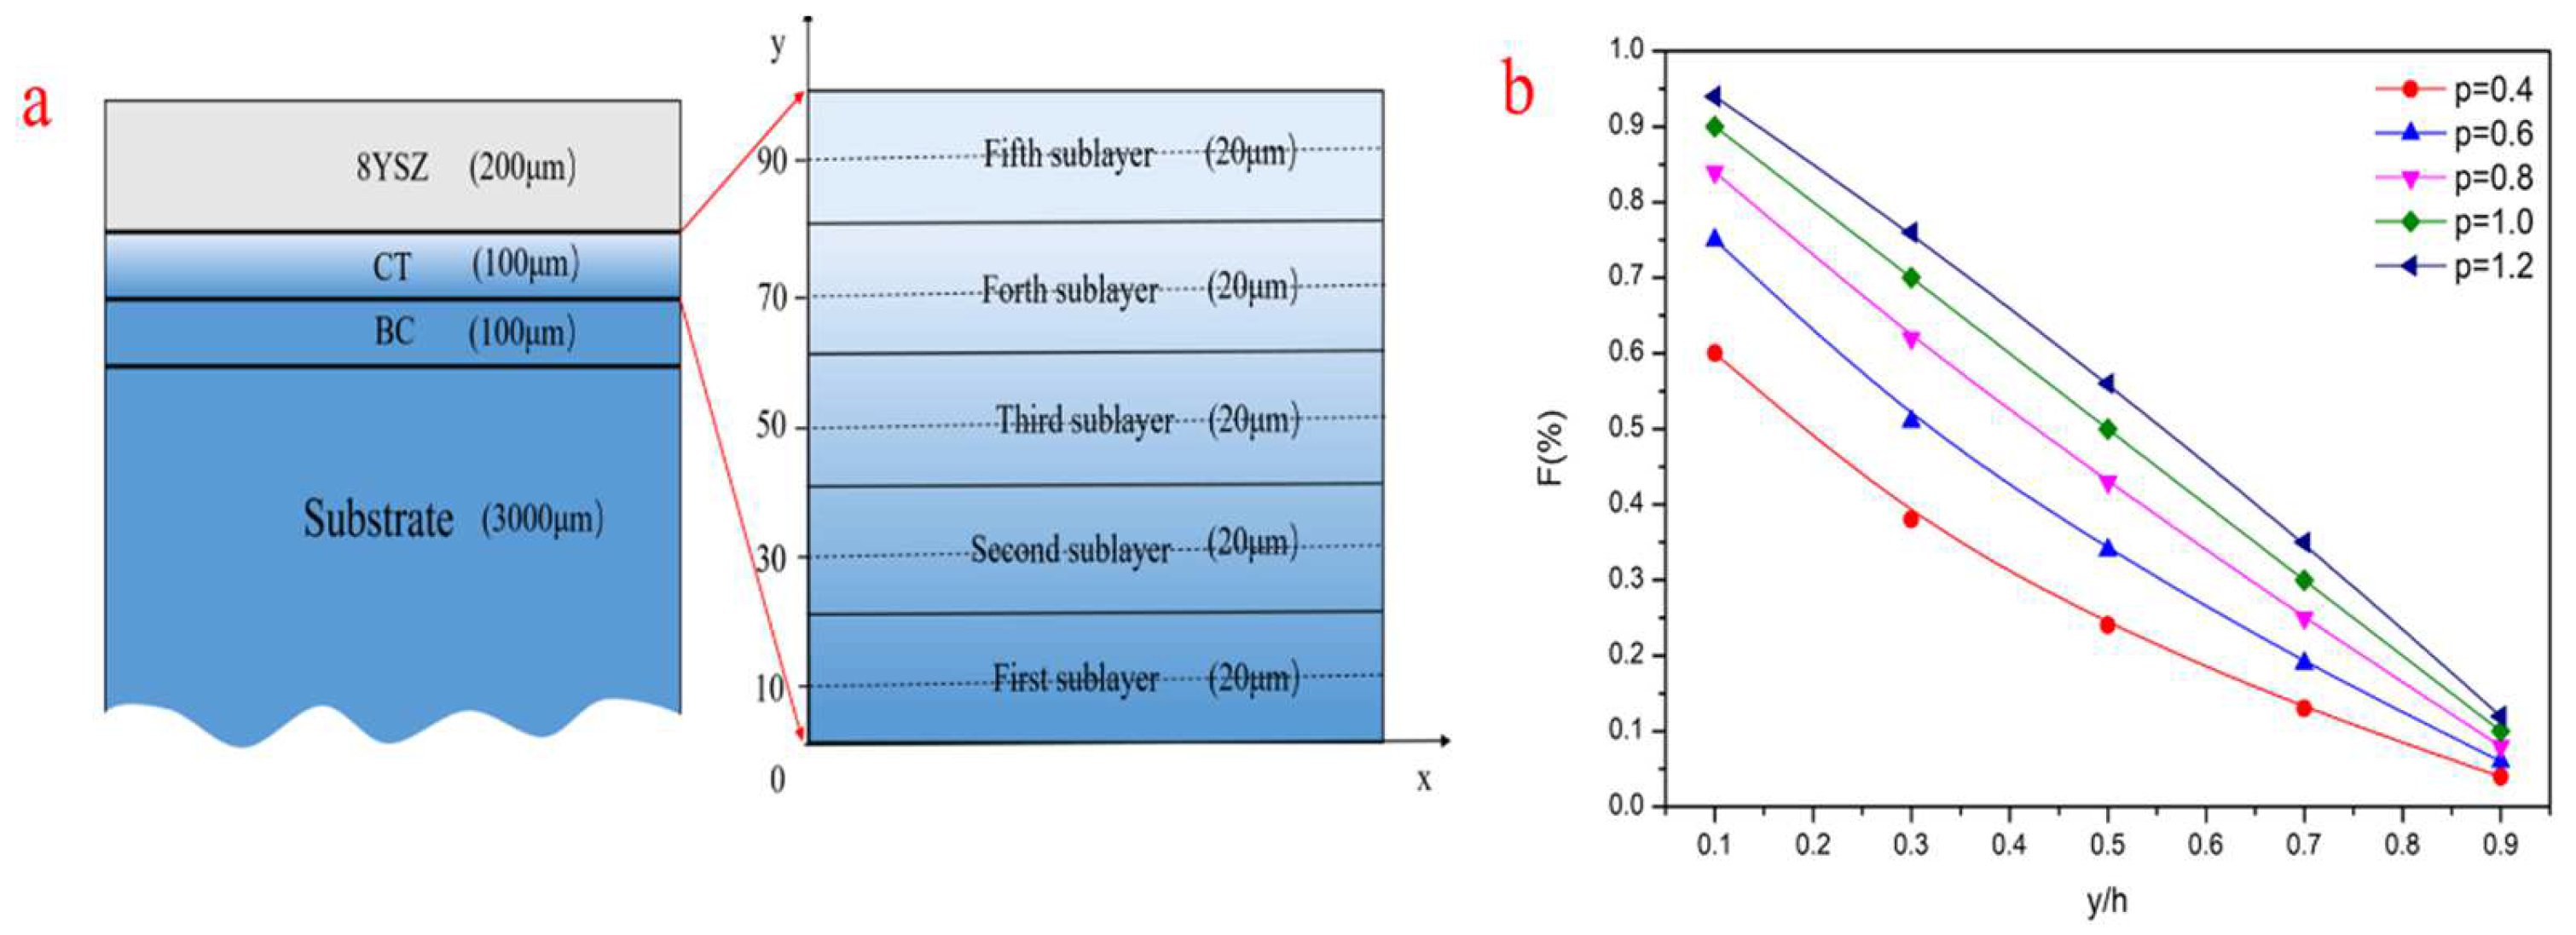
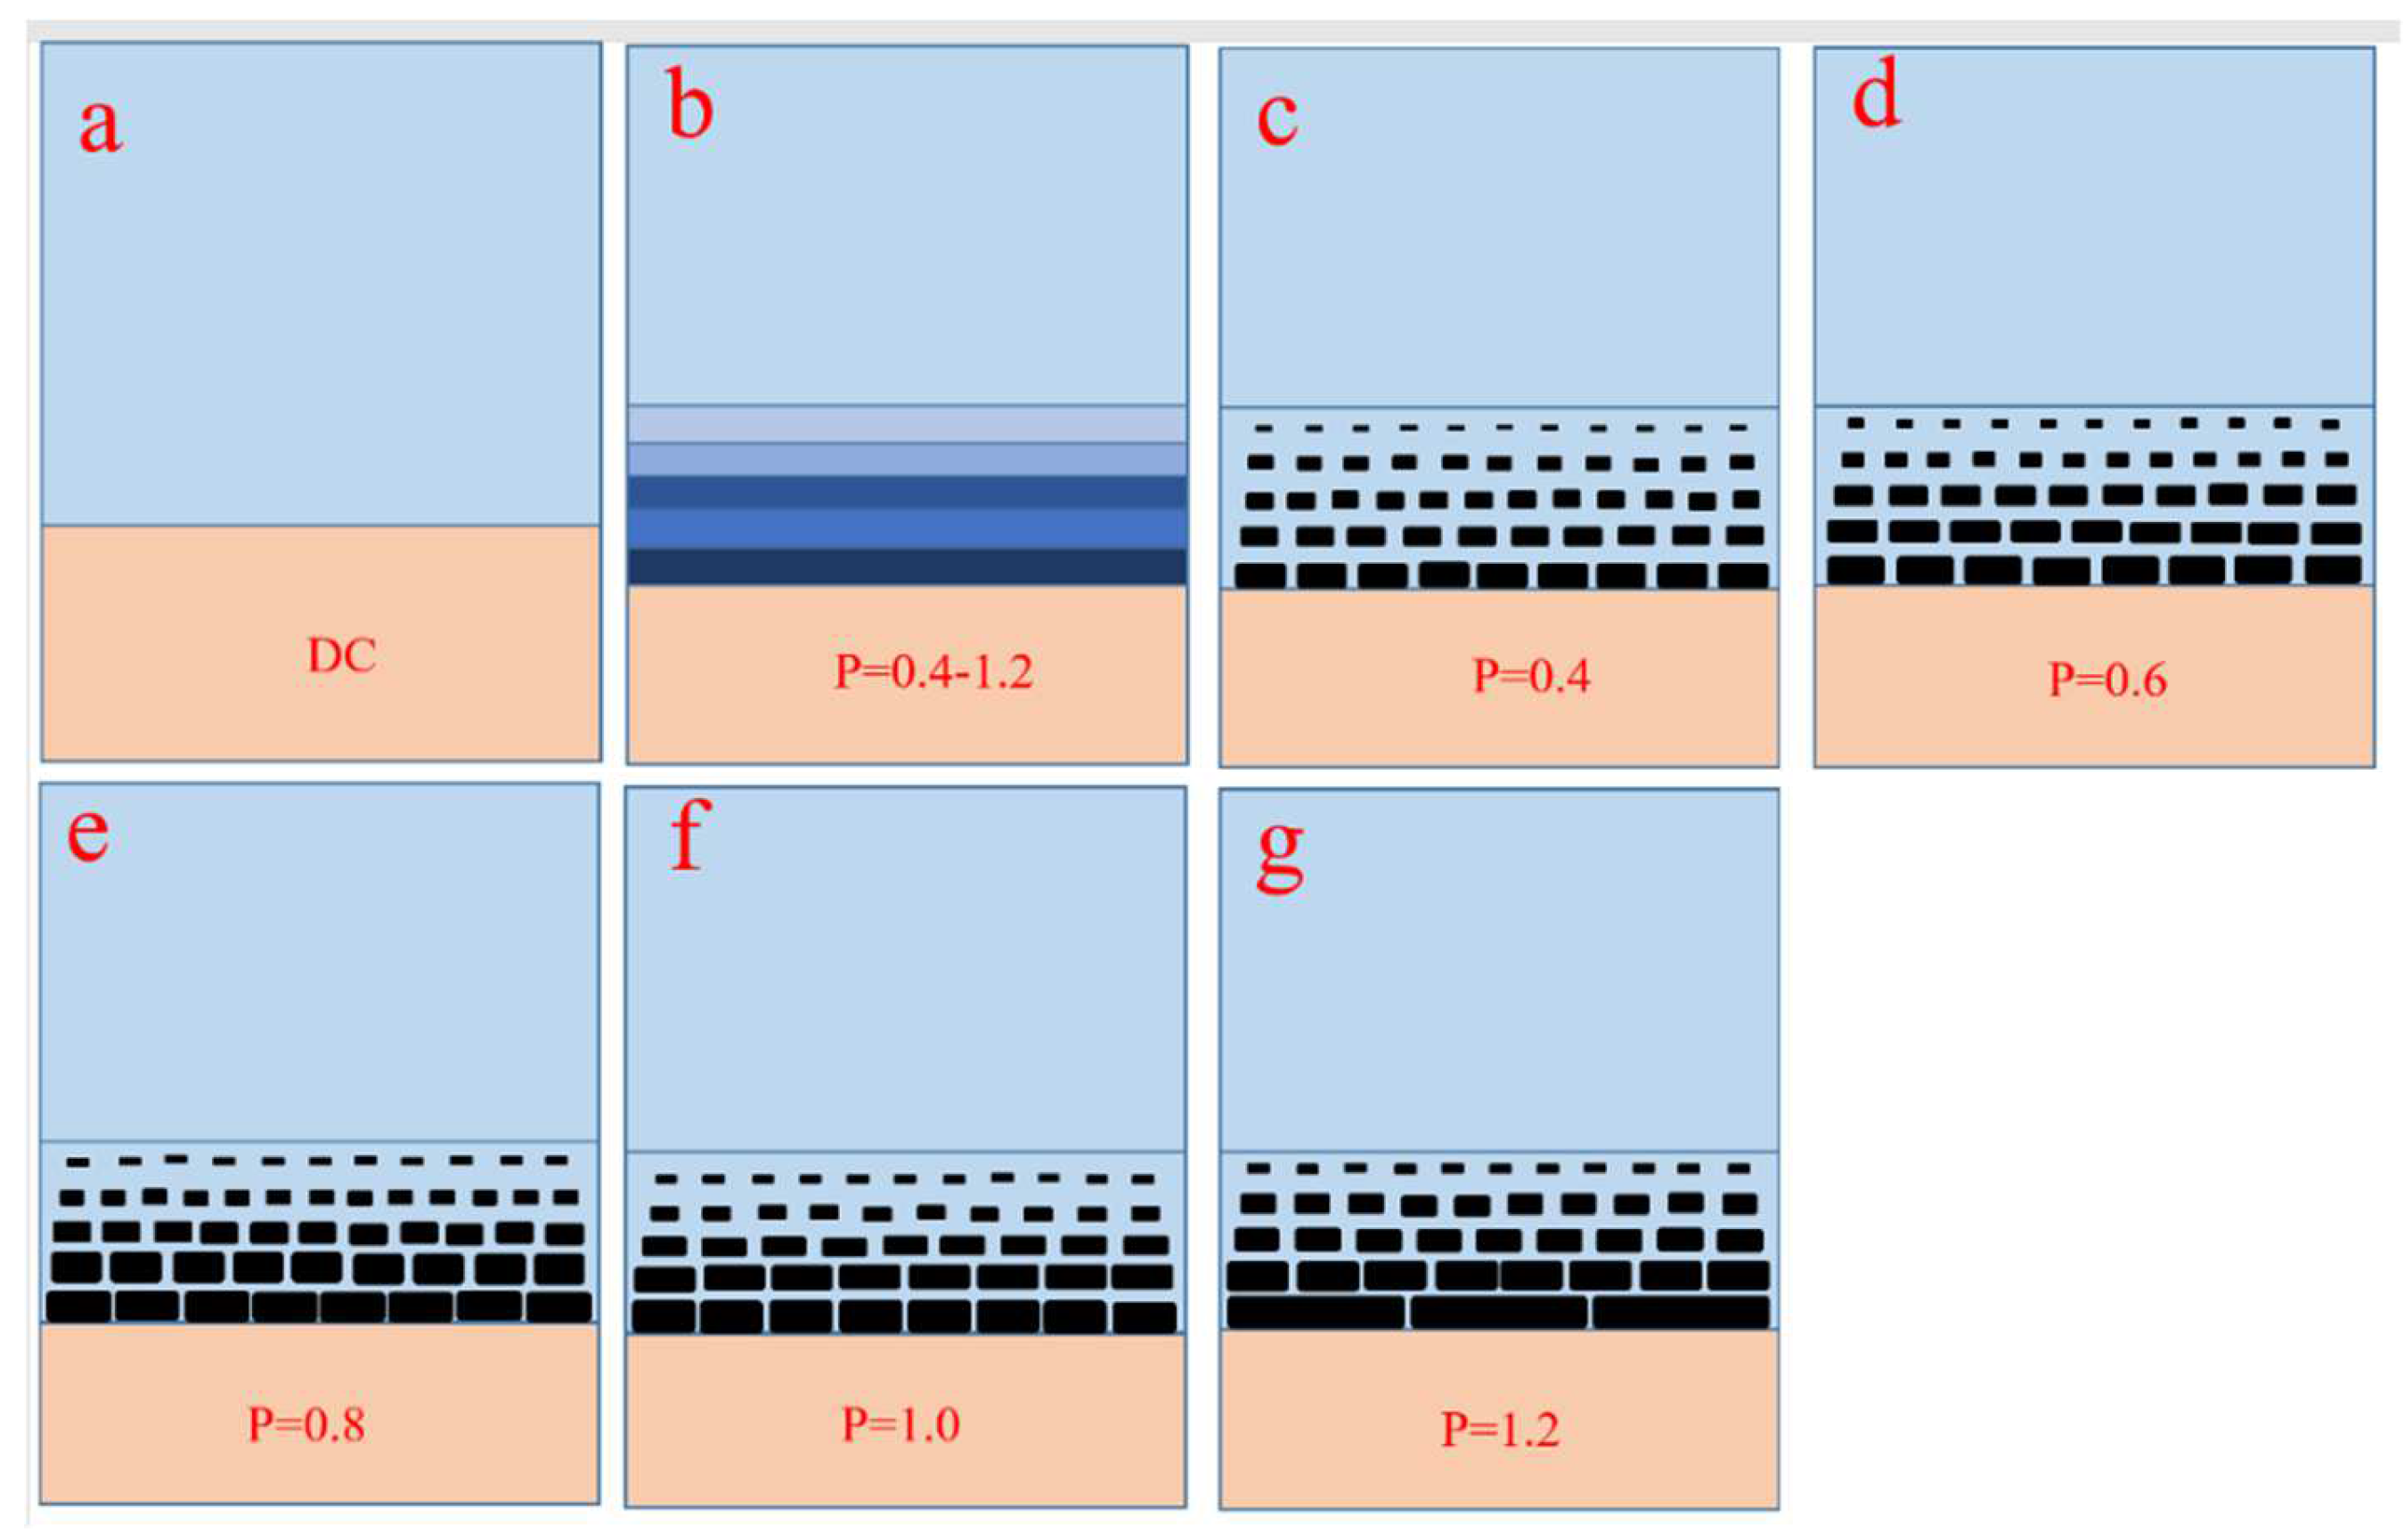
Creo Elements was employed to build the models. In order to reduce the amount of calculation, two-dimensional models based on the actual coating size of all coatings were established for analysis. It was assumed that all interfaces were flat, and the effect of sandblasting before the deposition process was ignored. For continuous transition coatings, the gradient index was introduced, and two series of models were established based on the gradient index. The schematic diagram of continuous transition coating is shown in Figure 1a. The continuous transition zone with a thickness of 100 microns was divided into 5 sub-coatings, and the volume fraction of metal and ceramic in each sub-coating was determined by the gradient index and the distance from the bonding coating. The volume fraction of ceramic in each sub-coating was calculated according to formula (1). For the first series of continuous transition zone models (abbreviated as S1), the continuous transition zone with a thickness of 100 microns was divided into 5 sub-coatings with boundaries. The physical parameters of each sub-coating were calculated with formula (2) [20] and formula (3), and the physical parameters [21,22,23] of the metal bonding coating and the ceramic coating are shown in Table 1. For the second series continuous transition zone model (abbreviated as S2), based on previous work we found that the phase boundary inside the coating is the area most prone to failure. For this reason, when modeling, special attention was paid to the interface between metal and ceramic in the continuous transition zone. Therefore, when modeling, the 100 μm thick continuous transition zone was divided into 5 invisible sub-coatings without boundaries, using ceramic as the matrix, and the metal content of each sub-coating was the same as the first series models. Then, on the ceramic substrate, rectangular holes were dug according to the metal content of each sub-coating and filled with metal. In this way, a model that could vividly describe the microstructure of the coating was obtained. For the continuous transition zone model of S1 and S2, models with gradient index P from 0.4 to 1.2 were constructed, and the change of metal content in each sub-coating is shown in Figure 2b. The models are shown in Figure 2 (a stands for traditional duplex coating, b stands for S1 with P = 0.4–1.2, c–g stands for S2 with P = 0.4–1.2.). Then, the models were converted into a suitable format and imported into ANSYS for thermal structural coupling analysis.
where is the volume fraction of ceramic in each sub-coating; t is the thickness of the continuous transition zone, set to 100 μm; P is the gradient index of continuous transition zone, P = 0.4–1.2; y is the distance from the center line of each sub-coating to the metal bonding coating, y = 10–90 μm.
where is physical parameters of each sub-coating; is the volume fraction of ceramic in each sub-coating; and are the physical parameters of ceramic and metal, including density, Young’s modulus, Poisson’s rate, coefficient of thermal expansion and heat capacity; 1 − is the volume fraction of metal in each sub-coating. For thermal conductivity, the calculation formula is as formula (3).
where is thermal conductivity of each sub-coating; is the volume fraction of ceramic in each sub-coating; is thermal conductivity of ceramic; is thermal conductivity of metal.

Figure 1.
Schematic diagram of continuous transition coating structure (a), volume fraction of metal in each sub-coating under different gradient indices in the continuous transition zone (b).

Figure 2.
Model of traditional coating (a) and continuous transition coating ((b): S1, (c–g): S2).
2.4. Finite Element Analysis (FEA)
The thermal stress distributions of duplexes S1 and S2 were analyzed by FEM (ANSYS workbench 19.0). A coupled thermal-structural finite element analysis model was employed in ANAYS. Then corresponding material types were chosen for different coatings and a fine grid was used for meshing the model due to solid entities, thereby generating regular and computationally well-behaving mesh. For all coating systems, materials in all models were treated as homogeneous and isotropic. After applying a temperature load on the upper surface of the ceramic and applying heat dissipation conditions on the base metal coating, the heating rate was 10 K per second, the holding temperature was 1273 K, and the cooling rate was twice the heating rate, because previous studies have shown that failure often occurs at the cooling stage [24,25,26]. The bottom of the substrate was maintained at 298 K, so temperature distribution in the coating system was obtained. Structural constraints were then imposed on the coating system and the temperature distribution of the coating system was introduced into the structural model. In this way, through calculation, stress distribution maps were obtained for each of the coatings. In order to better understand the change law for the internal stress of each coating system in the thickness direction, the symmetry axis of each coating in the vertical direction was set as the path for solution and analysis.
3. Results and Discussions
3.1. The Microstructure of DC and CT
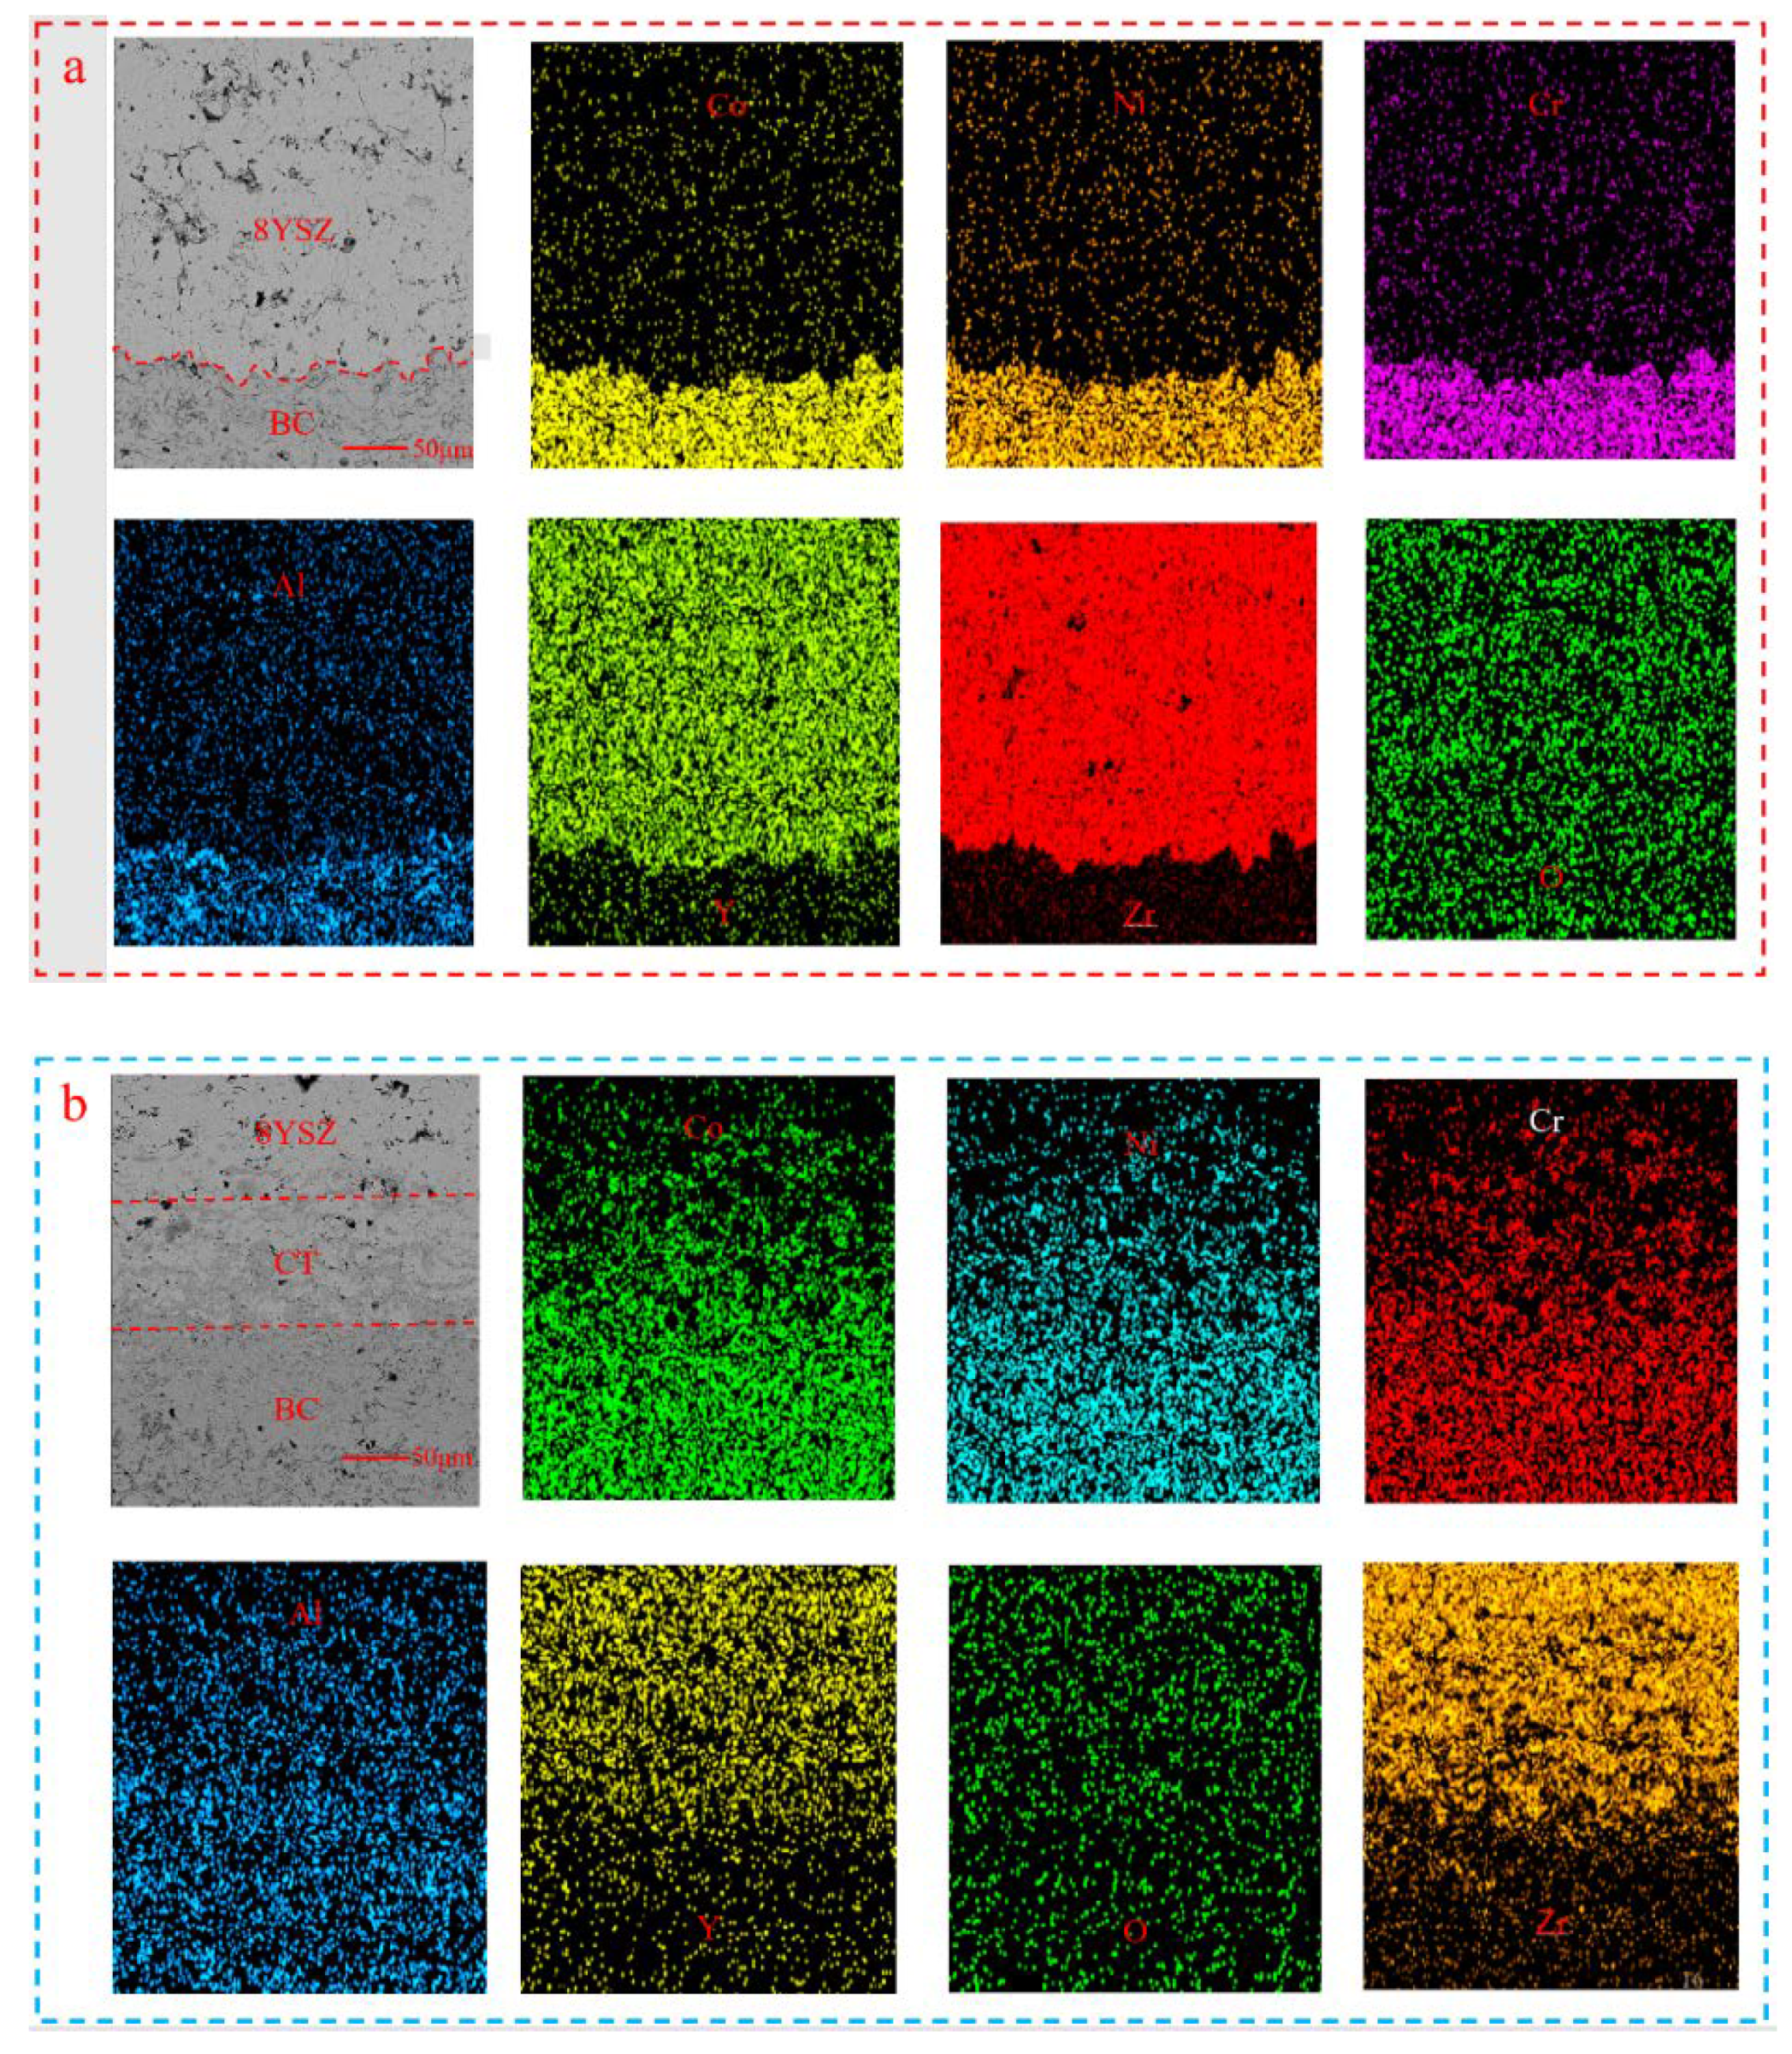
Scanning electron microscopy (SEM) was performed on all samples. The micromorphology and elements distribution of the traditional coating is shown in Figure 3a, and those of the continuous transition coating are shown in Figure 3b. The transition coating consists of three sections: the bond coating, the obvious gradient region between the ceramic coating and alloy bond coating, and the outer ceramic coating. At the gradient region, CoNiCrAlY splats were inserted into the ceramic region, which made the interface between the top ceramic coating and the alloy bond coating disappear. During the spraying process, the molten droplets formed by ceramic and metal powders were non-uniformly distributed in the flame, resulting in a staggered deposition of metal–ceramic mix. However, there was no metal–ceramic mix zone inside the conventional double-layer coating, and there was a clear bonding interface between the bonding layer and the ceramic layer. Figure 3b shows the distribution of elements in the cross-section of the traditional coating. There is a gradual change in composition from the outer layer to the inner layer within the coating. The elements Zr and Y showed an increase from the bond coating to the ceramic coating. Conversely, the elements Co, Ni, Cr and Al decreased. The elements were not evenly distributed in the gradient region because of the structure of the metal–ceramic mix. For the traditional coating, the distribution of elements in the coating system had a clear interface, which coincided with the microscopic interface of the coating.

Figure 3.
SEM image and element distribution of traditional coating (a) and continuous transition coating (b).
3.2. Vickers Hardness of DC and CT
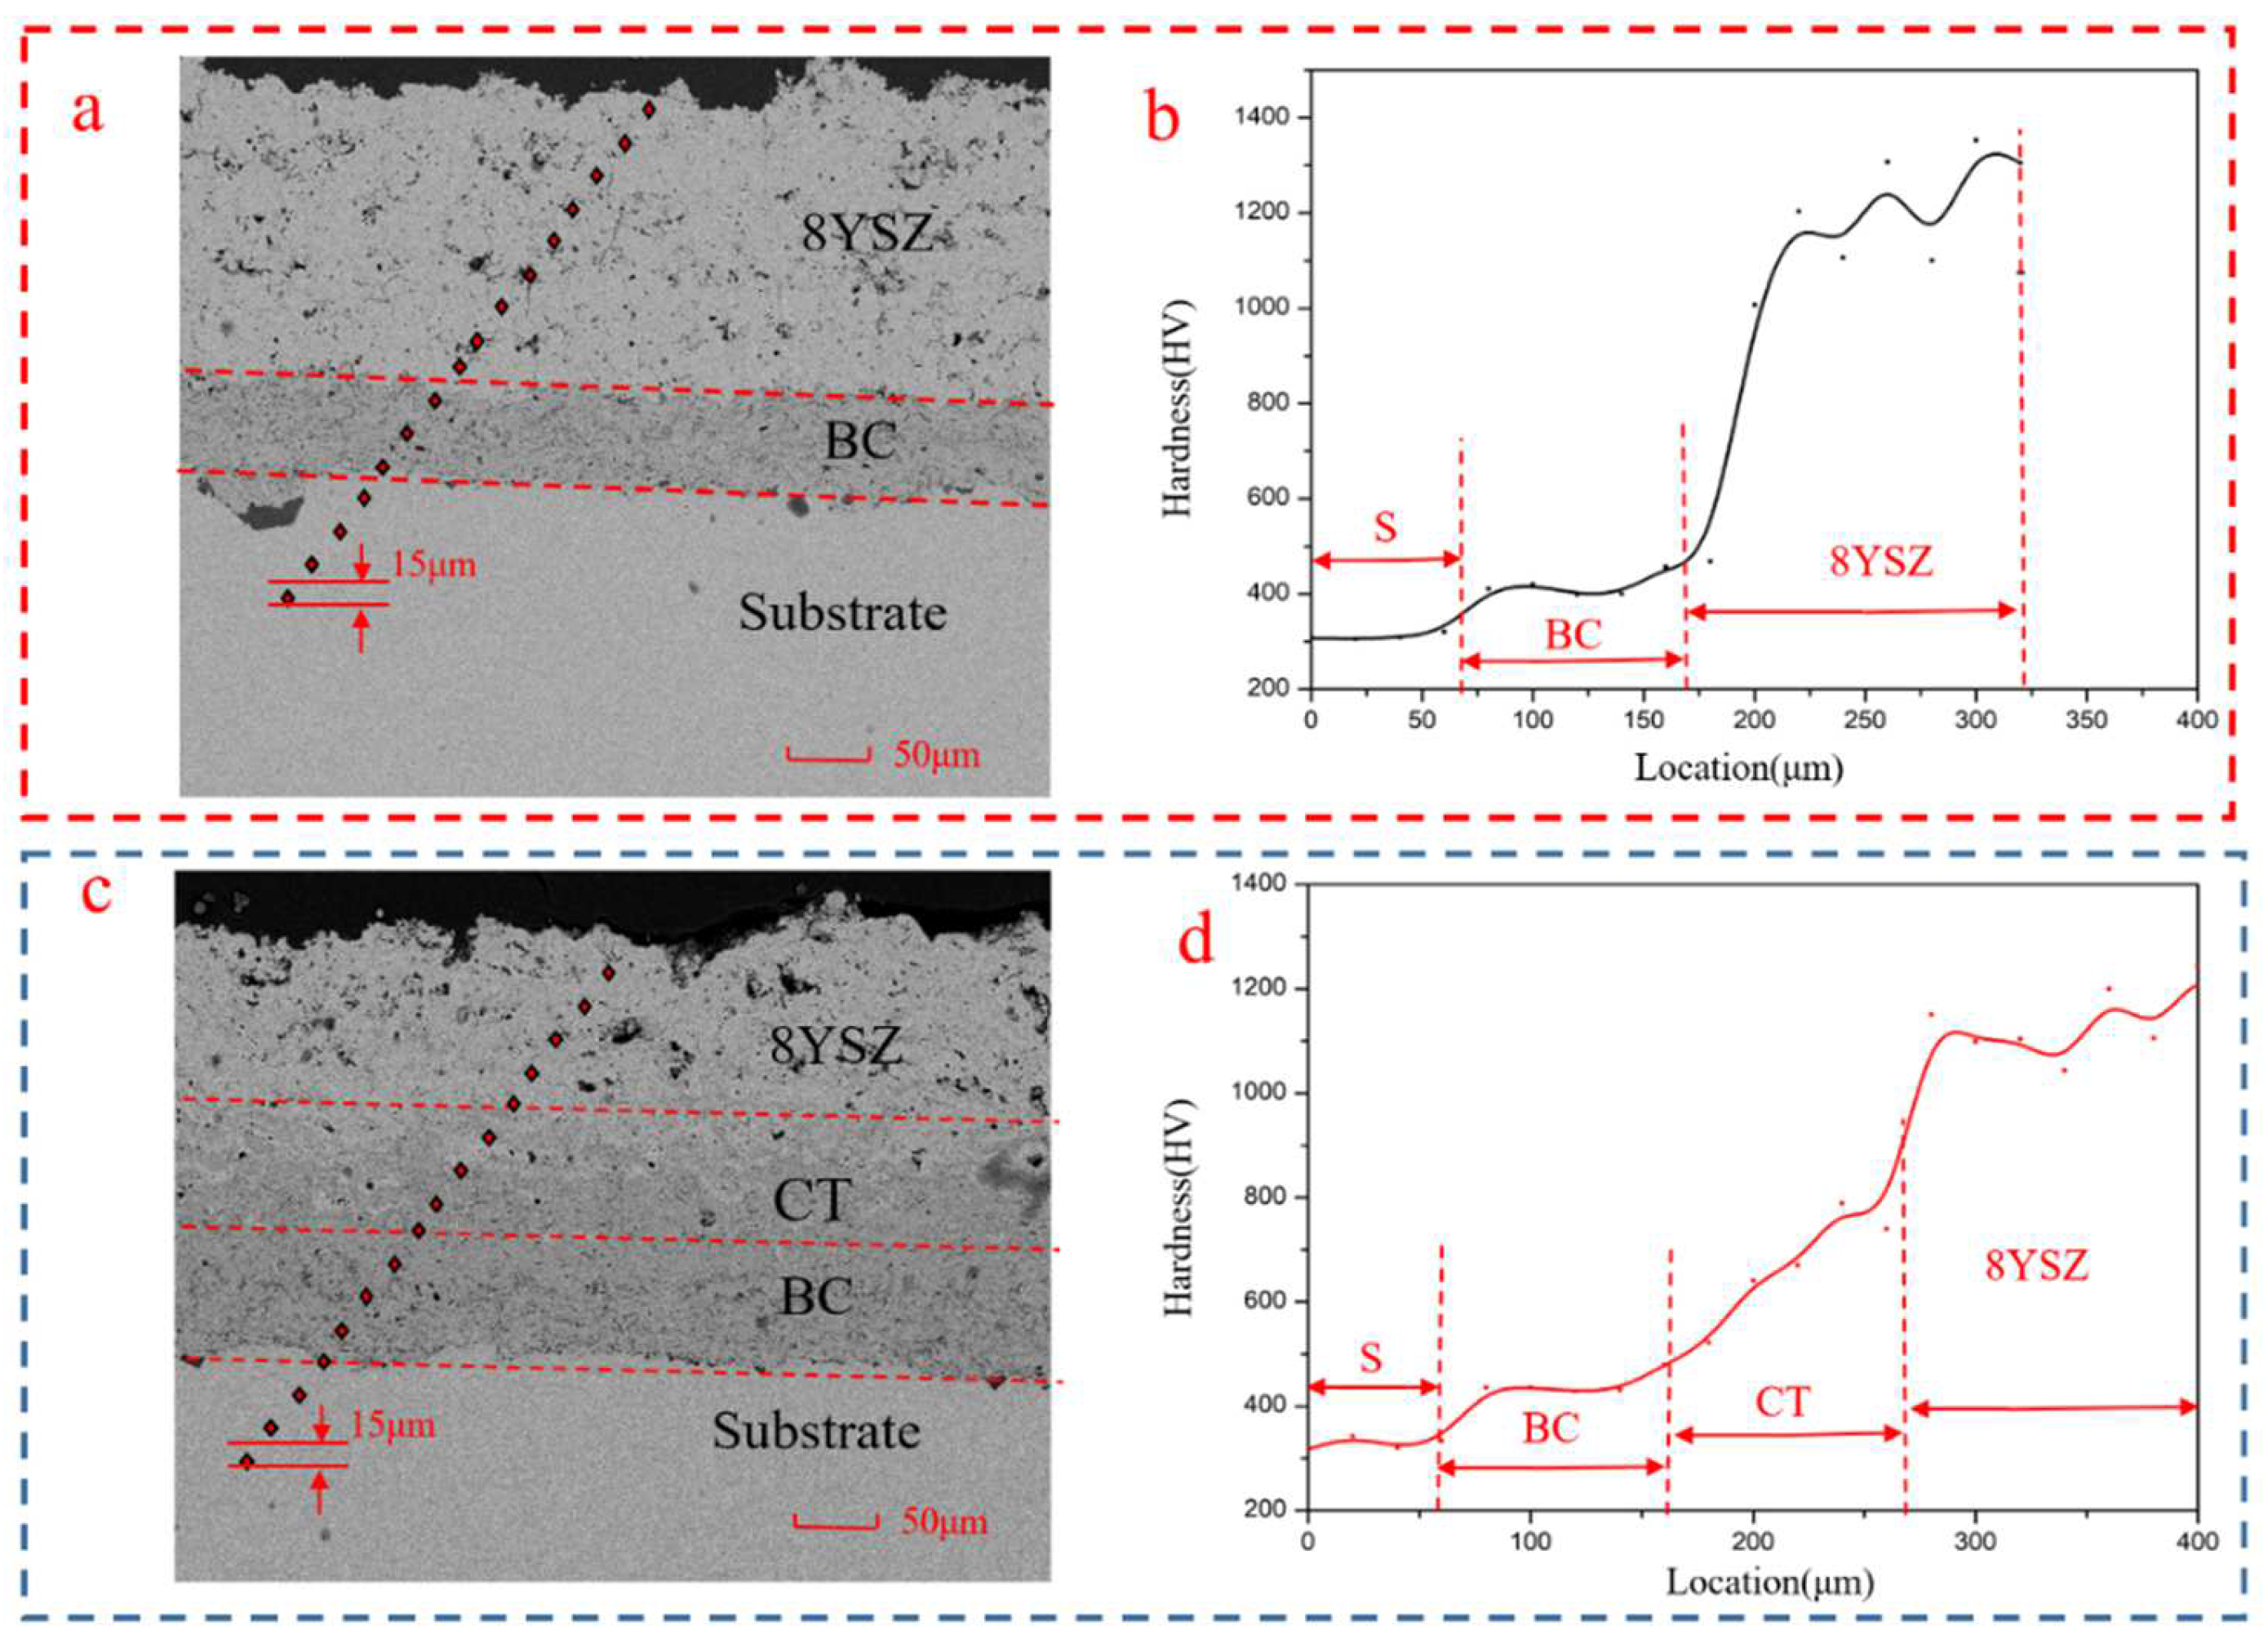
The hardness of the material can reflect the elastic modulus and strength of the coating. In the coating system, continuous change of coating strength can reduce stress in the coating interface. Vickers hardness analysis was carried out on the prepared traditional coating and the continuous transition coating; the hardness analysis interval is shown in Figure 4a,c, and the test results are shown in Figure 4b,d. The hardness of GH4099 was about 300 HV0.1, the hardness of the bonding coating was about 400 HV0.1, and the hardness of the ceramic coating was about 1200 HV0.1. For traditional coatings, the hardness of the interface between the ceramic coating and the bonding coating was very different, reaching 800 HV0.1. Hardness variation was very high because there was no stress buffer between the ceramic coating and the alloy coating. Such a large difference in hardness was the main reason for the failure of the interface between the bonding coating and the ceramic coating [27]. As for the continuous transition coating system, shown in Figure 4d, due to the existence of the continuous transition zone, the hardness change between the ceramic coating and the bonding coating was more moderate, which was beneficial to the life of the coating [28].

Figure 4.
SEM image of traditional coating (a) and continuous transition coating (c), Vickers hardness of traditional coating (b) and continuous transition coating (d).
3.3. Thermal Stress Distribution of DC and S1
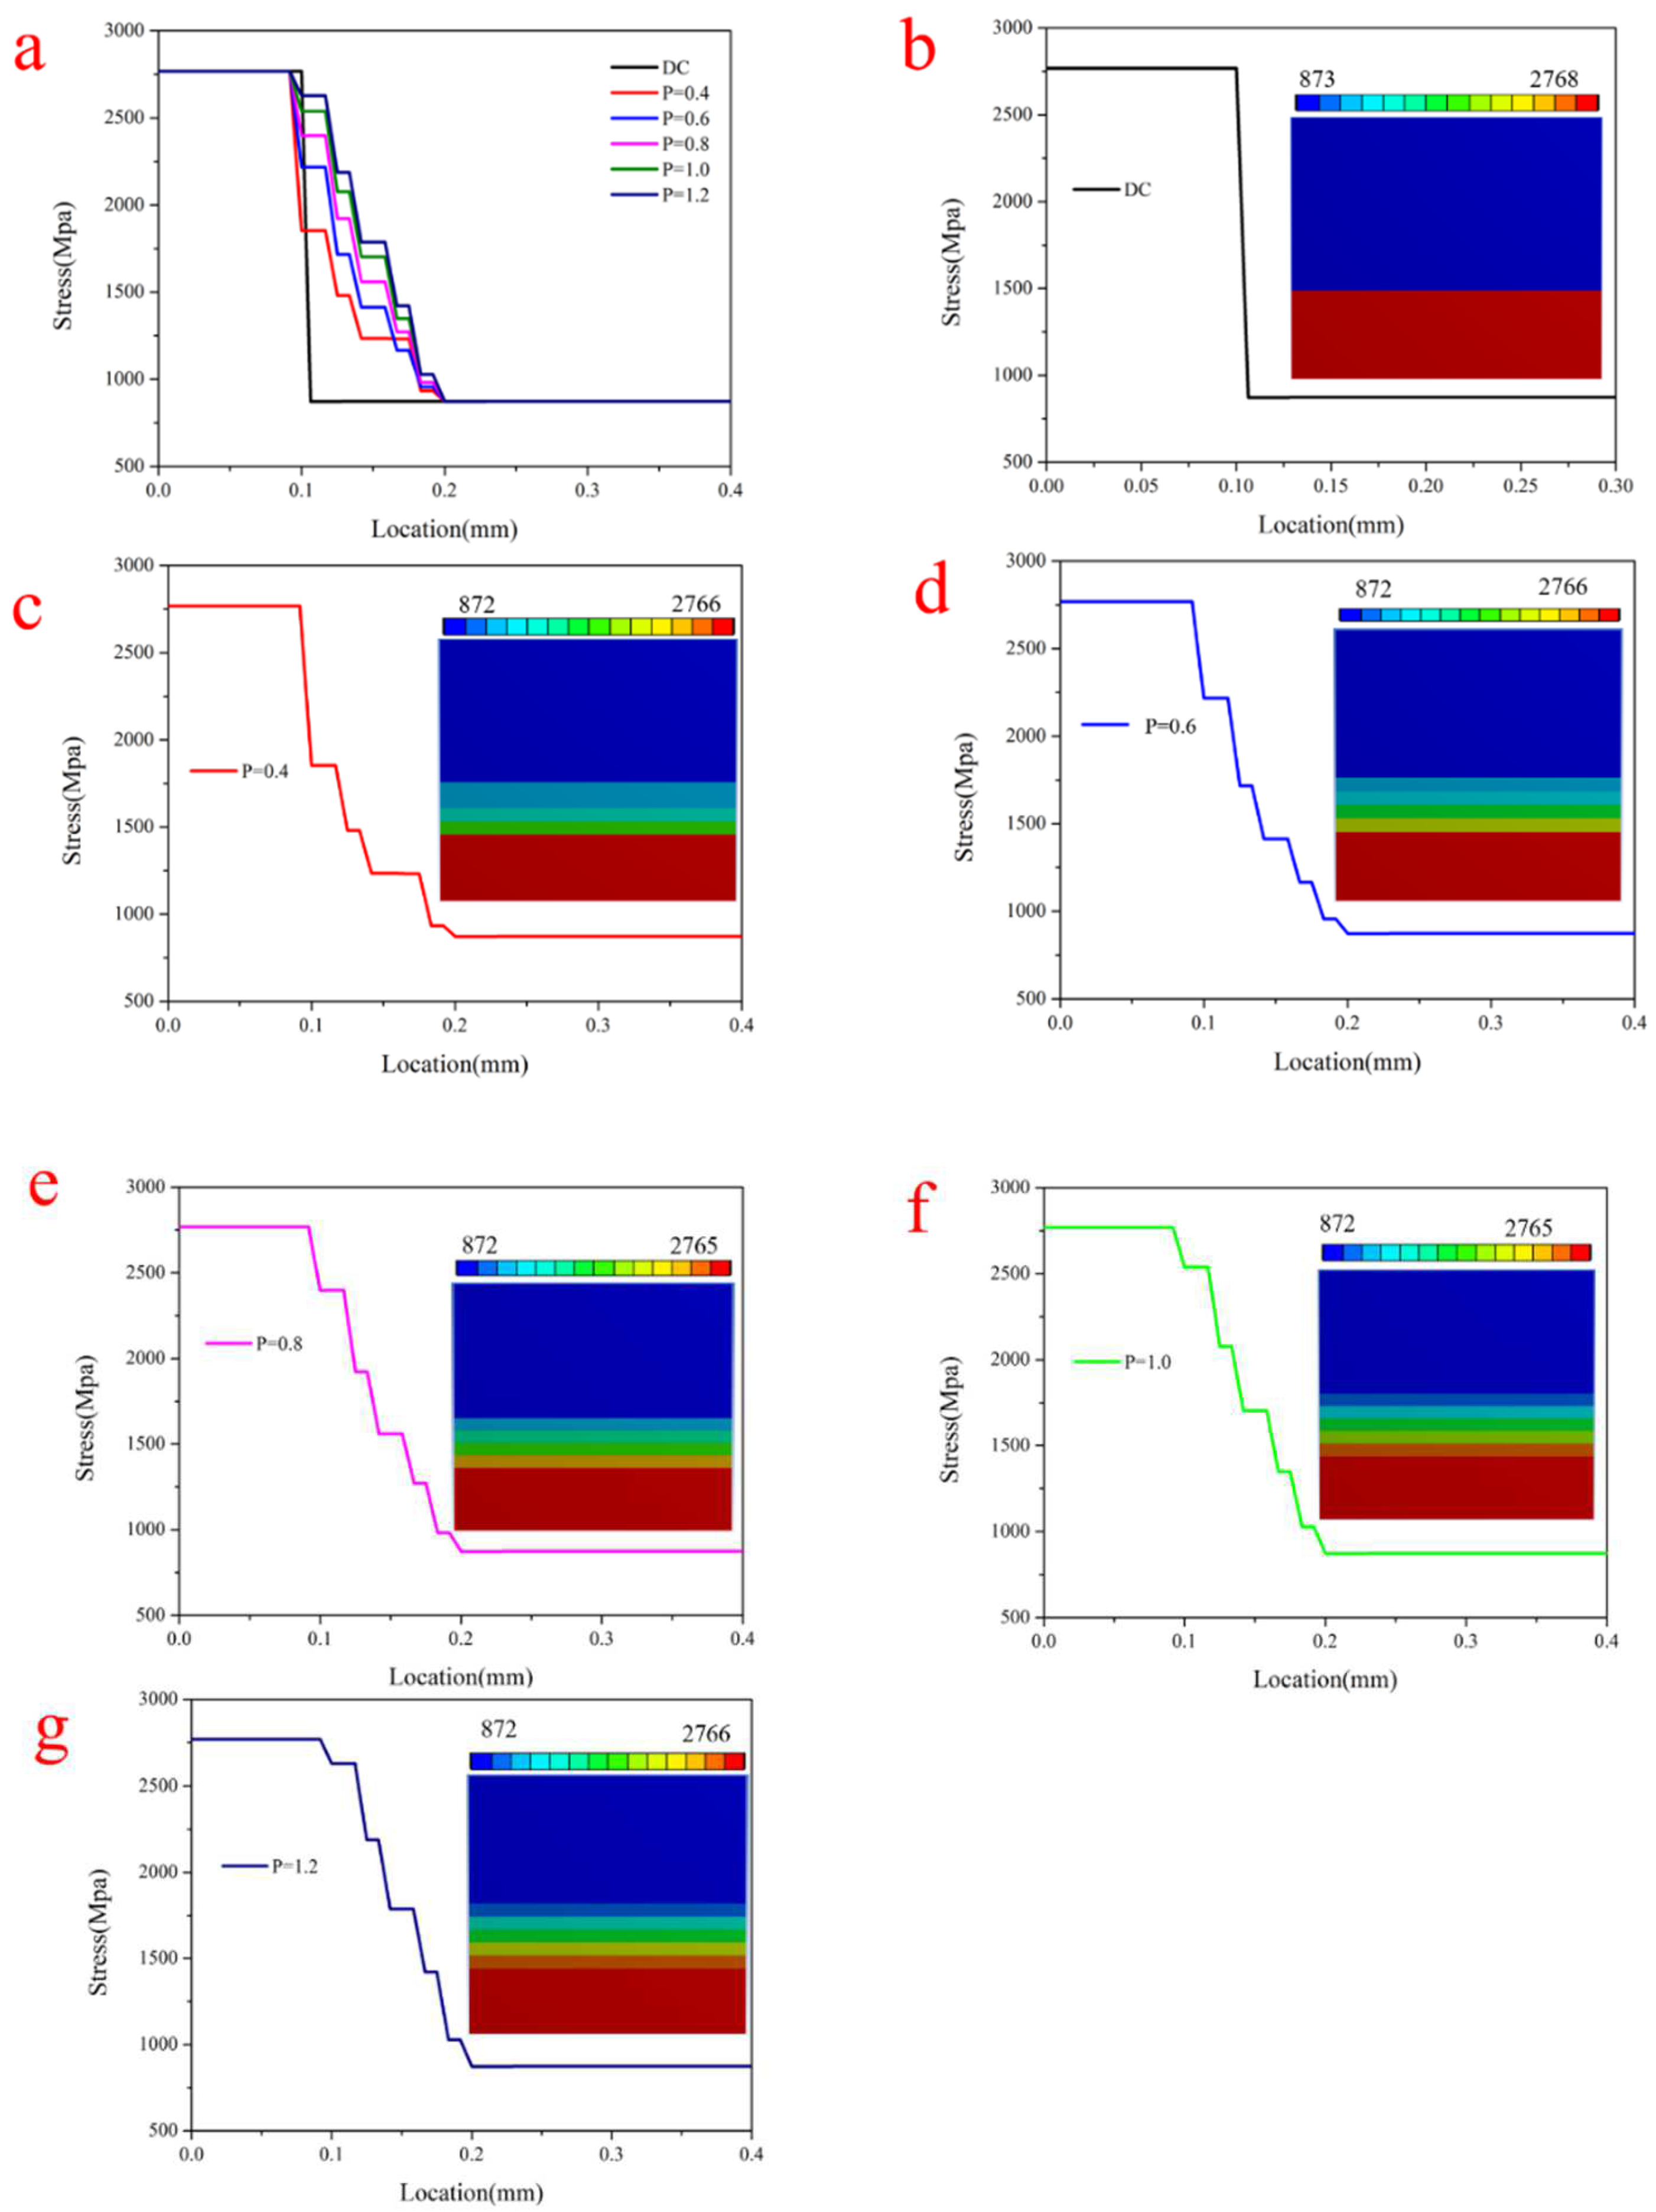
Figure 5a shows the thermal stress distribution of the traditional coating, and Figure 5b–f shows the thermal stress distribution of S1. In general, the traditional coating showed a large stress change at the interface between the bonding coating and the ceramic coating. The stress of the ceramic coating was 687 MPa, that of the bonding coating was 2768 MPa, so the interfacial stress showed a gap of more than 2000 MPa. Such a large stress gradient easily causes the coating to peel off [29]. For all S1 continuous transition coatings, compared to the traditional coating, the maximum and minimum internal stress of the continuous transition coating system did not change greatly. The internal stress change in the overall coating was relatively gentle, and the stress change inside each coating varied with gradient index. Therefore, the internal stress gradient of the coating system was relatively small, which successfully buffered the thermal stress during service. Compared the gradient index of other coating systems, when the gradient index was 1.0, the stress change inside the coating was the gentlest, and a gentler stress change greatly increases the life of the coating, which is very important for ceramic coatings.

Figure 5.
Stress distribution of the model along the vertical axis of symmetry (a), thermal stress distribution of traditional coating (b) and S1 (c–g).
3.4. Thermal Stress Distribution of DC and S2
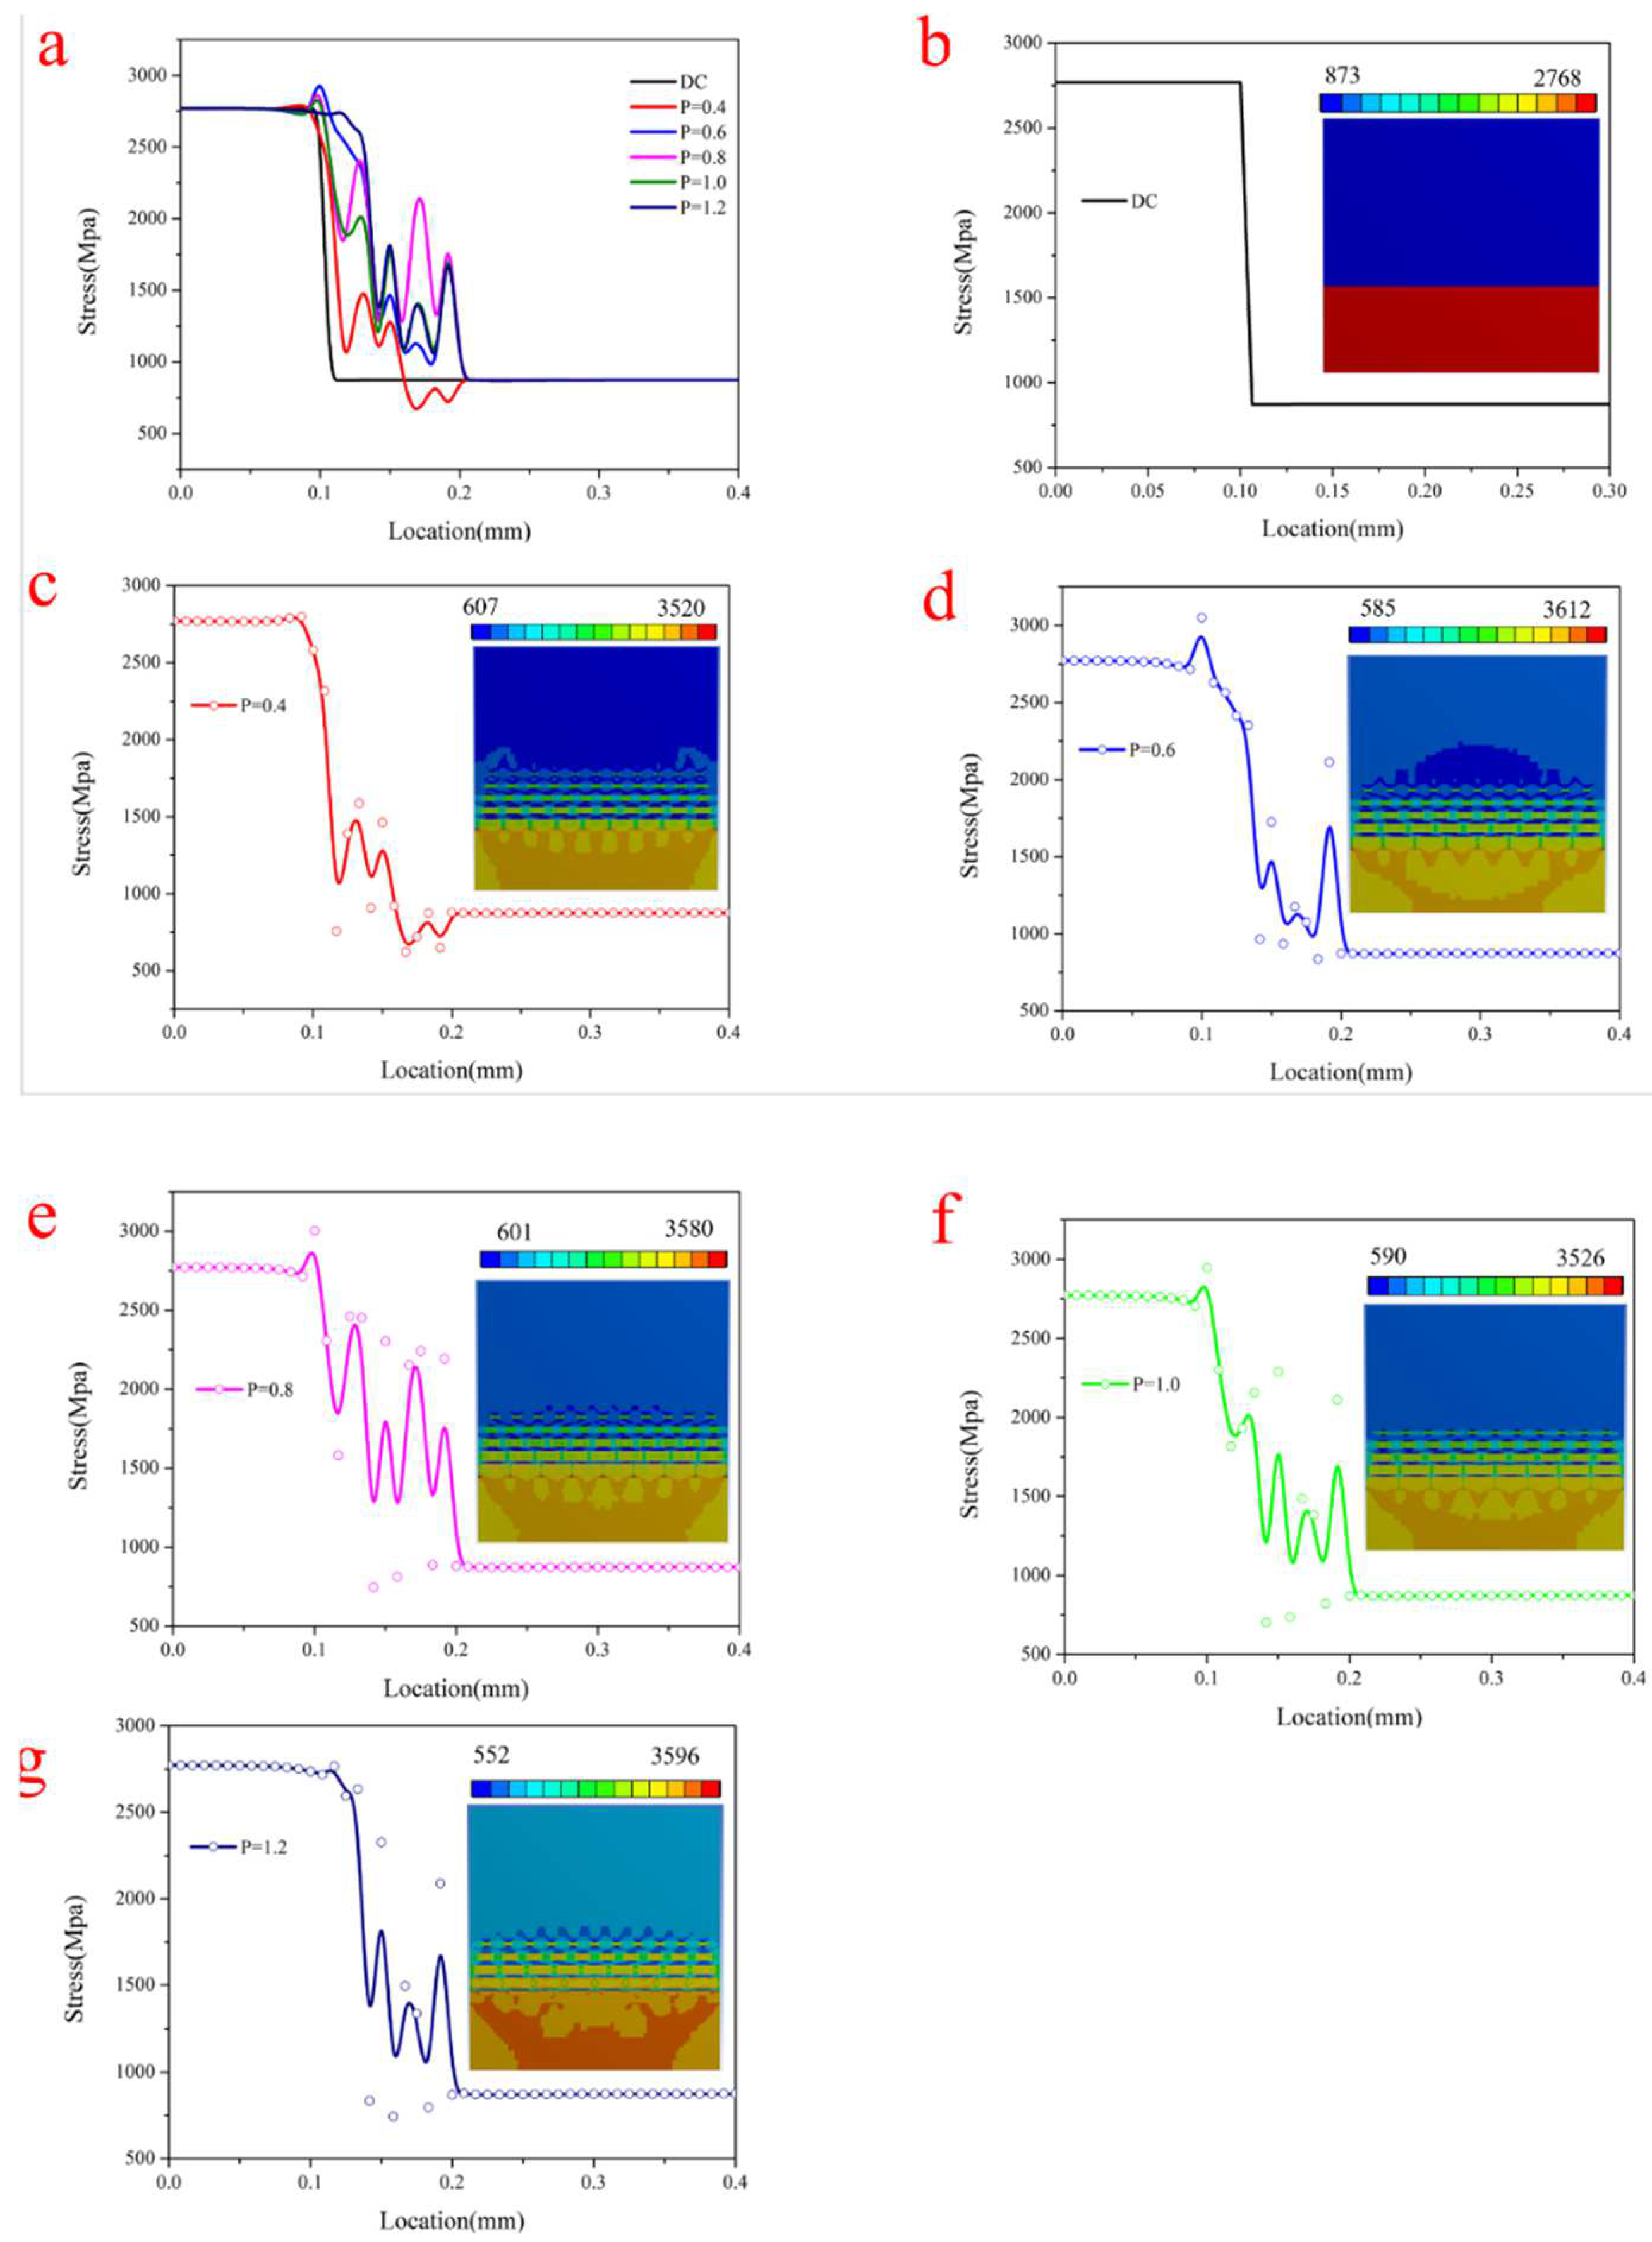
Figure 6a displays the thermal stress distribution of the traditional coating, and Figure 6b–f presents the thermal stress distribution of S2. Since the S2 model reflects the actual phase interface inside the coating, which is closer to the actual coating structure than the S1 model, it can better reflect the stress distribution inside the coating. In general, compared to traditional coating, the stress distribution in S2 is also smoother than that in DC and the maximum stress value of all S2 models is larger than that of S1. Obviously, in all S2 models, there were large stress changes at the metal–ceramic interface, and these stress changes led to the formation and expansion of cracks at the interface. At the same time, when p = 1.0, the max thermal stress of the entire coating was the lowest at 3519 MPa. Thus, the gradient distributions of the two phases in the continuous transition coatings were able to reduce appreciably the high thermal stresses generated between BC and 8YSZ. This was due to the sharp differences in coefficient of thermal expansion (CTE) and elastic modulus between the two phases of duplex coating [30]. Integrating the analysis results of S1 and S2, the next part of the analysis takes as its research object the coating model with a gradient index of 1.0.

Figure 6.
Stress distribution of the model along the vertical axis of symmetry (a), thermal stress distribution of traditional coating (b) and S2 (c–g).
3.5. The Effect of Pores in the Coating on Thermal Stress
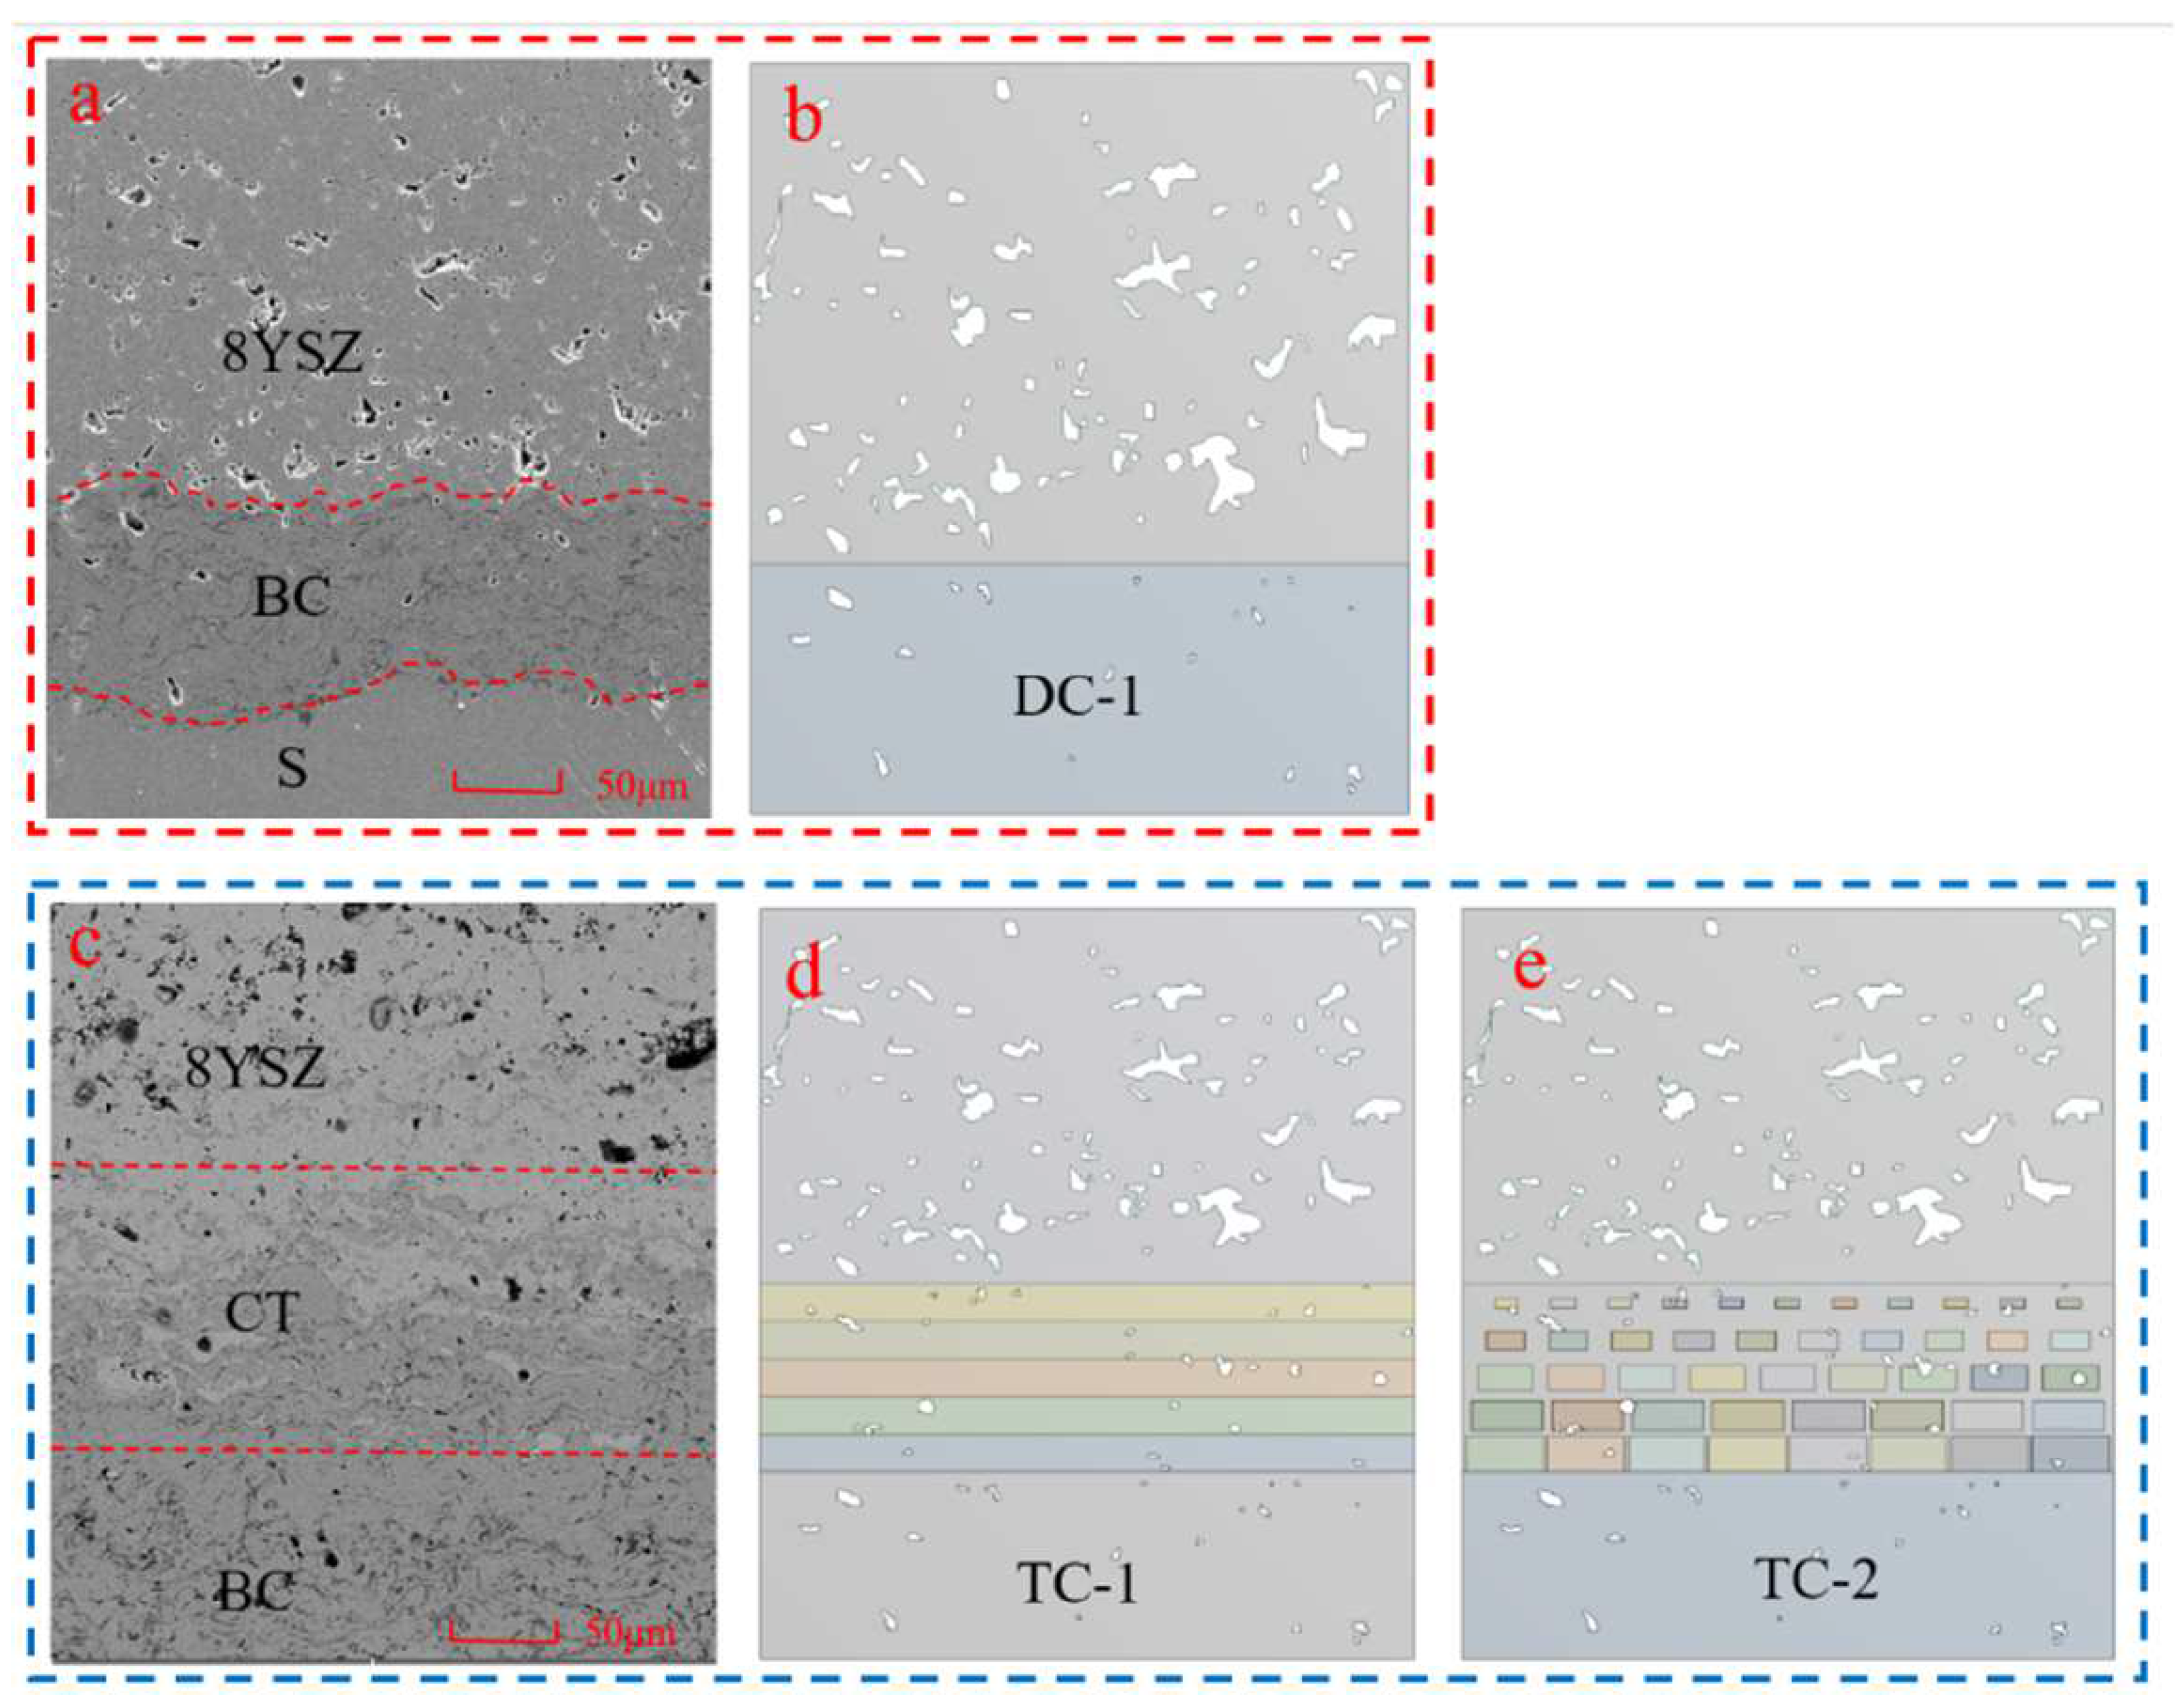
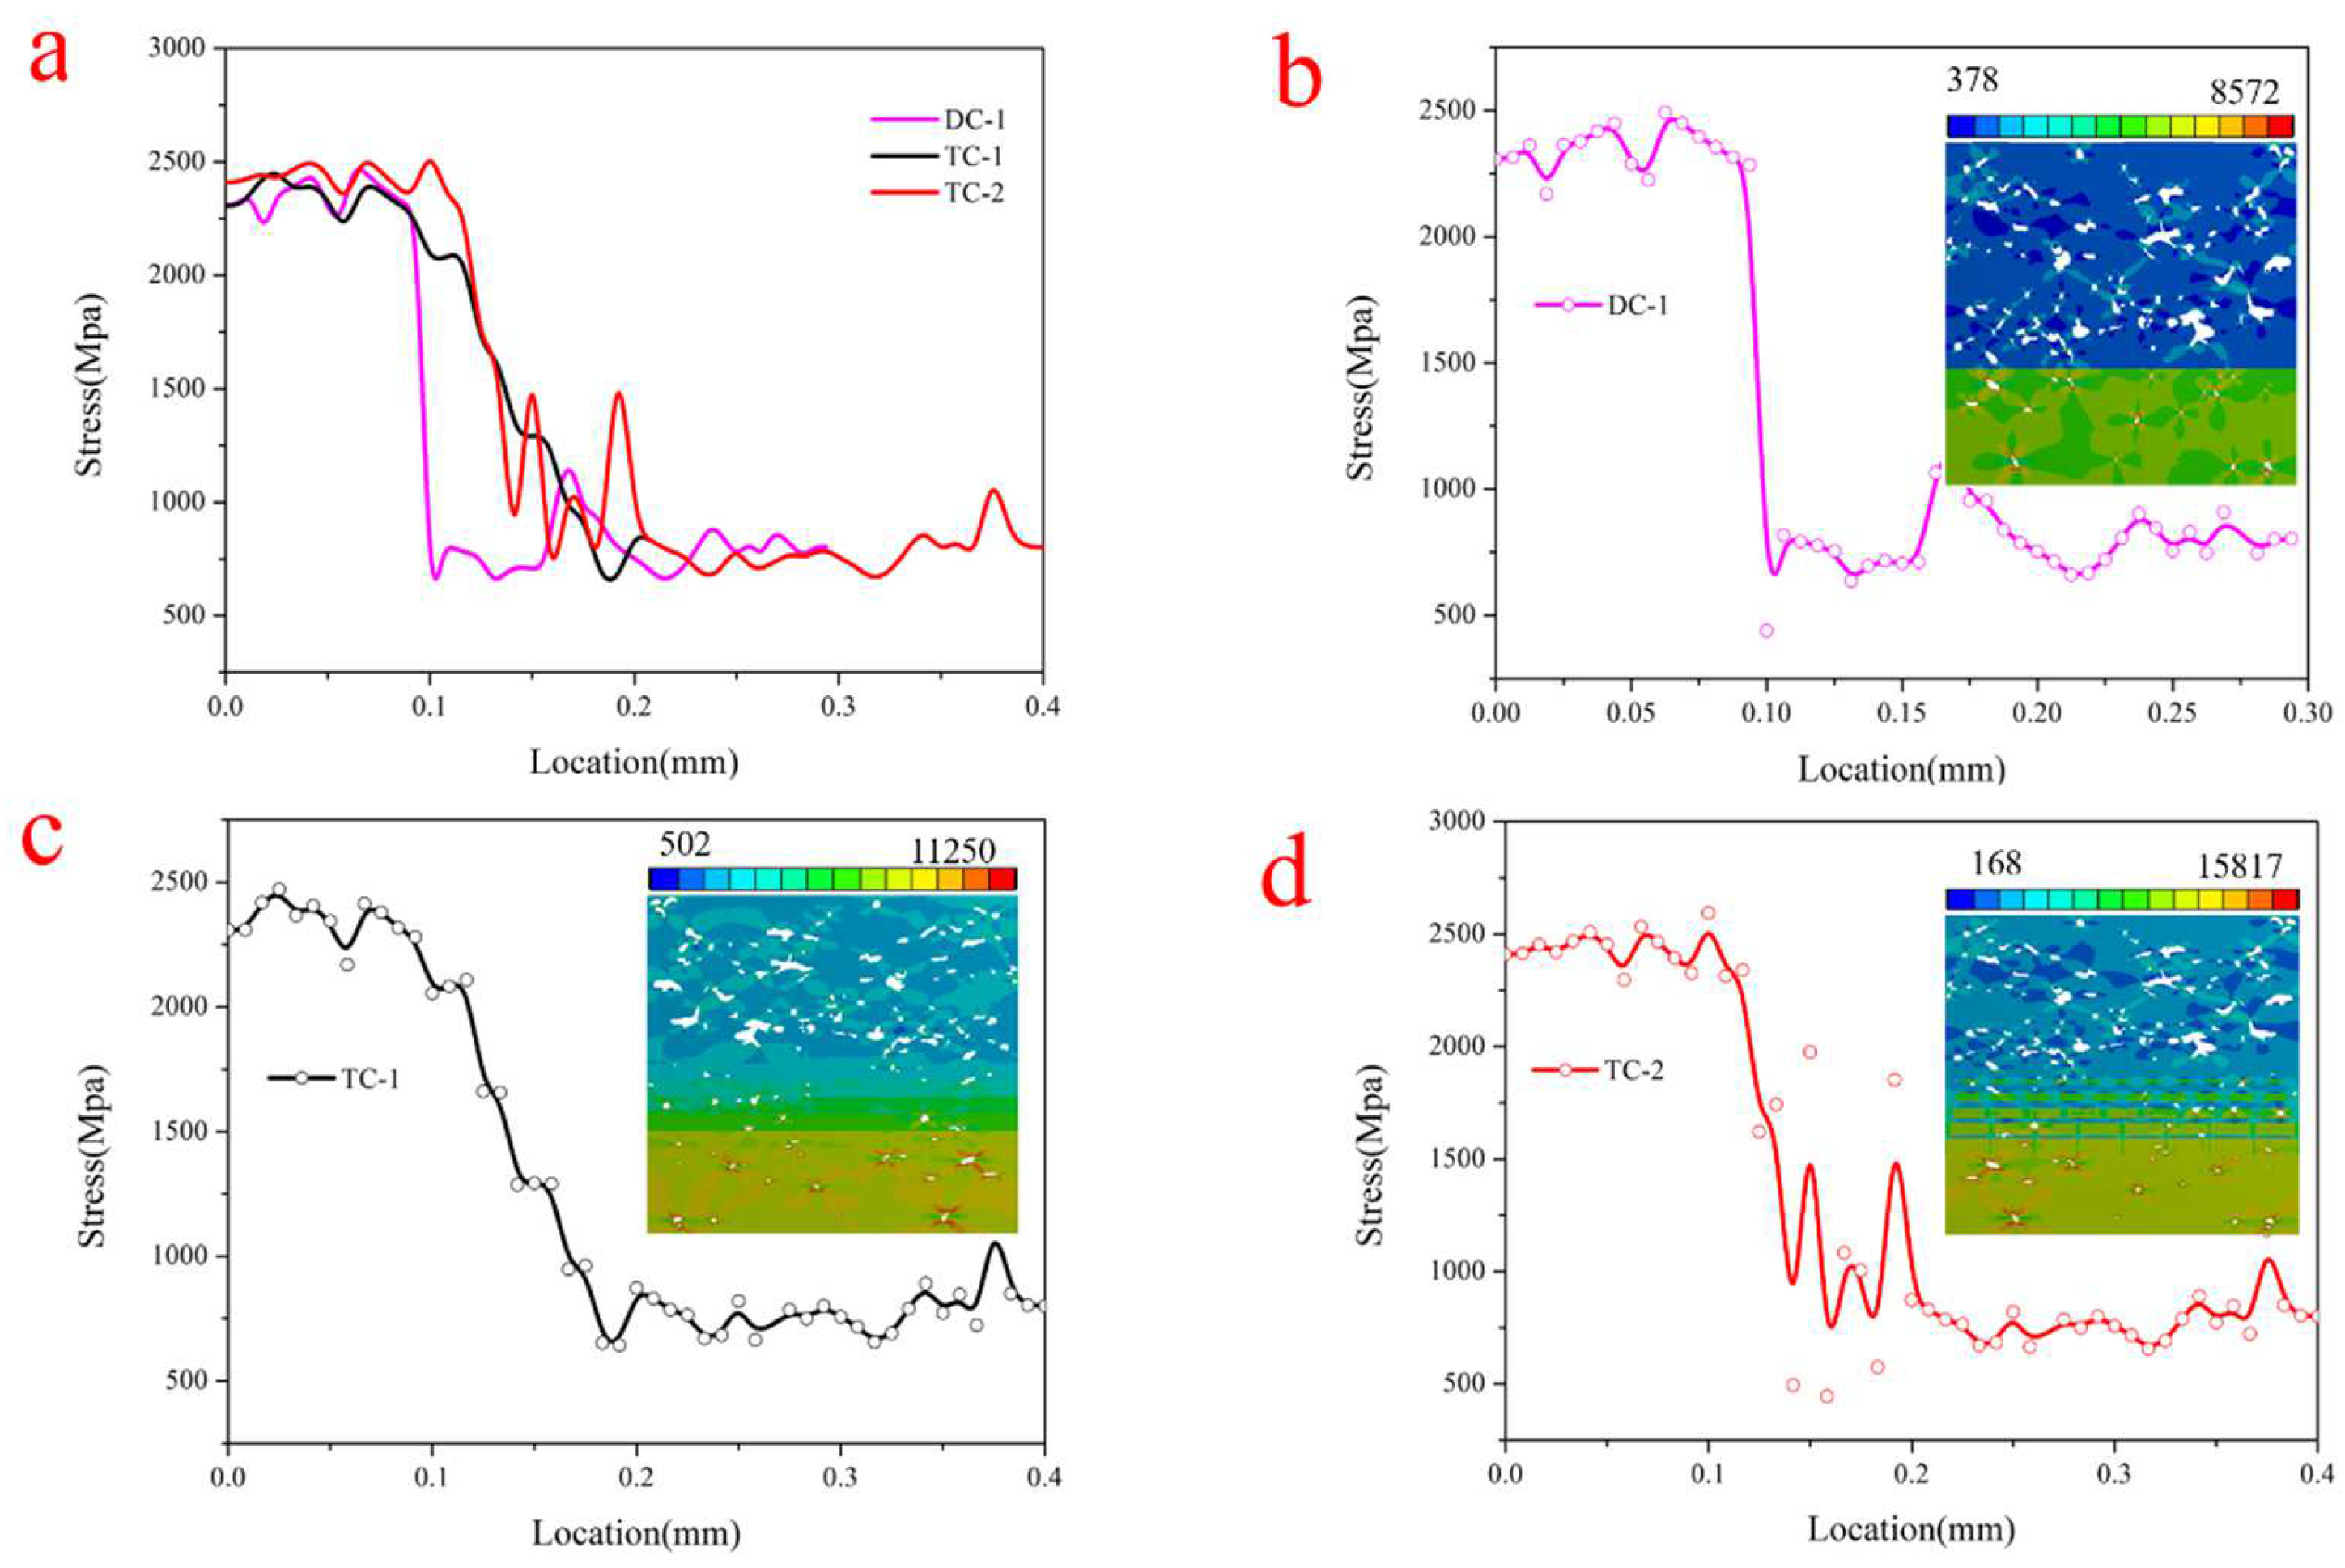
Figure 7a,b shows the distribution of microscopic pores in traditional coating and continuous transition coatings. Clearly, both the traditional coating and the continuous transition coating contained many pores, and there were more pores inside the ceramic coating than the bonding coating and continuous transition zone. Because the melting point of ceramics is much higher than that of metals, their thermal conductivity is much lower than that of metals. Plasma beams can easily melt metals, but cannot completely melt ceramics, so there were more pores in the ceramic coating than in the bonding coating. The internal structural defects of the coating that formed during the deposition process, such as pores, micro-cracks, etc., will have had a great impact on the mechanical properties of the coating [31]. The existence of pores inevitably affects stress distribution inside the coating. Therefore, based on the actual size and shape of the pores in the coatings, professional software and methods were employed to form holes in the previously built model for simulation analysis, and SEM results for traditional coatings and continuous transition coatings are shown in Figure 7a,c. The established models with pores are shown in Figure 7b,d,e. Among these, the model with pores in the bonding coating and ceramic coating of traditional coatings is labelled DC-1, and the models with pores in the bonding coating, continuous transition coating and the ceramic of continuous transition coatings are labelled TC-1 and TC-2. The simulation results are shown in Figure 8a–d. Compared with the coating without pores, the coating with pores had a large stress value at the pores; for the traditional coating model without pores, the stress difference between the bonding coating and the ceramic coating was about 2100 MPa, while the continuous transition coating had a smaller stress difference with the interfacial stress difference for the traditional coating with pores only about 1200 MPa, which can also be seen in the continuous transition coating. Moreover, for all coating system models, the maximum value of the internal stress appeared in the bonding coating, and the minimum value appeared in the ceramic coating. However, the toughness of the metal bonding coating was greater than that of the ceramic coating. Even if the internal stress is large, internal cracks are not easy to initiate and expand [32]. For all traditional coating models with pores inside, the stress gap between the bonding coating and the ceramic coating was smaller than that of the non-voided coating. Thus, the existence of pores can reduce the stress at the interface between the bonding coating and the ceramic coating, which can prolong the service life of the coating [33,34]. For continuous transition coatings, the effect of pores on the internal stress of the coating was more significant. The existence of pores made the internal stress distribution of the coating gentler than that of a non-voided coating. Studies also have shown that the existence of pores can significantly reduce the elastic modulus of the coating and then affect the residual stress inside the coating [29,30]. More importantly, the existence of pores can reduce the thermal conductivity and increase the thermal insulation performance of the coating [35]. Therefore, a certain concentration of pores in the thermal barrier coating is beneficial to the performance and life of the coatings.

Figure 7.
SEM image of traditional coating (a) and continuous transition coating (c), models with pores in traditional coating (b) and continuous transition coating (d,e).

Figure 8.
Stress distribution of the model with pores along the vertical axis of symmetry (a), thermal stress distribution of traditional coating (b) and continuous transition coating with pores (c,d).
4. Conclusions
In traditional coatings, due to the differences in material parameters at the interface between the bonding coating and the ceramic coating, the coating often fails during service. In order to reduce stress at the interface between the bonding coating and the ceramic coating, we combined computer simulations and experiments to successfully prepare a continuous transition coating by air plasma spraying.
- (1)
- We conducted a Vickers hardness analysis of the coatings, and found that the traditional coating showed considerable hardness difference at the interface between the bonding coating and the ceramic coating, reaching 800 HV0.1. Meanwhile, for the continuous transition coating, the hardness value of the entire coating changed smoothly in the thickness direction.
- (2)
- Compared to the traditional coating, the continuous transition coating reduced the thermal mismatch between the bonding coating and the ceramic coating, which may improve the high temperature reliability of ceramic coatings.
- (3)
- The gradient index also had a greater impact on the stress distribution inside the coating. When the gradient index was 1.0, the stress distribution inside the coating was the gentlest, which is beneficial for prolonging the service life of the coating.
- (4)
- The porous coatings were modeled and simulated. It was found that the pores inside the coating can make smooth the stress change in the coating, and that the maximum stress of the entire coating exists in the bonding coating. The existence of pores can slightly alleviate the stress gap at the coating interface and extend the service life of the coating.
Author Contributions
Conceptualization, B.Z. and P.S.; methodology, Y.Z.; software, Y.Z.; validation, Y.Z. and C.H.; formal analysis, H.P.; investigation, Y.Z.; resources, B.Z.; data curation, Y.Z. and C.H.; writing—original draft preparation, Y.Z.; writing—review and editing, B.Z.; visualization, H.P.; supervision, B.Z.; project administration, P.S.; funding acquisition, P.S. All authors have read and agreed to the published version of the manuscript.
Funding
This work was financially supported by the National Natural Science Foundation of China (No. 51961019), the Yunnan Province Science Technology Major Project (No. 2019ZE001), and the Rare and Precious Metal Materials Genome Engineering Project of Yunnan Province (No. 202002AB080001).
Institutional Review Board Statement
Not applicable.
Informed Consent Statement
Not applicable.
Data Availability Statement
Not applicable.
Conflicts of Interest
The authors declare no conflict of interest.
References
- Gao, P.Y.; Ma, Y.D.; Sun, W.W.; Yang, Y.; Zhang, C.; Cui, Y.H.; Wang, Y.W.; Dong, Y.C. Microstructure and properties of Al2O3–ZrO2–TiO2 composite coatings prepared by plasma spraying. Rare Met. 2021, 40, 1825–1834. [Google Scholar] [CrossRef]
- Guo, L.; Xin, H.; Zhang, Z.; Zhang, X.; Ye, F. Microstructure modification of Y2O3 stabilized ZrO2 thermal barrier coatings by laser glazing and the effects on the hot corrosion resistance. J. Adv. Ceram. 2020, 9, 232–242. [Google Scholar] [CrossRef]
- Zhang, W.W.; Wei, Z.Y.; Zhang, L.Y.; Xing, Y.Z.; Zhang, Q. Low-thermal-conductivity thermal barrier coatings with a multi-scale pore design and sintering resistance following thermal exposure. Rare Met. 2020, 39, 352–367. [Google Scholar] [CrossRef]
- Deng, Z.Q.; Mao, J.; Liu, M.; Deng, C.M.; Ma, J.T. Regional characteristic of 7YSZ coatings prepared by plasma spray-physical vapor deposition technique. Rare Met. 2021, 40, 3308–3315. [Google Scholar] [CrossRef]
- Yamazaki, Y.; Schmidt, A.; Scholz, A. The determination of the delamination resistance in thermal barrier coating system by four-point bending tests. Surf. Coat. Technol. 2006, 201, 744–754. [Google Scholar] [CrossRef]
- Kawasaki, A.; Watanabe, R. Thermal fracture behavior of metal/ceramic functionally graded materials. Eng. Fract. Mech. 2002, 69, 1713–1728. [Google Scholar] [CrossRef]
- Khor, K.A.; Gu, Y.W. Effects of residual stress on the performance of plasma sprayed functionally graded ZrO2/NiCoCrAlY coatings. Mater. Sci. Eng. A 2000, 277, 64–76. [Google Scholar] [CrossRef]
- Khor, K.; Dong, Z.; Gu, Y. Plasma sprayed functionally graded thermal barrier coatings. Mater. Lett. 1999, 38, 437–444. [Google Scholar] [CrossRef]
- Bäker, M.; Seiler, P. A guide to finite element simulations of thermal barrier coatings. J. Therm. Spray Technol. 2017, 26, 1146–1160. [Google Scholar] [CrossRef]
- Yang, L.; Kang, H.S.; Zhou, Y.C.; He, L.M.; Lu, C. Intelligent discrimination of failure modes in thermal barrier coatings: Wavelet transform and neural network analysis of acoustic emission signals. Exp. Mech. 2015, 55, 321–330. [Google Scholar] [CrossRef]
- Zhang, X.; Watanabe, M.; Kuroda, S. Effects of residual stress on the mechanical properties of plasma-sprayed thermal barrier coatings. Eng. Fract. Mech. 2013, 110, 314–327. [Google Scholar] [CrossRef]
- Burov, A.; Fedorova, E. Modeling of interface failure in a thermal barrier coating system on Ni-based superalloys. Eng. Fail. Anal. 2021, 123, 105320. [Google Scholar] [CrossRef]
- Al Zoubi, W.; Kamil, M.P.; Fatimah, S.; Nashrah, N.; Ko, Y.G. Recent advances in hybrid organic-inorganic materials with spatial architecture for state-of-the-art applications. Prog. Mater. Sci. 2020, 112, 100663. [Google Scholar] [CrossRef]
- Yang, S.J.; Song, W.J.; Dingwell, D.B.; He, J.; Guo, H.B. Surface roughness affects metastable non-wetting behavior of silicate melts on thermal barrier coatings. Rare Met. 2022, 41, 469–481. [Google Scholar] [CrossRef]
- Liu, M.J.; Zhang, G.; Lu, Y.H.; Han, J.; Li, G.; Li, C.-X.; Li, C.-J.; Yang, G. Plasma spray–physical vapor deposition toward advanced thermal barrier coatings: A review. Rare Met. 2020, 39, 479–497. [Google Scholar] [CrossRef]
- Qiao, X.; Wang, Y.M.; Weng, W.X.; Liu, B.L.; Li, Q. Influence of pores on mechanical properties of plasma sprayed coatings: Case study of YSZ thermal barrier coatings. Ceramics International 2018, 44, S0272884218322971. [Google Scholar] [CrossRef]
- Sadowski, T.; Golewski, P. Multidisciplinary analysis of the operational temperature increase of turbine blades in combustion engines by application of the ceramic thermal barrier coatings (TBC). Comput. Mater. Sci. 2011, 50, 1326–1335. [Google Scholar] [CrossRef]
- Wang, L.; Wang, Y.; Sun, X.G.; He, J.Q.; Pan, Z.Y.; Zhou, Y.; Wu, P.L. Influence of pores on the thermal insulation behavior of thermal barrier coatings prepared by atmospheric plasma spray. Mater. Des. 2011, 32, 36–47. [Google Scholar] [CrossRef]
- Wei, Z.Y.; Wang, L.S.; Cai, H.N.; Li, G.R.; Chen, X.F.; Zhang, W.X. Dominant effect of oriented 2D pores on heat flux in lamellar structured thermal barrier coatings. Ceram. Int. 2019, 45, 17029–17039. [Google Scholar] [CrossRef]
- Widjaja, S.; Limarga, A.M.; Yip, T.H. Modeling of residual stresses in a plasma-sprayed zirconia/alumina functionally graded-thermal barrier coating. Thin Solid Film. 2003, 434, 216–227. [Google Scholar] [CrossRef]
- Pace, S.; Cannillo, V.; Wu, J.; Boccaccini, D.N.; Seglem, S.; Boccaccini, A.R. Processing glass–pyrochlore composites for nuclear waste encapsulation. J. Nucl. Mater. 2005, 341, 12–18. [Google Scholar] [CrossRef]
- Cao, X.Q.; Vassen, R.; Tietz, F.; Stoever, D. New double-ceramic-layer thermal barrier coatings based on zirconia-rare earth composite oxides. J. Eur. Ceram. Soc. 2006, 26, 247–251. [Google Scholar] [CrossRef]
- Vaßen, R.; Traeger, F.; Stöver, D. New thermal barrier coatings based on pyrochlore/YSZ double-layer systems. Int. J. Appl. Ceram. Technol. 2004, 1, 351–361. [Google Scholar] [CrossRef]
- Wang, J.; Xue, H.; Wang, Y. Oxidation behavior of Ni-based superalloy GH738 in static air between 800 and 1000 °C. Rare Met. 2021, 40, 616–625. [Google Scholar] [CrossRef]
- Li, C.; Yuan, X.; Li, D.; Song, P.; Li, Z.; Huang, T.; Feng, T.; He, Y.; Zhai, R.; Li, Q.; et al. Test atmospheres affecting voids distribution on MCrAlY-bond coats for TBCs at 1050 °C. Corros. Sci. 2022, 195, 109967. [Google Scholar] [CrossRef]
- Padture, N.P.; Gell, M.; Jordan, E.H. Thermal barrier coatings for gas-turbine engine applications. Science 2002, 296, 280–284. [Google Scholar] [CrossRef]
- Clarke, D.R.; Oechsner, M.; Padture, N.P. Thermal-barrier coatings for more efficient gas-turbine engines. MRS Bull. 2012, 37, 891–899. [Google Scholar] [CrossRef]
- Curry, N.; Tang, Z.; Markocsan, N.; Nylén, P. Influence of bond coat surface roughness on the structure of axial suspension plasma spray thermal barrier coatings—Thermal and lifetime performance. Surf. Coat. Technol. 2015, 268, 15–23. [Google Scholar] [CrossRef]
- Lee, K.I.; Wu, L.T.; Wu, R.T.; Xiao, P. Mechanisms and mitigation of volcanic ash attack on yttria stablized zirconia thermal barrier coatings. Surf. Coat. Technol. 2014, 260, 68–72. [Google Scholar] [CrossRef]
- Kawasaki, A.; Watanabe, R.; Yuki, M.; Nakanishi, Y.; Onabe, H. Effect of microstructure on thermal shock cracking of functionally graded thermal barrier coatings studied by burner heating test. Mater. Trans. JIM 1996, 37, 788–795. [Google Scholar] [CrossRef][Green Version]
- Xue, S.F.; Li, Y.J.; Zheng, F.H.; Bian, X.; Wu, W.Y.; Yang, C.H. Characterization of CeO2 microspheres fabricated by an ultrasonic spray pyrolysis method. Rare Met. 2021, 40, 31–39. [Google Scholar] [CrossRef]
- Jung, Y.G.; Choi, S.C.; Oh, C.S.; Paik, U.G. Residual stress and thermal properties of zirconia/metal functionally graded materials fabricated by hot pressing. J. Mater. Sci. 1997, 32, 3841–3850. [Google Scholar] [CrossRef]
- Lee, J.D.; Ra, H.Y.; Hong, K.T.; Sur, S.K. Analysis of deposition phenomena and residual stress in plasma spray coatings. Surf. Coat. Technol. 1992, 56, 27–37. [Google Scholar] [CrossRef]
- Girolamo, G.D.; Blasi, C.; Schioppa, M. Microstructural, mechanical and thermal characteristics of zirconia-based thermal barrier coatings deposited by plasma spraying. Ceram. Int. 2015, 41, 11776–11785. [Google Scholar] [CrossRef]
- Braess, D.; Ming, P. A finite element method for nearly incompressible elasticity problems. Math. Comput. 2004, 74, 25–53. [Google Scholar] [CrossRef][Green Version]
Publisher’s Note: MDPI stays neutral with regard to jurisdictional claims in published maps and institutional affiliations. |
© 2022 by the authors. Licensee MDPI, Basel, Switzerland. This article is an open access article distributed under the terms and conditions of the Creative Commons Attribution (CC BY) license (https://creativecommons.org/licenses/by/4.0/).

