Article

Research on the Mechanism of Anti-Stone-Damage Automotive Coating Based on Computational Fluid Dynamics Method

School of Mechanical & Automotive Engineering, South China University of Technology, Guangzhou 510641, China
Coatings 2022, 12(3), 295; https://doi.org/10.3390/coatings12030295
Submission received: 2 January 2022 / Revised: 18 February 2022 / Accepted: 19 February 2022 / Published: 22 February 2022

Abstract

:
Damage to the body or critical components caused by stone strikes to automotive coatings affects the safety of the car. More and more attention are being paid to the study of the anti-stone-damage mechanism of coatings. Firstly, a computational fluid dynamics (CFD) model was established based on a single-impact anti-stone tester, and the simulation results show the following: (a) At 90° incidence, the air pressure of the stone impact suddenly and rapidly increases when the semicircular surface projectile velocity is greater than 30 m/s. The air pressure of the conical projectile stone at the distance of 0.3 and 0.15 mm suddenly increases at the projectile velocity of 10 and 20 m/s, respectively. (b) When the projectile velocity exceeds 15 m/s, the pressure of the semicircular surface projectile suddenly increases. (c) When the speed is less than 20 m/s, the shedding area decreases with the increase in the speed, while the stone impact pressure increases with the increase in the speed. Then, the simulation results of the incident velocity of 40 m/s show that the working pressure is 195.48 kPa, and the impact force is 8142.56 N. Finally, the relationship between the impact force and the driving air flow pressure was obtained according to the DIN 55996-1 standard stone impact resistance test and compared with the simulation results, showing that trend of the impact force increasing with the increase in driving air flow pressure is consistent, the simulation results are about 1.40 times the experimental results, and the simulation results are large and can be considered by increasing the test correction coefficient adjustment. Based on the CFD method, research on the mechanism of anti-stone-damage automotive coating can greatly reduce the number of stone strike instrument experiments, shorten the cycle, and reduce the research and development costs.

1. Introduction

When the car is driving, the body coating is often impacted by heavy objects such as sand particles and road gravel, leading to the composite coating being peeled off in single or multiple layers or even completely. Automotive coatings and the processes used to coat automotive surfaces exemplify the avant-garde of technologies [1]. According to reports, when a 10 g piece of gravel collides with a body with a relative speed of 80 km/h, its impact force is 100 times its own weight, which is enough to break through the paint coating of 30 μm; if the paint coating is damaged, the local sheet metal is directly exposed to the atmosphere, which can very easily cause corrosion problems. Research data show that at the body corrosion of 1%, the body strength will be reduced by 5% to 10%, which has a great hidden danger for the service life of the automobile body [2].
Scholars at home and abroad have done a lot of research on this, and the main research includes theoretical, numerical, and experimental research.
In theoretical research on the resistance of automotive body coatings to stone impact, Ramamurthy et al. believe that normal shock pressure waves will propagate in the medium of coatings and impact particles at a speed similar to the speed of sound, and the peak impact stress can reach 400 MPa. Pressure waves are reflected in the form of tension on the free surface of the impactor and target, and when the tension wave reaches the impact interface, the impactor separates from the target, creating further stress wave jets. As pressure waves propagate through the coating, local stresses may far exceed the strength limits of the layer and the bonding surface, causing structural damage, coating delamination, and fragmentation [3]. Papini and Spelt argue that the failure mechanism of coatings is mainly quasistatic rather than dynamic, that the destruction of coatings is caused by shear stress between layers, and that the phenomenon of layered shedding often occurs where the shear strength of the joint surface is weakest. Coatings with good adhesion properties fail due to mechanical failure mechanisms such as scraping and two other cuts [4].
Lonyuk et al. provide a comprehensive introduction to single-impact testing and multi-impact testing. In multiple impact tests, the painted plate is subjected to a specific quality of stone; the main disadvantages of this type of method are poor reproducibility of the results and lack of control over the variables that affect the impact phenomenon. A single-impact test can better control the shock rate and impact angle and provide better reproducible results; this method applied to the study of the mechanism of paint failure has achieved good results [5]. Mengyan et al. conducted an investigation of impact fracture behavior of automobile laminated glass by 3D discrete element method [6]. Chen et al. prepared a four-layer bioactive gradient coating with a ratios of HA to Ti composition of 0.2, 0.5, 0.9, and 1, respectively, by magnetron sputtering, and the tensile strength could be as high as 35 MPa [7].
From the perspective of improving the mechanical properties of the coating, Liu et al. studied nanomodified materials and PVC anti-stone-impact coatings with meteorological silica and hollow glass beads [8,9,10]. Zhu and Samieian introduced the design requirements, composition, functional utility, and shortcomings of different paints from the three aspects of new solvent anti-stone-hit paint, new automotive metal flash primer, and new automotive varnish [11,12]. Starting from the matching test of the coating and changing the coating process, Zhang studied how to improve the stone impact resistance performance of the coating on a hot-dip galvanized steel plate by conducting the stone impact resistance test of different medium coating materials and adopting the new process of adding a layer of anti-stone-hit coating [13]. Xu et al. conducted an experimental investigation for dynamic crack–interface interactions in SGP laminated glass [14].
In numerical research on the anti-stone-impact performance of automotive coatings, Sun et al. employed simulation to design the stone impact prevention on the lower edge of the door and the side of the front and rear wheel covers and comprehensively considered the total layout problem to obtain the optimization parameters of sheet metal curve. Through the analysis of different parts of the body, the methods of stone impact prevention in each part are introduced, and the guiding role of stone impact simulation calculation in the analysis of resistance to stone impact performance in the early development of the vehicle is explained. The disadvantage is that other parameters such as the speed of stone impact are fixed, as the study focuses on the optimization design of the body curve after simulation [15]. Guoquan et al. proposed a quantitative evaluation method for obstacle avoidance performance of unmanned ships [16].
Yanhong Chen of Jilin University used finite element means to optimize the mechanical properties of automotive coatings; introduced the mechanical properties considering material damage into the study; studied the influence of coating materials and thickness on the bearing capacity and scratch resistance of the body coating system; and concluded that the bearing capacity and scratch resistance were inversely proportional and proportional to the coating thickness, respectively, and had little relationship with the coating material [17,18,19,20,21,22]. Guoquan et al. simulated the safety of unmanned ship berthing under the influence of various factors [23]. Shi et al. modeled the fin element of the automobile oil pan, used Abaqus to analyze the impact of the oil pan on the model of the oil pan, and then optimized the design scheme according to the impact analysis results of the flying stone so that the overall quality was reduced by 59% [24].
Mengyan et al. conducted cohesive modeling of impact fracture behavior of laminated glass and proposed an improved contact formulation for impact crack simulations in a laminated glass beam [25,26,27,28,29]. Bernhard and Maryam, among others at the Institute of Computational Engineering in Luxembourg, are developing an extended discrete element method (XDEM) multiphysics and multiscale simulation platform that combines advanced multiphysics simulation techniques with flexibility and versatility to build the next generation of multiphysics, multiscale simulation tools [30].
Weinschenk studied the effect of the geometric parameters of the extrusion tool on surface deformation, selecting a multicurved outer plate with a door handle recess for analysis. Numerical simulations of depth and spring back were performed in AutoForm. Curvature analysis before and after rebound was used to detect surface deformation and analyze the effect of stress and curvature on surface deformation. The results show that the presence of surface deformation depends largely on the initial curvature of the part, and the occurrence of surface deformation depends on the distribution of small stresses. During the design phase, the risk of surface deflection can be reduced by changing the geometry [31]. Alter et al. proposed an enhanced nonlocal failure criterion for laminated glass under low-velocity impact [32].
Experimental research on the anti-stone-impact performance of automotive coating includes the following:
  • Experimental research with coating type and thickness as the main variables: Wang et al. analyzed the advantages and disadvantages of two systems by comparing the test methods and evaluation methods of the ISO system and the SAE system, supplemented by the test results of different coating samples [33]. Li et al. set up control tests to determine the ratio required for the coating to have good stone impact resistance based on the coating components and thickness [34]. In order to study eight different coating systems, Lonyuk conducted several solitaire impact tests to realistically simulate the fragmentation caused by stone impact. In addition, the mechanical properties of the coating were also studied, and the results of the study showed that it was related to the mechanical properties of the coating. It was found that the coating body system of low-transition-temperature glassification of the primer had better stone crush resistance, which solved the relationship between stone impact resistance and the mechanical properties of the automotive solid color coating system [35]. Chen et al. conducted an experimental study on a three-layer tempered glass panel on a quadrilateral simple bearing under a local uniformly distributed load [36].
  • Experimental research with temperature, speed, and other different factors as variables: Xiaohui Zhang of Pan Asia Automobile Co., Ltd., introduced two commonly used tests and evaluation systems for testing the impact resistance of automobile coatings in the world; compared their main differences; and further studied the influence of the test sample angle, test temperature, and stone dosage on the test results through experiments, but did not conduct experimental research on the factor of stone impact speed [37]. Lonyuk et al. first introduced the different forms of destruction of the coating from the failure mechanism of the body coating and then conducted the single-impact failure test of the body coating. According to the method of control experiment, the specimens were divided into four groups according to the number of coatings and the content of melamine adhesive in the water-based primer formulation, the four groups of specimens were repeatedly tested at different temperatures, and finally the influence of different factors on the damage of the body coating was obtained [5].
  • Experimental research using new technologies: Wang et al. conducted experimental investigations into SGP laminated glass under low-velocity impact [38]. Chen et al. developed the pressure–impulse diagrams for framed PVB-laminated glass windows [39]. Vedrtnam et al. conducted experimental and simulation studies on fracture and adhesion tests of laminated glass [40]. Alizadeh Razin studied the failure properties and strength of coatings produced by automotive coating systems after stone impact resistance tests through electrochemical impedance spectroscopy (EIS). The degree of coating damage and delamination was calculated based on data such as low-frequency impedance, high-frequency phase angle, and area under the Bode modulus plot. The image processing results correlated well with the parameters extracted from the EIS analysis, which were used to estimate the coating damage index and the degree of peeling off the substrate after coating peeling [41]. Yang et al. studied and analyzed the anti-stone-strike properties, mechanical properties, sound insulation properties, and adhesion properties of foamed and low-density anti-stone-impact coatings. The addition of insulating glass beads in an appropriate amount can improve the shear and tensile strength of low-density stone-resistant coatings. Compared with ordinary coatings, the amount of bicycle use can be reduced by 30 to 55%, which is obviously reduced to the effect of light-weighting [42]. Mi et al. used images to identify the traces of stone impact damage, which solved the visual evaluation method that varies from person to person so that the anti-stone-impact evaluation was quantified [43].
  • Tests to improve the stone impact resistance of automotive coating from the design: Chuanyun Cao of DPCA Automobile Co., Ltd., recorded the stone impact area where the coating was destroyed through the method of vehicle field test, so as to adjust the spraying area and primer thickness of the anti-stone-impact coating according to the test results, and the anti-stone-impact design was carried out for the area where the primer cannot be added to the coating [44].
In summary, in the study of the anti-stone-impact performance of automotive coatings and the theoretical analysis and testing of new materials and new processes for coatings, there are many studies of traditional stone impact tests, which require a lot of advanced equipment support, and the cost of traditional stone impact instruments is high.
The main goal of the research presented in the article was to simulate the effects of factors such as projectile speed, front end shape, projectile–coating distance, impact angle, and other factors on stone impact air pressure based on the CFD method. In addition, the simulation results are verified according to the experimental results of the DIN 55996-1 standard [45] for stone impact resistance. The final effect of the works presented in this article is the establishment of an experimentally validated CFD model for studying the mechanism of stone damage resistance of automotive body coatings, reducing the number of stone impact instrument experiments, shortening the cycle, and reducing research and development costs.
The novelty presented in the article is the development of a CFD model to predict the damage mechanism of automotive body coatings through changes in the air pressure of stone strikes.
The remainder of the article is arranged as follows: the second section is the calculation model and experimental equipment, the third is the results, the fourth is the discussion, and the final part is the conclusion.

2. Calculation Model and Experimental Equipment

2.1. Calculation Model

2.1.1. Geometry and Boundary Conditions

According to the single-impact resistance tester designed by Delft University of Technology in collaboration with Delft’s “A&M material-advices” consulting bureau and its principles, the parameters of the airflow-driven stone impact coating model are determined: the coating specimen is a square with a side length of 100 mm, the cylindrical projectile has a diameter of 3.15 mm and length of 5 mm, and the jet pipe has a length of 40 mm, diameter of 3.2 mm, and pipe end distance of 20 mm from the specimen. The established geometric model with dimensions of 100 mm × 100 mm × 60 mm is shown in Figure 1 [5].
The geometric model and boundary condition settings are shown in Figure 1. The box and pipe wall surface are set to WALL, the pipe outlet is set to INLET, the INLET is set to velocity inlet, the speed direction is perpendicular to the inlet boundary, the inlet speed is set differently according to different schemes, the turbulence parameter selected is Intensity and Hydraulic Diameter, and the turbulence intensity is set to 5% by default. The hydraulic radius is set to 3.2 mm, which is the same as the diameter of the pipe.

2.1.2. Computational Domain and Mesh Model

The length of the calculation field is taken from the plate to the pipe inlet distance; the plate width and plate height are used as the calculation domain width and the calculation domain height, respectively; and the projectile part is subtracted to determine the box calculation domain. The model was imported into the Hyper mesh software. First, a triangular surface mesh was generated; then, a body mesh was generated. The number of meshes totals about 550,000, the average distortion is 0.28, and the maximum distortion is 0.83. The mesh quality is overall good, and the overall mesh is shown in Figure 2.

2.1.3. Control Equations and Numerical Methods

The realizable k−ε turbulence model is used for calculation, and the equations are shown in Equations (1) and (2) [46].
ρ D k D t = x j μ + μ t σ k k x j + G k + G b ρ ε Y M
ρ D ε D t = x j μ + μ t σ k ε x j + ρ C 1 S ε ρ C 2 ε 2 k + v ε + C 1 ε ε k C 3 ε G b
In Equations (1) and (2),   μ   is dynamic viscosity coefficient,   ρ is density, S is source item, ν is velocity, k   is turbulence kinetic energy, ε   is turbulence dissipation rate,   G k is the turbulence energy term denoted due to the average velocity gradient, G b   is used for the turbulence energy term caused by the influence of buoyancy, and Y M   is effect of compressive turbulence pulsation expansion on the total dissipation rate. C 2   and   C 1 ε are constants; σ k   and   σ ε   are the Prandtl numbers of turbulence kinetic energy and turbulence dissipation rate, respectively.
In the Fluent software solver settings, simple is selected for the solution method, second-order format is selected for pressure for each discrete term; second-order windward format is selected for momentum, turbulence kinetic energy, turbulence dissipation rate; and second-order implicit is selected for transition formulation

2.2. Experimental Equipment

The anti-stone-impact experimental device based on the DIN 55996-1 standard is shown in Figure 3.
As can be seen from Figure 3, the experimental device mainly includes an air compressor, accumulator, shock meter, and test instruments.
(1) Air compressor: The gas is compressed and the gas pressure is increased at the same time. The Diteng compressor with a current of 10 A was selected. Its model specifications are shown in Table 1.
(2) Accumulator: The high-pressure gas compressed by the air compressor is stored The Haoding accumulator was selected, and its main parameters are shown in Table 2.
(3) Shock meter: The multifunctional anti-stone-impact instrument produced by Shanghai Juye Instrument and Equipment Company, as shown in Figure 3, was selected. It mainly includes an accumulator, solenoid valve, high-pressure gas pipe, pressure reducing valve, pressure gauge, acceleration nozzle (diameter 30 mm, length 200 mm), feed tube, flow meter, and sample fixture. The outlet of the circular tube spray gun is equipped with a gas flow meter and a single speed sensor. It can test the impact of multiple stone grains and single stone particles, and the impact speed, impact direction, and impact angle of stone particles can be strictly controlled.
The accumulator with a volume of 1 m3 stores a high-pressure gas with a maximum output pressure of 0.8 Mpa, outputs a pressure of 0 to 0.8 Mpa through the pressure reducing valve, drives the gravel or steel ball in the feeding system, and hits the coating test plate through accelerated nozzle spray, and the test plate can be freely adjusted in the range of 0 to 180° through the fixture as needed.
(4) Test instruments: The test instruments mainly include pressure sensors and digital oscilloscopes.
Pressure sensor: The pressure applied to the sensor film detection area results in a change in the resistance value. The experiment used an RP-S40-LT-type resistive thin-film pressure sensor; its main parameters are shown in Table 3.
Digital oscilloscope: The DS 5022M digital oscilloscope was used, and its main parameters are shown in Table 4.

3. Results

3.1. Simulation Results of Stone Impact Pressure Characteristics

In order to study the influence of four factors of projectile velocity, projectile front end shape, projectile–coating distance, and impact angle on the air pressure of stone impact, with reference to the single-impact test [5], 18 different stone impact velocities were taken from 7 to 40 m/s, and three calculation curves were formulated:
  • The projectile incidence angle is 90°, and the front end shape is a cone.
  • The angle of incidence of the projectile is 90°, and the shape of the front end is a semicircular surface.
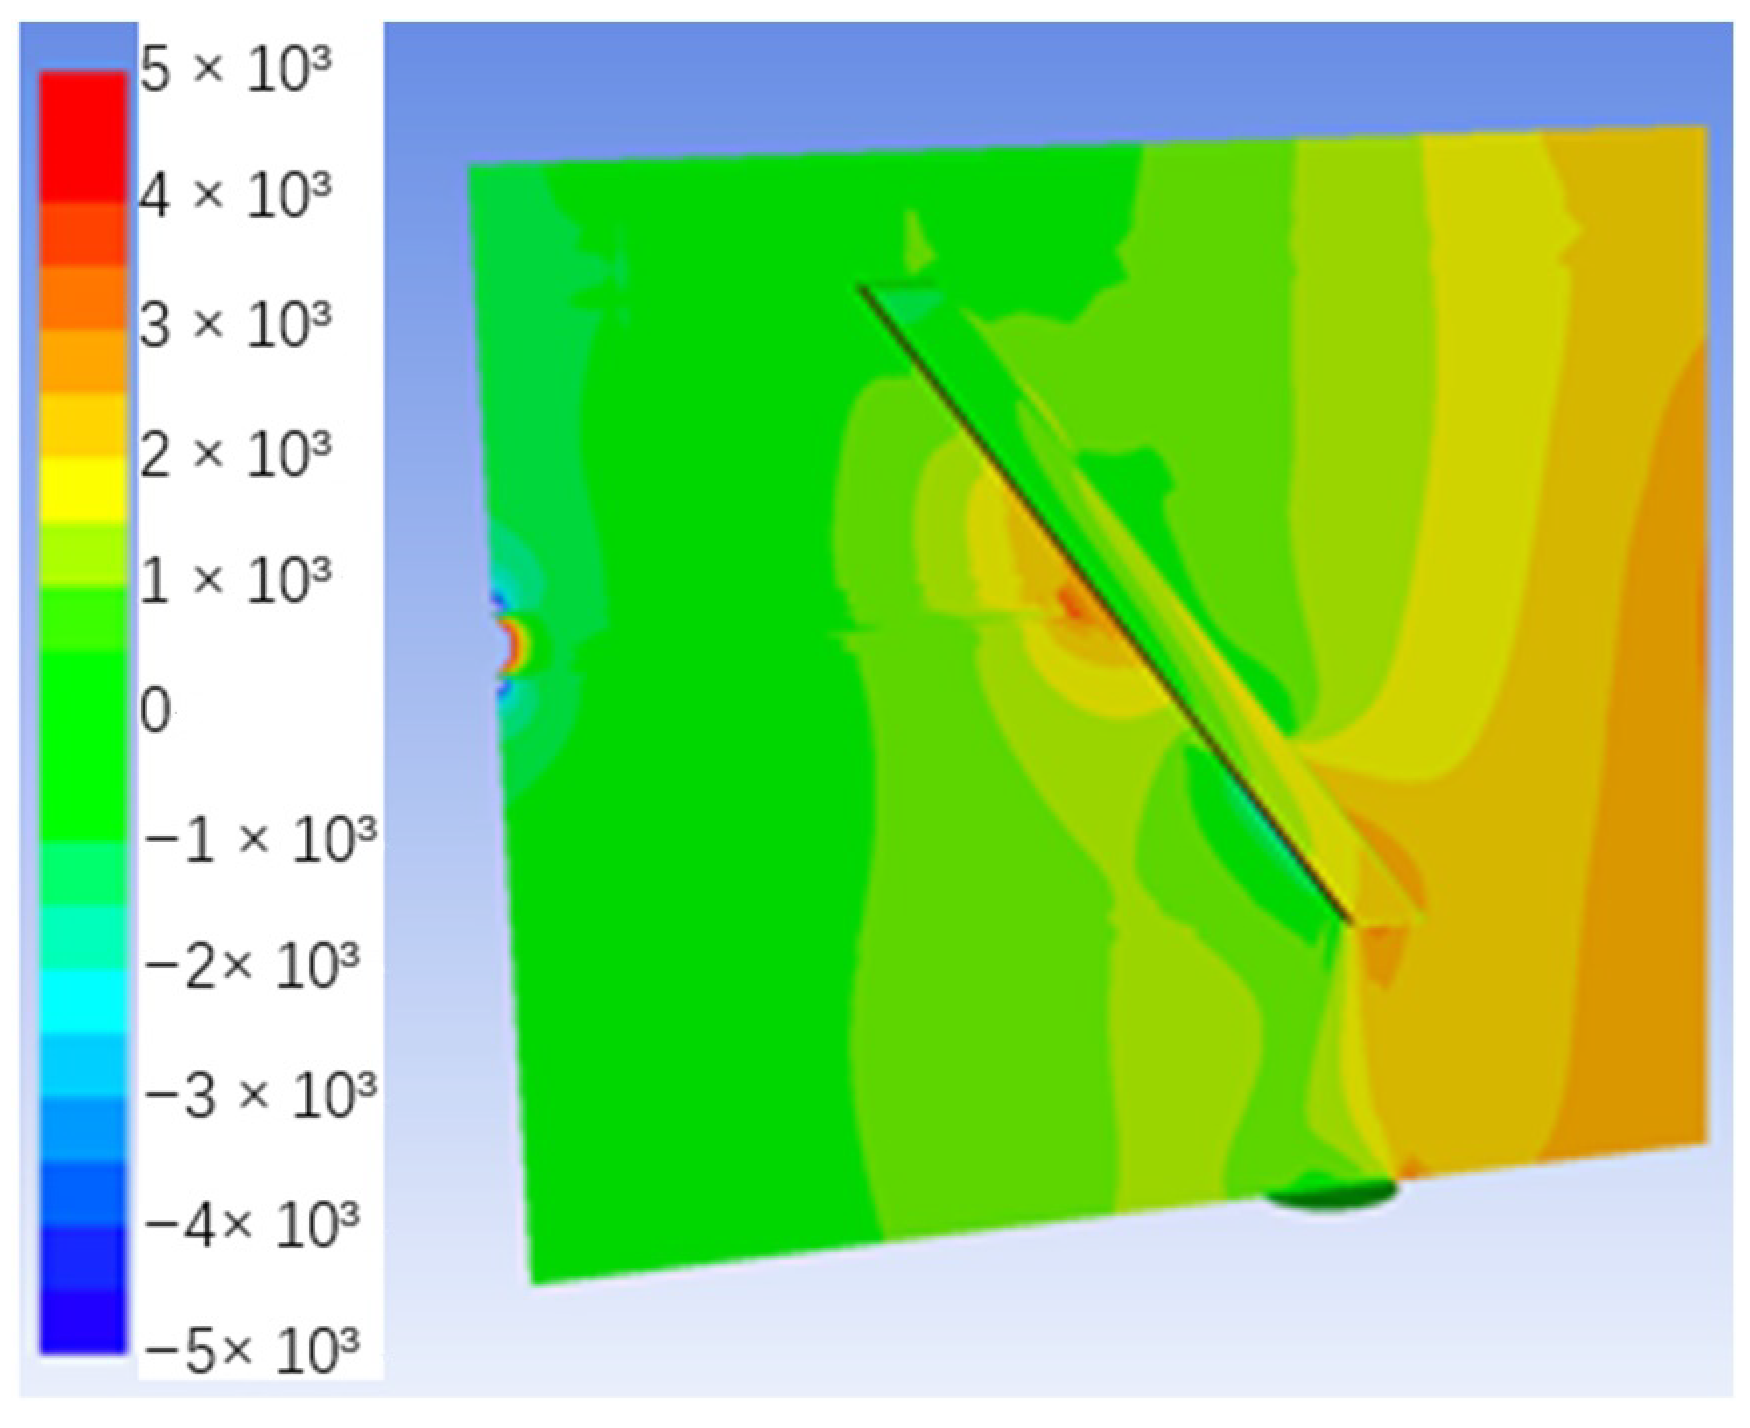
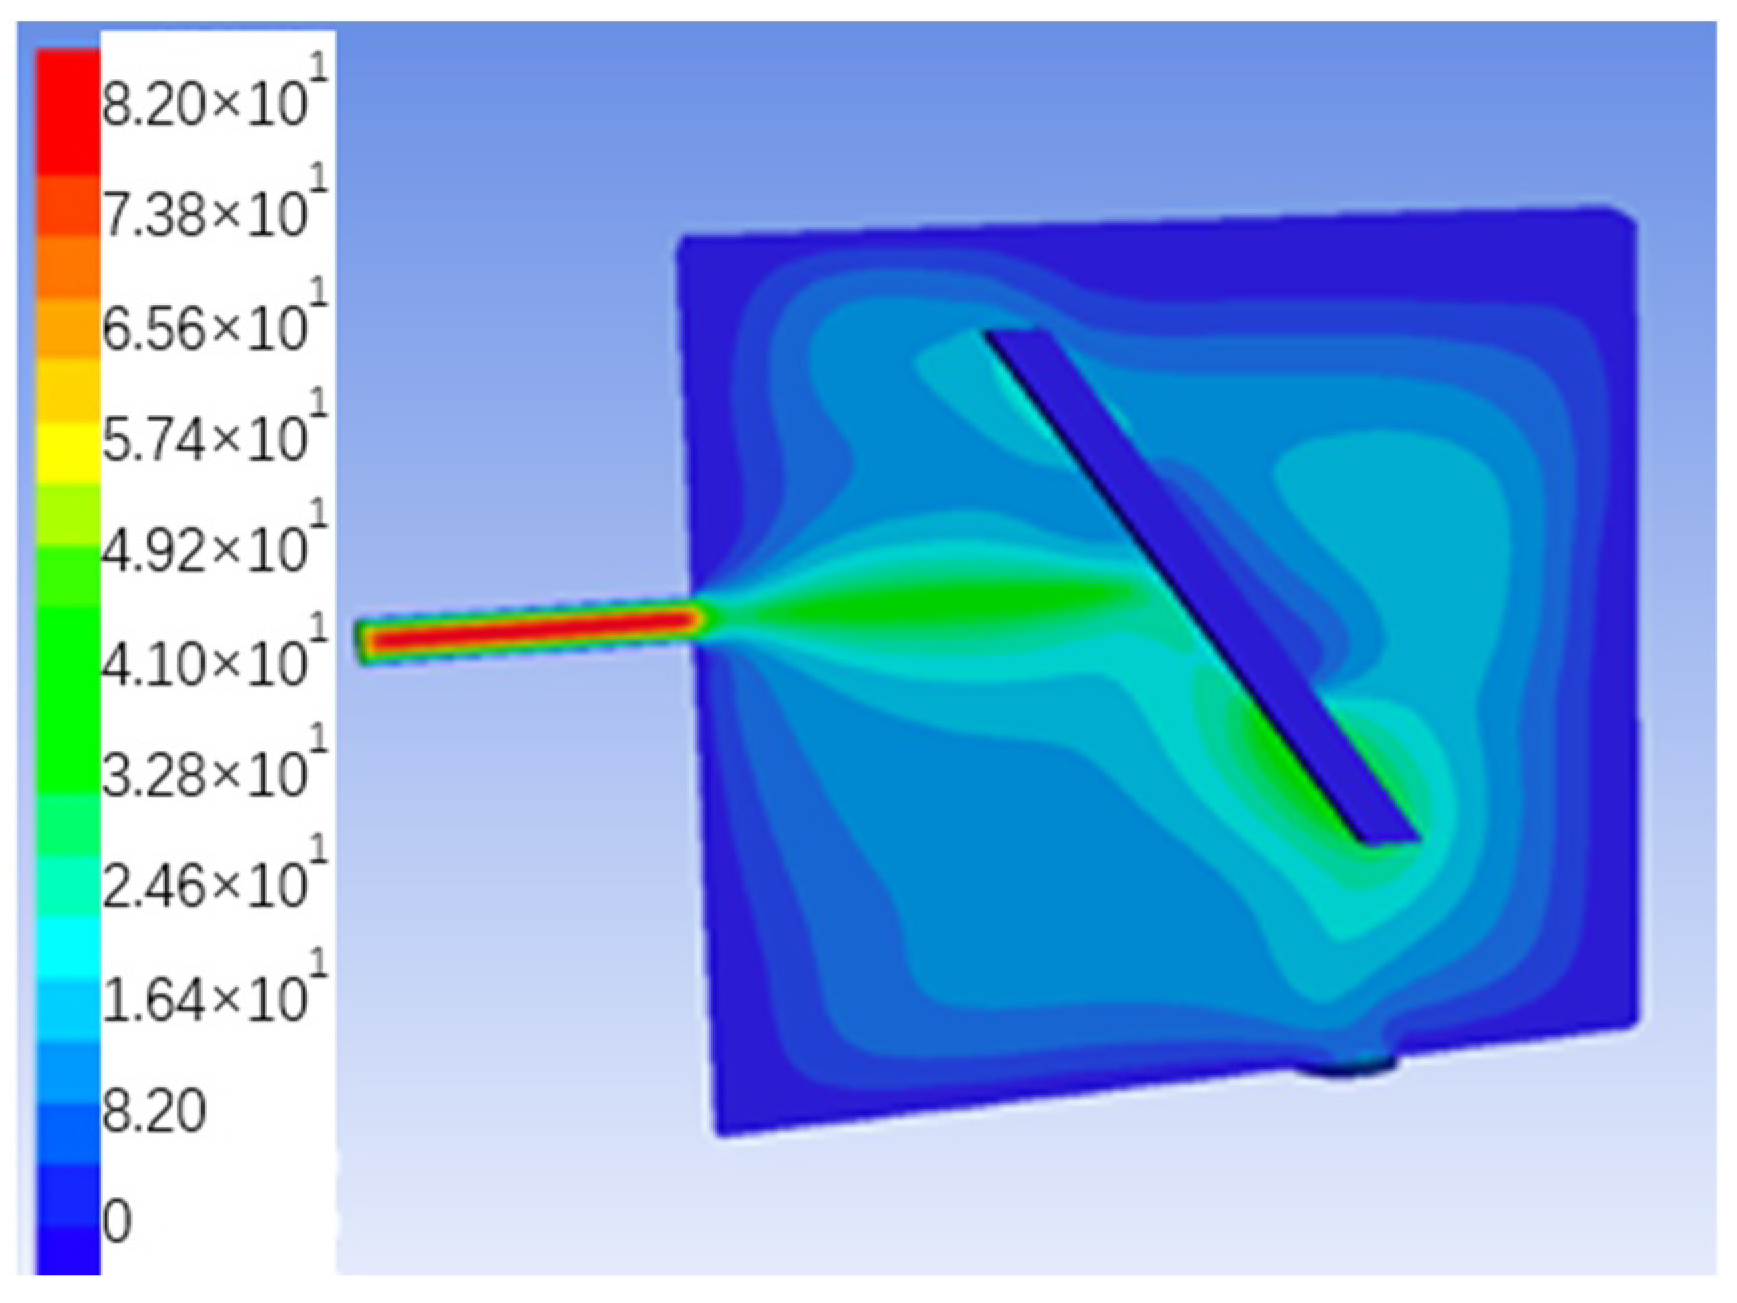
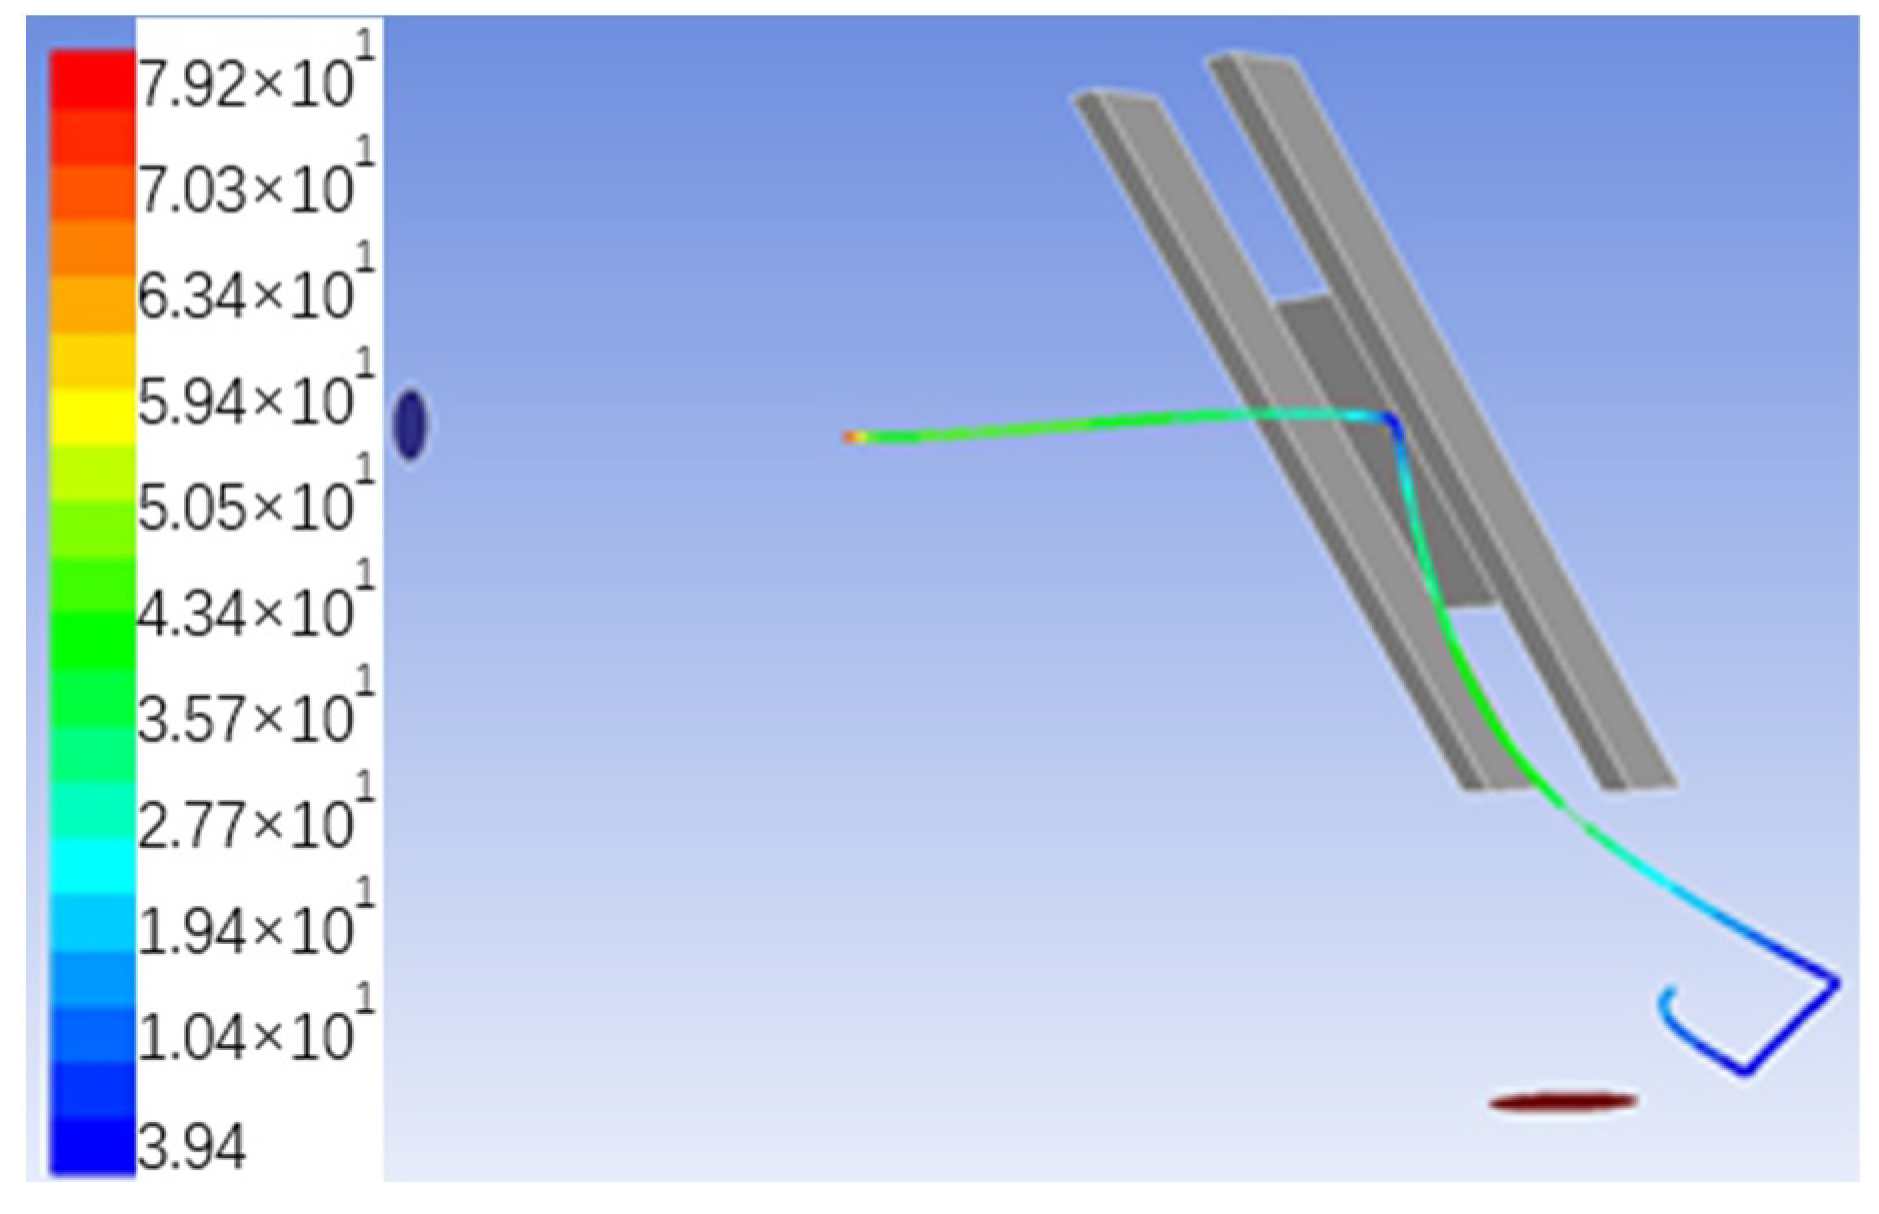
  • The angle of incidence of the projectile is 45°, and the front end shape is a cone. Pressure and velocity distributions for various conditions were obtained by Fluent simulation. The stone impact pressure could be extracted, and the speed–pressure and distance–pressure curves could be drawn.

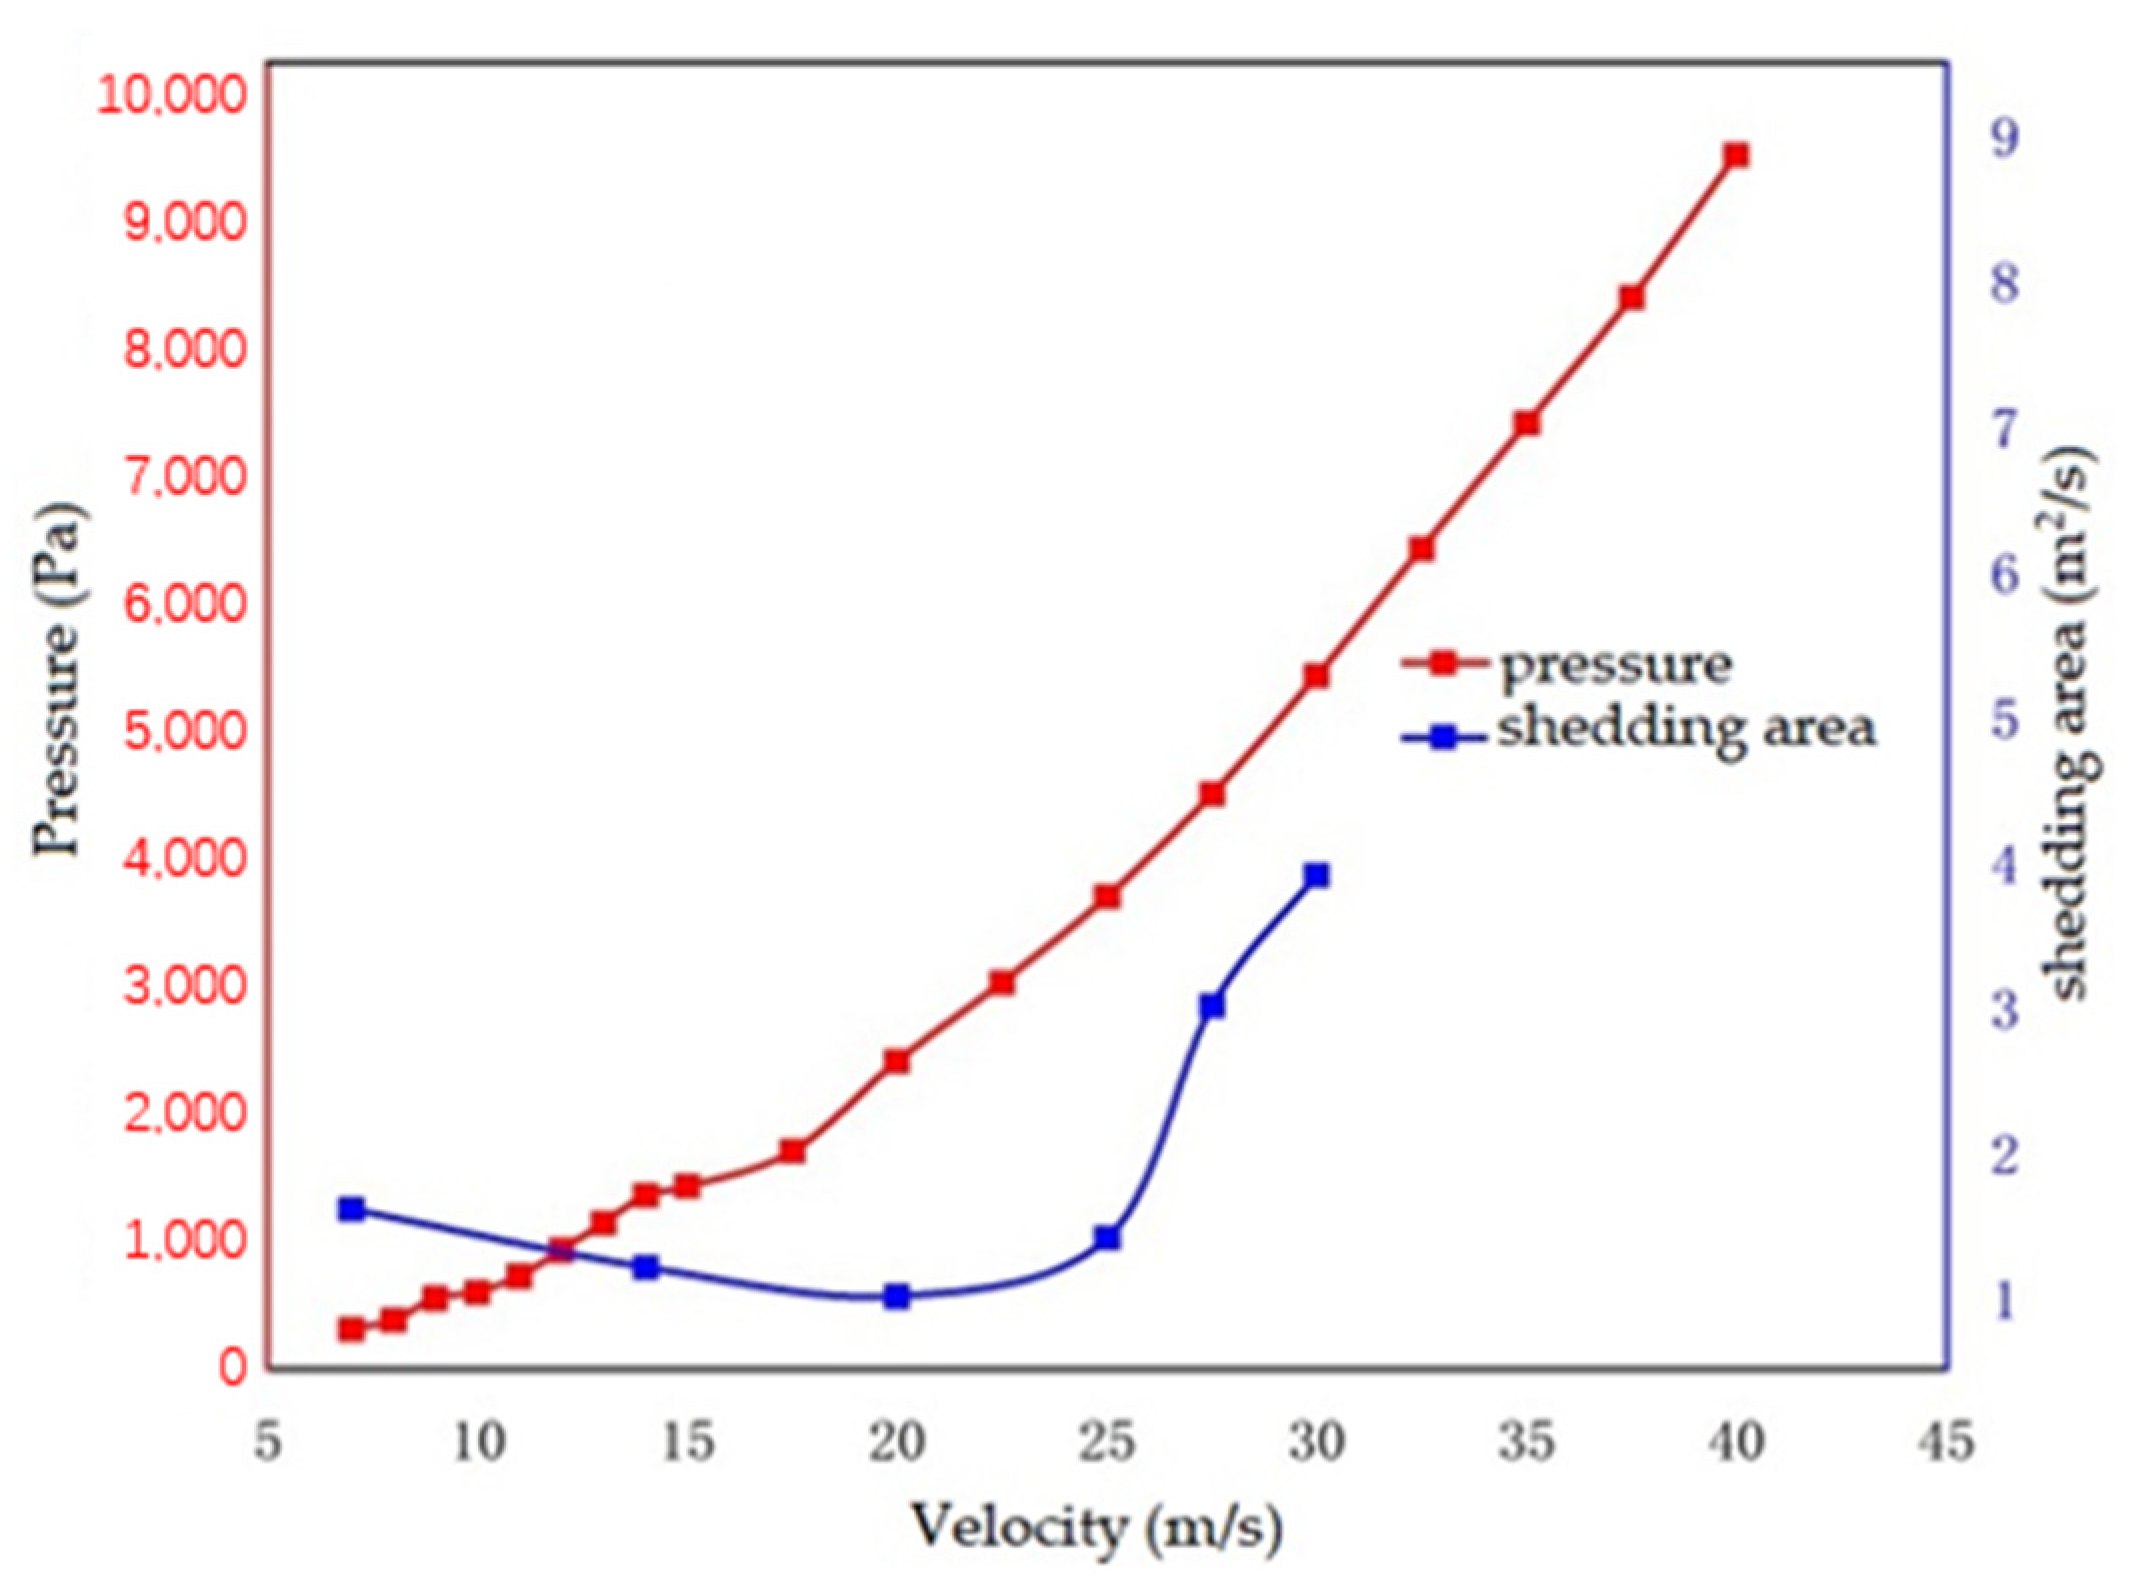
3.1.1. Effect of Projectile Velocity on Stone Impact Air Pressure

In the range of incidence velocity of 7–40 m/s, the Fluent fluid simulation of the projectile impact body coating was conducted, the stone impact air pressure was obtained, and the stone impact air pressure was extracted and converted into a velocity–pressure curve as shown in Figure 4. Compare curve A with the shedding area curve of the coating after being impacted by stones at different velocities at room temperature in reference [5], as shown in Figure 5.
As can be seen from Figure 4, the rate of pressure change with speed in curve A remains basically unchanged. In curve B, the slope of the curve increases significantly after 30 m/s, and the rate of pressure change increases with the increase in speed. In curve C, the rate of pressure change with speed remains basically unchanged, but the rate size fluctuates. Comparing the three curves, it can be seen that the slope of the curve of curve A is the most obvious, which proves that the shape of the projectile front end has a more obvious effect on the air pressure of the stone impact relative to the angle of incidence.
As can be seen from Figure 5, after the velocity is 20 m/s, the pressure–velocity curve of curve A has a good linear relationship, in which there are two slope change points, one corresponding to the velocity of 25 m/s and one corresponding to the velocity of 28 m/s. In the literature, the shedding area–velocity curve also shows an upward trend after the velocity of 20 m/s, and the abrupt point after the rise also corresponds to 25 and 28 m/s. This reflects the good correspondence between the two.
Before 20 m/s, because the stone shear stress did not reach the failure stress of the topcoat, the coating had a primer and electrophoretic layer adhesion failure, with good resistance performance; the relative rigidity of the coating was large; and the stone impact air flow had no effect on the damage of the coating. The faster the projectile velocity, the greater the pressure of the stone impact, the more intense the reflection of the projectile, and the shorter the impact time, so the shedding area decreases with the increase in the speed, and the faster the impact and dispersion of the stone impact air flow, the more irregularly it grows. Between 20 and 25 m/s, the stone impact shear stress reaches the destruction stress of the topcoat. At this time, the stone impact air flow participates in the destruction of the coating, and with the increase in speed, the air pressure shows a linear growth trend, and the shedding area also increases with the increase in speed. At 25 to 28 m/s, the coating is further damaged and develops into an entry failure. With the increase in the stone impact velocity, the damage of the coating increases rapidly, and the slope of the air pressure–velocity curve increases, indicating that the influence of the stone impact air flow is further increased. After 28 m/s, the coating enters the mixing failure stage. At this time, the coating continues to be destroyed; the projectile falls into the surface of the coating, causing plastic deformation to occur; and the influence of the stone impact air flow continues to increase, thereby further increasing the slope of the stone impact–velocity curve.

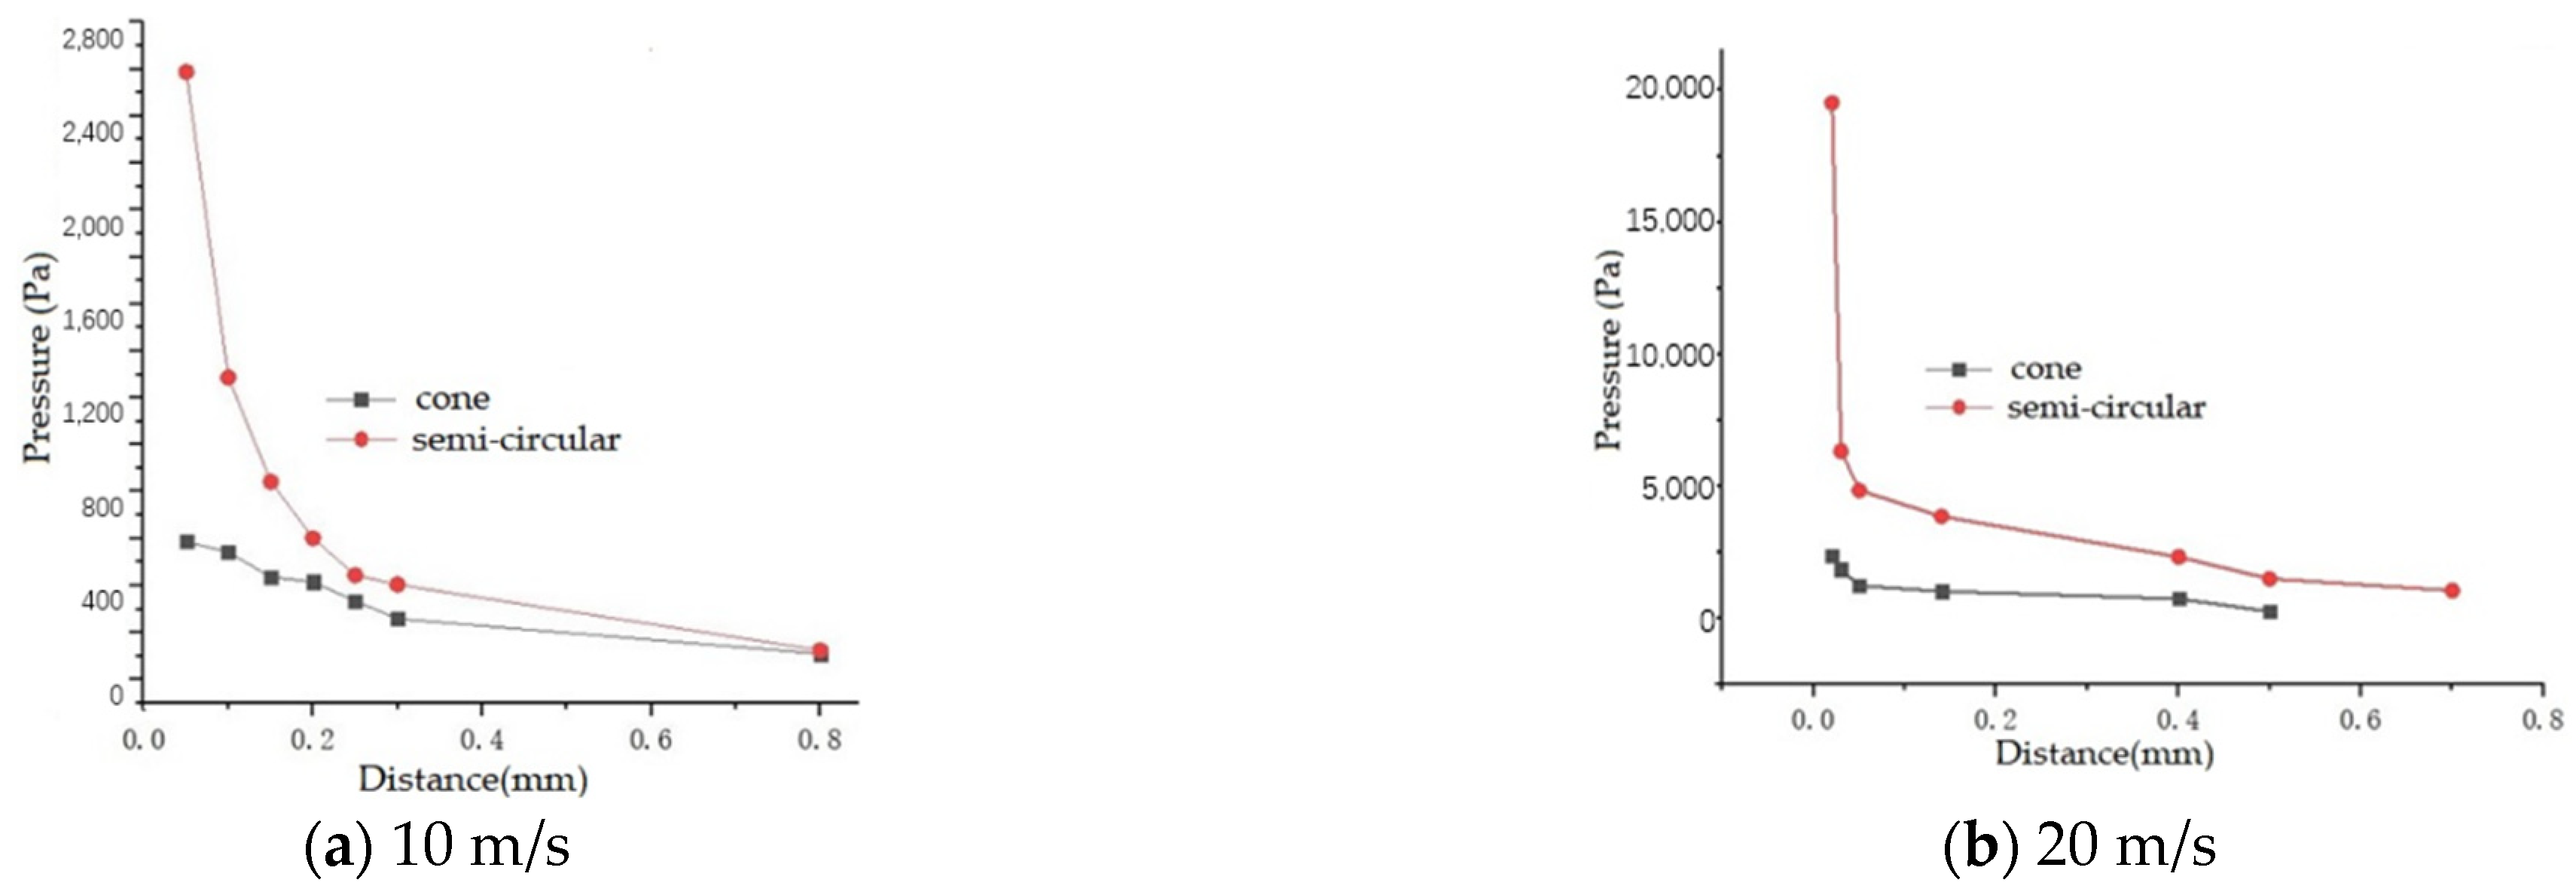
3.1.2. Effect of Projectile–Wall Distance on Stone Impact Air Pressure

The projectile velocity of 10 m/s simulates the impact process of the cone and semicircular surface projectiles driven by the airflow drive front and extracts the stone impact air pressure and converges into a pressure–distance curve as shown in Figure 6a. The fixed projectile velocity is constant at 20 m/s; numerical simulation is performed, and the pressure of the stone impact is extracted and merged into a distance–pressure curve as shown in Figure 6b.
As can be seen from Figure 6a, as the distance between the projectile and the wall surface decreases, the pressure of the stone impact gradually increases. When the projectile–wall distance is less than 0.3 mm, with the decrease in the projectile–wall distance, the increase in the pressure of the stone impact increases significantly, so the distance of 0.3 mm can be regarded as a mutation point. When the front end of the projectile is semicircular, the corresponding distance of the mutation point is smaller, about 0.2 mm. In general, compared with the cone projectile at the front end, the change of stone impact air pressure with the distance between the projectile and the wall surface is more obvious, and it increases sharply when approaching the stone impact point, which is mainly the reason why the kinetic energy of the impact air pressure blocked projectile is converted into pressure energy, and for the projectile with the front side of the cone, the air flow is blocked and spreads around.
As can be seen from Figure 6b, when the front end of the projectile is a cone, the mutation point is reduced from 0.3 to 0.15 mm. When the front end of the projectile is semicircular, the mutation point is reduced from 0.2 to 0.05 mm. Therefore, it can be obtained that with the increase in the projectile velocity, the corresponding distance of the mutation point of the slope of the stone impact air pressure and the projectile–wall distance relationship curve decreases.

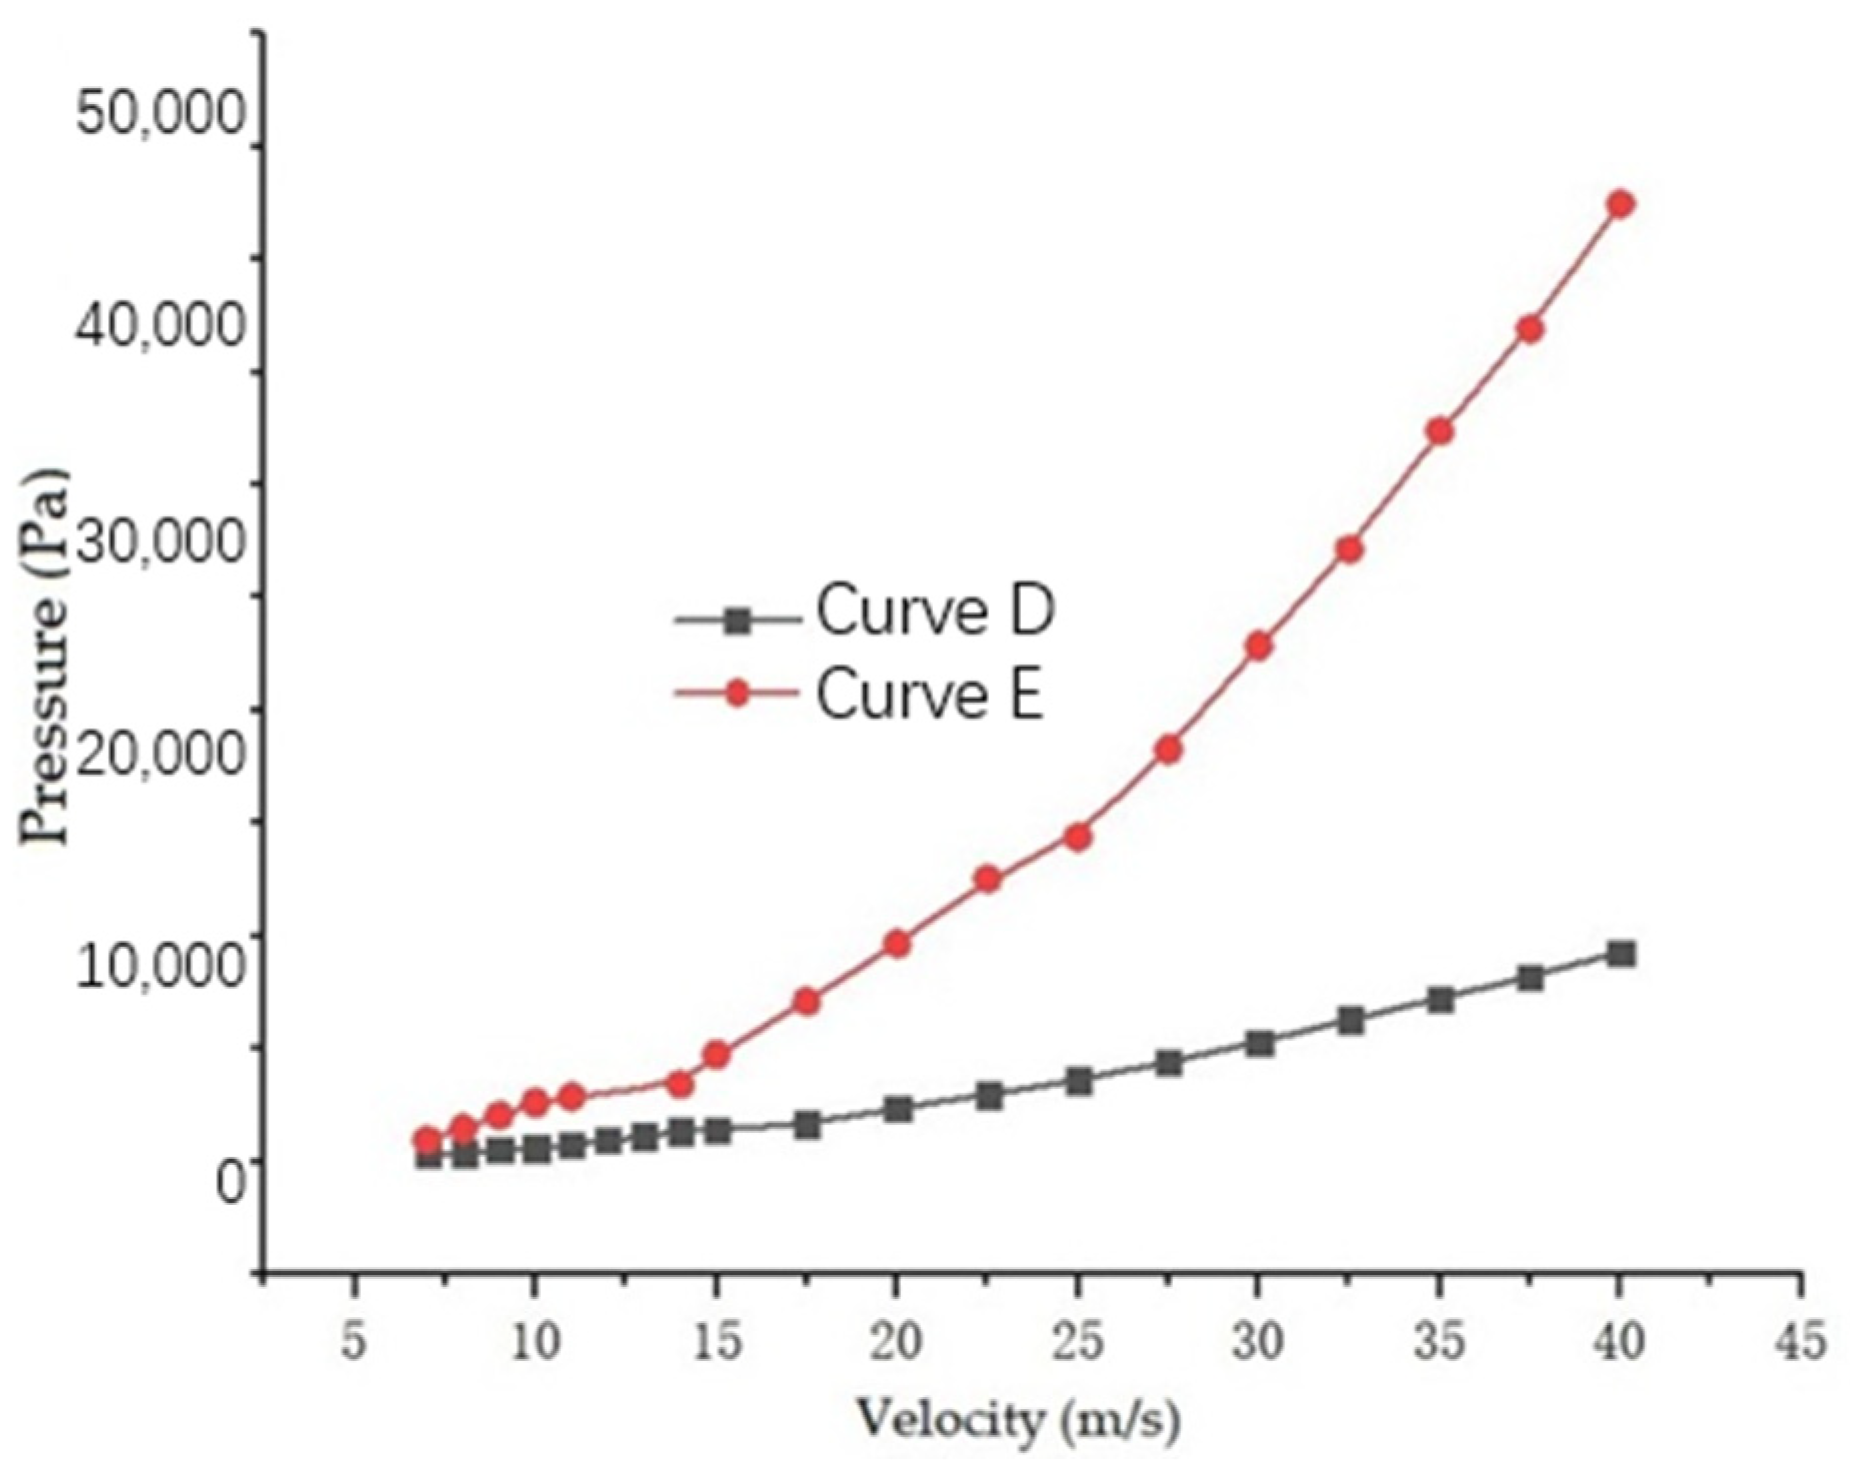
3.1.3. Effect of Shape of the Front End of the Projectile on the Air Pressure of the Impact Point

In order to obtain the change law of stone impact air pressure with impact velocity of the conical and semicircular surfaces of the frontal surface through the simulation of the stone impact process driven by the air flow of a large number of working conditions, the comparison of the stone impact air pressure with the impact velocity of the two types of projectiles with the cone and semicircular surface of the front side is obtained as shown in Figure 7.
As can be seen in Figure 7, (1) at the same speed, the air pressure of the semicircular end stone is greater than the air pressure generated by the cone end-face. This indicates that the semicircular end-face projectile has a more obvious compressive effect on the stone impact point during the entire stone impact, which is due to the fact that under the action of high-speed impact, the semicircular end pressure is more difficult to spread around than the cone. (2) In the case of a speed of less than 30 m/s, the air pressure of the two shapes of stone impacts is close to the amplitude of the increase with the speed. When the speed is greater than 30 m/s, the air pressure increase generated by the round end-face is much greater than the increase in the air pressure on the cone surface.
Since the formation of air pressure is closely related to the speed of air, in order to further analyze this difference, the air velocity distribution of the two different front-surface projectile impact states at 30 m/s is shown in Figure 8a,b, respectively.
From Figure 9, it can be seen that the air velocity of the semicircular projectile is less than the air velocity of the cone. This is because the curvature of the semicircular surface is larger than the cone surface, and the fluid in the narrow area between the vertex and the wall surface cannot quickly flow out to the surrounding area in a short period of time and is squeezed, so the fluid pressure in this area increases, resulting in an increase in the pressure difference between the gas and the environment when the gas finally flows out, and more pressure potential energy is converted into kinetic energy, which is manifested as an increase in speed. The curvature of the apex and surrounding area of the cone projectile is too small, and the squeezed fluid can quickly flow along the top, unable to form a high-pressure zone, and the speed cannot be greatly increased. Therefore, under the same speed distance conditions, the gas velocity of the impact point of the two is quite different.

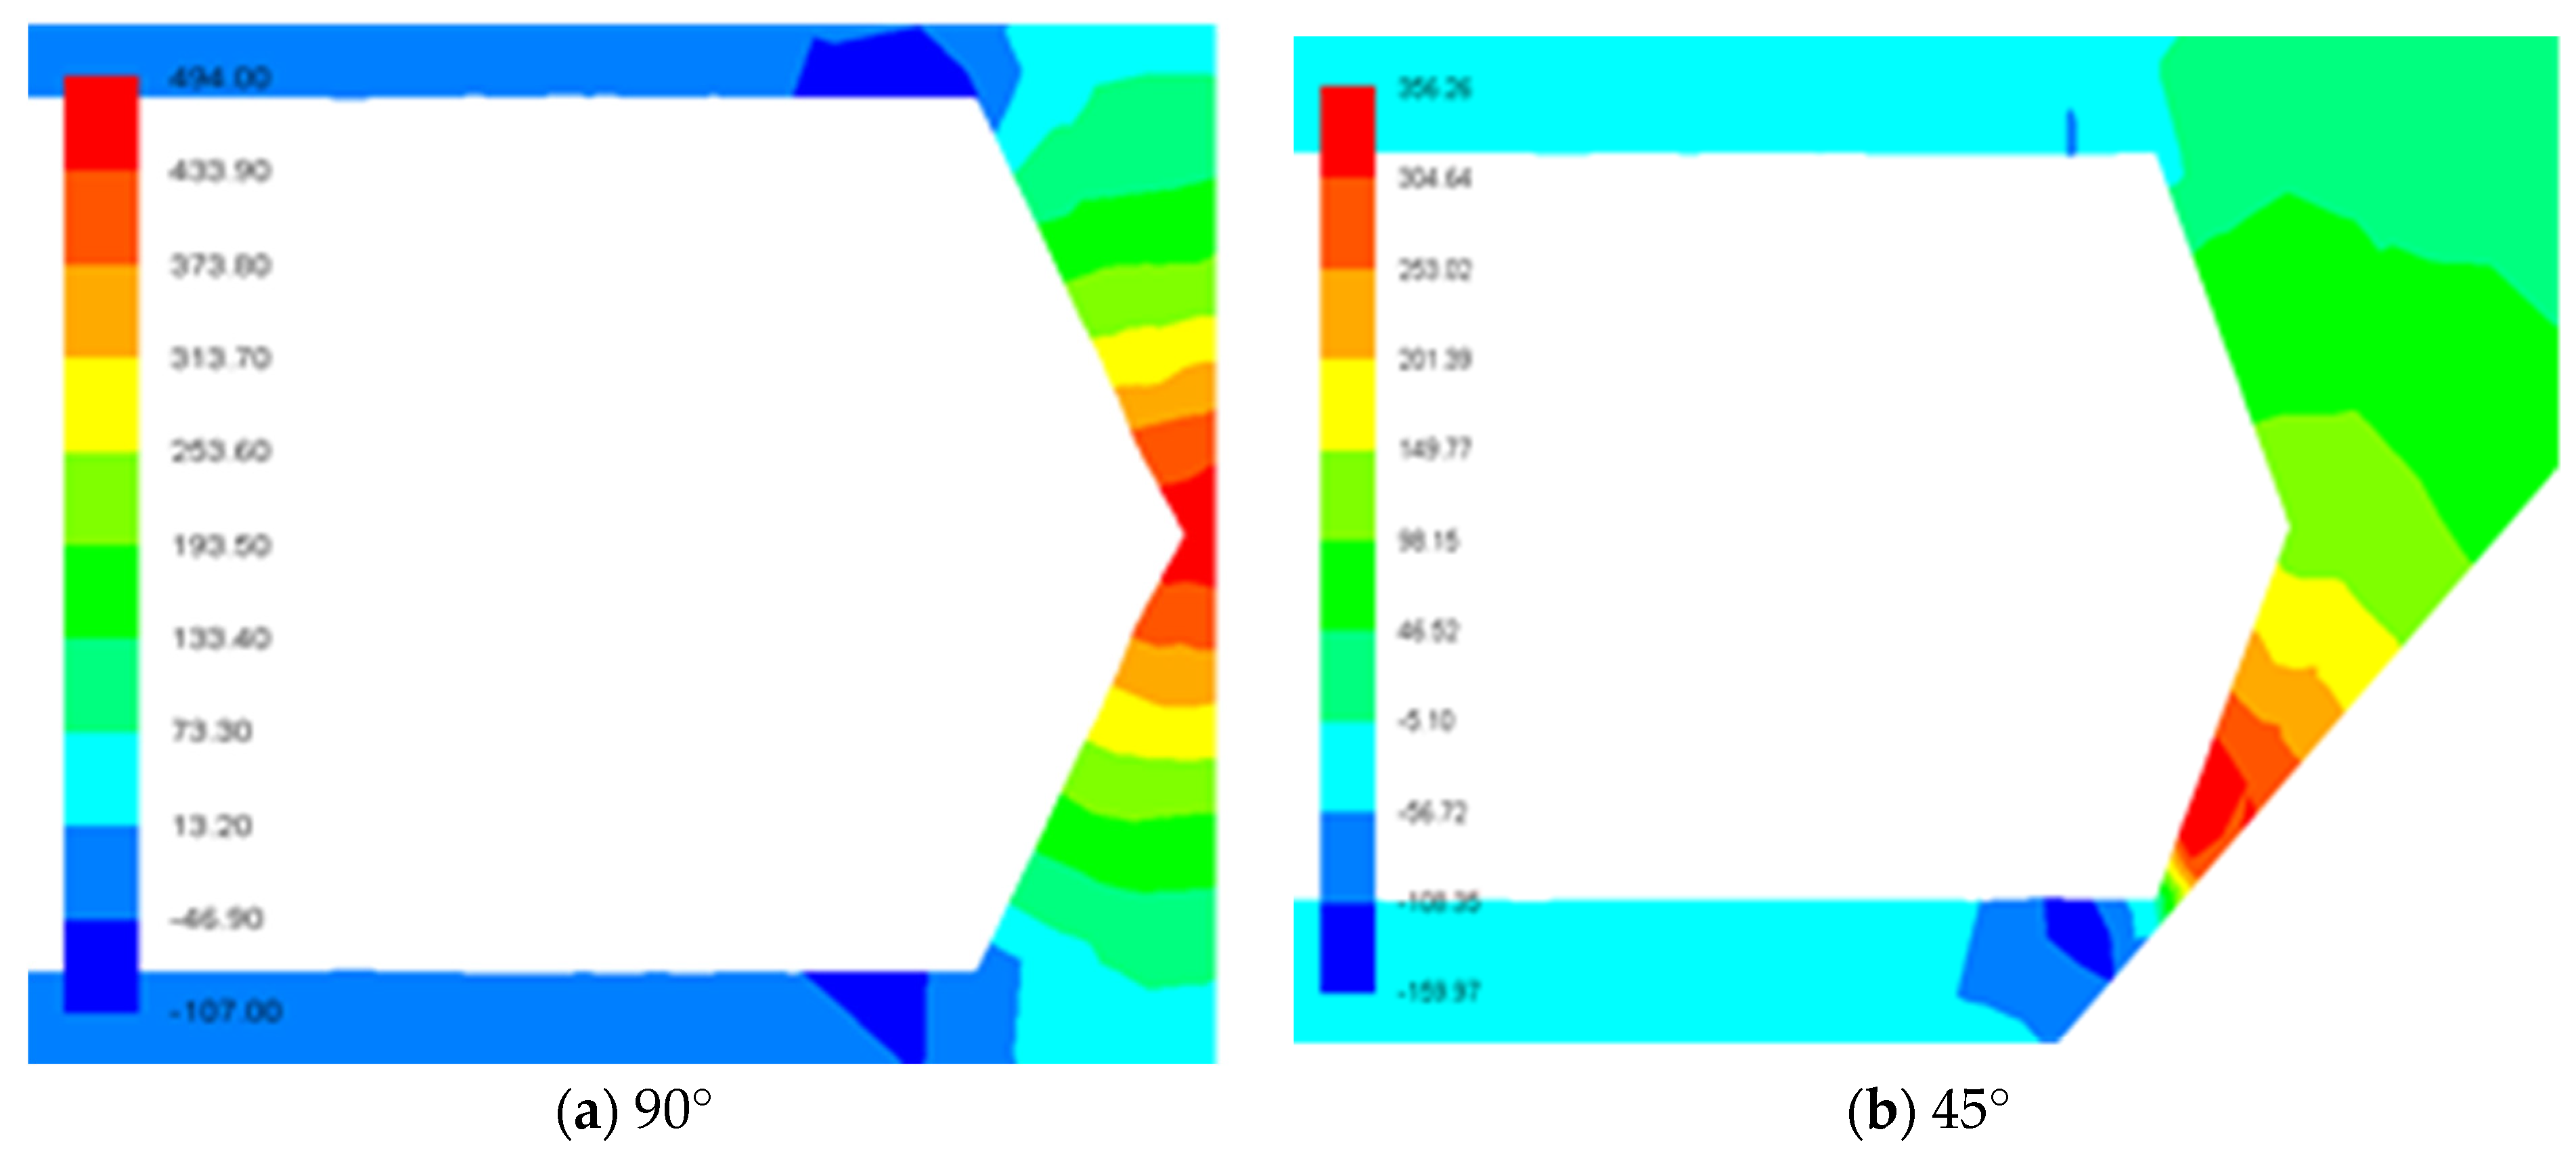
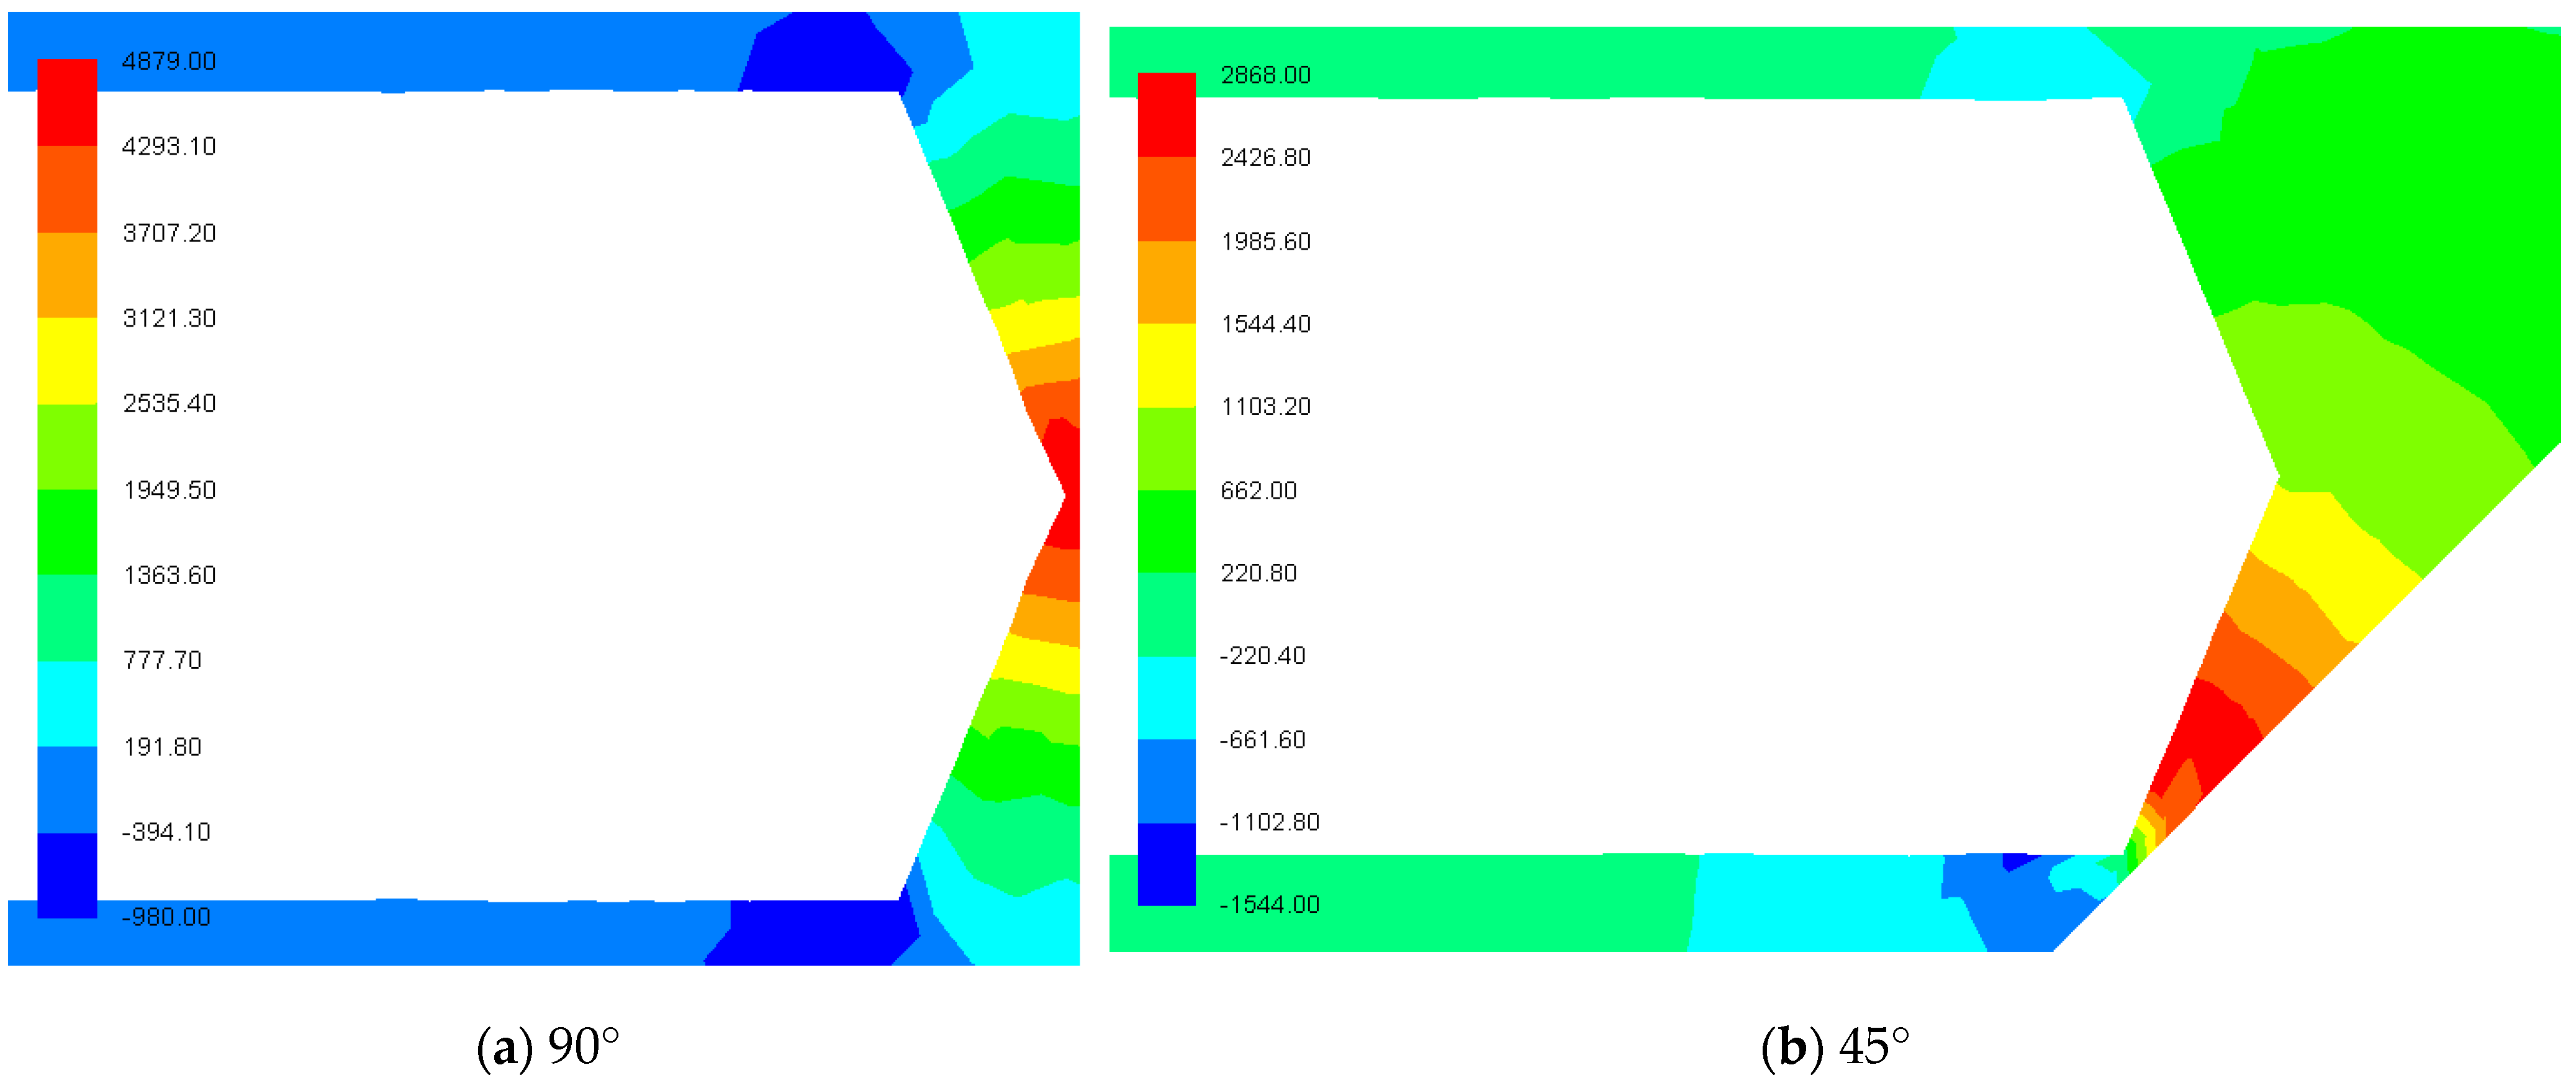
3.1.4. Effect of the Angle of Incidence of the Projectile on the Air Pressure of the Stone Impact

In order to obtain the effect of the projectile impact angle on the air pressure at the impact point, the simulation experiments were carried out under the two cases of the impact angles of 90 and 45°, respectively, and the pressure distribution of the two different shooting angles at a speed of 10 and 30 m/s was obtained as shown in Figure 9 and Figure 10.
From Figure 9 and Figure 10, it can be seen that (1) at the same speed, the pressure is symmetrically distributed at vertical incidence, and the maximum pressure point is at the impact point, and at the impact angle of 45°, the maximum pressure point appears in the narrow area formed below the projectile head and the wall. The reason for the analysis is that the gas flows evenly around the apex of the cone at the vertical incidence, so the pressure is symmetrically distributed. At 45°, the pressure of the projectile on the lower area forms a high-pressure area, which significantly increases the pressure in this area. (2) At the same speed, the value of the maximum pressure point of the vertically incident projectile is greater than the value of the maximum pressure point of the incident projectile at 45°. This is because the area between the top of the cone and the wall surface during the vertical incidence is narrow, and the maximum pressure generated by the gas pressure is concentrated at the impact point of the wall, while at 45° incidence, due to the squeezed gas basin formed under the projectile head and the wall surface, the maximum pressure is evenly distributed in a certain area of the watershed, and the pressure at the impact point of the projectile and the wall surface is relatively small.

3.2. Experimental Process and Results

3.2.1. Experimental Process

After debugging the experimental apparatus based on the DIN 55996-1 standard, the process of carrying out the experiment is as follows:
  • Open the protective cover of the anti-lithodometer box, install the 200 mm × 100 mm coating test plate and clamp it, paste the RP-S40-LT type resistive thin-film pressure sensor on the coating test plate, and connect the sensor controller (only for protection) and the digital oscilloscope with wires.
  • By moving the fixture axially in the direction of the spray gun, the distance between the center of the coating test plate and the center of the nozzle is 290 mm.
  • The surface of the coating test plate is parallel to the plane of the fixture plate, and the plane of the clamp plate is rotated so that the angle between the coating test plate and the impact direction of the stone particles is 54°.
  • Close the protective cover and tighten the fixing bolts.
  • Select the steel ball with a diameter of 3 mm after screening and load it into the feed plate, set the working pressure to the pressure required by the experiment, and set the resistance value debugged in the “Equipment Adjustment” step.
  • After the first impact test, the steel ball is recovered and the second impact test is carried out, and all conditions remain unchanged. Observe the change in voltage on the digital oscilloscope and record it.
  • After the impact experiment is over, remove the coating template, remove the pressure sensor, release the residual gas in the accumulator, turn off the power supply, and then manually reset the box position.

3.2.2. Experimental Results

The air pressure in the gas tank in the whole experimental process was maintained in the range of 0.6–0.8 MPa, and the inlet pressure was 50, 100, 150, and 200 kPa spray. Through the above-mentioned stone particles hitting the automotive test coatings, which included four to five coatings, including a pretreatment layer, an electrophoresis layer (CED-primer coat), a medium coat, a base coat, and a clear coat layer, as shown in Figure 11. After using tape to remove the loosely shedding debris coating, the morphology of coating failure was exposed, as shown in Figure 12.
Under the same experimental conditions, the thin-film micropressure sensor is used instead of the test coating, so that the stone strike pressure acts directly on the diaphragm of the sensor, so that the diaphragm produces a microdisplacement proportional to the medium pressure, so that the resistance of the sensor changes. At the same time, the sensor detects this change through the electronic circuit and converts and outputs a standard voltage signal corresponding to this pressure. Such a process is the measuring process of the thin-film pressure sensor. In order to obtain the pressure value of the impact point of the coating test board, each group of experiments needs to obtain three valid data; the average experimental results are shown in Table 5.

4. Discussion

A simulation model based on the DIN 55996-1 standard [44] stone resistance meter was further established to carry out simulation and experimental verification of stone impact resistance characteristics.

4.1. Simulation Study on the Characteristics of Stone Resistance

Based on the DIN 55996-1 standard stone impact resistance instrument, the simulation model of stone impact resistance was established, and the airflow pressure and velocity distribution of the stone impact process were simulated with the working pressure of 195.48 kPa corresponding to the stone particle injection speed of 40 m/s, as shown in Figure 13 and Figure 14, respectively.
As can be seen from Figure 13, the pressure of the high-pressure air flow drops from 572.77 kPa at the nozzle inlet (0, 0) to 10.61 kPa at the outlet (0, 200), the high-pressure gas flows rapidly to the four sides of the box after leaving the nozzle and enters the empty box, the pressure further drops to 0.6 kPa, and there is a pressure of −7.1 kPa around the outlet due to the flow of high-pressure gas. On the test plate facing the center of the nozzle, the gas is blocked in the direction of progress, resulting in a certain spoilage effect, so the pressure of the gas on the test plate rises to 8 kPa, and the gas flows through the test plate to the rear box to converge, so the air pressure rises again to 5 kPa.
As can be seen from Figure 14, the inlet speed from the nozzle inlet pipe (0, 0) was increased from 40 m/s to the outlet (0, 200) to 64.2 m/s, an increase of about 1.6 times. The maximum speed of the airflow in the center of the nozzle can reach 82 m/s, and the speed is reduced to 45 m/s after reaching the box, and then the speed of the airflow hits the breadboard and drops to 29 m/s, and the pressure increases.
The simulation obtained the trajectory and velocity of the movement of a single stone grain as shown in Figure 15 and Figure 16, respectively.
The trajectory of the stone particles on the test plate after being ejected from the injection tube driven by the high-pressure air flow is shown in Figure 15, and its color change reflects the speed change of the stone grains. As can be seen in Figure 16, the maximum ejection is 68.64 m/s, and then the velocity slows down until the speed of the hit on the test plate drops to zero; the flight time is rebounded after 0.0177 s, and then the stone particles are affected by the pressure and gravity of the gas and fall to the bottom plate of the test chamber.
In a further simulation of the relationship between the injection velocity and the motion time with the inlet velocity, and according to the momentum theorem, the impact force between the stone particles and the test plate is calculated with a single stone particle mass of 0.744 g, as shown in Table 6.
It is worth noting that during the multistone impact experiment, there was an impact between the stone particles and the tube wall and the stone particles; as a result, the impact velocity of the stone particles may actually be lower than the maximum speed at the time of ejection.

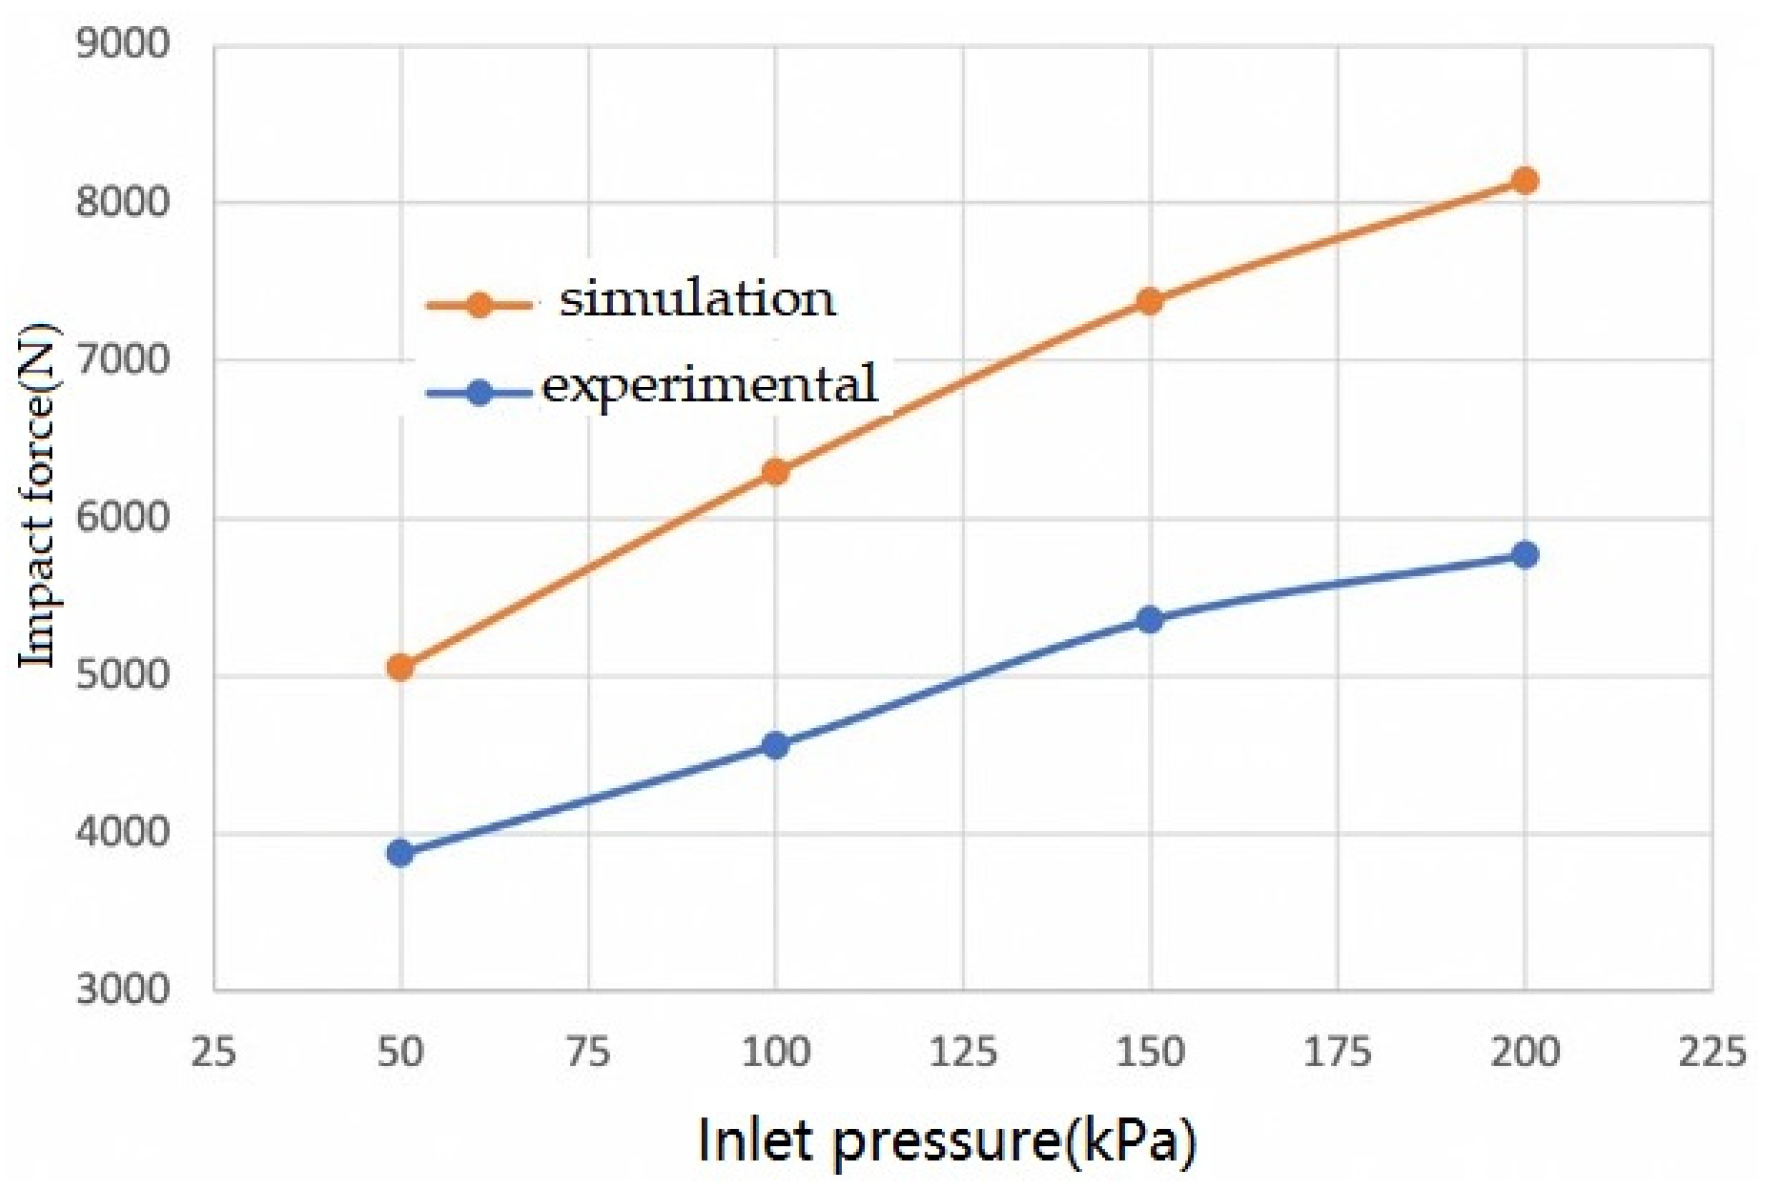
4.2. Experimental Verification of Stone Impact Resistance Characteristics

The impact force pair of the stone particle impact coating obtained from Table 5 and Table 6 is shown in Figure 17.
It can be seen from Figure 17 that with the high-pressure drive air pressure increase, the impact force of the stone particle impact coating is consistent; the average value of the ratio of simulation to experimental data is about 1.40, mainly because the simulation is carried out in an ideal state, and the actual environmental factors, equipment errors, human errors, and other reasons in reality make the experimental data deviate.

5. Conclusions

By establishing a CFD model of the airflow-driven stone impact process, the mechanism of anti-stone-damage automotive coating was simulated.
Based on single-impact resistance testing, the results of simulating the change of stone impact air pressure with projectile velocity, shape, projectile–coating distance, and impact angle show the following:
  • Stone impact air pressure increases with the increase in projectile velocity. At 90° incidence, the air pressure of the stone impact suddenly and rapidly increases when the semicircular surface projectile velocity is greater than 30 m/s. The air pressure of the conical projectile stone gradually increases with the decrease in the projectile–wall distance, and the air pressure at the distance of 0.3 and 0.15 mm suddenly increases at the projectile velocity of 10 and 20 m/s, respectively.
  • When the projectile velocity is less than 15 m/s, the stone impact pressure of the semicircular surface type is slightly greater than that caused by the conical type projectile. When exceeding 15 m/s, the pressure of the semicircular surface projectile suddenly increases.
  • At a velocity greater than 20 m/s, the incident pressure of 90° is gradually greater than the incident pressure of 45°. When the speed is less than 20 m/s, the shedding area decreases with the increase in the speed, while the stone impact pressure increases with the increase in the speed.
Based on the DIN 55996-1 standard stone resistance meter, the inlet pressure is 572.77 kPa, the injection speed is 63.95 m/s, the working pressure is 195.48 kPa, the spray speed of the stone particles is 68.64 m/s, the stone particles move 0.0177514 s during the spraying process, and the simulated stone particle impact force is 8142.56 N; the pressure, speed, and stone particle movement trajectory are obtained at the same time.
According to DIN 55996-1 anti-stone-impact experiment to obtain the impact force–pressure relationship, comparison with the simulation results shows that the trend of impact force increasing with the increase in driving air flow pressure is consistent, the simulation results are about 1.40 times the experimental results, and the simulation results are large and can be considered by increasing the test correction coefficient adjustment.
In summary, a CFD model that simulated the change of stone impact air pressure with projectile velocity, shape, projectile–coating distance, and impact angle was established, and the comparison of the experimental results with the simulation results showed that the trend of impact force increasing with the increase in the drive air flow pressure was consistent. The CFD model was developed for predicting the damage mechanism of automotive body coatings, reducing the number of stone impact instrument experiments, shortening the cycle, and reducing research and development costs.

Funding

This research was funded by [Science and Technology Planning Project of Guangzhou name of funder] grant number [201804020065], [National Key R&D Program of China] grant number [2017YFE0117300] and [Guangdong Basic and Applied Basic Research Foundation grant number [2021A1515010794].

Institutional Review Board Statement

Not applicable.

Informed Consent Statement

Not applicable.

Data Availability Statement

Not applicable.

Conflicts of Interest

The author declares no conflict of interest.

References

  1. Akafuah, N.K.; Poozesh, S.; Salaimeh, A.; Patrick, G.; Lawler, K.; Saito, K. Evolution of the Automotive Body Coating Process—A Review. Coatings 2016, 6, 24. [Google Scholar] [CrossRef] [Green Version]
  2. C-NCAP Management Center. C-NCAP Management Rules; China Automotive Technology and Research Center: Tianjin, China, 2017. [Google Scholar]
  3. Ramamurthy, A.C.; Buresh, G.A.; Nagy, M.; Howell, M. Novel instrumentation for evaluating stone impact wear of automotive paint systems. Wear 1999, 936, 225–229. [Google Scholar] [CrossRef]
  4. Papini, M.; Spelt, J.K. The plowing erosion of organic coatings by spherical particles. Wear 1998, 222, 38–48. [Google Scholar] [CrossRef]
  5. Lonyuk, M.; Bosma, M.; Riemslag, A.C.; Zuidema, J.; Bakker, A.; Janssen, M. Stone-impact damage of automotive coatings: A laboratory single-impact tester. Prog. Org. Coat. 2007, 58, 241–247. [Google Scholar] [CrossRef]
  6. Zang, M.; Lei, Z.; Wang, S. Investigation of impact fracture behavior of automobile laminated glass by 3D discrete element method. Comput. Mech. 2007, 41, 73–83. [Google Scholar] [CrossRef]
  7. Chen, M.; Liu, D.; You, C. Interfacial characteristic of graded hydroxyapatite and titanium thin film by magnetron sputtering. Surf. Coat. Technol. 2007, 201, 5688–5691. [Google Scholar] [CrossRef]
  8. Liu, B. Test and evaluation method for stone chip resistance performance of stone chip-resistant coating. Adhes 2018, 39, 54–56, 43. [Google Scholar]
  9. Li, Y.; Xiong, D.; Wang, L.; Feng, B.; Xu, J. Dynamic mechanical behavior and pedestrian safety characteristics of toughened laminated windshield. Compos. Part B 2019, 163, 740–751. [Google Scholar] [CrossRef]
  10. Xu, X.; Xu, J.; Chen, J.; Li, P.; Liu, B.; Li, Y. Investigation of dynamic multi-cracking behavior in PVB laminated glass plates. Int. J. Impact Eng. 2017, 100, 62–74. [Google Scholar] [CrossRef]
  11. Zhu, y. Analysis of new technologies in the field of modern automotive coatings. Polyurethane 2014, 11, 64–69. [Google Scholar]
  12. Samieian, M.A.; Cormie, D.; Smith, D.; Wholey, W.; Blackman, B.R.; Dear, J.P.; Hooper, P.A. On the bonding between glass and PVB in laminated glass. Eng. Fract. Mech. 2019, 214, 504–519. [Google Scholar] [CrossRef]
  13. Zhang, S.; Wang, W. Process study on improving stone strike resistance of hot-dip galvanized steel sheet coating. Automot. Technol. Mater. 2010, 5, 11–13. [Google Scholar]
  14. Xu, C.; Yuan, Y.; Zhao, C.; Tan, P.; Xu, X.; Li, Y. Dynamic crack-interface interactions in SGP laminated glass: An experimental investigation. Mech. Mater. 2018, 122, 76–84. [Google Scholar] [CrossRef] [Green Version]
  15. Sun, H.; Li, Y.; Li, T. Design method and evaluation principle of vehicle anti-stone impact. SAIC Mot. 2019, 9, 42–47. [Google Scholar]
  16. Xiao, G.; Ren, B.; Tong, C.; Hong, X. A quantitative evaluation method for obstacle avoidance performance of unmanned ship. J. Mar. Sci. Eng. 2021, 9, 1127. [Google Scholar] [CrossRef]
  17. Chen, Y. Research on Damage Simulation of Body Coating Based on Continuous Damage Mechanics; Jilin University: Changchun, China, 2012. [Google Scholar]
  18. Gao, W.; Zang, M. The simulation of laminated glass beam impact problem by developing fracture model of spherical DEM. Eng. Anal. Bound. Elem. 2014, 42, 2–7. [Google Scholar] [CrossRef]
  19. Xu, W.; Zang, M. Four-point combined DE/FE algorithm for brittle fracture analysis of laminated glass. Int. J. Solids Struct. 2014, 51, 1890–1900. [Google Scholar] [CrossRef] [Green Version]
  20. Chen, X.; Chan, A.H.; Yang, J. Simulating the breakage of glass under hard body impact using the combined finite-discrete element method. Comput. Struct. 2016, 177, 56–68. [Google Scholar] [CrossRef]
  21. Wang, X.; Yang, J.; Wang, F.; Liu, Q.; Xu, H. Simulating the impact damage of laminated glass considering mixed mode delamination using FEM/DEM. Compos. Struct. 2018, 202, 1239–1252. [Google Scholar] [CrossRef]
  22. Chen, X.; Chan, A.H. Modelling impact fracture and fragmentation of laminated glass using the combined finite-discrete element method. Int. J. Impact Eng. 2018, 112, 15–29. [Google Scholar] [CrossRef]
  23. Xiao, G.; Tong, C.; Wang, Y.; Guan, S.S.; Hong, X.; Shang, B. CFD Simulation of the Safety of Unmanned Ship Berthing under the Influence of Various Factors. Appl. Sci. 2021, 11, 7102. [Google Scholar] [CrossRef]
  24. Shi, W.; Zhai, L. Impact analysis and structural optimization of oil pan flystone. Intern. Combust. Engines Accessories 2021, 4, 14–15. [Google Scholar]
  25. Chen, S.; Zang, M.; Yoshimura, S.; Zheng, Z. An improved contact formulation for impact crack simulations in a laminated glass beam. Int. J. Comput. Methods 2018, 15, 1850077. [Google Scholar] [CrossRef]
  26. Gao, W.; Xiang, J.; Chen, S.; Yin, S.; Zang, M.; Zheng, X. Intrinsic cohesive modeling of impact fracture behavior of laminated glass. Mater. Des. 2017, 127, 321–335. [Google Scholar] [CrossRef]
  27. Lin, D.; Wang, D.; Chen, S.; Zang, M. Numerical simulations of impact fracture behavior of an automotive windshield glazing: An intrinsic cohesive approach. Compos. Struct. 2018, 186, 79–93. [Google Scholar] [CrossRef]
  28. Gao, W.; Wang, R.; Chen, S.; Zang, M. An intrinsic cohesive zone approach for impact failure of windshield laminated glass subjected to a pedestrian head form. Int. J. Impact. Eng. 2019, 126, 147–159. [Google Scholar] [CrossRef]
  29. Chen, S.; Mitsume, N.; Bui, T.Q.; Gao, W.; Yamada, T.; Zang, M.; Yoshimura, S. Development of two intrinsic cohesive zone models for progressive interfacial cracking of laminated composites with matching and non-matching cohesive elements. Compos. Struct. 2019, 229, 111406. [Google Scholar] [CrossRef]
  30. Peters, B.; Baniasadi, M.; Baniasadi, M.; Besseron, X.; Donoso, A.E.; Mohseni, M.; Pozzetti, G. XDEM multi-physics and multi-scale simulation technology: Review of DEM–CFD coupling, methodology and engineering applications. Particuology 2019, 44, 176–193. [Google Scholar] [CrossRef] [Green Version]
  31. Weinschenk, A.; Volk, W. Strategy to prevent surface deflections for automotive sheet metal parts. J. Phys. Conf. Ser. 2017, 896, 012058. [Google Scholar] [CrossRef] [Green Version]
  32. Alter, C.; Kolling, S.; Schneider, J. An enhanced non–local failure criterion for laminated glass under low velocity impact. Int. J. Impact. Eng. 2017, 109, 342–353. [Google Scholar] [CrossRef]
  33. Wang, N.; Zhang, X.; Du, Y. Test and evaluation method of stone impact resistance of automobile body coating. Automot. Technol. Mater. 2012, 3, 1–5. [Google Scholar]
  34. Li, Y.; Xing, W.; Wu, J. Research and Application of Stone Strike Resistance of Gradient Film Thick Bottom Adhesive. Shanghai Coat. 2017, 55, 33–35. [Google Scholar]
  35. Lonyuk, M.; Bosma, M.; Vijverberg, C.A.M.; Bakker, A.; Janssen, M. Relation between chip resistance and mechanical properties of automotive coatings. Prog. Org. Coat. 2007, 61, 308–315. [Google Scholar] [CrossRef]
  36. Chen, Y.; He, K.; Han, S.; Yuan, Y. Experimental study on three-layer tempered glass panel on quadrilateral simple bearing under local uniformly distributed load. Thin Walled Struct. 2019, 139, 294–309. [Google Scholar] [CrossRef]
  37. Zhang, X.; Zhao, Y.; Wang, C.; Hu, Q. Research on Impact Test and Evaluation Method of Flying Stone for Automotive Coating. SAIC Mot. 2017, 1, 18–22. [Google Scholar]
  38. Wang, X.; Yang, J.; Liu, Q.; Zhao, C. Experimental investigations into SGP laminated glass under low velocity impact. Int. J. Impact Eng. 2018, 122, 91–108. [Google Scholar] [CrossRef]
  39. Chen, S.; Chen, X.; Li, G.-Q.; Lu, Y. Development of pressure-impulse diagrams for framed PVB-laminated glass windows. J. Struct. Eng. 2018, 145, 4018263. [Google Scholar] [CrossRef] [Green Version]
  40. Vedrtnam, A.; Pawar, S. Experimental and simulation studies on fracture and adhesion test of laminated glass. Eng. Fract. Mech. 2018, 190, 461–470. [Google Scholar] [CrossRef]
  41. Razin, A.A.; Ramezanzadeh, B.; Yari, H. Corrigendum to “Detecting and estimating the extent of automotive coating delamination and damage indexes after stone chipping using electrochemical impedance spectroscopy”. Prog. Org. Coat. 2016, 95, 136. [Google Scholar] [CrossRef]
  42. Yang, W.; Chang, Y.; Li, W.; Jiang, Z.; Li, Z.; Ma, Q. Study on the Properties of Lightweight Stone Crash Protection Coating on Car Bottom. Automot. Technol. Mater. 2021, 2, 38–42. [Google Scholar]
  43. Mi, Y.; Su, B.; Han, L. The Quantitative Evaluation of Stone Test Based on Image Recognition. Mod. Paint. Finish. 2019, 22, 47–52. [Google Scholar]
  44. Cao, C. Research on the design of anti-stone impact of car. Automot. Pract. Technol. 2018, 23, 33. [Google Scholar]
  45. Society of Automotive Engineers, Inc. 400 Commonwealth Drive; 15096-0001, SAE-J400[S]; Society of Automotive Engineers, Inc.: Warrendale, PA, USA, 2002. [Google Scholar]
  46. Xiao, G.; Wang, H.; Chen, L.; Hong, X. Predicting unsteady heat transfer effect of vehicle thermal management system using steady velocity equivalent method. Sci. Prog. 2021, 104, 1. [Google Scholar] [CrossRef] [PubMed]
Figure 1. Geometric model and boundary conditions. (a) The overall geometric model. (b) The bullet and drive airflow inlet. (c) The bullet jet stream profile.
Coatings 12 00295 g001
Figure 2. Mesh Model.
Coatings 12 00295 g002
Figure 3. Anti-stone-impact experimental device.
Coatings 12 00295 g003
Figure 4. Velocity–pressure curves.
Coatings 12 00295 g004
Figure 5. Pressure is compared with the shedding area.
Coatings 12 00295 g005
Figure 6. The relationship between impact pressure and distance. (a) The projectile velocity of 10 m/s. (b) The fixed projectile velocity is constant at 20 m/s.
Coatings 12 00295 g006
Figure 7. Impact air pressure–velocity curve.
Coatings 12 00295 g007
Figure 8. Velocity distribution of the two different front-surface projectile impact states: (a) cone projectile and (b) Semicircular projectile, at 30 m/s.
Coatings 12 00295 g008
Figure 9. Pressure distribution of the two different shooting angles: (a) 90° and (b) 45°, at a speed of 10 m/s.
Coatings 12 00295 g009
Figure 10. Pressure distribution of the two different shooting angles: (a) 90° and (b) 45°, at a speed of 30 m/s.
Coatings 12 00295 g010
Figure 11. The automotive body coating construction.
Coatings 12 00295 g011
Figure 12. The morphology of coating failure.
Coatings 12 00295 g012
Figure 13. Pressure distribution.
Coatings 12 00295 g013
Figure 14. Velocity distribution.
Coatings 12 00295 g014
Figure 15. Pressure distribution of a single stone grain.
Coatings 12 00295 g015
Figure 16. Velocity distribution of a single stone grain.
Coatings 12 00295 g016
Figure 17. Comparison of the impact forces of stone particle impact coatings.
Coatings 12 00295 g017
Table 1. Compressor parameters.
Specifications and
Models
Power/VoltageExhaust Pressure (MPa)Maximum Exhaust Capacity (m3/min)Freezing MethodExhaust PortWeight
(kg)
10HP Screw compressor7.5 kW/380 V0.81.1Air-cooledG1/2″210
Table 2. Accumulator parameters.
Volume (m3)Exhaust Pressure (MPa)Height/Diameter (mm)Inlet and Outlet Diameter
10.82090/800G1-1/2″
Table 3. Thin-film pressure sensor parameters.
ModelSize (mm)Effective Area (mm)Sensitivity RangeThickness (mm)Trigger ForceResistance When Not Triggered
RP-S40-LTLength 43.7 × width 43.7Length 38.1 × width 38.120 g~10 kg0.420 g, default resistance value is less than 200 kΩHigher than 10 MΩ
Table 4. Detailed data for the DS 5022M digital oscilloscope.
BandwidthReal-Time Sampling RateEquivalent Sample RateRise TimeHorizontal AccuracyPhaseVertical Sensitivity
25 MHz250 MSa/s50 GSa/s14 ns±0.01%±3°2 mV/div~5 V/div
Table 5. Stone particle impact experimental data.
Working Pressure (kPa)Shock Voltage (V)Average Voltage (V)Corresponding Pressure (N)Simulated Pressure (N)Pressure Ratio
503.273.283.303.28387054521.41
1003.423.383.403.40455962921.38
1503.523.523.513.52535273771.38
2003.613.603.593.60576381421.41
Table 6. Velocity–impact force relationship.
Inlet Speed (m/s)Ejection Speed (m/s)Spurt Time (S)Impact Time (S)Impact Force (N)
1526.140.02759310.02756295452.25
2034.590.02119360.02116626292.19
2543.070.02024690.02022056741.21
3051.570.02007320.02004637377.60
3560.100.01902540.01899847647.62
4068.640.01775140.01732558142.56
Publisher’s Note: MDPI stays neutral with regard to jurisdictional claims in published maps and institutional affiliations.

