Abstract
A self-developed and newly re-designed chemical SAW sensor system composed of four polymer-coated and four differently modified nano-diamond-coated SAW sensors was applied to measure aromatic compounds in gasoline in a low-cost, fast, and easy way. An additional short packed column at the system inlet improve the selectivity for various possible fuel applications. The column allows the direct sampling of liquid fuels and pre-separates the different components in groups (aromatic and aliphatic compounds) from a fuel sample. Since the sensors employed show linearity towards concentration, an easy quantification of single fuel components was possible even within the group of aromatic compounds.
1. Introduction
The fast and easy detection of organic vapors or gases is widely agreed to be a major task in chemical analysis, especially for environmental on-site purposes as well as for quality control. In order to reveal the composition of even mixtures of different gases, the development of a sensor array containing multiple chemical sensors with a different sensitivity towards a certain analyte is indispensable. To keep the costs low, such sensor systems are mostly based on the same sensor principle. In the last few years, many different approaches were developed based on quite different chemical sensor principles. An interesting new approach are sensors based on chemiresistors, using different metal oxides that have a less inbuilt porosity or nanostructure, such as nanoneedles or wires. Depending on the material itself, its structure, and the applied temperature, it was shown that they provide different sensitivities towards different gases. Since the use of different temperatures will fail on a small-scale array due to a reduced option to use a strong enough and controlled temperature gradient, the approach of using different metal oxides or different nano structures within the same array could lead to some sort of success [1,2]. However, all these systems use changes of resistance as signals. Within an array, it is rather complicated to keep an accurate and multiple resistance readout simple enough for low-cost applications.
We think an older approach which came up already in the 1990′s using Surface Acoustic Wave (SAW) Sensors are still a promising tool to serve as analytical devices for a wide range of applications for gas and vapor analysis. Delsing et al. recently showed that this technique is still on a good and promising way to solve many practical tasks in the general sensor business [3]. SAW-based chemical sensors provide fast responses; simple handling, small size, and last but not least a great flexibility by the choice of sensitive
In combination of several sensors a selectivity profile can be achieved by a proper selection of a set of sensitive coatings towards a certain application.
The goal is to achieve a fingerprint profile related to the composition of a given matrix of interest, making possible the qualitative as well as the quantitative analysis of the matrix [4]. Usually, common thermoplastic polymers like polyisobutylen (PIB) and polybutylmethylacrylate (PBMA) are used as sensitive coatings due their wide range of interactions with organic compounds, availability, low cost and its suitableness by the most used coating techniques.
More recently, another completely different class of material has been applied for the sensitization of this kind of sensors promising greatly improved longevities: Super hard diamond-based coatings precipitated out of plasma under vacuum conditions. By a proper choice of the plasma chemistry, these diamond coatings can be modified in their physical structure creating different nanometric structures, which influences the sensitivity and response time as a sensitive coating, as well as their surface chemistry influencing their selectivity towards the analyte gas [5].
Many practical applications for an analytical gas sensor system are often located in an in situ and/or outdoor situation, additionally often paired with a tricky chemical task. This means that very often, a complex chemical mixture has to be characterized like that of the resulting quality of coffee beverage by the analysis of the harvested beans [6]. Another challenging task is the characterization of fuel compositions. Besides the specification control of the commercial products, the detection of adulterations is also a sensitive issue. In many countries, chemical solvents are dumped illegally via the commercial fuel processing chain. Thus, an easy to use and low-cost instrumentation that can answer all those needs involved in the fuel commercial chain is highly desired. The combination of gas chromatographic standard column with a SAW sensor system leads to a powerful device able to measure complex samples allowing a very welcome component pre-separation based on the affinity with the gas chromatographic column.
Therewith this work presents the application of a self-developed hybrid SAW device coupled with a short-packed column to measure aromatic compounds in gasoline samples. Such aromatics are one of the most important parameters to determining the gasoline quality.
2. Methodology
2.1. SAW Sensor System
The SAW sensors applied were especially self-designed SAW resonators with gold transducers, purchased from SCD Components Dresden after our design suggestions [7]. They work at an operation frequency of 433 MHz. The design is close to a standard SAW resonator design with some special features allowing the acceptance of high loads of sensitive coatings. Therefore, it contains many passive reflector fingers compared to small amount of active finger pairs in the middle of the structure. Since the sensors will be capacitively coupled with the driving electronics (see Figure 1 and Figure 2), it needs 4 relatively large pads towards the device edges for proper coupling to obtain the nominal impedance match at 50 Ohms at its operation frequency of 433 MHz (see Figure 1).
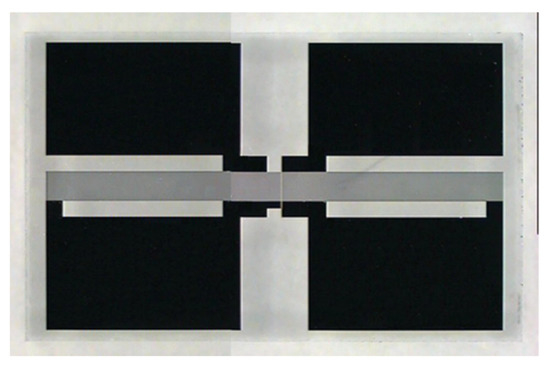
Figure 1.
Used self-developed SAW device (4 mm × 8 mm in size) with 4 large contact pads at the edges, respectively. This provides easy capacitive coupling with the circuit board keeping 50 Ohm impedance.
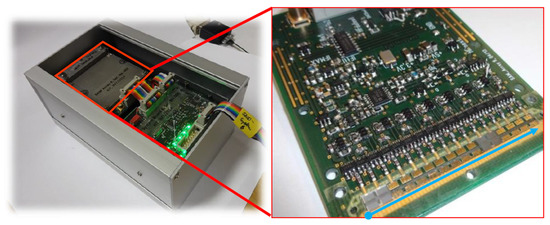
Figure 2.
(a) Newly re-designed SAW sensor system with PC interface board and the SAW sensor array as a closed high frequency unit (left side) containing the sensor array within a milled aluminium box on the far left. (b) Shows the inside: a closed high frequency unit with the open RF circuit board and the integrated sensor array. Below, the blue arrow indicates the location of the straight milled channel covered by the eight sensors elements. The blue arrow is located a few millimeters parallel of the channel where the sample gases are pumped their way, from left to the right, through the milled channel covered by the sensors’ elements. For this photo, only two SAW sensors are placed upside down in positions 1 and 6. The sensors are equipped with gold transducers with the SAW resonator design shown in Figure 1. Of course, this setup requires a complete sensor array with all eight sensors positioned and properly tightening above the gas-probing channel.
Another self-developed and newly re-designed SAW sensor system with an 8-fold sensor array was used for the measurement. It follows a new technique of operation by using only one single oscillating circuit ring with only one single amplifier and 16 voltage-controlled RF-switches (see Figure 3). Always a particular sensor of the 8-fold in–line-array is included in this oscillator circuit by the means of its two connecting RF-switches, respectively. This particular sensor serves as the frequency determining element of the oscillator ring at this specific moment. After typically 100 ms, the next sensor is interrogated by switching the next pair of RF switches. Figure 3 shows the principle using this setup.
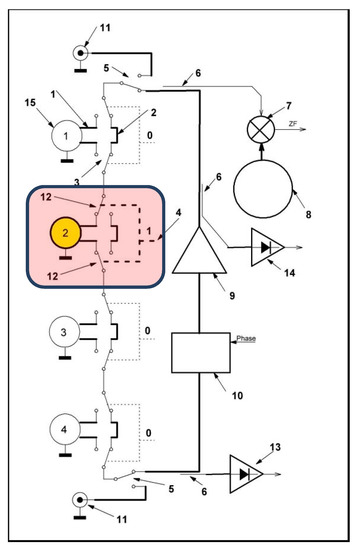
Figure 3.
Schematic electronic setup here simplified by 4 (1–4) instead of 8 sensors. It contains only one oscillator loop involving one amplifier (9), 3 power splitters (6), 1 controllable phase shifter (10) and 2 high frequency switches (12) per sensor, respectively. A particular SAW sensor (here No. 2) is included in the oscillator loop by switching the corresponding pair of RF switches (12). A single common reference oscillator (8) works permanently at 433.92 MHz and delivers the difference frequency (ZF) using a mixer (7). By means of the output ratio of 2 diodes (13 + 14), the attenuation of the respective sensing device can be determined.
The new sensor system setup has also some additional features. After a proper initialization step, it allows an automated adjustment towards an optimal phase position for each individual sensor [8]. Each saved optimal phase value for a specific sensor is then applied via the voltage-controlled phase shifter as part of the oscillator loop. By the means of two power splitters before and after the amplifier, the output ratio of the latter is determined, and thus the attenuation of the respective sensing device. A separate oscillator (8) works at 433.92 MHz and delivers a common and continuous reference signal to generate difference frequencies (ZF) from all sequential sensor signals using a mixer (see Figure 3).
2.2. Application of Sensors into the SAW Sensor System
The sensor system contains a milled channel that is 1 mm × 1 mm in size that can accept 8 sensors in line. The channel area is PTFE coated after the milling process onto the circuit board. All sensors are placed face down onto their golden electrical contact pads, forming a closed channel that leads the analyte gas in fact inside and through the high frequency circuit board. A milled metal cover attached on top forms a mechanical stable configuration and provides a tight gas-sealing by means of a PTFE foil between the sensors backside and the cover. This way, 8 sensors with different sensitive coatings are placed and sealed onto the gas channel. Each coating type determines the sensor response and thus the output pattern of the complete sensor array.
For this work, the 8 sensors for the sensor system were divided into two groups: Sensors 1–4 we coated by ourselves with our standard polymers out of solution (see Table 1), and the sensors 5–8 were diamond-coated and provided by our partner CEA in Saclay near Paris, France. With its 8 differently coated sensors, the composition of the signals can then be identified by pattern recognition of the 8-fold sensor signals. In case of co-eluted compounds, a discrimination is possible via pattern recognition of the sensor signals.

Table 1.
Spin Coating parameters of the 4 self-coated sensors.
3. Experimental
3.1. Polymer Coatings
Before coating, the sensors were washed with acetone, followed by 30 min of UV-Ozone cleaning. A layer of 108 nm parylene-C was deposited by vacuum deposition (SCS Labcoater PDS2010), in order to homogenize the surface, promote adhesion, and improve aging performance [9].
Four sensitive polymers were selected to compose the sensor array: Polyisobutylene (PIB), Polylaurylmethacrylate (PLMA), Polybutylmethacrylate (PBMA), and Polychloro trifluorethylene co-vinylidene fluoride (PTCFE). The coating was performed by spin coating technique (Laurell MS-400B-6NPP/LITE). All parameters (solvent, rotation speed rate, concentration of the solution) were precisely controlled.
3.2. Diamond Nanoparticle Coatings
The four modified diamond nanoparticle coated sensors were provided by CEA (see acknowledgement), coated using the layer-by-layer technique, as described and published by CEA [5]. The sensors contain the following modifications:
- Sensor 5: Diamond-Alkyl-CH3.
- Sensor 6: Diamond-OH.
- Sensor 7: Diamond-Phenyl-Cl.
- Sensor 8: Diamond-Alkyl-SO3H.
3.3. Coupling of SAW Sensor with a Short Packed Gas Chromatographic Column
For this experiment, we chose a setup using a short self-packed column which causes only small pressure drops. Such a column also allows an easy sample input by simply dripping the liquid analyte at the input port while carrier gas is permanently flowing. This way, a sample mixture will be evaporated in the heated column and then resolved into individual signal peaks of single components. At the column exit, the SAW sensor system is attached (see Figure 4).
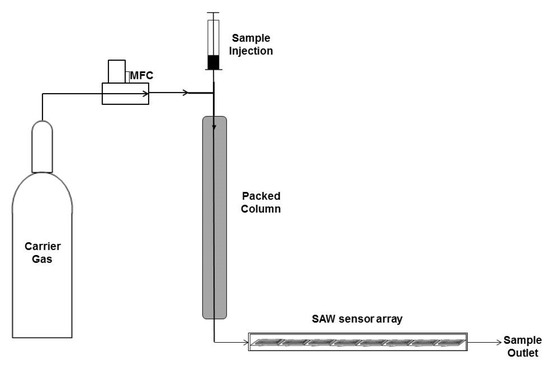
Figure 4.
Schematic Diagram SAW-GC using a heat controlled packed column followed by the SAW sensor array in one straight channel with a controlled sample gas flowing through that configuration.
This new method was self-developed and consists of a self-packed column (length: 50 cm, inner diameter: 2.2 mm) packed with 20% 1,2,3-tris [2-cyanoethoxy] propane in a Chromosorb P AW 80/100 matrix. The liquid sample was directly injected on the column with a microsyringe while the carrier gas could enter the column via a permanent open port. The speed of the carrier gas flow was controlled by a mass flow controller (Brooks 58505 0–30 mL/min. A heating wire outside the column allowed heating of the columns up to 80 °C. The schematic diagram is shown in Figure 2.
3.4. Standards and Samples
Some components usually found as constituents of gasoline were measured in order to see the ability of the sensor array in distinguishing different compounds. Additionally, a model gasoline has been prepared (in concentrations of % w/w), with some components usually found in commercial gasoline. To complete this set with a convenient candidate for illegal addition, benzene was used as well [10]. The component mix for testing was as follows: benzene: 1.48%; toluene: 9.0%; xylene: 15.3%; 1,2,4-trimethylbenzene:4.96%, 1-hexene:8.03%; cyclohexane: 5.10%; isooctane: 27.85%; n-hexane: 28.21%.
Five calibration mixtures were prepared in order to quantify the aromatic compounds. The range of concentration adopted is described: Benzene (0.3–4.2 wt.%); Toluene (2.2–25.3 wt.%), Xylene (3.8–43.0 wt.%), and 1,2,4-Trimethylbenzene (1.2–13.9 wt.%).
In order to avoid errors due to the injection losses, 1-hexanol was added as internal standard in a weighted amount (1 wt.%) in all samples as well as in the calibration curve. The calibration curve was built plotting the concentration of the analytes versus the ratio of the analytes’ frequency shift to the internal standard frequency shift. All the measurements were performed in triplicates.
In addition to the above-mentioned model gasoline compounds, ethanol was also measured; in some countries it is added once into gasoline in concentration of approximately 10 until 27 % (v/v) [11].
3.5. Measurement Conditions and Calibration
A sample of 0.16 µL was introduced by on-column injection technique through a silicon septum directly into the packed column with a micro syringe (1 µL, Hamilton). After the sample injection the column was maintained at 65 °C during 5.3 min, then increased to 85 °C at a temperature rate of 1.1 °C·s−1 and maintained at that temperature for 8 min. Finally, the temperature was increased again to 105 °C at a temperature rate of: 1.1 °C·s−1 and maintained at that temperature until the end of the measurement. During the measurements, the argon flow rate was kept at 30 mL·min−1, although close to the maximum which is not critical.
4. Results
4.1. Pre-Separation Results of the Model Gasoline Mixture
Figure 5 shows the real time course of a typical measurement of the sensor system: an 8-fold chromatogram consisting of the 8-fold oscillation frequency shifts (given in Hz) of the SAW sensors against the retention time (given in min), obtained for the measurement of the model gasoline.
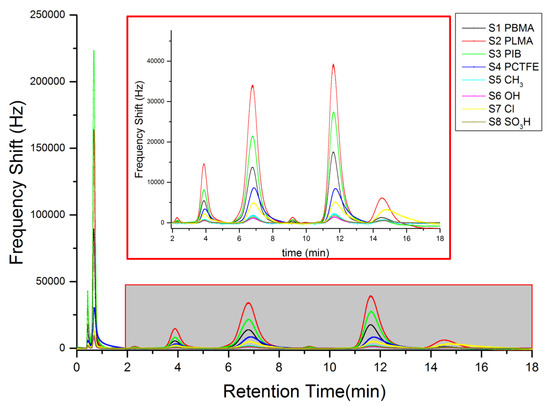
Figure 5.
Selective Separation of gasoline compounds: the inset shows the aromatic at retention times above 2 min with another scaling factor.
The upper part of Figure 5 is a scale expansion after 2 min of retention time.
In Figure 5, benzene was the first between the aromatic compounds to elute, at 2.28 min followed by toluene (3.88 min), xylene (6.79 min), and 1,2,4-trimethylbenze (11.63 min). As showed in Figure 5, the group of the aromatics in the gasoline model was very well resolved.
The aromatic compounds could be easily separated from other chemical functional groups by the self-packed GC column, and then fully discriminated within their own group by their retention times. The other components of the mixture eluted very fast (peaks at 0.43 and 0.67 min in Figure 5). The last eluted compound was the 1-hexanol (14.55 min in Figure 5) which was used as internal standard.
4.2. Pattern Characterization of the Model Gasoline Components
The response of the SAW sensor system was used to the qualitative characterization of the individual components of the model gasoline. The evaluation was made by means of the injection of each pure compounds individually and the measurement of its maximum oscillation frequency obtained in each sensor of the eight-fold array.
The results of the qualitative differences of the responses of each sensor are shown in Figure 6 in the form of radar plots for each individual pure component of the model gasoline.
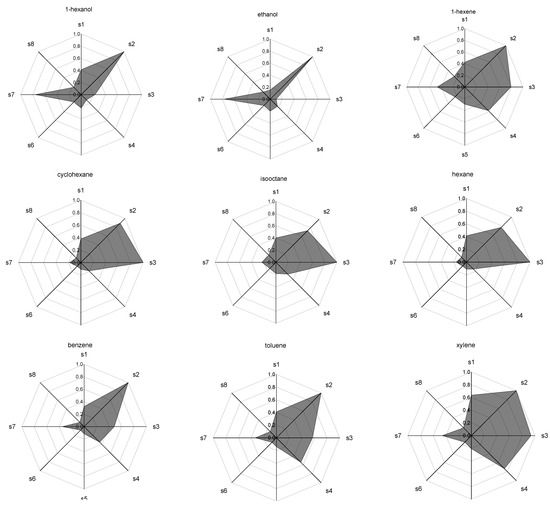
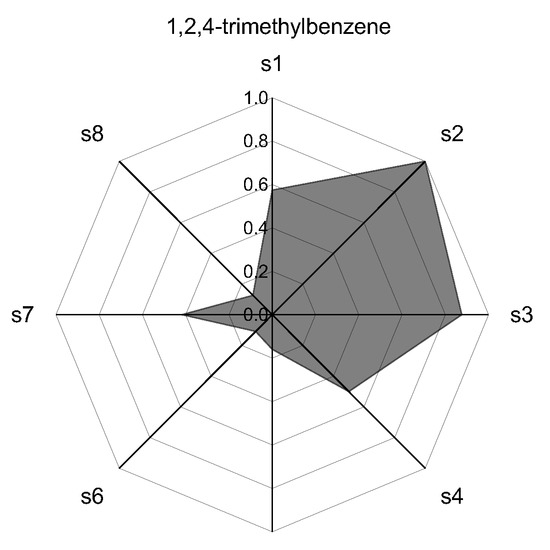
Figure 6.
Radar Plots (patterns) of the normalized response for each of the compounds of the model gasoline. The labels s1–s8 are the sensor numbers, respectively.
Each axis on the radar plots in Figure 6 represents the response of one of the sensors of the 8-fold array, identified as s1 to s8. The measured values for the maximum oscillation frequency in each sensor were normalized by the absolute maximum value obtained in the measurements of all compounds analyzed.
The results for each compound presented as a radar plot (Figure 6) provide a pattern for the qualitative characterization of each compound by the sensor array, allowing the recognition of the individual components.
The differences in the pattern obtained show the discrimination potential of the sensor system. Compounds belonging to the same organic function showed similar pattern as expected [12]. Within the group of the aromatic compounds, which are difficult to discriminate via pattern recognition, the pre-separation procedure allows the fully resolution and identification of each component, also providing a method for the quantitative analysis by means of the integration of the obtained chromatograms.
4.3. Principal Component Analysis
A principal component analysis (PCA) was applied in order to evaluate the discrimination ability of the sensor system. The first two principal components can explain 78.6% of the variance, as demonstrated in the Table 2, obtained with the results of the previous section.
Table 2.
Calculated data for the PCA plot in Figure 7.
The PCA plot (Figure 7) shows that the chemical groups can be easily discriminated forming at least 4 different clusters: 1-aliphatic; 2-olefins; 3-alcohols;4-aromatic. This means that each chemical group shows similar patterns. Especially in these cases (within a chemical function), the retention time can be used as a very valuable additional parameter as shown in the previous sections.
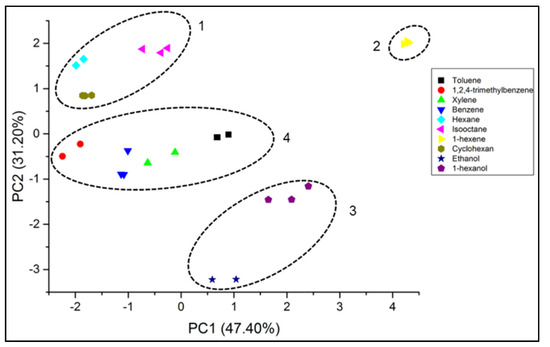
Figure 7.
PCA bi-plot of SAW sensor array data for different analytes. The dashed lines highlight 4 different clusters addressing aliphatic, olefinic, alcoholic, and aromatic compounds.
Table 3.
Calculated efficiency/contribution in selectivity of an individual coating of the sensors, respectively.
The results for the coefficients of the first and second principal components (Table 3) make clear that the contribution of all coating layers were significant for the discrimination of the compounds.
5. Conclusions
A newly re-designed SAW gas sensor system containing eight SAW sensor elements, four of them coated by four different organic polymers and the last four being coated with a special new diamond layer coating process, was employed to the analysis of the aromatic compounds of a model of gasoline, containing some other components found in the real fuel. The SAW sensor system is coupled with a short packed-GC column to allow a pre-separation of the components of the mixture.
The system could very well resolve the aromatics from the rest of the sample, and showed a very good differentiation of compounds of distinct chemical functions through the patterns obtained from the maximum oscillating frequency of the 8-fold sensor array.
The principal component analysis (PCA) showed that the first two principal component can explain 78.6% of all variances and that the groups of the same chemical function can be easily discriminated, forming four different clusters of each chemical functionality (aliphatic; olefins; alcohols; aromatic). The retention times obtained due the coupling of a short packed column provided a very valuable additional parameter, especially for the discrimination of components that show similar response patterns. Concerning the applied coating layers, the PCA analysis showed that the contribution of all coating layers were significant for the discrimination of the analyzed compounds.
The SAW system coupled with the smart gas chromatographic setup present a very valuable and promising tool for the analysis of complex mixtures of commercially available products like fuels in general, for that the need of a consistent and reliable analytic quality control is mandatory.
Since all the sensors employed showed a perfect linear response a quantification of all detected compounds can be expected [5,13]. An increase in the volume injected could especially improve the accuracy of the less sensitive nanodiamond coated sensors.
The presented system can still be improved and tailored according to the application of either by fine tuning of the SAW sensors, finding the most selective coating layers for the set of the eight sensors, and/or by the choice of the most appropriated GC material for an especially packed column, improving the separation of the compounds and allowing an optimized discrimination of the components of the mixture. In a future work, we will address other fuel relevant applications using the coupled system concept presented in this work.
Author Contributions
Conceptualization: M.R., A.V. and M.S.C.; methodology: M.R., C.C.S. and A.V.; software: A.V. and C.C.S.; validation: C.C.S.; formal analysis: C.C.S.; investigation: M.R. and C.C.S.; data curation: M.R., A.V. and C.C.S.; writing: M.R. and C.C.S.; writing—review and editing: M.R. and M.S.C.; visualization: M.R., M.S.C. and C.C.S.; supervision: M.R.; project administration: M.R. All authors have read and agreed to the published version of the manuscript.
Funding
This research received no external funding.
Institutional Review Board Statement
Not applicable.
Informed Consent Statement
Not applicable.
Data Availability Statement
Not applicable.
Acknowledgments
We thank Philippe Bergonzo and Emanuel Scorsone from the CEA in Saclay, France, for providing the nano diamond coatings on our SAW sensor devices.
Conflicts of Interest
The authors declare no conflict of interest.
References
- Hu, L.B.; Huang, X.Y.; Zhang, S.; Chen, X.; Dong, X.H.; Jin, H.; Jiang, Z.Y.; Gong, X.R.; Xie, Y.X.; Li, C.; et al. MoO3 structures transition from nanoflowers to nanorods and their sensing performances. J. Mater. Sci. Mater. Electron. 2021, 32, 23728–23736. [Google Scholar] [CrossRef]
- Dong, X.; Han, Q.; Kang, Y.; Li, H.; Huang, X.; Fang, Z.; Yuan, H.; Elzatahry, A.A.; Chi, Z.; Wu, G.; et al. Rational construction and triethylamine sensing performance of foam shaped α-MoO3@SnS2 nanosheets. Chin. Chem. Lett. 2022, 33, 567–572. [Google Scholar] [CrossRef]
- Delsing, P.; Cleland, A.N.; Schuetz, M.J.; Knörzer, J.; Giedke, G.; Cirac, J.I.; Srinivasan, K.; Wu, M.; Balram, K.C.; Bäuerle, C.; et al. The 2019 surface acoustic waves roadmap. J. Phys. D Appl. Phys. 2019, 52, 353001. [Google Scholar] [CrossRef]
- Barié, N.; Bücking, M.; Rapp, M. A novel electronic nose based on miniaturized SAW sensor arrays coupled with SPME enhanced headspace-analysis and its use for rapid determination of volatile organic compounds in food quality monitoring. Sens. Actuators B 2006, 114, 482–488. [Google Scholar] [CrossRef]
- Chevallier, E.; Scorsone, E.; Bergonzo, P. New sensitive coating based on modified diamond nanoparticles for chemical SAW sensors. Sens. Actuators B 2011, 154, 238–244. [Google Scholar] [CrossRef]
- Michishita, T.; Akiyama, M.; Hirano, Y.; Ikeda, M.; Sagara, Y.; Araki, T. Gas Chromatography/Olfactometry and Electronic Nose Analyses of Retronasal Aroma of Espresso and Correlation with Sensory Evaluation by an Artificial Neural Network. J. Food Sci. 2010, 75, S477–S489. [Google Scholar] [CrossRef]
- Avramov, I.D.; Voigt, A.; Rapp, M. Rayleigh SAW resonators using gold electrode structure for gas sensor applications in chemically reactive environments. Electron. Lett. 2005, 41, 450–452. [Google Scholar] [CrossRef]
- Reibel, J.; Stier, S.; Voigt, A.; Rapp, M. Influence of Phase Position on the Performance of Chemical Sensors Based on SAW Device Oscillators. Anal. Chem. 1998, 70, 5190–5197. [Google Scholar] [CrossRef]
- Stahl, U.; Rapp, M.; Wessa, T. Adhesives: A new class of polymer coatings for surface acoustic wave sensor for fast reliable process control applications. Anal. Chim. Acta 2001, 450, 27–36. [Google Scholar] [CrossRef]
- Singh, A.P.; Mukherji, S.; Tewari, A.K.; Kalsi, W.R.; Sarpal, A.S. Determination of benzene and total aromatics in commercial gasolines using packed column GC and NMR techniques. Fuel 2003, 82, 23–33. [Google Scholar] [CrossRef]
- Brudzewski, K.; Osowski, S.; Markiewicz, T.; Ulaczyk, J. Classification of gasoline with supplement of bio-products by means of an electronic nose and SVM neural network. Sens. Actuators B 2006, 113, 135–141. [Google Scholar] [CrossRef]
- Sobański, T.; Szczurek, A.; Nitsch, K.; Licznerski, B.W.; Radwan, W. Electronic Nose Applied to automotive fuel qualification. Sens. Actuators B 2006, 116, 207–212. [Google Scholar] [CrossRef]
- Stahl, U.; Voigt, A.; Dirschka, M.; Barié, N.; Richter, C.; Waldbaur, A.; Gruhl, F.J.; Rapp, B.E.; Rapp, M.; Länge, K. Long-Term Stability of Polymer-Coated Surface Transverse Wave Sensors for the Detection of Organic Solvent Vapors. Sensors 2017, 17, 2529. [Google Scholar] [CrossRef] [PubMed]
Publisher’s Note: MDPI stays neutral with regard to jurisdictional claims in published maps and institutional affiliations. |
© 2022 by the authors. Licensee MDPI, Basel, Switzerland. This article is an open access article distributed under the terms and conditions of the Creative Commons Attribution (CC BY) license (https://creativecommons.org/licenses/by/4.0/).