Article

Influence of Element Penetration Region on Adhesion and Corrosion Performance of Ni-Base Coatings

1
College of Engineering, Nanjing Agricultural University, Nanjing 210031, China
2
Key Laboratory of Intelligence Agricultural Equipment of Jiangsu Province, Nanjing 210031, China
*
Author to whom correspondence should be addressed.
Coatings 2020, 10(9), 895; https://doi.org/10.3390/coatings10090895
Submission received: 3 August 2020 / Revised: 15 September 2020 / Accepted: 16 September 2020 / Published: 18 September 2020
(This article belongs to the Special Issue Anticorrosion Protection of Nonmetallic and Metallic Coatings II)

Abstract

:
In this study, Ni–P/Ni–P–SiC coatings were prepared on pretreated 45 steel substrates by scanning electrodeposition. Prior to the electrodeposition, the substrates were subjected to two types of pretreatments: polishing and sandblasting. The 3D morphology of the pretreated substrates was characterized by laser scanning confocal microscopy. The micromorphology and section morphology of the coating surface were characterized by field emission scanning electron microscopy. The section element composition was characterized using an EDS energy spectrum analyzer. The adhesion and corrosion resistance of 15 coatings were analyzed using an automatic scratch tester and CS350 electrochemical workstation. The results showed the presence of an element penetration region between the coating and the substrate. The sandblasting pretreatment and SiC nanoparticle addition helped widen the penetration region of the elements. The Ni–P–SiC coating prepared by scanning electrodeposition on the sandblasted substrate exhibited the thickest penetration region, up to 28.39 µm. A scratch test conducted on this coating showed that it exhibits the best adhesion force, up to 36.5 N. In electrochemical corrosion experiments, its corrosion potential was found to be the highest, reaching −0.30 V, and the corrosion current density was the lowest, reaching 8.45 × 10⁻⁷ A·cm−2. The presence of the element penetration region increased the coating adhesion and improved the corrosion resistance.

1. Introduction

The 45 steel is used in making equipment and parts that require good comprehensive properties (corrosion resistance and formability) owing to its low price, high strength, and good machinability [1,2,3]. However, the conventional workpiece corrodes easily during service, thus limiting its applications [4,5,6]. Therefore, it is important to improve the surface performance of 45 steel substrates to protect against corrosion.
Currently, surface modification technologies include chemical heat treatment (nitriding and carburizing) [7,8], surface coating (low-pressure arc spraying [9] and laser remelting [10,11]), thin-film coating (physical vapor deposition [12,13] and chemical electrodeposition [14,15]), and non-metallic coating [16,17]. In the electrodeposition technique, the electrochemical reaction of ions under the action of an electric field is utilized to form a coating at the cathode. Although this technique has advantages, such as low cost, high efficiency, and simple preparation, the limiting current density and deposition efficiency are low [18,19,20]. As a new electrodeposition technique, scanning electrodeposition has a good mass transfer effect in liquid phases [21,22]. With the increase in the limiting current density, the crystal nucleus can be formed faster, the structure can be made uniform and compact, and the surface performance can be improved [21,22,23,24]. A Ni–P alloy has been used as a protective layer for a metal substrate owing to its good corrosion resistance [25,26,27,28]. SiC nanoparticles have advantages such as high purity, small particle size, and stable chemical properties. The codeposition of insoluble second-phase nanoparticles into an alloy coating can change the nucleation rate and reduce the grain size, and the prepared composite coating can exhibit an improved performance [29,30,31,32]. Mir et al. reported the formation mechanism of intermetallic compounds in electrodeposited Ni–P–TiO2 coatings on a copper substrate. The intermetallic compounds were evenly distributed in the microstructure of the coating to improve its mechanical and corrosion properties [26]. Li et al. prepared Ni–P–Al2O3 coatings on a Q235 steel by sol–gel and electrodeposition, and found that aluminum, oxygen, and sol can effectively improve the surface structure, hardness, and friction properties of the coating [25]. Although there have been reports on electrodeposited composite coatings, most of them were on the surface properties of the coatings. There are few studies on the section morphology, and these studies are limited to the coating thickness [33,34,35]. Cheng et al. electrodeposited a Ni–B coating on an 8620H steel substrate and found that after applying different pretreatments to the substrate, the coating thickness could be increased, thereby improving the adhesion [33]. The coating adhesion is another important factor affecting the corrosion resistance of coatings. In recent years, some relevant studies have shown that when the coating was deposited on the substrate, there would be element penetration between the coating and the substrate. Jiang et al. prepared Ni-Co-SiC composite coating on the NdFeB substrate by magnetic field-induced jet electrodeposition to study its wear resistance and corrosion resistance. Through the linear scanning of the elements from the coating to the substrate direction, it was found that the initial distribution of elements is stable, and then the Ni, Co, Si, and C elements show a downward trend, Fe elements show an upward trend, and finally were gradually stable. The prepared coating had good mechanical properties and corrosion resistance [29]. Wang et al. prepared superhydrophobic Ni coatings by pretreatment scanning electrodeposition by selective laser melting. Through the linear scanning of the elements, the element penetration was also found. From the direction of the coating to the substrate, Ni elements showed a downward trend, while C and O elements showed an upward trend. The coating showed excellent performance in corrosion resistance tests [22].
To shed new light on the adhesion and corrosion resistance of coatings, in this paper, we propose the concept of an element penetration region, which is formed by the mutual penetration of the elements between the coating and the substrate. To prove the existence of this element penetration region, we scanned the elements of the coating section. We pretreated substrates by polishing and sandblasting, and studied the influence of these pretreatments on the element penetration region. Ni–P/Ni–P–SiC coatings were scanning electrodeposited on the substrate, and the influence of adding SiC nanoparticles on the element penetration region was analyzed. Moreover, the effects of the element penetration region on the adhesion and corrosion resistance between the coating and the substrate were investigated. This study lays a foundation for further studying the element penetration mechanism between the coating and the substrate.

2. Experimental

2.1. Experimental Procedures

Figure 1 shows the experimental process. The substrate was pretreated by sandblasting (left), and then scanning electrodeposition (right) was carried out. The sandblasting process was implemented by supplying compressed air. A high-speed jet beam was formed in a sandblasting machine to spray sand grains onto the surface of the substrate at high speeds. The sand grains were then collected by a sand tank and were returned to the sandblasting machine through a sand delivery pipe for circulation. Here, the sand grains were sprayed onto the substrate surface to remove any contaminants and an oxide layer and impart a certain surface roughness. Due to the impact and cutting action of the sand grains on the substrate surface, the surface exhibited a plastic deformation, and the mechanical properties were improved [36]. The pretreated substrate was placed in an electrodeposition device for scanning electrodeposition. The electrolyte was filtered and then pumped from the plating solution pool. Subsequently, it was passed through a valve and flow-meter, then scanned and sprayed onto the substrate surface via the nozzle, and was finally returned to the plating solution pool through the outflow pipe for circulation. The plating solution pool was placed in a water bath to ensure constant-temperature heating. A nickel rod was connected to the positive pole and placed in the nozzle to ensure the supply of Ni2+ in the electrolyte. The substrate was connected to the negative pole to deposit the coating on the surface [22]. In the scanning electrodeposition process, the substrate was fixed in the deposition chamber, and the nozzle was fixed in the digital controller tool for a reciprocating motion.

2.2. Experimental Details

The substrate material used in the experiment was 45 steel (25 mm × 10 mm × 8 mm, Beijing Hua Wei Rui Ke Chemical Co., Ltd., Beijing, China). Table 1 lists its composition. The conventional polishing pretreatment involves grinding the substrate on a polishing machine with 800# (19 μm) and 1500# (10 μm) wet sandpapers, successively. In the sandblasting process, the gas pressure at the nozzle outlet of the sandblasting machine was 0.7 MPa, the substrate was placed 15 cm away from the nozzle, the angle was 90°, and the sandblasting time was 20 s. After the pretreatment, the samples were successively placed in acetone, ethanol, and deionized water for ultrasonic cleaning for 5 min and then air-dried at room temperature. Before the scanning electrodeposition, the workpiece was activated, and the sequence was as follows: electrolytic degreasing → weak activation → strong activation. After each step, the workpiece was washed clean with deionized water [26]. Table 2 lists the composition of the plating solution. All the reagents used were of analytical grade purity, and the solutions were prepared with deionized water. An NiSO4 (Shanghai Jing chun Biochemical Technology Co., Ltd., Shanghai, China) solution served as the main source of Ni2+ in the solution; an NiCl2 solution was used as an anodic activator to prevent anodic passivation; an H3PO3 (Shanghai Jing chun Biochemical Technology Co., Ltd., Shanghai, China) solution provided P atoms for the coating; an H3BO3 (Shanghai Jing chun Biochemical Technology Co., Ltd., Shanghai, China) solution was used as the buffer reagent to adjust the pH value in the bath; C6H8O7 (citric acid; Shanghai Jing chun Biochemical Technology Co., Ltd., Shanghai, China) was used as a complexing agent to prevent precipitation in the electrochemical reaction, increase the deposition rate and stability, and improve the coating quality; C12H25SO4Na (sodium dodecyl sulfonate; Shanghai Mai Ke Lin Biochemical Technology Co., Ltd., Shanghai, China) was used as a surfactant to increase the suspension of the SiC nanoparticles in the solution; and CH4N2S (thiocarbamide; Shanghai Mai Ke Lin Biochemical Technology Co., Ltd., Shanghai, China) was used as a whitener to refine the grain size. In the process of scanning electrodeposition, the current was set to 0.6 A, the pH of the plating solution was in the range of 1.0–1.5, the temperature was 60 °C, and the deposition time was 20 min.

2.3. Experimental Principle

Figure 2 shows the experimental principle. The Ni–P coating was prepared by scanning electrodeposition on 45 steel substrates, and an element line scan was performed on a section of the coating. A mutual infiltration was observed between the Ni and P elements in the coating and the Fe elements in the substrate. This led to the formation of an element penetration zone; the penetration of the main elements (Ni and Fe) was more evident. The penetration adhesion degree of the coating and substrate was complete and close owing to the existence of the element penetration region, and the adhesion force was increased. In a corrosive environment, when corrosive substances penetrate the coating, they will preferentially enter the element penetration region, which acts as a protective layer to alleviate the corrosion inside the substrate. The larger the element penetration region, the higher the corrosion resistance. In addition, the greater the coating adhesion, the better its degree of adhesion. Consequently, the bonding at the boundaries is more compact, thus effectively preventing the infiltration of corrosive substances. Compared with the polishing pretreatment, the sandblasting pretreatment of the 45 steel substrate can make the initial surface to appear rough, increase the roughness, and enlarge the surface area. The high surface roughness makes the adhesion between the coating and the substrate form a mechanical interlock and increase the adhesion force. A wider surface area is likely to enhance the coating thickness, which can help promote the interpenetration of the elements and widen the penetration region. The structure of the Ni–P coating can be refined with the addition of SiC nanoparticles. Compared with the Ni–P coating, the Ni–P–SiC coating exhibited a better performance. Although SiC nanoparticles have no electric properties to improve the corrosion resistance of a coating, they can accelerate the deposition, increase the thickness, and widen the element penetration region.

2.4. Instruments and Characterization

A laser scanning confocal microscope (LSCM, OLS4000, OLYMPUS, Tokyo, Japan) was used to characterize the 3D surface contour and roughness of the substrates pretreated using the two methods. A Quanta FEG 250 field emission scanning electron microscope (FEI-SEM) from FEI Instruments Inc. (Hillsboro, OR, USA) was used to investigate the surface morphology. The sectional element composition was characterized by energy dispersion spectroscopy (XFlash Detector 5030; Bruker AXS, Inc., Berlin, Germany). The adhesion of the coating was characterized using the friction method and an automatic scratch instrument for coating adhesion (WS-2005, Lanzhou ZhongkeKaihua Technology Development Co., Ltd., Lanzhou, China). The load was 40 N, and the scratch length was 3 mm. A CS350 electrochemical test station (Wuhan Corrtest Instruments, Wuhan, China) was used to conduct the electrochemical corrosion test. In this test method, a 3.5% NaCl solution was used as the corrosive medium. The scanning range was −1–1.5 V, and the scanning rate was 0.5 mV/s. The workpiece, Pt plate, and SCE electrode were used as the working electrode, auxiliary electrode, and reference electrode, respectively. The corrosion resistance was analyzed by measuring the polarization curve and AC impedance spectrum of the sample at room temperature without any agitation.

3. Results and Discussion

3.1. Substrate Surface Morphology

In this study, the LEXTOLS4100 laser confocal microscope was used to measure the 3D morphology and roughness. LEXTOLS4100 is a laser scanning microscope that provides contactless observation and measurement of sample surfaces with a maximum resolution of 10 nm for quick and easy image acquisition, as well as extensive measurement capabilities. It uses a dedicated objective lens and a dedicated optical system that maximizes the performance of the 405 nm laser. The LEXTOLS4100 can accurately measure samples with sharp angles that have been impossible to measure for a long time, which facilitates roughness measurements.
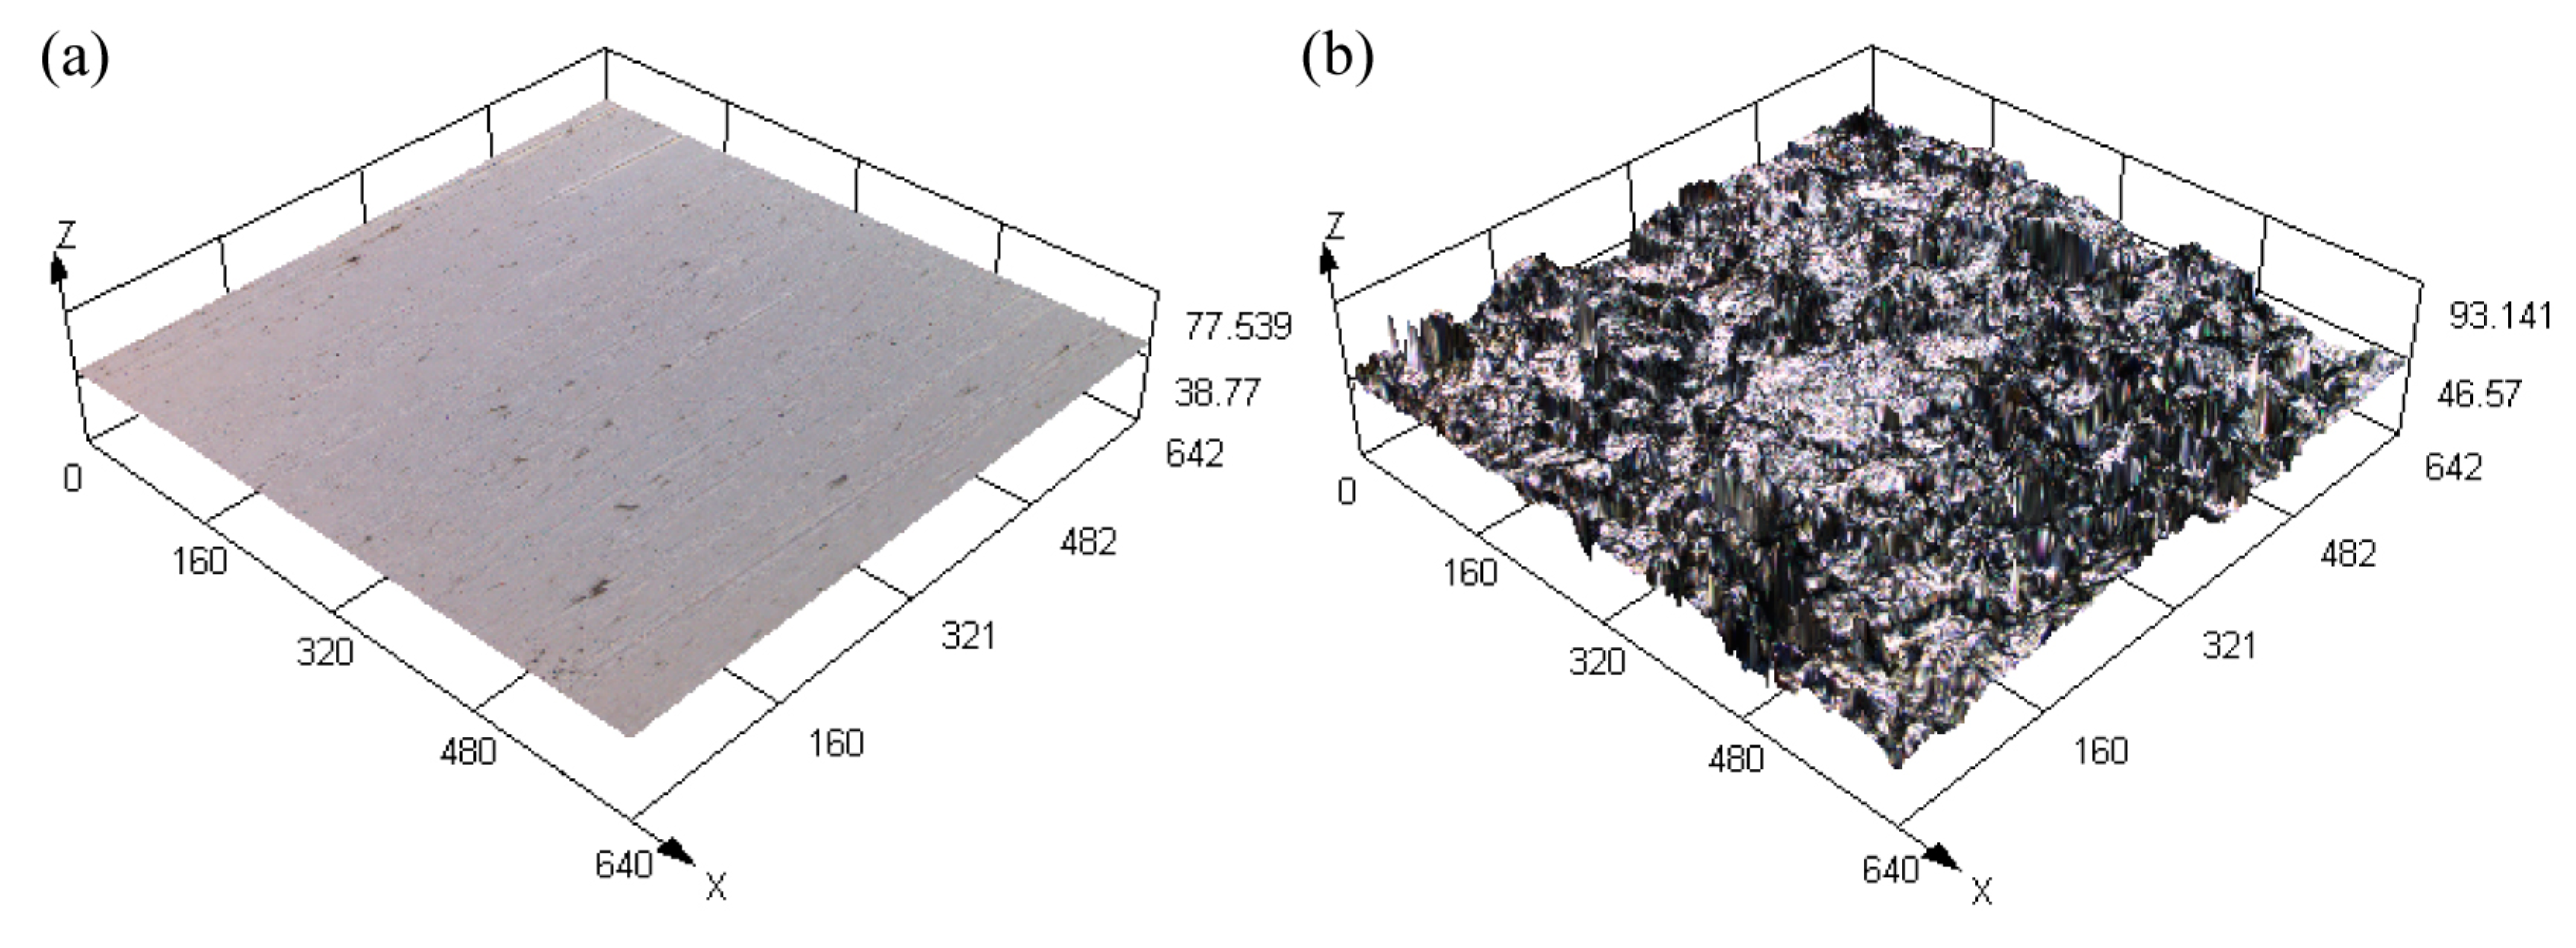
Figure 3 shows the surface 3D morphology of the substrates subjected to different pretreatment processes. The surface of the 45 steel substrate with the polishing pretreatment was flat with no undulations, as shown in Figure 3a. The surface of the sandblasted 45 steel substrate had large surface undulations, exhibiting an evident mountain peak and gully morphology, as shown in Figure 3b. These results show that the sandblasting pretreatment could quickly impart a rough appearance on the substrate surface. Table 3 lists the surface roughness data of the substrates subjected to different pretreatment processes (evaluation area: 100 μm × 100 μm × 100 μm), including the square-root roughness Sa and root-mean-square roughness Sq. The square-root roughness values of the polished and sandblasted 45 steel substrate surfaces were 0.006 and 0.804, respectively, and their root-mean-square roughness values were 0.008 and 1.055, respectively. These results show that the surface roughness could be significantly improved by applying the sandblasting pretreatment.
Previous studies have shown that a rough substrate surface is conducive for improving the thickness and adhesion of coatings. Cheng et al. electrodeposited a Ni-B coating on the 8620H steel substrate, the substrates were carried out with different pretreatments including without a pretreatment, after sandblasting by glass sand and after sandblasting by emery powders. The results show that the coating thickness increased with the best adhesion and corrosion resistance after emery pretreatment [35]. We speculated that compared with the polishing pretreatment, the sandblasting pretreatment of the 45 steel substrate can impart a rougher surface morphology, increase the surface area and coating thickness, and widen the element penetration region.

3.2. Coating Morphology

In this study, scanning electron microscope (FEI-SEM) was used to observe the surface morphology of the coating. The image type of the secondary electron image was selected for observation. The accelerating voltage was set at 3 KV, the scanning speed was set at 20 μs, the magnification was 1000 times, and the unified image scale was 50 μm.
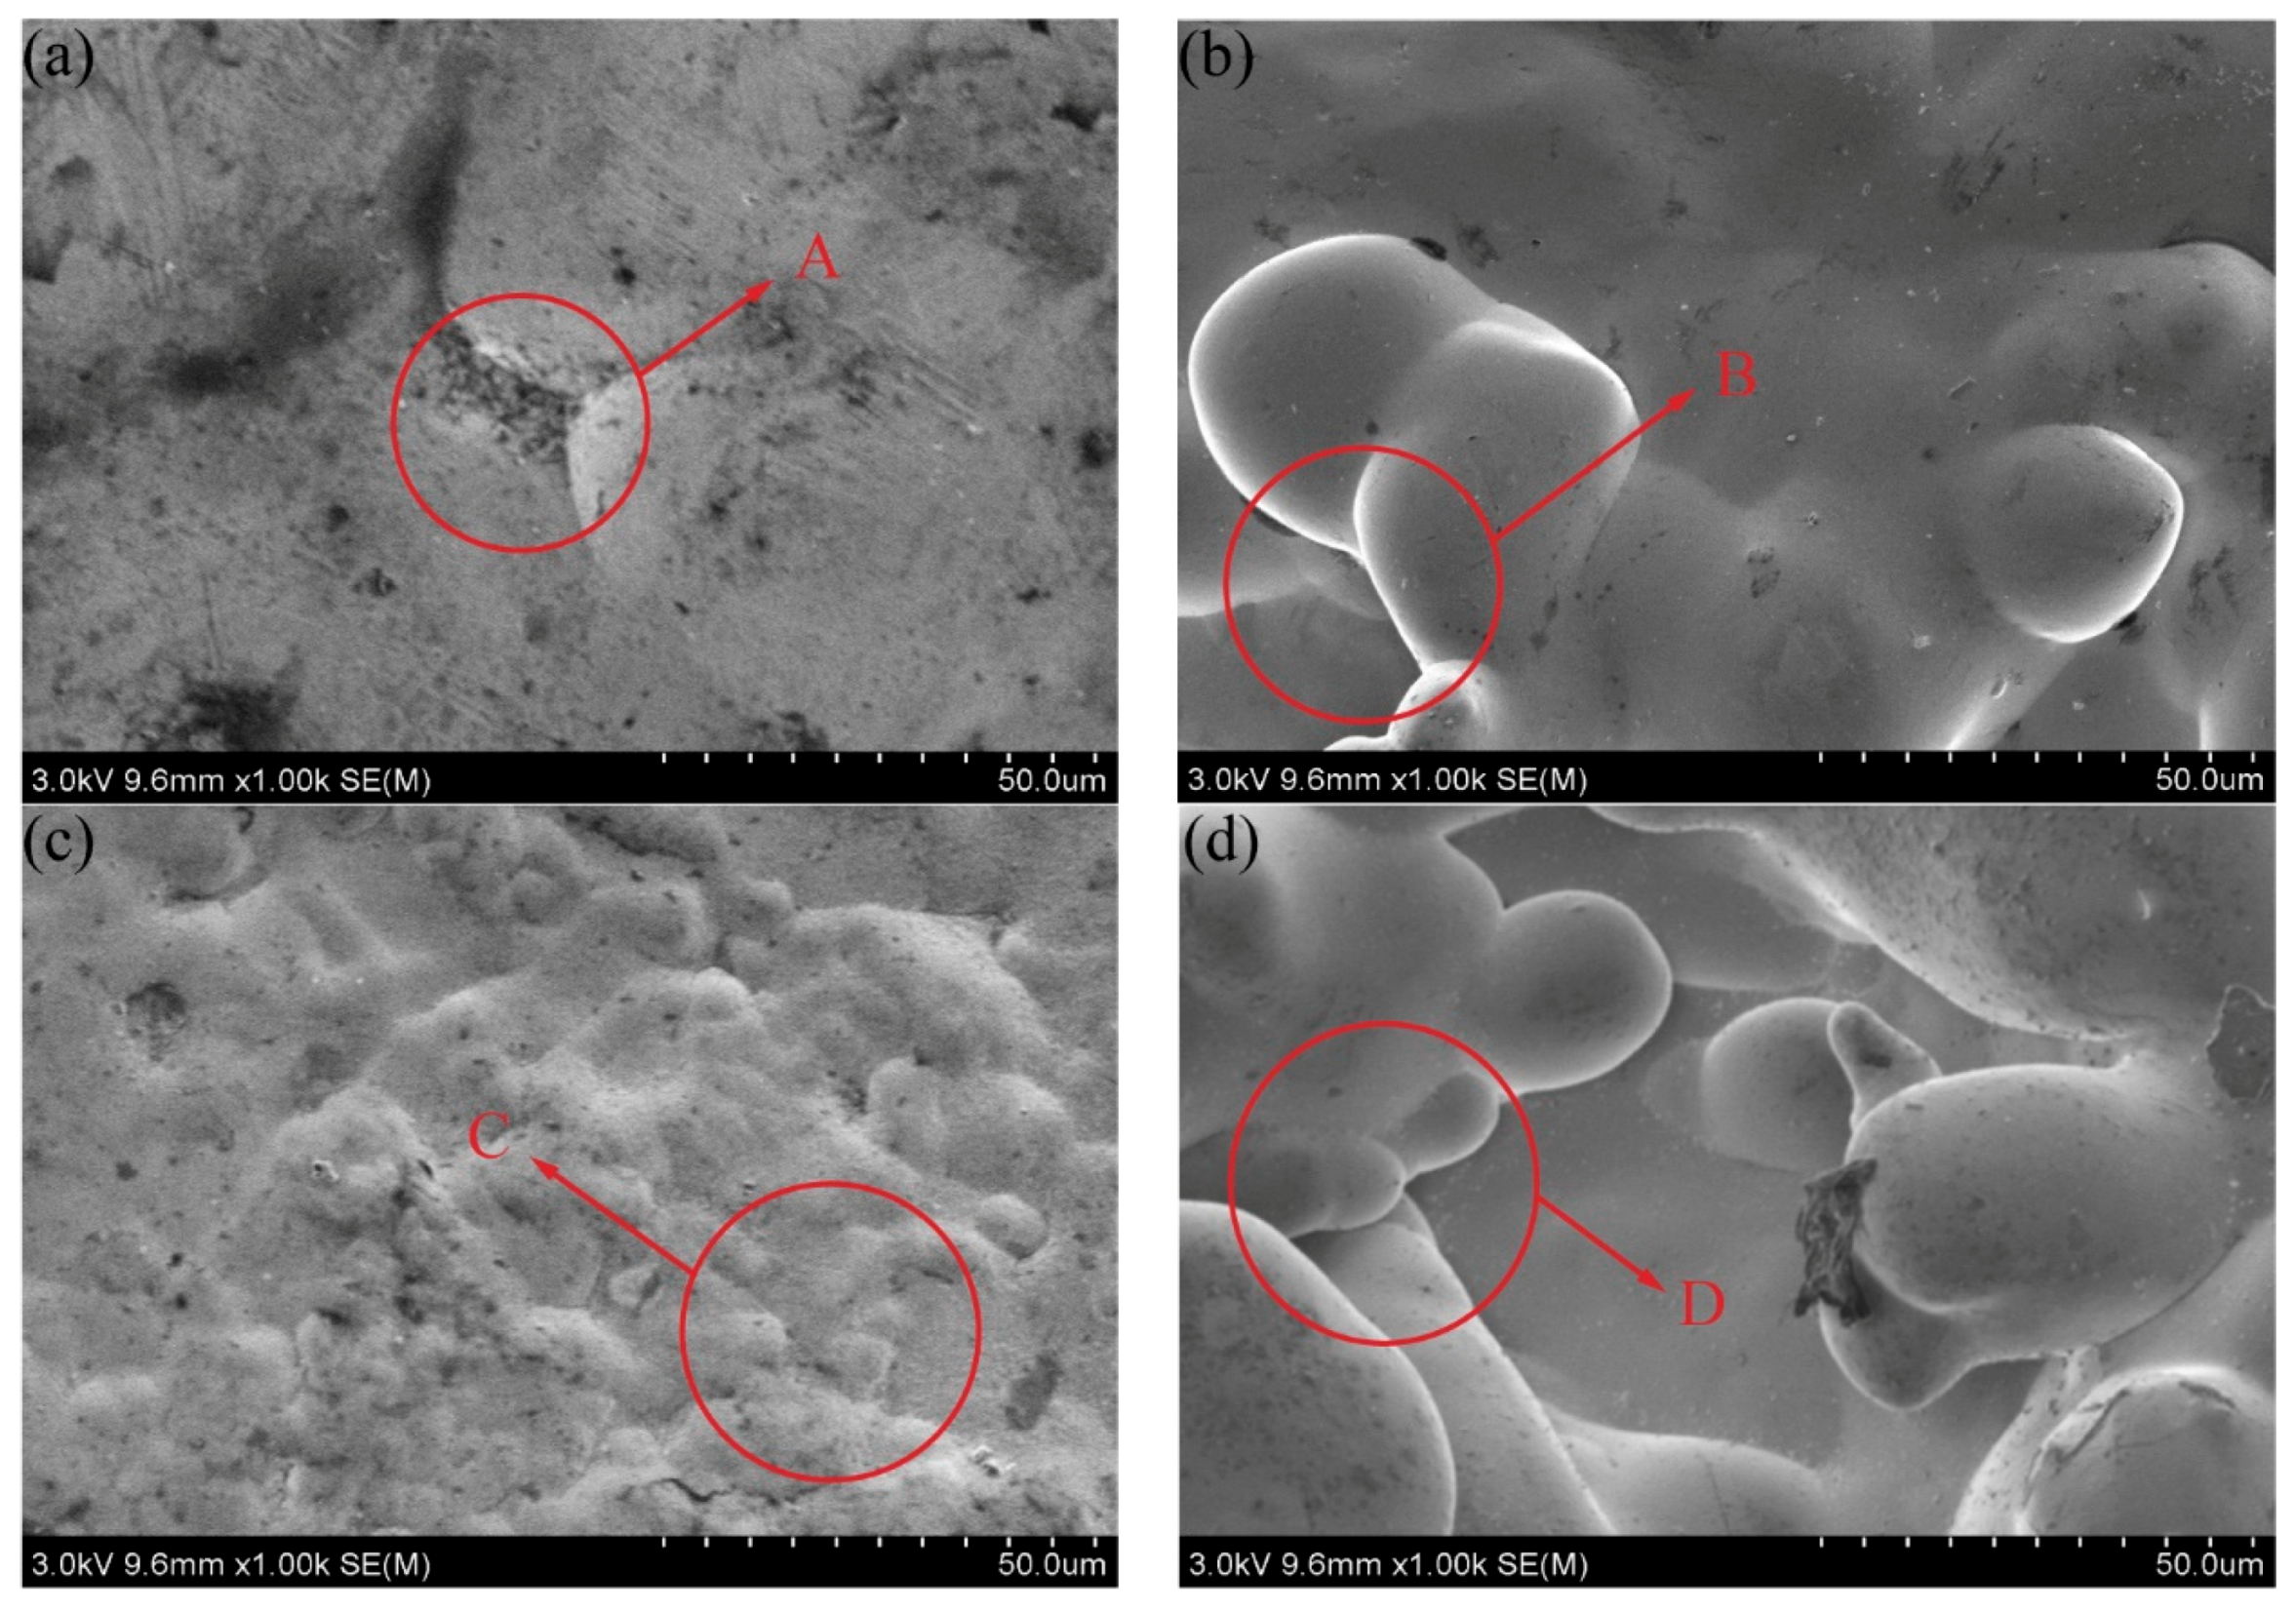
Figure 4 shows the surface morphologies of the coatings on 45 steel substrates, prepared by scanning electrodeposition with different pretreatment processes. Figure 4a shows the surface microstructure of the Ni–P coating subjected to the polishing pretreatment. The surface shows a typical cellular structure; however, the crystal structure was not evident, and there were defects, such as gaps, at the boundary (region A in Figure 4a). Figure 4b shows the surface microstructure of the Ni–P coating subjected to the sandblasting pretreatment, where the cellular structure on the Ni–P coating surface was evident, the number of nucleation points increased, and the size of the cell structure decreased. The surface defects in the coating were improved (region B in Figure 4b). These results show that the surface roughness increased, and the number of nucleation points could be increased in the case of the sandblasting pretreatment. The Ni2+ ions in the solution were easier to nucleate on a rough surface with a dense surface cell structure. Figure 4c,d shows the surface micromorphology of the Ni–P–SiC coating prepared by scanning electrodeposition with polishing and sandblasting pretreatments, respectively. Figure 4c shows that the cellular structure was densely distributed with fuzzy boundaries (region C in Figure 4c). Compared with Figure 4a, the size of the cell structure was lower, and the number of nucleation points was higher. Figure 4d shows the formation of more cellular structures in the projections of the rough surface, and the deposit was intact and without defects (region D in Figure 4d). This shows that the addition of SiC nanoparticles had a thinning effect on the Ni–P coating. This is because the SiC nanoparticles increased the cathode polarization and promoted the nucleation of Ni2+ [29]. With the sandblasting pretreatment, the number of nucleation points of the cellular structure on the Ni–P–SiC coating surface was the highest, and the cell structure size was the smallest.

3.3. Section Morphology and Element Analysis

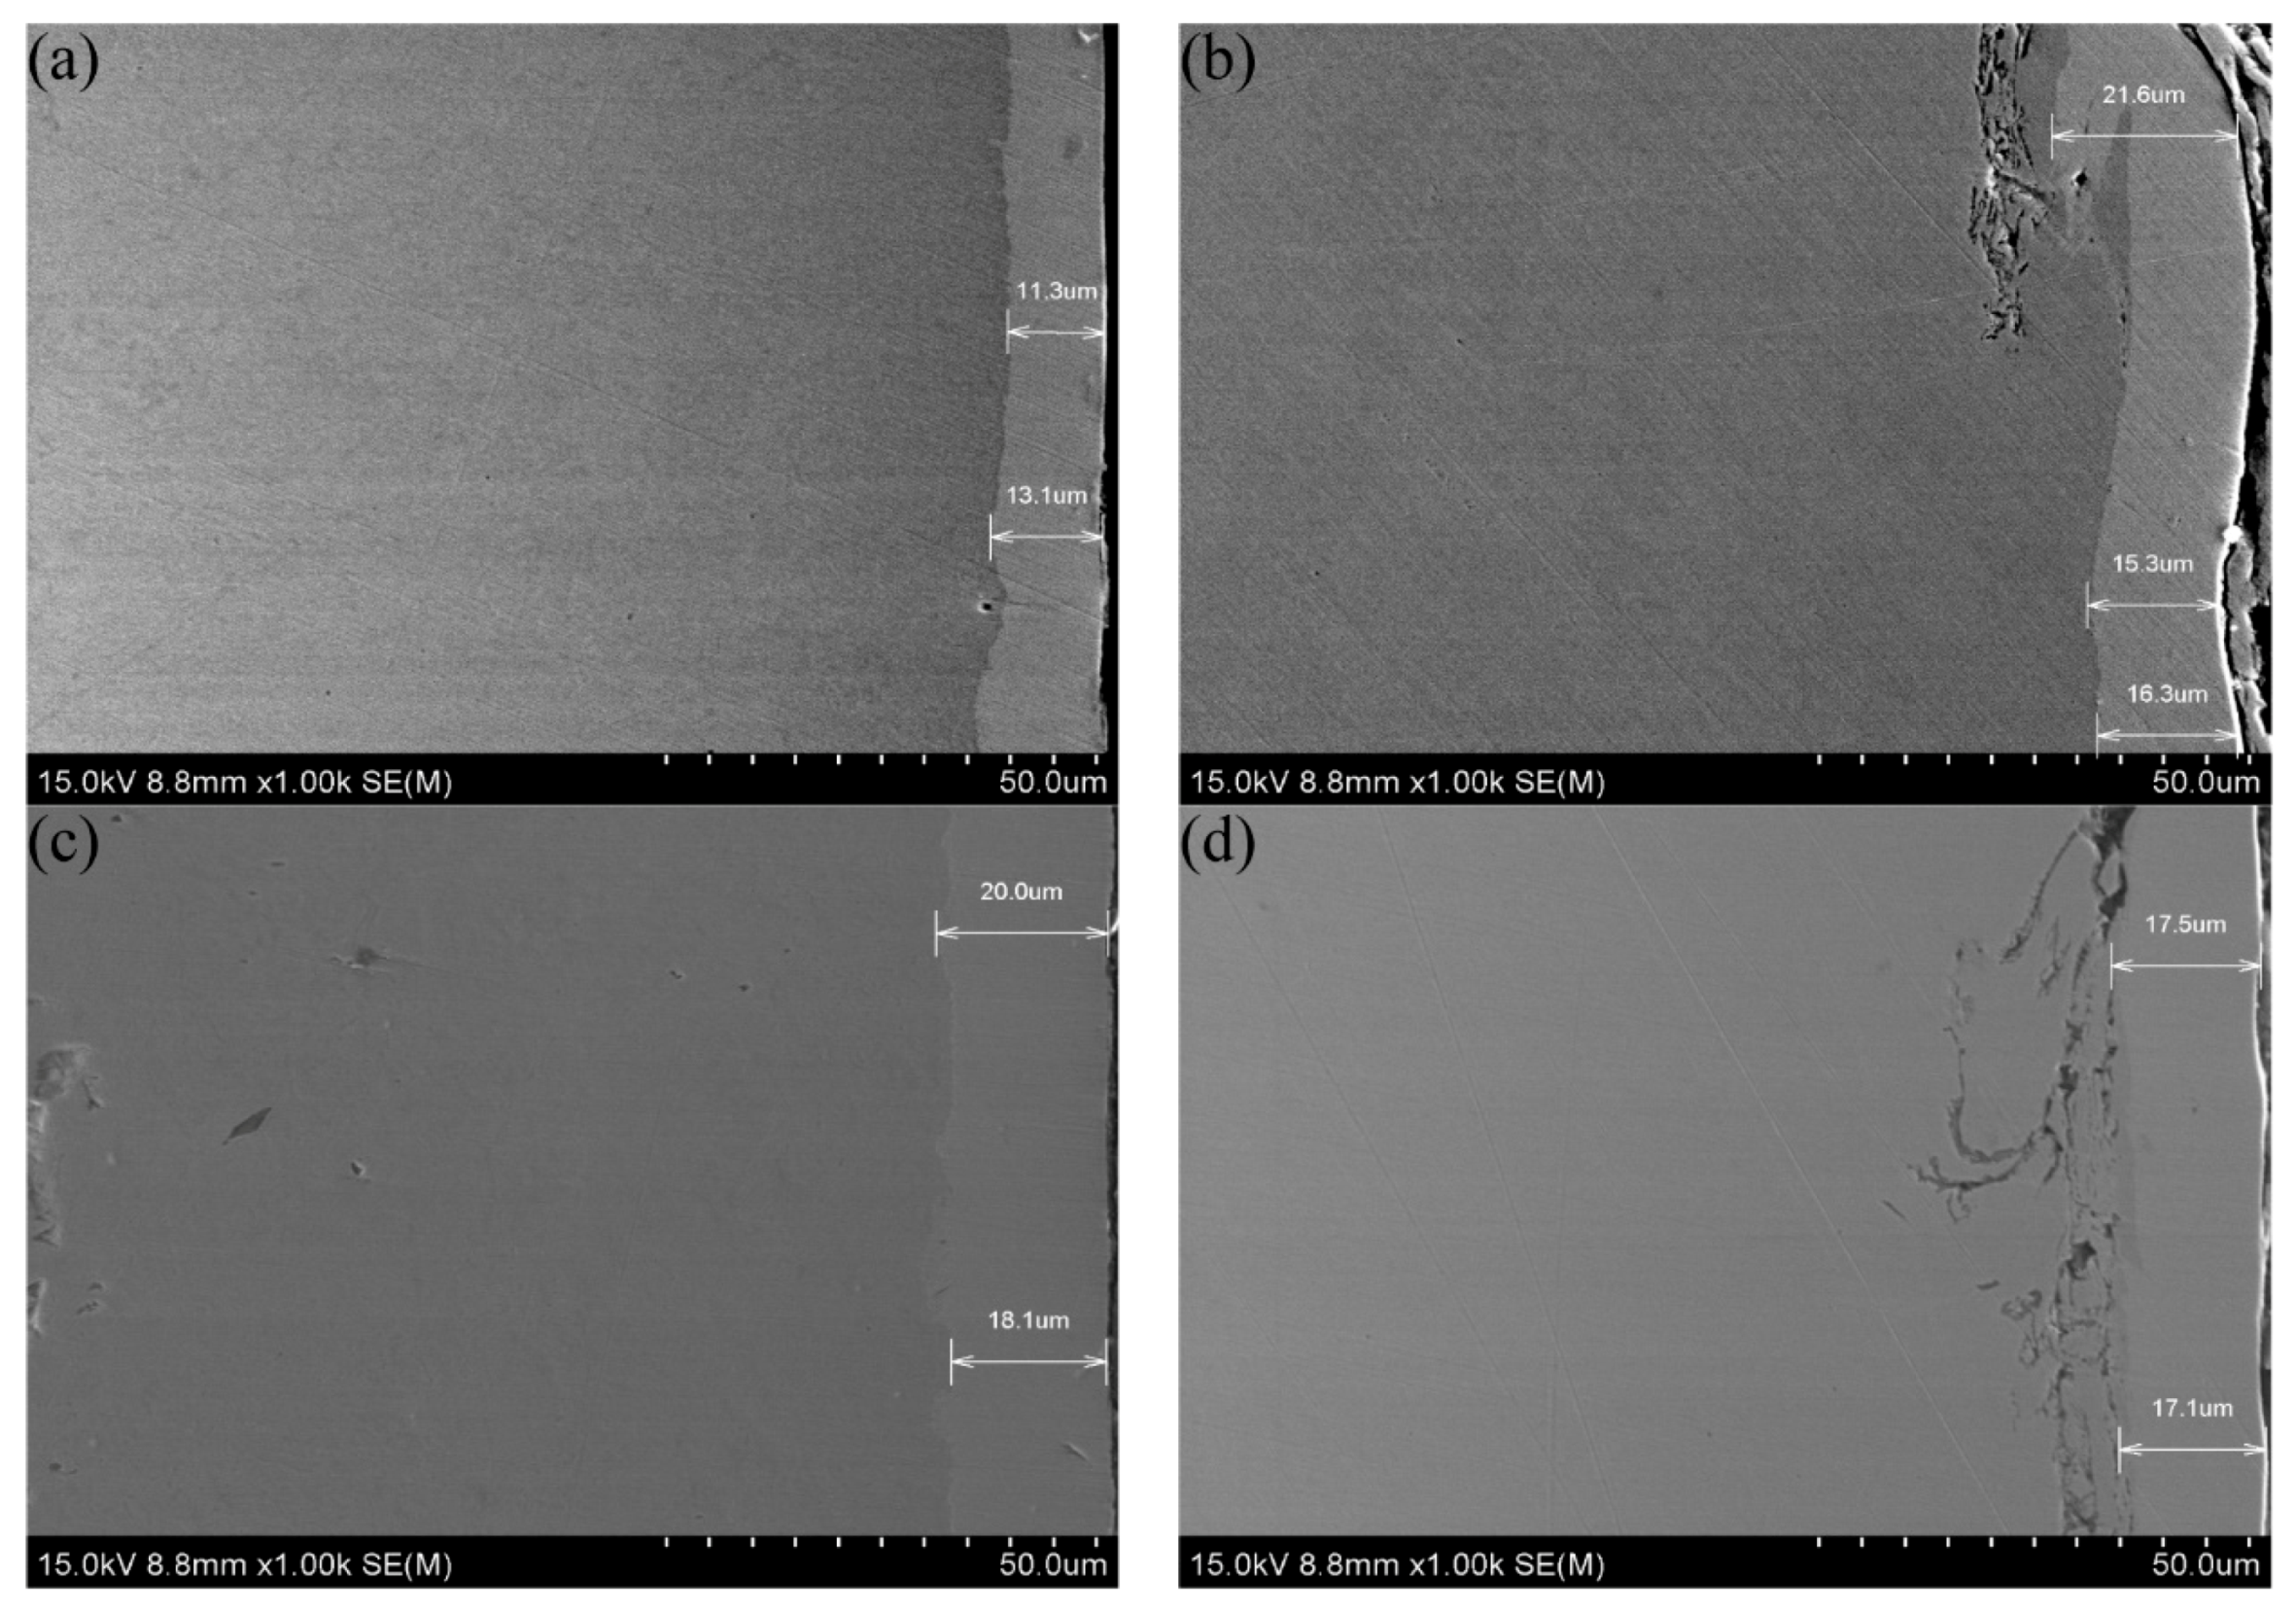
Figure 5 shows the section morphologies of the coatings on 45 steel substrates prepared by scanning electrodeposition with different pretreatment processes. Figure 5a shows the section morphology of the Ni–P coating pretreated by polishing. The coating was evenly deposited on a smooth substrate surface, and the coating thickness was approximately 12.2 ± 0.86 μm. Figure 5b shows the section morphology of the Ni–P coating pretreated by sandblasting. The coating was closely attached onto the surface of the rough substrate, and the pits in the substrate were filled to form a mechanical interlock. During the deposition, the coating grew in the rough structure of the substrate, and there were bumps and pits on the surface. The coating thickness was approximately 16.7 ± 2.82 μm, with pits up to 21.6 μm. This is because the high surface roughness increased the number of nucleation points in the coating, thus increasing the coating thickness [33]. Figure 5c shows the section morphology of the Ni–P–SiC coating pretreated by polishing. With the addition of the SiC particles, the coating cross-section was more compact, the adhesion was increasingly complete and tight, and the coating thickness was increased to 19.0 ± 1.10 μm. This is because the SiC particles refined the microstructure of the Ni–P coating and promoted its growth [31]. Figure 5d shows the section morphology of the Ni–P–SiC coating pretreated by sandblasting. Compared with the Ni–P coating, the thickness was increased to approximately 17.3 ± 1.79 μm. Due to the effect of fine coating of the SiC particles, the coating section had a higher degree of adhesion to the rough substrate, and the form of mechanical interlock was more diversified. The edge fluctuation of the coating section decreased, and the surface flatness of the coating increased [29].
An EDS analyzer was used to analyze the element composition of the cross section. An energy spectrometer is an important auxiliary instrument for scanning electron microscopy, which can complete the qualitative and quantitative analysis of the elements in the microscopic area of materials in a short time. In this study, the test method for the element component analysis was line scanning. The scanning observation device was used to make an electron beam do two-dimensional scanning on the surface of the sample and measure the intensity of characteristic X rays. The intensity change of elements is displayed in the form of a bright spot or curve, and the mild two-dimensional distribution image of characteristic X rays was obtained.
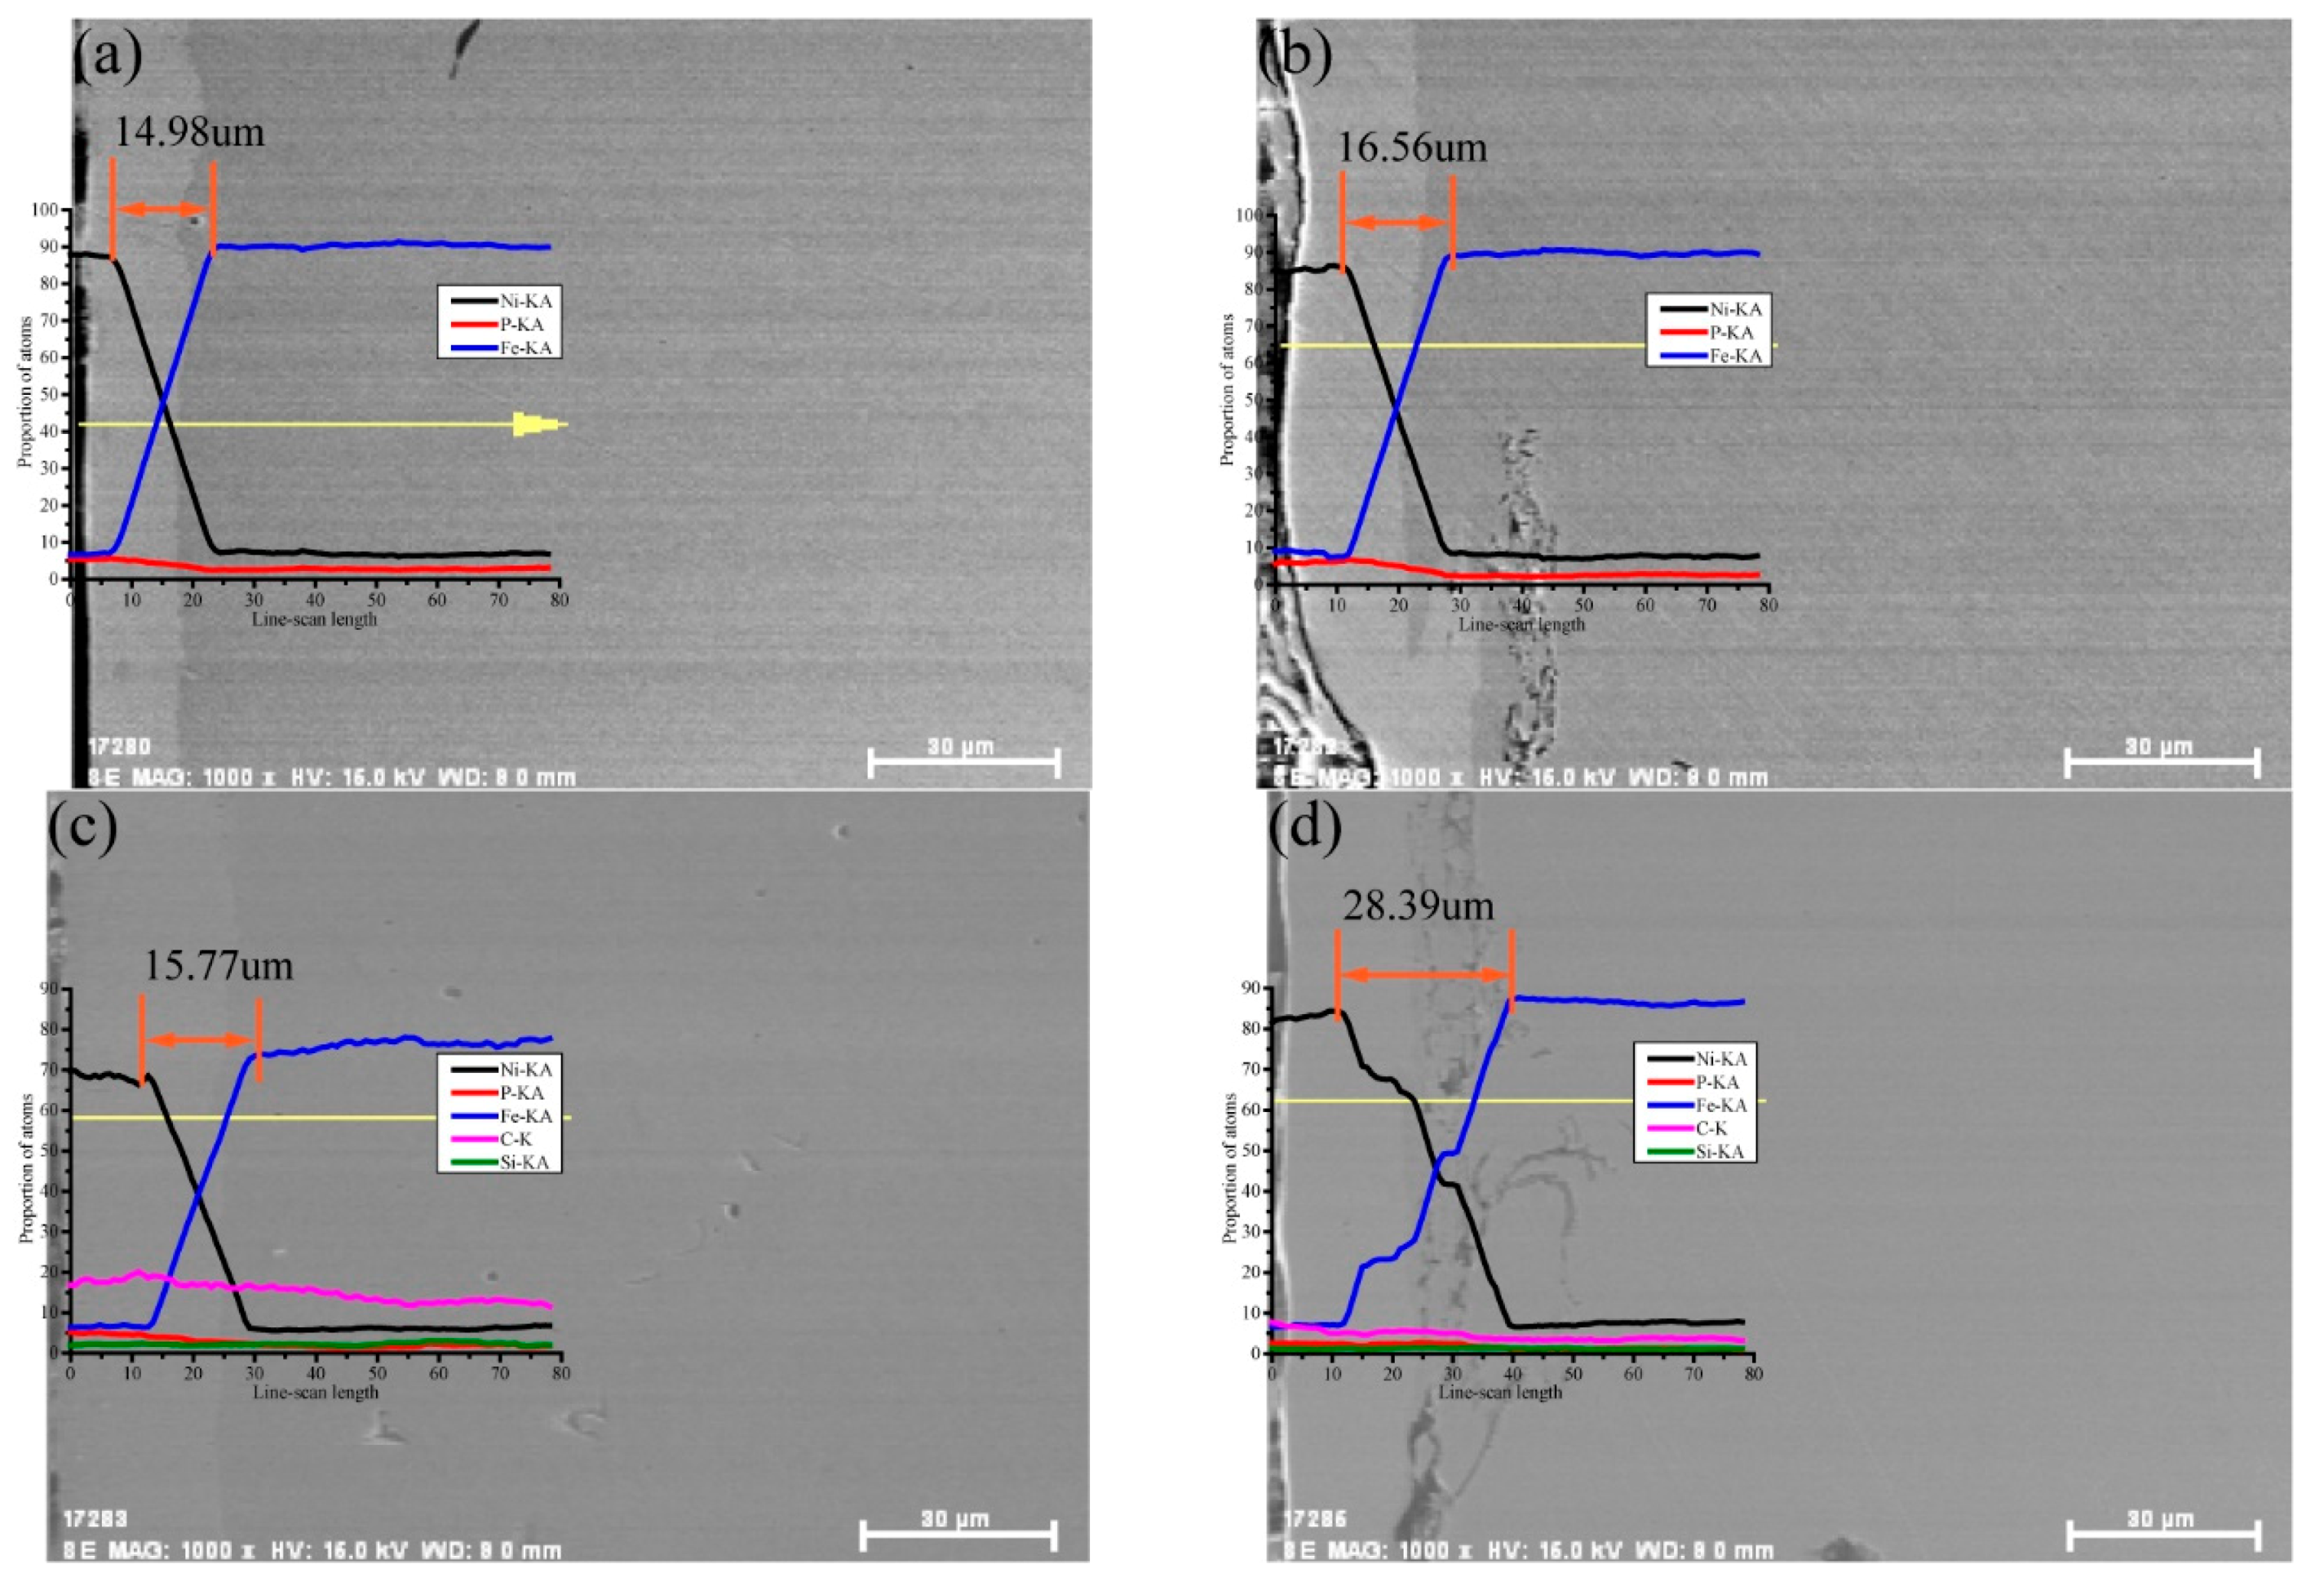
Figure 6 shows the section element scanning results of the coatings prepared on 45 steel substrates by scanning electrodeposition with different pretreatment processes. When the coating was deposited on the substrate surface, the elements in the coating and the substrate will mutually permeate. When scanning the elements from the coating to the substrate, the contents of the elements in the coating changed from invariable to decreasing and then to stable, whereas the contents of the elements in the substrate exhibited the opposite trend. The region formed by the two inflection points was called the element penetration region. Figure 6a shows the element scanning results of the Ni–P coating pretreated by polishing. The content of the main element Ni in the coating shows an evident downward trend, whereas the content of the main element Fe in the substrate shows an evident upward trend; the range of the element penetration region was approximately 14.98 ± 0.09 μm. Figure 6b shows the element scanning results of the Ni–P coating pretreated by sandblasting. The sandblasting pretreatment helped increase the coating thickness, thus increasing the position of the inflection point. The range of the element penetration region was increased to 16.56 ± 0.08 μm, indicating that the sandblasting pretreatment increased the number of nucleation points for growth on the substrate surface, the rough surface structure made it easier for elements to deposit and penetration during the deposition process, thus widening the range of the element penetration between the coating and the substrate [35]. Figure 6c shows the element scanning results of the Ni–P–SiC coating pretreated by polishing. The decreasing trend in the element C indicates the existence of SiC nanoparticles in the coating. The increase in the coating thickness extended the element penetration zone to 15.77 ± 0.11 μm. This is because the addition of SiC nanoparticles had a refining effect on the coating, the coating grew more compact in the process of codeposition, making it easier for the coating and the elements in the matrix to penetrate [31]. Figure 6d shows the element scanning results of the Ni–P–SiC coating pretreated by sandblasting. The element permeating region had the widest range, up to 28.39 ± 0.07 μm. The sandblasting pretreatment and SiC nanoparticle addition had a significant enhancement effect on the element penetration between the coating and the substrate.
By analyzing the section morphology and element scanning results of the coatings, we found that the sandblasting pretreatment and SiC particle addition could help increase the coating thickness and promote the element penetration between the coating and the substrate. A wider element penetration zone could make the adhesion between the coating and the substrate complete and tight.

3.4. Coating Adhesion

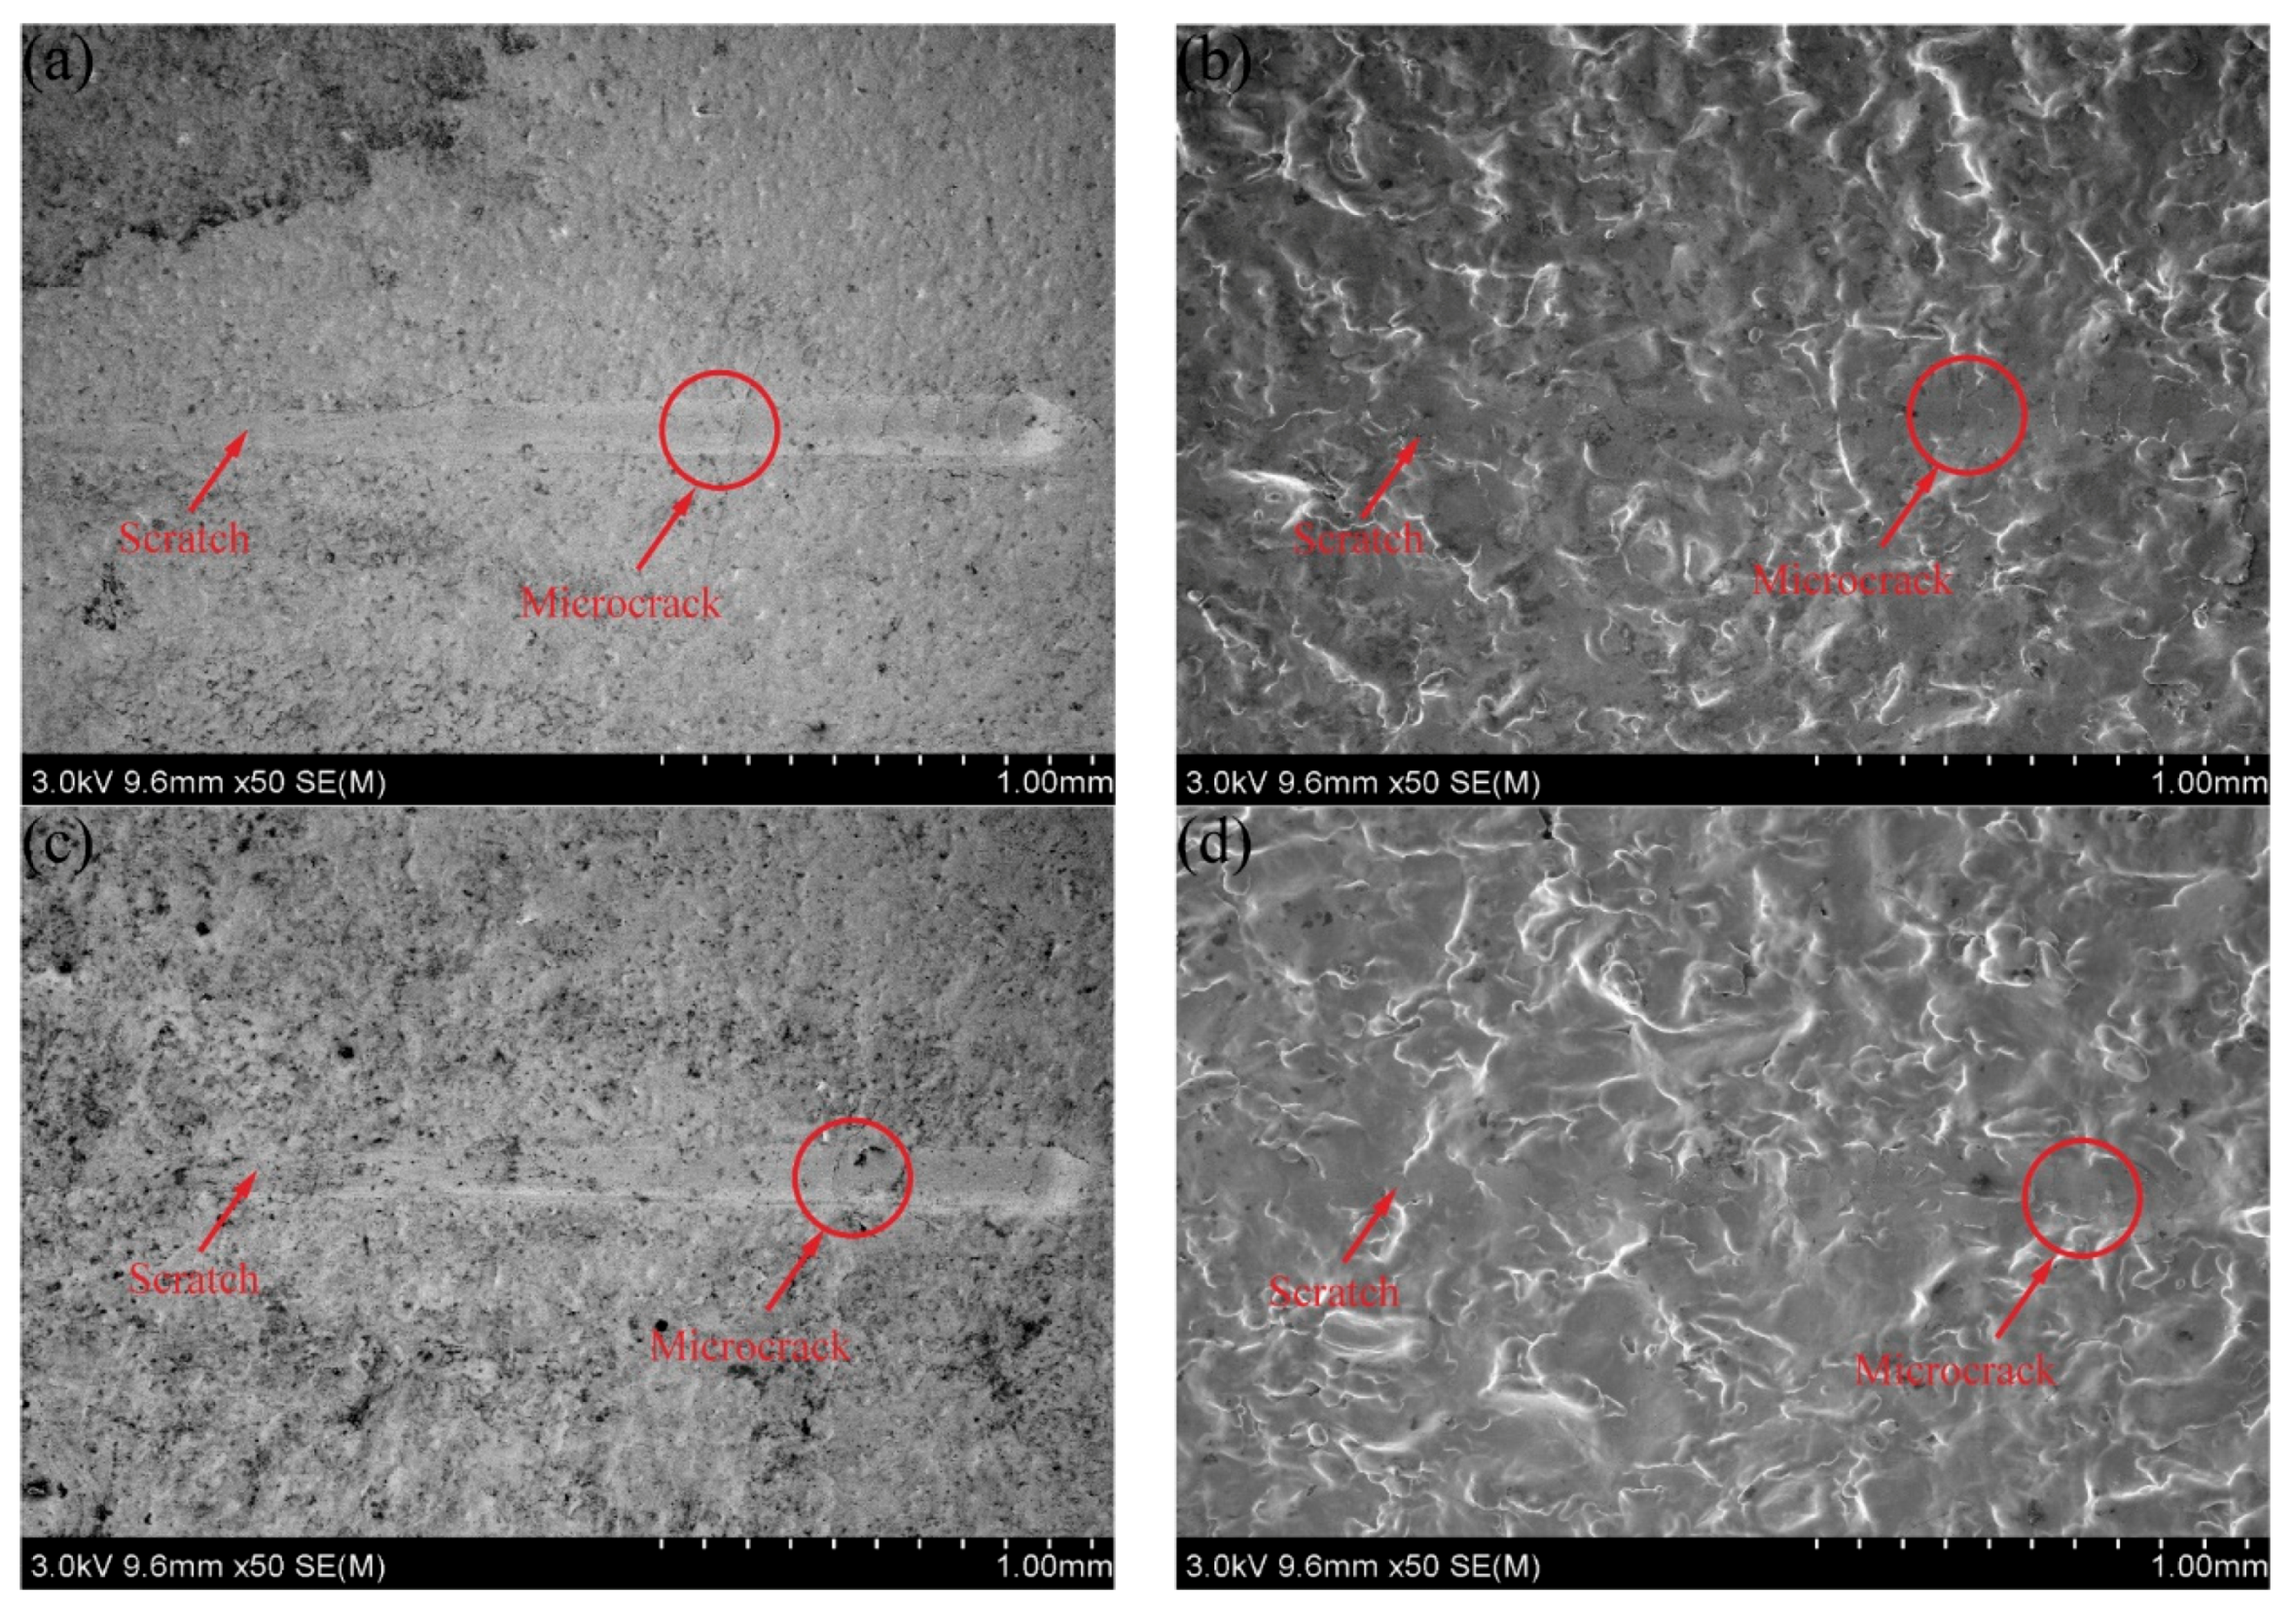
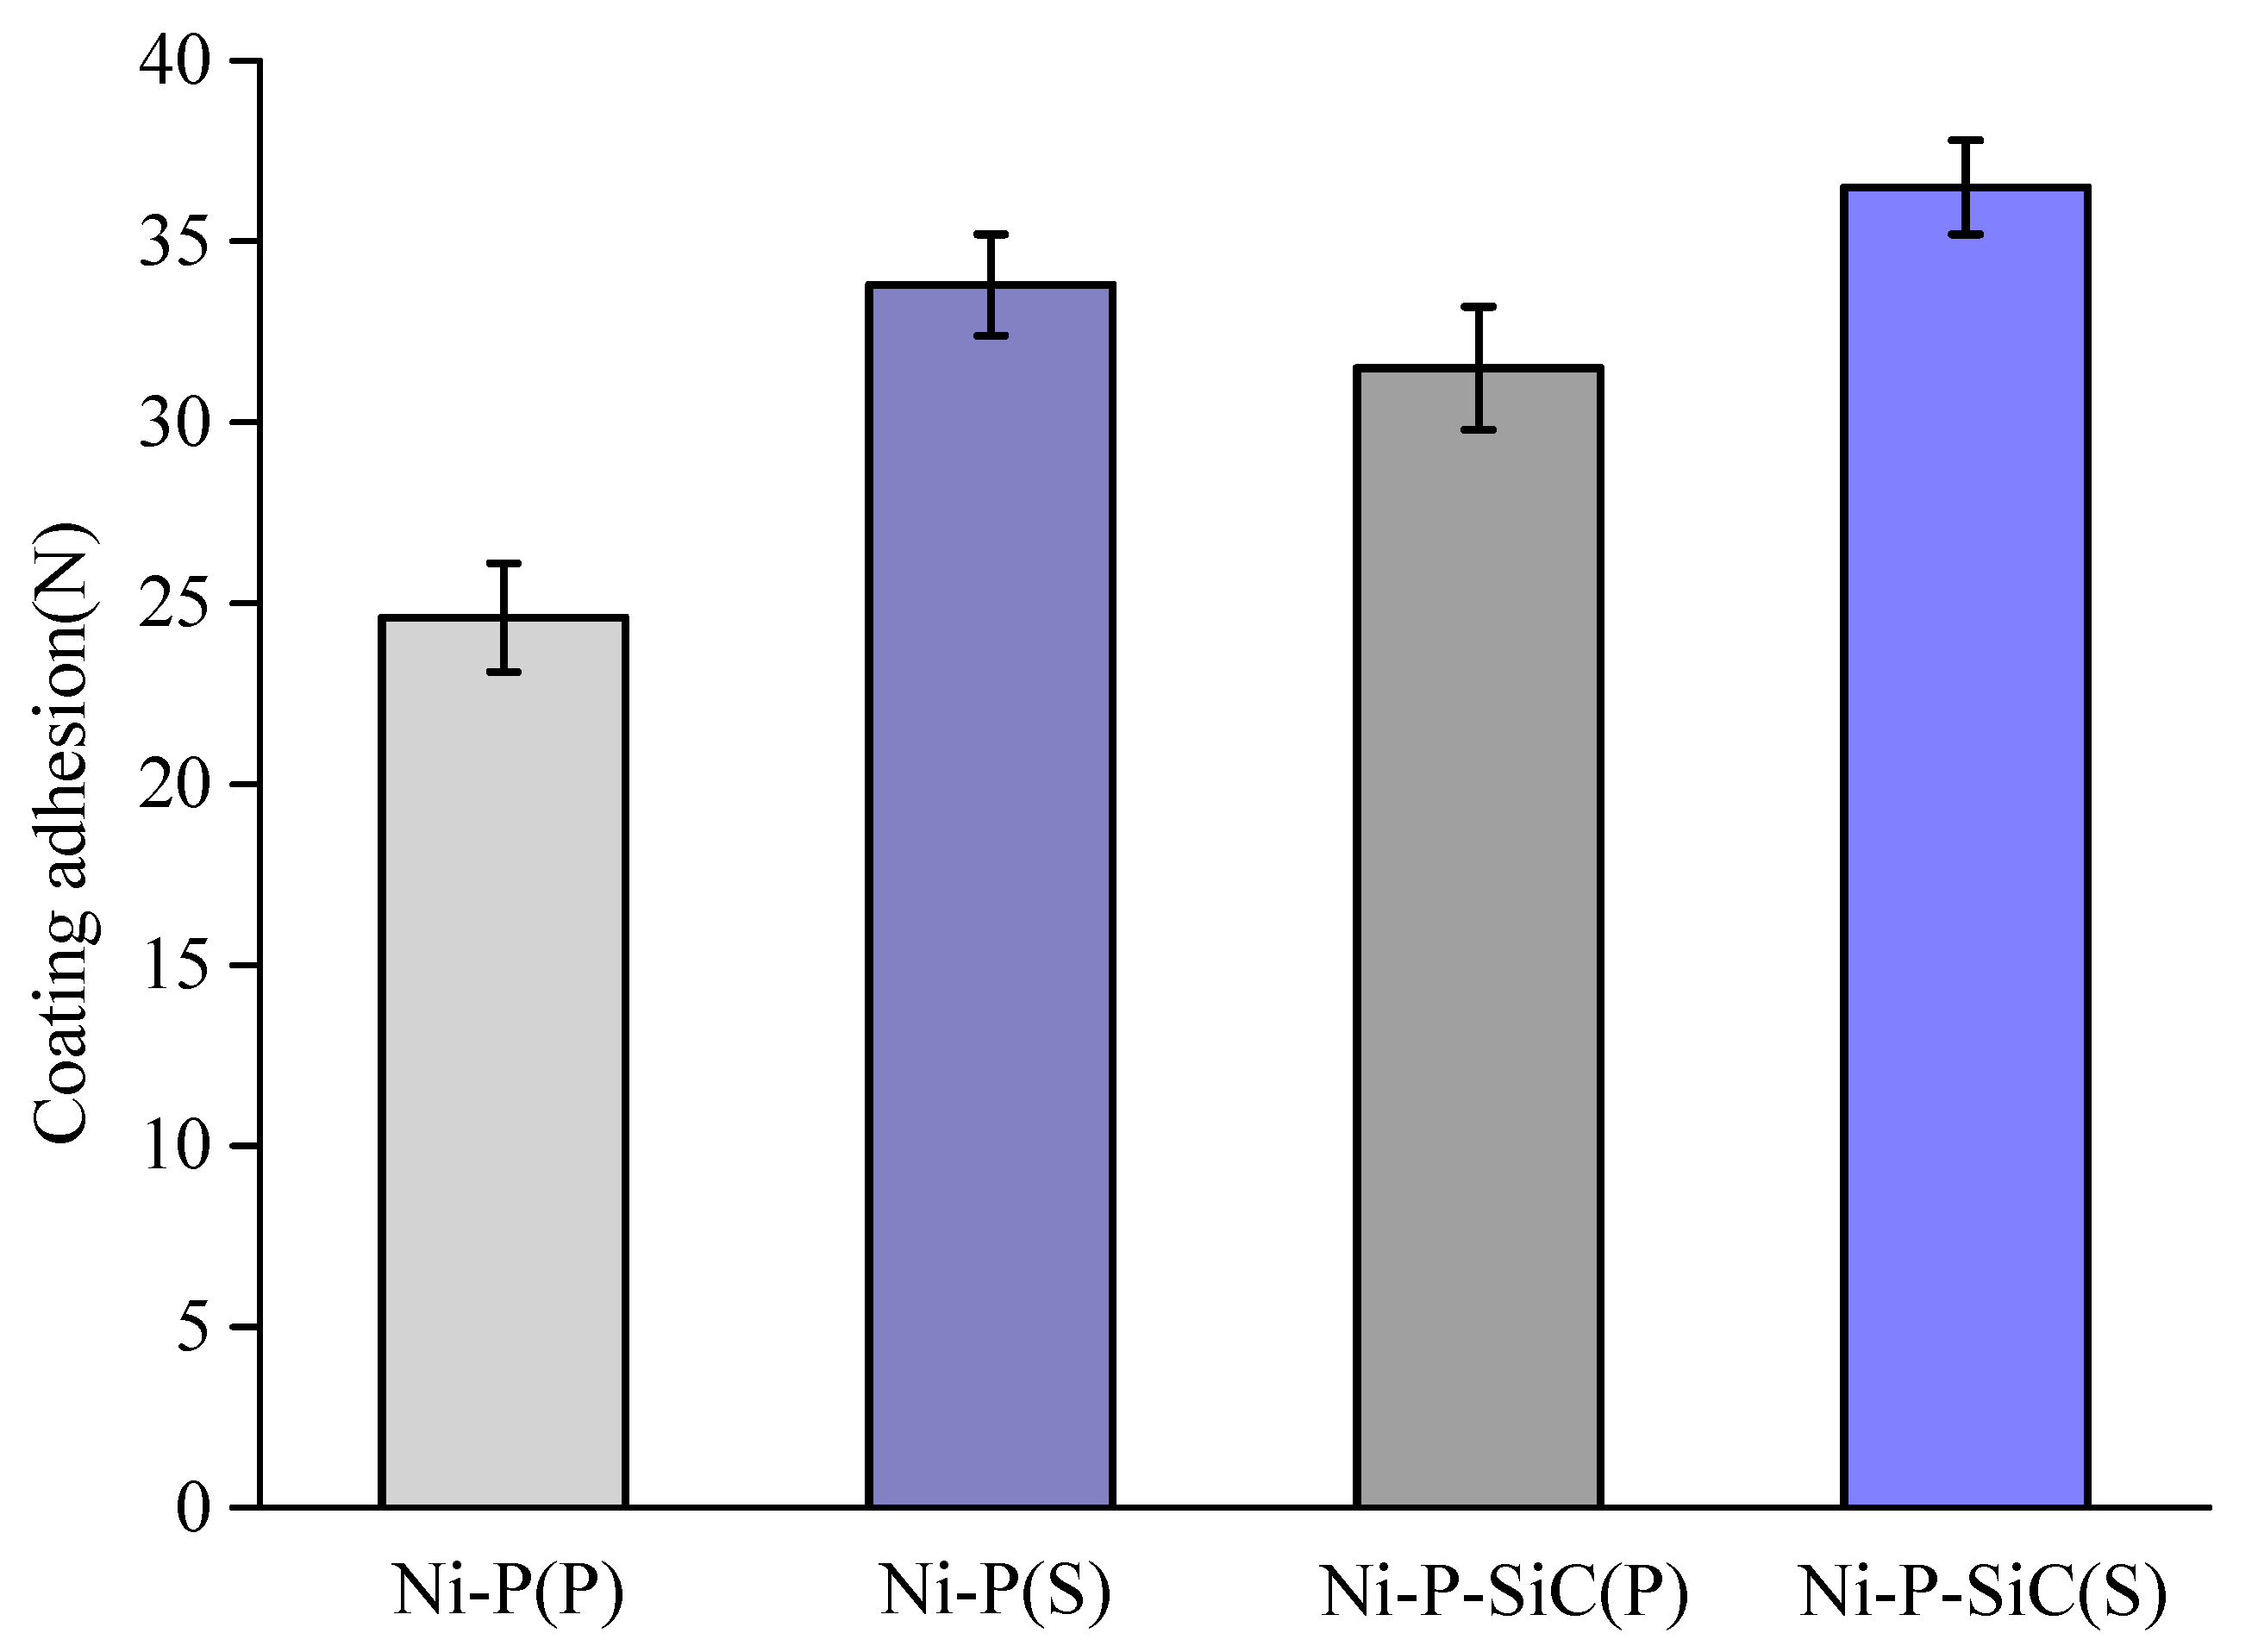
Figure 7 shows the schematic of the coating adhesion test. The method combines scratch testing using a gauge with friction force testing. The principle of this test method is that, under the action of a load, when a diamond probe cuts the surface coating and contacts the substrate, there will be no friction, i.e., the inflection point is reached. The corresponding load is the critical load, which represents the adhesion of the coating. The higher the critical load value, the better the coating adhesion degree. Figure 8 shows the scratch morphologies of the coatings prepared on 45 steel substrates by scanning electrodeposition with different pretreatment processes. Figure 9 shows the adhesion of the coatings subjected to different pretreatment processes. With the vertical load increasing from 0 to 40 N, the scratches on the coating surface gradually become wider and deeper. When the coating was cut, the surface exhibited microcracks. The adhesion of the Ni–P coating was as low as 24.6 N in the case of the polishing pretreatment. After the sandblasting pretreatment, because of the rough surface, the protrusions in the scratches were extruded, and the adhesion was increased to 33.1 N. With the addition of the SiC nanoparticles, the coating adhesion increased significantly. After the polishing pretreatment, the adhesion of the Ni–P–SiC coating increased to 31.5 N. After the sandblasting pretreatment, the adhesion increased to 36.5 N.
The test results show that the coating adhesion was improved owing to the existence of the element penetration region between the coating and the substrate. This is because each element in the element penetration region penetrated each other for absorption, increased the degree of coating and matrix adhesion, and the adhesion boundary bond integrity did not have any defects. When the surface was extruded by the probe, the element penetration region prevented the boundary division between the coating and the substrate and increased the load corresponding to the dividing critical point. The larger the element penetration region, the higher the degree of adsorption between the coating and the substrate elements, and the greater the adhesion. The sandblasting pretreatment increased the real surface area of contact between the substrate and the coating, expanded the element penetration area, and improved the adhesion of the coating. After the sandblasting pretreatment, the surface was roughened; thus, the adhesion between the coating and the substrate led to the formation of a mechanical interlock [34]. The increase in the number of nucleation points of the cellular structure on the sandblasted coating surface and the lack of defects in the compact structure were also the main factors that improved the adhesion of the coating. The addition of SiC nanoparticles refined the cellular structure size of the Ni–P coating. With the increase in the effective contact area between the coating and the substrate, the element penetration region between the coating and the substrate was further expanded, and the adhesion of the coating was further improved. In addition, the SiC nanoparticles themselves enhanced the coating adhesion owing to their small size effect [29].
The coating adhesion is another important factor affecting the corrosion resistance of coatings. The corrosion resistance of a coating can be enhanced by increasing the coating adhesion. When a corrosion substance penetrates through a coating and reaches the substrate, the adhesion boundary between the coating and the substrate acts as an obstacle. A higher adhesion and degree of adsorption promote the intact boundary bond, which can prevent the penetration of corrosive substances.

3.5. Corrosion Resistance

To study the corrosion resistance of the prepared samples, we wrapped the surface of the workpiece with epoxy resin, the samples were immersed in a neutral 3.5 wt % NaCl aqueous solution, and the exposed area of the samples was 1 cm2. First, the sample was tested with an open-position circuit, the sample was soaked in 3.5 wt % NaCl neutral aqueous solution for 30 min, then the Tafel curve was recorded using the potentiometric dynamic scanning method, and the polarization curve was analyzed using the CView software. Electrochemical impedance spectroscopy (EIS) was used to record the EIS curve within the frequency range of 0.01–105 Hz, and the scanning direction was from high to low. The ZView software was used to analyze the EIS curve. Finally, the data were imported into Origin software to draw the action potential polarization curve and electrochemical impedance spectrum curve.
Figure 10 shows the potential polarization curves of coatings prepared by scanning electrodeposition on 45 steel substrates with different pretreatment processes. The dynamic potential polarization curve generally reflects the relationship between the electrode potential and polarization current density. In scientific research, the corrosion resistance of material surface is usually judged by the corrosion parameters of the potentiometric polarization curve. The dynamic potential polarization curve represents the relationship between the corrosion potential (Ecorr) and the corrosion current (icor) of the composite coating [5]. The corrosion rate was determined by polarization curve epitaxy. The corrosion current density in the polarization curve can accurately represent the corrosion rate theoretically, and the corrosion rate can be calculated directly according to Faraday’s law, which is consistent with the weightlessness method. According to the polarization curve epitaxy method, the point in the positive direction of the polarization potential that deviates from the corrosion potential by 50 mV was recorded as point a, and the point in the negative direction of the polarization potential that deviates from the corrosion potential by 50 mV was recorded as point c. The Tafel constants at points a and c were ba and bc, respectively. Draw two straight lines and get the intersection point of the two straight lines. The corresponding current density at the intersection point was the corrosion current density, which could directly characterize the corrosion rate. This method is called the dynamic potential polarization curve epitaxy method. According to the Stern–Geary equation [20]:
i c o r r = b a × b c 2.303 × R p ( b a + b c )
ba and bc are the slope of the anode dynamic potential polarization curve and the cathode dynamic potential polarization curve; Rp is the equivalent linear polarization resistance; and icorr is the corrosion current density.
By Tafel extrapolation of the polarization curve, we calculated the self-etching potential (Ecorr), self-etching current density (icorr), and corrosion rate of each electrochemical parameter by fitting, as listed in Table 4. The results show that compared with the polished samples, the corrosion potential of the sandblasted substrate was increased from −1.13 to −0.91 V, and the current density was decreased from 4.67 × 10⁻⁴ to 2.15 × 10⁻⁵ A·cm−2, indicating that the sandblasting pretreatment improved the surface corrosion resistance. This is because the substrate surface formed a rough structure, and the corrosion products after infiltration could not easily diffuse. Compared with the substrate, the corrosion potential of the Ni–Co coating was positively shifted to a significant extent, and the corrosion current density was decreased. This shows that the Ni–P coating had an effective corrosion protection against the bare substrates. This is because of the formation of the element penetration region between the Ni–P coating and the substrate, whereby the substrate formed a second layer of corrosion protection. The larger the element penetration region, the higher the corrosion resistance of the substrate. Compared with the polishing pretreatment, the Ni–P coating pretreated by sandblasting exhibited a larger element penetration region, the corrosion potential increased from −0.54 to −0.41 V, the current density decreased from 1.67 × 10⁻⁵ to 6.06 × 10⁻⁶ A·cm−2, and the corrosion rate decreased. This is because the rough appearance formed on the surface after sandblasting prevented the corrosion products from diffusing. The element penetration area expanded, which gained the corrosion inhibition area and improved the corrosion resistance. The increase in the coating adhesion owing to the sandblasting pretreatment is another main factor that improved the corrosion resistance. Compared with the Ni–P coating, the corrosion potential of the Ni–P–SiC coating increased further, and the corrosion current decreased. The corrosion potential of the Ni–P–SiC coating prepared with the sandblasting pretreatment was the highest, reaching −0.30 V, and the corrosion current density was the lowest, reaching 8.45 × 10⁻⁷ A·cm−2. The reason is that when the SiC nanoparticles were uniformly distributed on the Ni–P–SiC coating, the coating structure was refined, and the effective area of its infiltration in the corrosion solution was reduced [30]. The addition of SiC nanoparticles in the Ni–P coating further expanded the element penetration region, increased the coating adhesion, and improved the corrosion resistance of the coating.
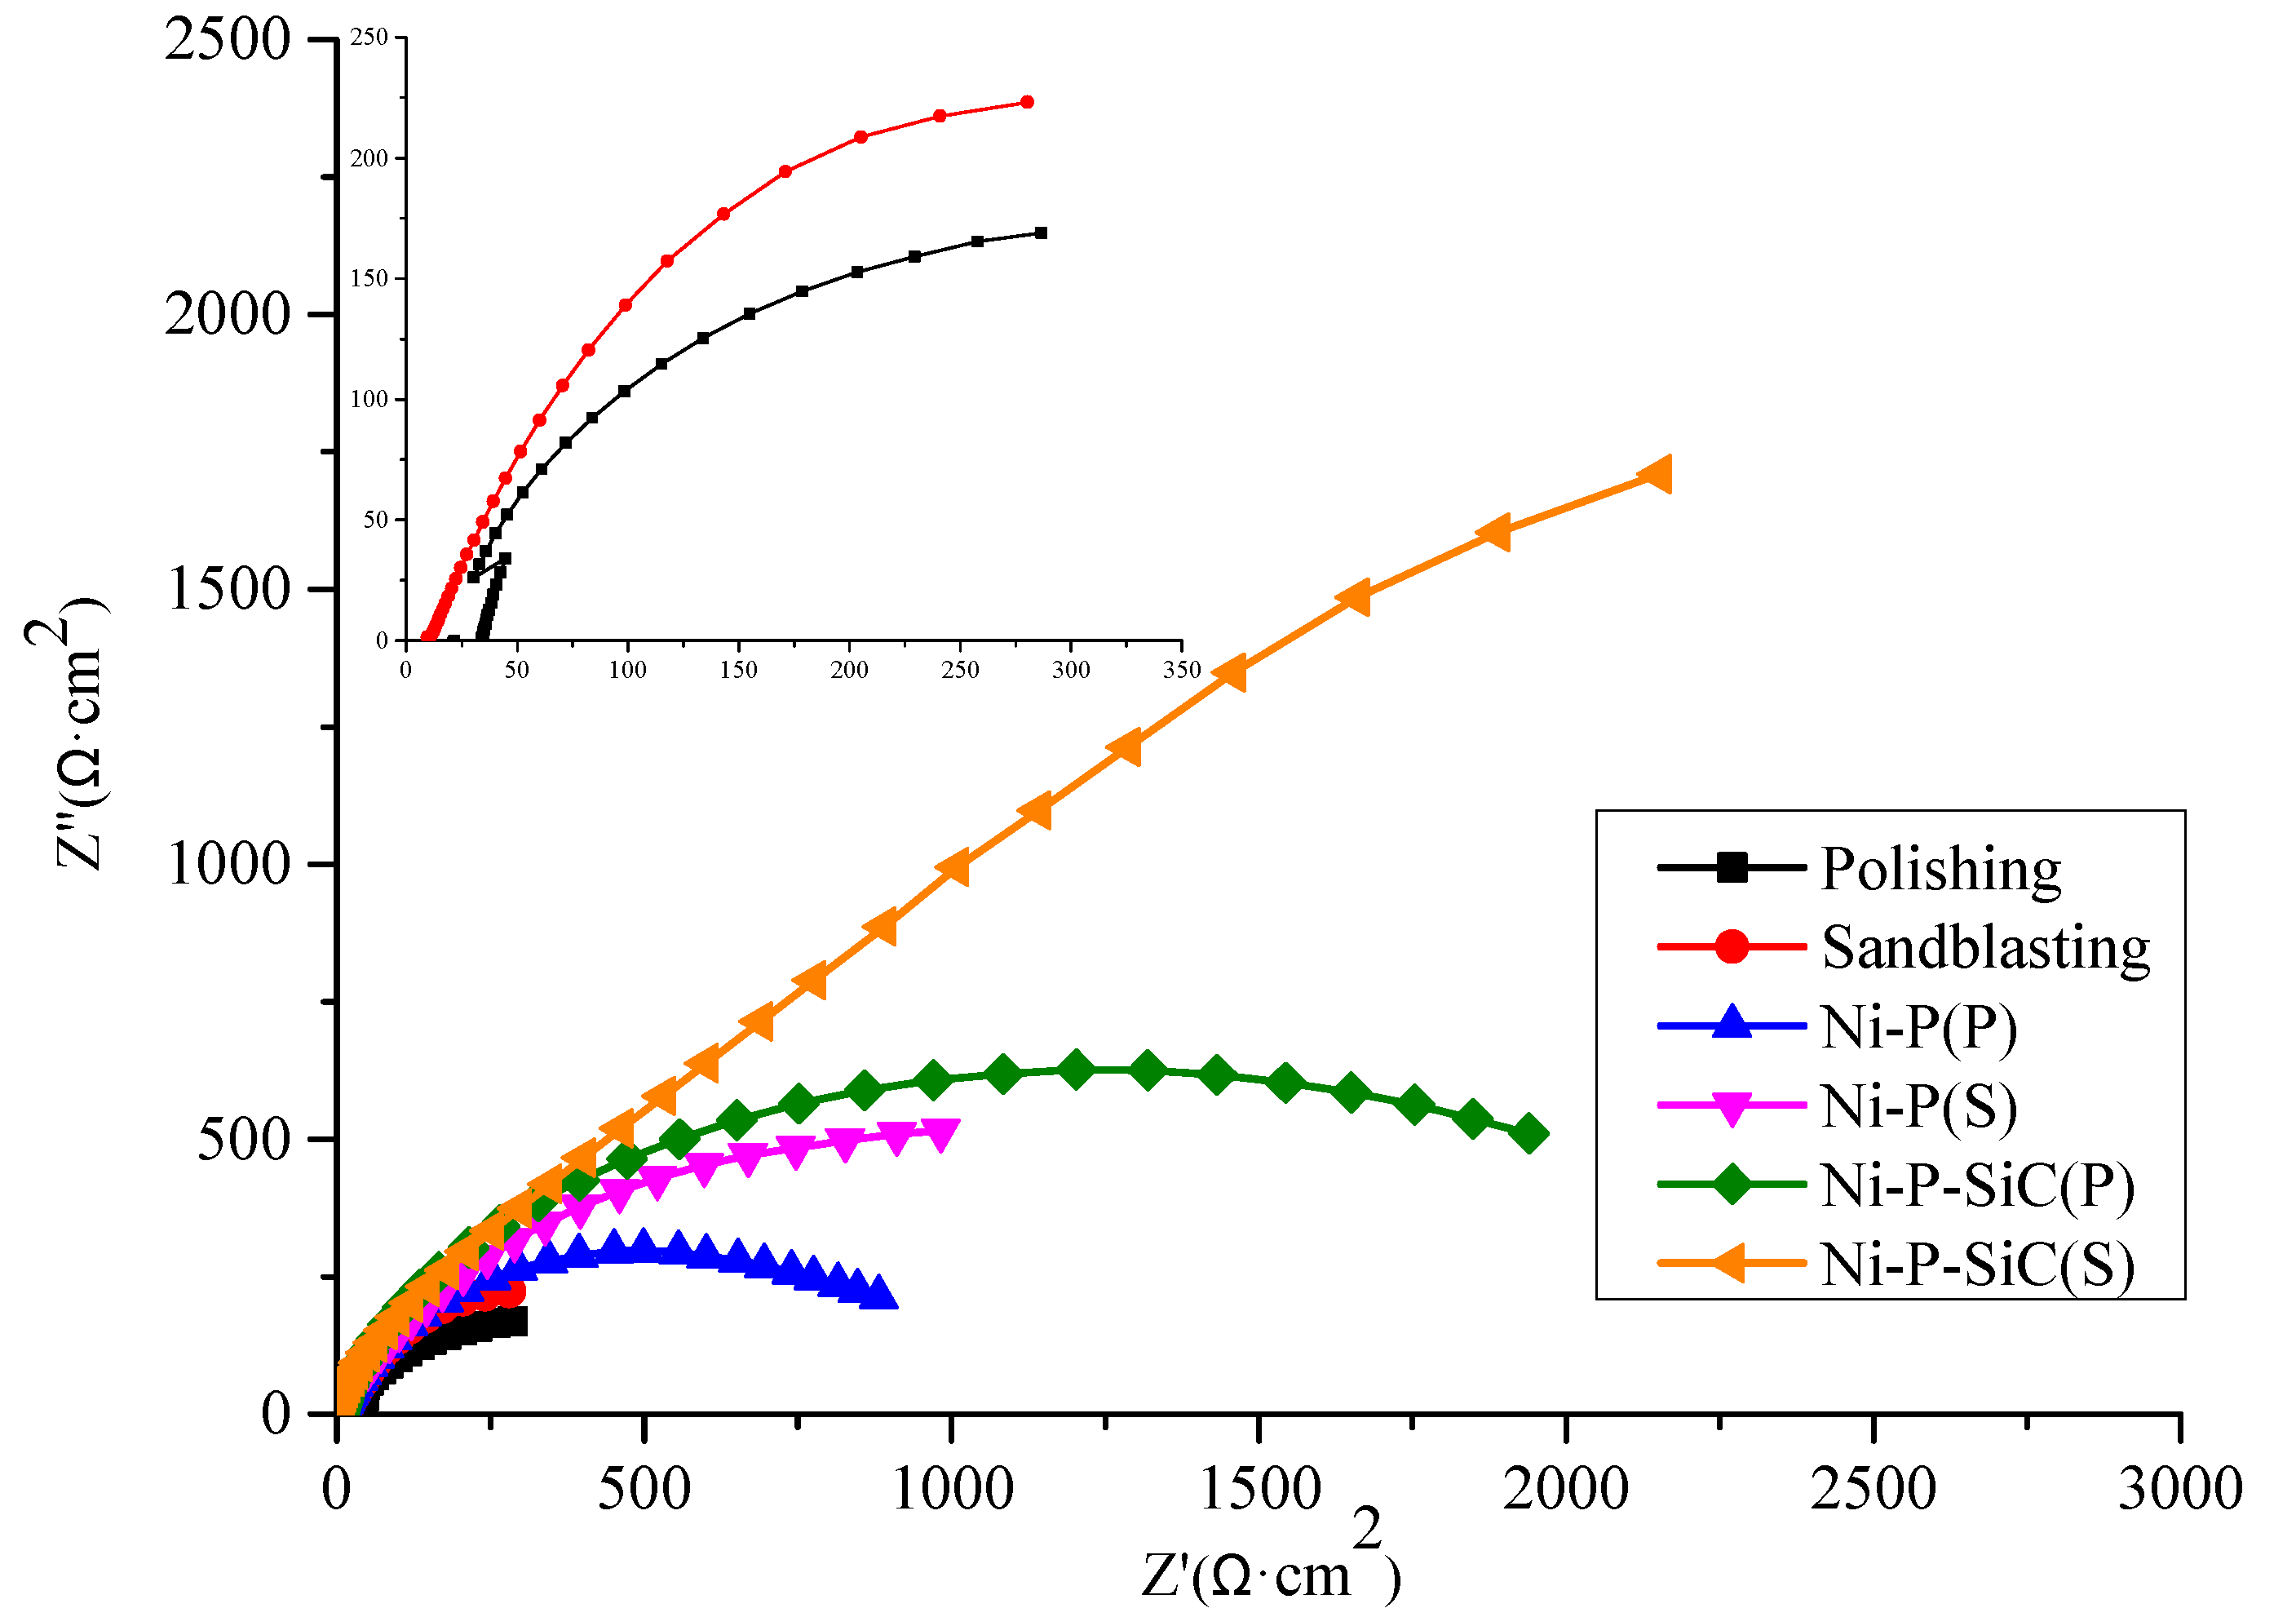
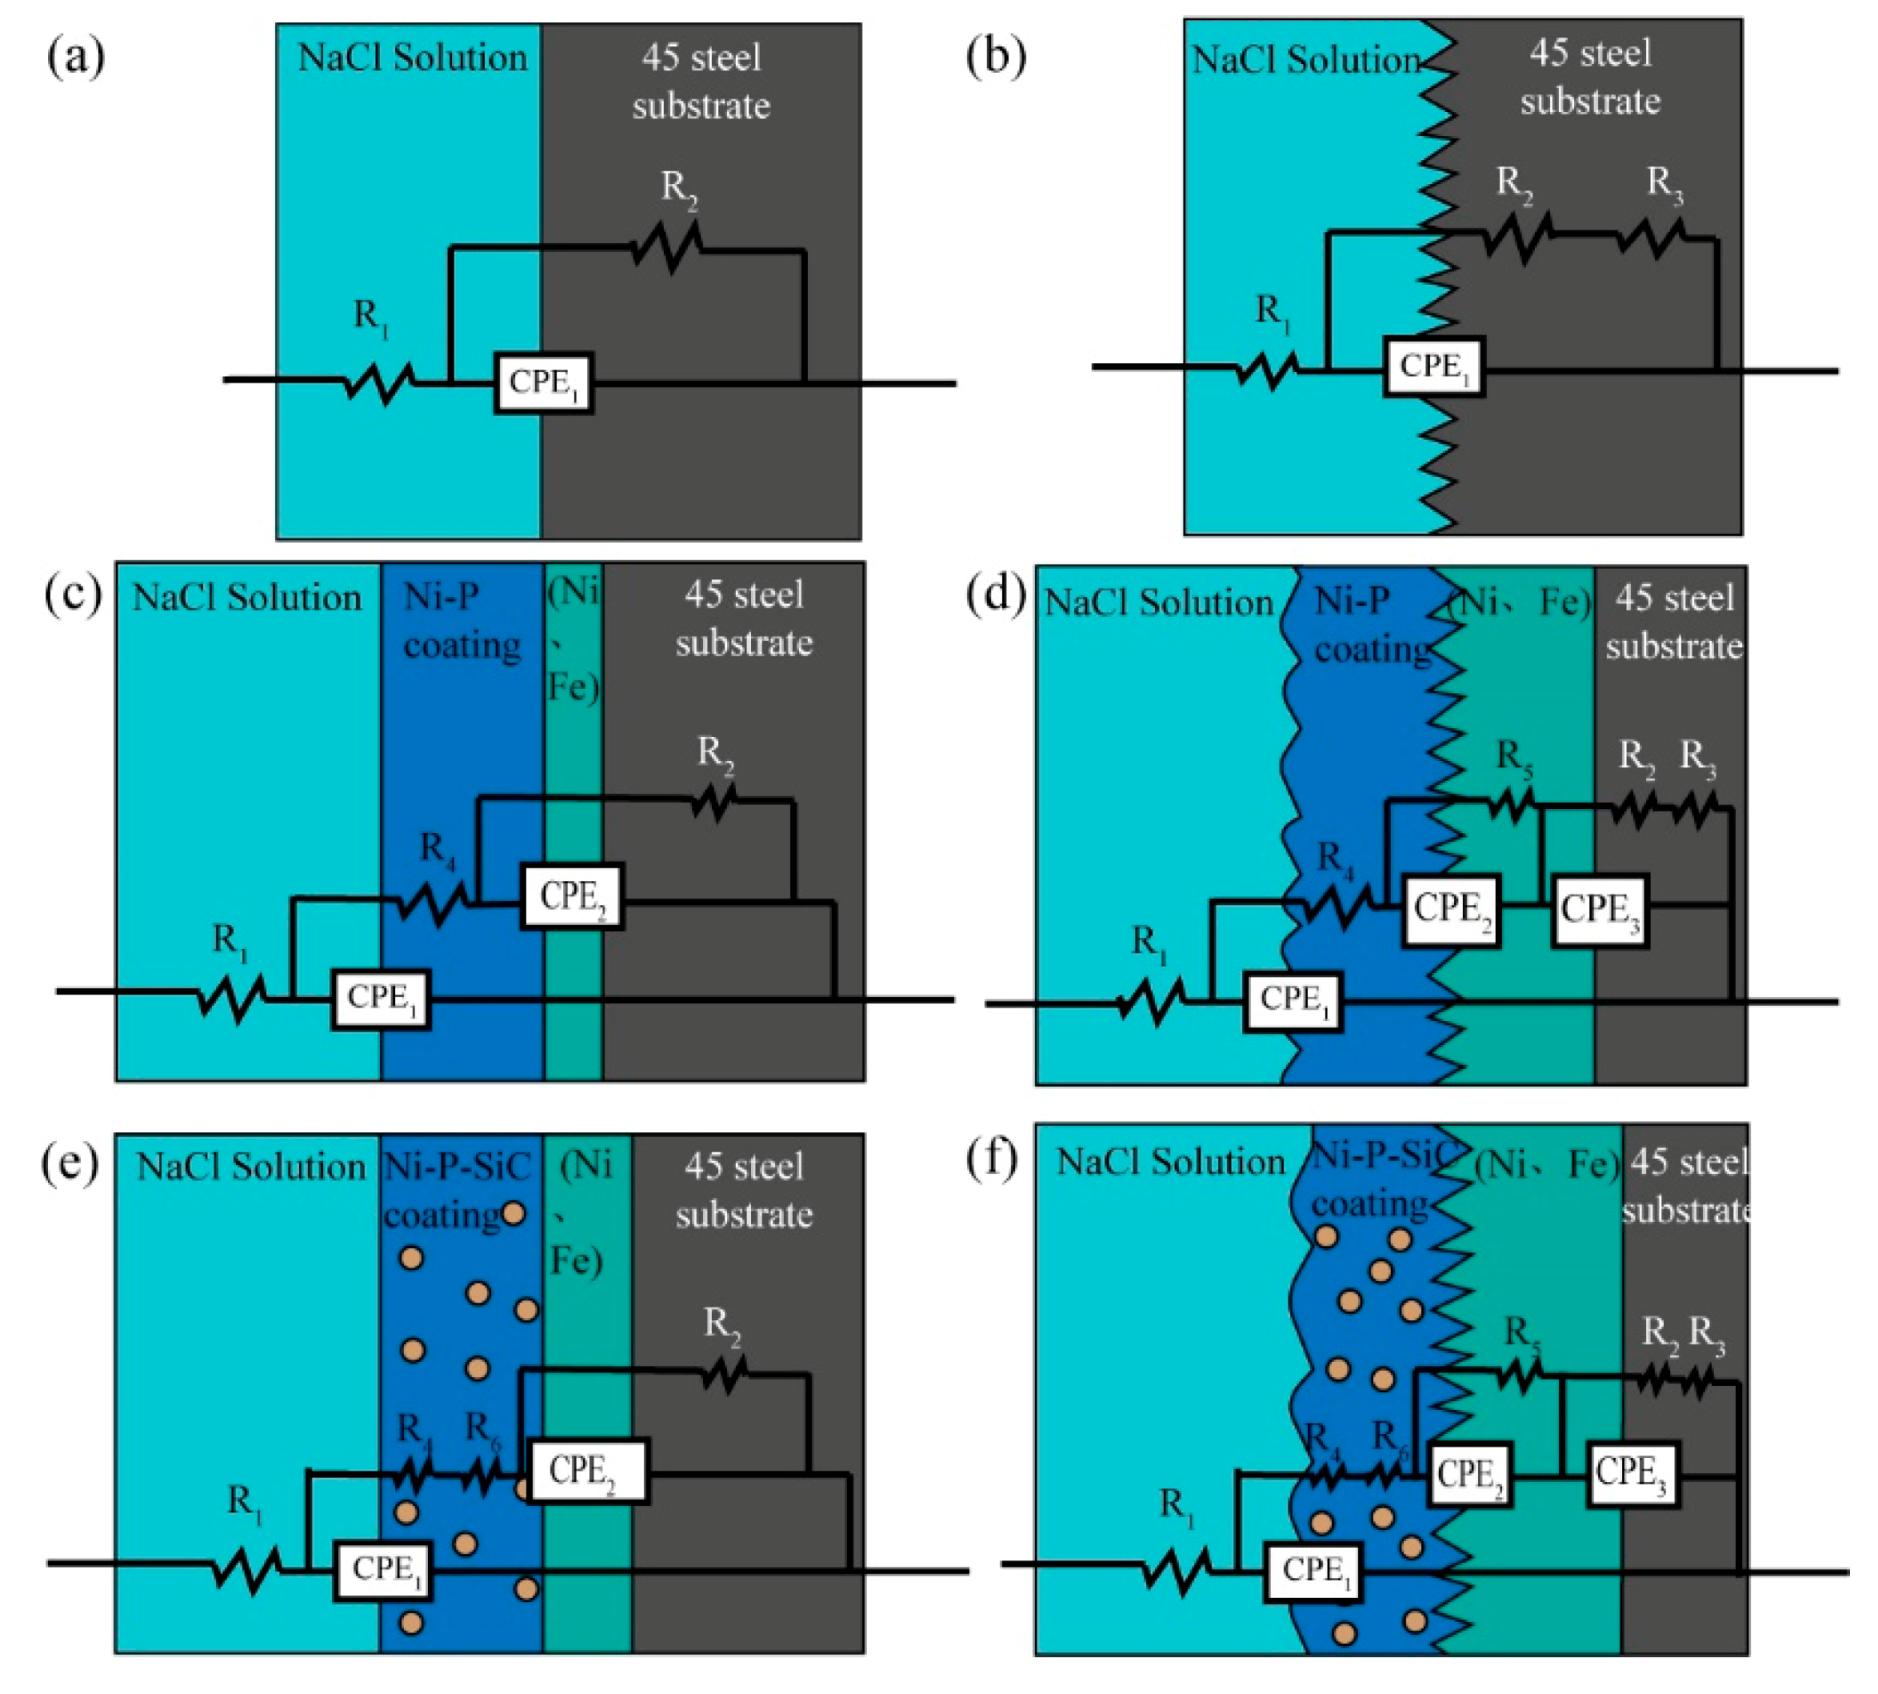
To further study the corrosion resistance of the different samples, the Nyquist plots of the AC-impedance spectrum curves of the samples obtained by measurement were plotted, as shown in Figure 11. The radius of the capacitance loop represents the impedance of the working electrode. An increase in the radius of the impedance arc indicates that the coating had good corrosion resistance. Among the samples, the capacitive ring radius of the polished 45 steel substrate was the smallest, whereas that of the Ni–P–SiC coating with the sandblasting pretreatment was the largest. Therefore, the existence of SiC nanoparticles and the sandblasting pretreatment had a positive effect on the corrosion resistance. This was consistent with the polarization curves and parameters shown in Figure 10 and Table 4. To obtain the sample corrosiveness through a quantitative analysis, the corresponding EIS equivalent circuit diagram model was proposed, as shown in Figure 12. The results were fitted using the ZSimpWin software, as listed in Table 5. Here, R1 represents the equivalent electrolyte resistance of the NaCl solution, R2 represents the equivalent resistance of the polished substrate, R3 represents the equivalent resistance of the reinforcement with the sandblasting pretreatment, R4 represents the equivalent resistance of the Ni–P coating, R5 represents the equivalent resistance of the element penetration zone, and R6 represents the equivalent resistance of the SiC nanoparticles. The constant phase element (CPE) was used to replace the capacitor in the equivalent circuit to fit the impedance characteristics of the double layer more accurately. Each equivalent resistance value was fitted using the EIS diagram and equivalent circuit. The results show that the sandblasted substrate, in which case R2 increased from 331.6 to 518 Ω, helped effectively improve the corrosion resistance. When the Ni–P coating was electrodeposited on the substrate surface, an element penetration region formed between the coating and the substrate. Compared with the polishing pretreatment, the element penetration region after the sandblasting pretreatment was wider, forming an equivalent resistance. The corrosion resistance of the Ni–P coating could be improved by adding SiC nanoparticles. This is because of its stable chemical properties, which provide a physical shielding of inert particles, forming an equivalent resistance in the coating. In addition, the deposition of the SiC particles in the coating could prevent the penetration of corrosive substances, thus improving the corrosion resistance of the composite coating. The Ni–P–SiC coating with the sandblasting pretreatment exhibited the largest element penetrating region and the highest R2 value, reaching 3108 Ω. This coating gave the best corrosion protection for the substrate.

4. Conclusions

  • The surface square-root roughness values of the 45 steel substrates subjected to polishing and sandblasting pretreatments were 0.006 ± 0.0011 μm and 0.804 ± 0.027 μm, respectively, and the root-mean-square roughness values were 0.008 ± 0.0007 μm and 1.055 ± 0.066 μm, respectively. Compared with the polishing pretreatment, the sandblasting pretreatment could quickly impart a rough appearance on the substrate surface.
  • The sandblasting pretreatment helped increase the number of nucleation points of the cellular structure on the coating surface and impart a dense cellular structure distribution. The addition of the SiC nanoparticles could refine the Ni–P coating, improve the cathode polarization, and promote the nucleation of Ni2+. Defects on the coating surfaced were clearly improved.
  • An analysis of the section morphology after the sandblasting pretreatment showed that the coating and the rough substrate surface adhered tightly. The high roughness of the surface led to an increase in the number of nucleation points in the coating, thus increasing the coating thickness. After adding the SiC nanoparticles, the coating section was more compact, the adhesion between the substrate was higher, and the coating thickness increased. An element penetration region was formed between the coating and the substrate, as observed by scanning the section elements. The sandblasting pretreatment and SiC nanoparticle addition could promote the interpenetration of the elements and increase the range of the element penetration region. The Ni–P–SiC coating prepared by scanning electrodeposition with the sandblasting pretreatment exhibited the largest element permeating region, up to 28.39 ± 0.07 µm.
  • The sandblasting pretreatment increased the real surface area of contact between the substrate and the coating, so that the adhesion between the coating and the substrate formed a mechanical interlock. The addition of SiC nanoparticles refined the Ni–P coating structure. The expansion of the element penetration region could improve the coating adhesion. After the sandblasting pretreatment, the Ni–P–SiC coating adhesion was the highest, reaching 36.5 N.
  • Compared with the polished samples, the corrosion potential of the sandblasted substrate increased from −1.13 to −0.91 V, and the current density decreased from 4.67 × 10⁻⁴ to 2.15 × 10⁻⁵ A·cm−2. The element penetration region between the coating and the substrate could alleviate the impact of corrosion on the substrate. The Ni–P–SiC coating prepared on the sandblasted substrate exhibited the highest corrosion potential, reaching −0.30 V, and the lowest corrosion current density, reaching 8.45 × 10⁻⁷ A·cm−2.

Author Contributions

Conceptualization, Z.S., X.C. and X.F.; methodology, X.F. and Z.S.; software, Z.S. and J.L.; validation, X.F., J.L. and H.C.; formal analysis, Z.S.; investigation, H.C., Z.S. and X.C.; resources, Z.S.; data curation, Z.S. and J.L.; writing—original draft preparation, J.L. and Z.S.; writing—review and editing, J.L., X.C.; visualization, Z.S. and X.F.; supervision, H.C., Z.S. and J.L.; project administration, J.L. and X.F.; funding acquisition, Z.S., X.F. and J.L.; All authors have read and agreed to the published version of the manuscript.

Funding

This work was financially supported by the Fundamental Research Funds for the Central Universities (Grant number KYXJ202002), the National Natural Science Foundation of China (Grant number 31901455), the Natural Science Foundation of Jiangsu (Grant number SBK2018041878), the Postdoctoral fund of China (Grant number 2018M632314), Nanjing Agricultural University Innovation Training Plan (Grant number 202030XX42), and Innovation Training Plan for College Students of Jiangsu (Grant number 202010307154Y).

Conflicts of Interest

The authors declare no conflict of interest.

References

  1. Miao, B.; Zhao, X.B.; Song, L.; Wei, K.X.; Hu, J. Raising the Corrosion Resistance of Plasma-Nitrided Steel 45 (AISI 1045) by Preliminary Sandblasting. Met. Sci. Heat Treat. 2019, 60, 808–813. [Google Scholar] [CrossRef]
  2. Lu, Y.Z.; Li, H.G.; Zhang, H.; Huang, G.H.; Xu, H.D.; Qin, Z.X.; Lu, X. Zr-Based Metallic Glass Coating for Corrosion Resistance Improvement of 45 Steel. Mater. Trans. 2019, 58, 1319–1321. [Google Scholar] [CrossRef] [Green Version]
  3. Luo, X.X.; Yao, Z.J.; Zhang, P.Z.; Zhou, K.Y. Corrosion Resistance of Al-Cr Composite Strengthening Layer on the Surface of 45(#) steel. Rare Met. Mater. Eng. 2018, 47, 3127–3133. [Google Scholar]
  4. Huang, G.K.; Qu, L.D.; Lu, Y.Z.; Wang, Y.Z.; Li, H.G.; Qin, Z.X.; Lu, X. Corrosion resistance improvement of 45 steel by Fe-based amorphous coating. Vacuum 2018, 153, 39–42. [Google Scholar] [CrossRef]
  5. Li, G.; Gan, Y.Y.; Liu, C.H.; Shi, Y.; Zhao, Y.C.; Kou, S.Z. Corrosion and Wear Resistance of Fe-Based Amorphous Coatings. Coatings 2020, 10, 73. [Google Scholar] [CrossRef] [Green Version]
  6. Dudkina, N.G. Corrosion Resistance of Steel 45 Substrate to Electromechanical Treatment and Surface Plastic Deformation. Met. Sci. Heat Treat. 2018, 59, 584–587. [Google Scholar] [CrossRef]
  7. Ding, H.Q.; Jiang, S.Y.; Xu, J. Effect of chemical heat treatment on cavitation erosion resistance of stainless steel. Proc. Inst. Mech. Eng. Part J 2019, 233, 1753–1762. [Google Scholar] [CrossRef]
  8. Li, Y.L.; Wu, Q.; Liu, C.S. Effects of chemical composition and heat treatment on wear properties of backup rolls steel. Mater. Express. 2019, 9, 764–772. [Google Scholar] [CrossRef]
  9. Zhu, L.; Zhang, N.N.; Zhang, B.C.; Sun, F.; Bolot, R.; Planche, M.P.; Liao, H.L.; Coddet, C. Very low pressure plasma sprayed alumina and yttria-stabilized zirconia thin dense coatings using a modified transferred arc plasma torch. Appl. Surf. Sci. 2011, 258, 1422–1428. [Google Scholar] [CrossRef]
  10. Yu, Z.Y.; Zheng, Y.; Chen, J.M.; Wu, C.F.; Xu, J.J.; Lu, H.; Yu, C. Effect of laser remelting processing on microstructure and mechanical properties of 17-4 PH stainless steel during laser direct metal deposition. J. Mater. Process. Technol. 2020, 284, 116738. [Google Scholar] [CrossRef]
  11. Wang, Y.; Lu, D.H.; Wu, G.L.; Chen, K.Y.; Wu, H.; Zhang, Q.L.; Yao, J.H. Effect of laser surface remelting pretreatment with different energy density on MAO bioceramic coating. Surf. Coat. Technol. 2020, 393, 125815. [Google Scholar] [CrossRef]
  12. Bello, M.; Shanmugan, S. Achievements in mid and high -temperature selective absorber coatings by physical vapor deposition (PVD) for solar thermal Application -A review. J. Alloys Compd. 2020, 839, 15510. [Google Scholar] [CrossRef]
  13. Bobzin, K.; Brogelmann, T.; Kalscheuer, C.; Liang, T. Post-annealing of (Ti,Al,Si)N coatings deposited by high speed physical vapor deposition (HS-PVD). Surf. Coat. Technol. 2019, 375, 752–762. [Google Scholar] [CrossRef]
  14. Wei, X.D.; Chen, W.F.; Liu, N.; Fan, H.R. Dendritic FeNi3 phase grown on copper foil by electrodeposition as electrocatalyst for efficient oxygen evolution reaction. J. Alloys Compd. 2020, 830, 154708. [Google Scholar] [CrossRef]
  15. Arai, S.; Murakami, I.; Shimizu, M.; Oshigane, A. Fabrication of CNT/Cu Composite Yarn via Single-Step Electrodeposition. J. Electrochem. Soc. 2020, 167, 102509. [Google Scholar] [CrossRef]
  16. Malyshev, V.N.; Volkhin, A.M. Antifriction properties increasing of ceramic MAO-coatings. Proc. Inst. Mech. Eng. Part J 2014, 228, 435–444. [Google Scholar] [CrossRef]
  17. Panchuk, D.A.; Sadakbaeva, Z.K.; Bagrov, D.V.; Bol’shakova, A.V.; Yarysheva, L.M.; Meshkov, I.B.; Muzafarov, A.M.; Volynskii, A.L.; Bakeev, N.F. Estimating the Strain-Strength Characteristics of Nanothick Nonmetallic Coatings Deposited onto Poly (ethylene terephthalate) Films. Polym. Sci. Ser. A 2011, 53, 303–310. [Google Scholar] [CrossRef]
  18. Boda, M.A.; Cirak, B.B.; Demir, Z.; Cirak, C. Facile synthesis of hybrid ZnO nanostructures by combined electrodeposition and chemical bath deposition for improved performance of dye-sensitized solar cell. Mater. Lett. 2019, 248, 143–145. [Google Scholar] [CrossRef]
  19. Zhang, F.; Yao, Z.J.; Moliar, O.; Tao, X.W.; Yang, C. Nanocrystalline Ni coating prepared by a novel electrodeposition. J. Alloys Compd. 2020, 830, 153785. [Google Scholar] [CrossRef]
  20. Xu, Y.K.; Fan, M.Y.; Luo, Y.Q.; Chen, Y.N.; Hao, J.M.; Hou, X.H. Tribology and corrosion properties investigation of a pulse electrodeposition duplex hard-particle-reinforced Ni-Mo nanocomposite coating. Surf. Coat. Technol. 2020, 393, 125797. [Google Scholar] [CrossRef]
  21. Wang, G.F.; Shen, L.D.; Dou, L.M.; Tian, Z.J.; Liu, Z.D. Porous Metal and Method for Preparation by the Scanning and Swinging Jet Electrodeposition. Int. J. Electrochem. Sci. 2014, 9, 3319–3326. [Google Scholar]
  22. Wang, Z.W.; Shen, L.D.; Jiang, W.; Fan, M.Z.; Liu, D.C.; Zhao, J.F. Superhydrophobic nickel coatings fabricated by scanning electrodeposition on stainless steel formed by selective laser melting. Surf. Coat. Technol. 2019, 377, 124886. [Google Scholar] [CrossRef]
  23. Wang, Z.W.; Shen, L.D.; Qiu, M.B.; Jiang, W.; Chen, Y.; Zhao, J.F. Study on the properties of superhydrophobic coating prepared by scanning electrodeposition on SLM substrate. Mater. Res. Express. 2019, 6, 106409. [Google Scholar] [CrossRef]
  24. Shen, L.D.; Xu, M.Y.; Jiang, W.; Qiu, M.B.; Fan, M.Z.; Ji, G.B.; Tian, Z.J. A novel superhydrophobic Ni/Nip coating fabricated by magnetic field induced selective scanning electrodeposition. Appl. Surf. Sci. 2019, 489, 25–33. [Google Scholar] [CrossRef]
  25. Li, Y.F.; Zhang, K.; Zhang, M.M.; Zhang, Y.Q.; Wu, T.T.; Zhao, H.Y.; Su, J.X.; Wang, Z.K.; Wang, J.F. Preparation of Sol-Enhanced Ni-P-Al2O3 Nanocomposite Coating by Electrodeposition. J. Nanomater. 2020, 2020, 5239474. [Google Scholar] [CrossRef]
  26. Safavi, M.S.; Rasooli, A. Ni-P-TiO2 nanocomposite coatings with uniformly dispersed Ni3Ti intermetallics: Effects of TiO2 nanoparticles concentration. Surf. Eng. 2019, 35, 1070–1080. [Google Scholar] [CrossRef]
  27. Du, Y.C.; Zhang, X.M.; Wei, L.Q.; Yu, B.; Ma, D.Q.; Ye, S.F. Electrodeposition of a Ni-P-TiO2/Ti3C2Tx Coating with In Situ Grown Nanoparticles TiO2 on Ti3C2Tx Sheets. Coatings 2019, 9, 750. [Google Scholar] [CrossRef] [Green Version]
  28. Cheon, H.U.; Lee, J.H. Effects of Bath Composition and P Contents on the Mechanical Properties of Ni-P Electroplating. Sci. Adv. Mater. 2020, 12, 605–608. [Google Scholar] [CrossRef]
  29. Jiang, W.; Shen, L.D.; Xu, M.Y.; Wang, Z.W.; Tian, Z.J. Mechanical properties and corrosion resistance of Ni-Co-SiC composite coatings by magnetic field-induced jet electrodeposition. J. Alloys Compd. 2019, 791, 847–855. [Google Scholar] [CrossRef]
  30. Ahmadkhaniha, D.; Zanella, C. The Effects of Additives, Particles Load and Current Density on Codeposition of SiC Particles in NiP Nanocomposite Coatings. Coatings 2019, 9, 554. [Google Scholar] [CrossRef] [Green Version]
  31. Jiang, W.; Shen, L.D.; Wang, K.; Wang, Z.W.; Tian, Z.J. Wear resistance of Ni-Co/SiC composite coating by jet electrodeposition in the presence of magnetic field. Proc. Inst. Mech. Eng. Part B 2019, 243, 431–438. [Google Scholar] [CrossRef]
  32. Kazimierczak, H.; Szymkiewicz, K.; Bobrowski, P.; Swiatek, Z.; Rogal, L.; Gileadi, E.; Eliaz, N. The Effect of SiC Nanoparticle Size on the Electrodeposition of Zn-SiC Nanocomposite Coatings from Citrate Bath. J. Electrochem. Soc. 2018, 165, D774–D782. [Google Scholar] [CrossRef]
  33. Cheng, A.Y.; Sheu, H.H.; Liu, Y.M.; Hou, K.H.; Hsieh, P.Y.; Ger, M.D. Effect of Pretreatment Process on the Adhesion and Corrosion Resistance of Nickel-Boron Coatings Deposited on 8620H Alloy Steel. Int. J. Electrochem. Sci. 2020, 15, 61–89. [Google Scholar] [CrossRef]
  34. Zhang, P.J.; Xu, G.Q.; Liu, J.Q.; Yi, X.F.; Wu, Y.C.; Chen, J.W. Effect of pretreating technologies on the adhesive strength and anticorrosion property of Zn coated NdFeB specimens. Appl. Surf. Sci. 2016, 363, 499–506. [Google Scholar] [CrossRef]
  35. Sheu, H.H.; Chen, Y.R.; Lin, T.T.; Ger, M.D. Effect of Pretreatment Process on the Adhesion and Corrosion Resistance of Chromium-Carbon Coatings Deposited on Copper Substrates. Int. J. Electrochem. Sci. 2019, 14, 3281–3290. [Google Scholar] [CrossRef]
  36. Shin, J.; Kim, T.; Lim, K. Effects of steel type and sandblasting pretreatment on the solid-liquid compound casting characteristics of zinc-coated steel/aluminum bimetals. J. Alloys Compd. 2019, 778, 170–185. [Google Scholar] [CrossRef] [Green Version]
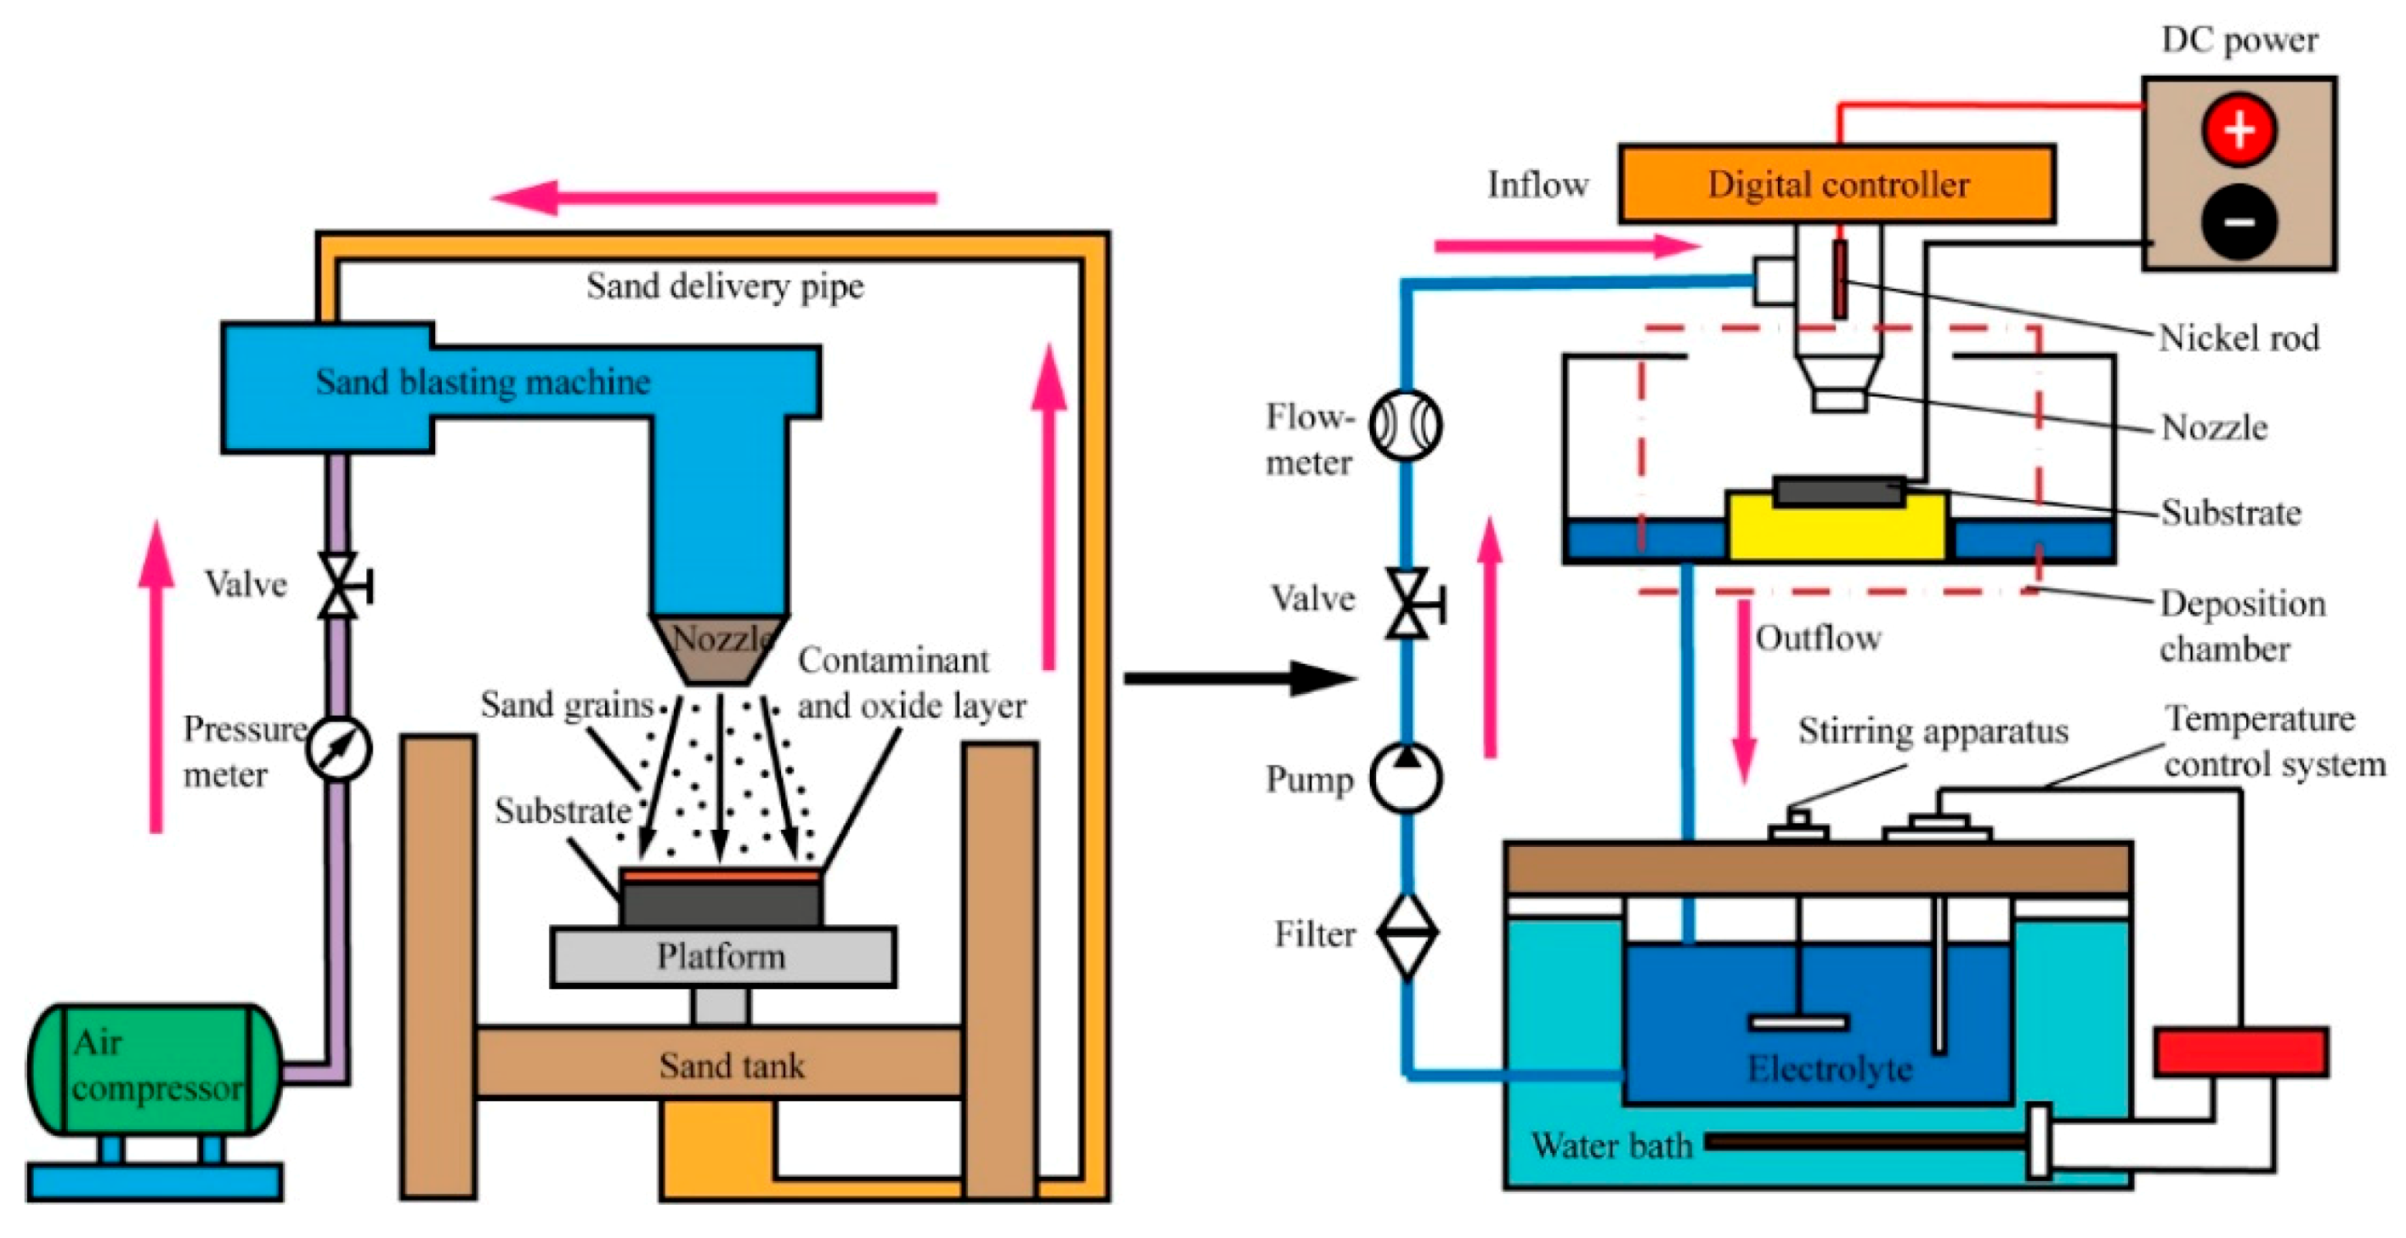
Figure 1. Experimental process diagram.
Coatings 10 00895 g001
Figure 2. Experimental principle.
Coatings 10 00895 g002
Figure 3. Surface 3D morphology of the substrates subjected to two pretreatment processes: (a) polishing and (b) sandblasting.
Coatings 10 00895 g003
Figure 4. Surface morphologies of coatings on 45 steel substrates, prepared by scanning electrodeposition with different pretreatment processes: (a) Ni–P(P), (b) Ni–P(S), (c) Ni–P–SiC(P), and (d) Ni–P–SiC(S).
Coatings 10 00895 g004
Figure 5. Section morphologies of the coatings prepared on 45 steel substrates by scanning electrodeposition with different pretreatment processes: (a) Ni–P(P), (b) Ni–P(S), (c) Ni–P–SiC(P), and (d) Ni–P–SiC(S).
Coatings 10 00895 g005
Figure 6. Section element scanning results of coatings on 45 steel substrates, prepared by scanning electrodeposition with different pretreatment processes: (a) Ni–P(P), (b) Ni–P(S), (c) Ni–P–SiC(P), and (d) Ni–P–SiC(S).
Coatings 10 00895 g006
Figure 7. Schematic of the coating adhesion test.
Coatings 10 00895 g007
Figure 8. Scratch morphologies of coatings prepared by scanning electrodeposition on 45 steel substrates with different pretreatment processes: (a) Ni–P(P), (b) Ni–P(S), (c) Ni–P–SiC(P), and (d) Ni–P–SiC(S).
Coatings 10 00895 g008
Figure 9. Adhesion of coatings prepared by scanning electrodeposition on 45 steel substrates with different pretreatment processes.
Coatings 10 00895 g009
Figure 10. Potential polarization curves of coatings prepared by scanning electrodeposition on 45 steel substrates with different pretreatment processes.
Coatings 10 00895 g010
Figure 11. Nyquist plots of coatings prepared by scanning electrodeposition on 45 steel substrates with different pretreatment processes.
Coatings 10 00895 g011
Figure 12. Equivalent circuit diagram of coatings prepared by scanning electrodeposition on 45 steel substrates with different pretreatment processes: (a) polishing, (b) sandblasting, (c) Ni–P(P), (d) Ni–P(S), (e) Ni–P–SiC(P), and (f) Ni–P–SiC(S).
Coatings 10 00895 g012
Table 1. Composition of 45 steel.
CompositionCSiMnCrNiCu
Content (%)0.42–0.500.17–0.370.50–0.80≤0.25≤0.30≤0.25
Table 2. Composition of the plating solution.
CompositionContent/(g·L−1)
NiSO4·6H2O200
NiCl2·6H2O30
H3PO320
H3BO330
C6H8O760
C12H25SO4Na0.08
CH4N2S1
SiC (silicon carbide)3
Table 3. Surface roughness data of the substrates subjected to two pretreatment processes.
SpecimensPolishingSandblasting
Sa (μm)0.006 ± 0.00110.804 ± 0.028
Sq (μm)0.008 ± 0.00071.055 ± 0.066
Table 4. Polarization curve parameters of coatings prepared by scanning electrodeposition on 45 steel substrates with different pretreatment processes.
SamplesEcorr (V) (CV)icorr (A·cm−2) (CV)Corrosion Rate (mm·a−1) (CV)
P−1.1365 (0.20%)4.67 × 10⁻⁴ (4.13%)5.89154 (2.12%)
S−0.9134 (0.31%)2.15 × 10⁻⁵ (4.98%)0.18865 (4.19%)
Ni–P(P)−0.5420 (0.22%)1.67 × 10⁻⁵ (3.21%)0.20156 (5.73%)
Ni–P(S)−0.4093 (0.60%)6.06 × 10⁻⁶ (5.47%)0.073395 (2.21%)
Ni–P–SiC(P)−0.3718 (0.55%)5.88 × 10⁻⁶ (2.38%)0.071158 (3.80%)
Ni–P–SiC(S)−0.3000 (0.45%)8.45 × 10⁻⁷ (2.59%)0.041128 (2.91%)
Table 5. Equivalent circuit diagram parameters of coatings prepared by scanning electrodeposition on 45 steel substrates with different pretreatment processes.
R1R2R3R4R5R6CPE1/FCPE2/FCPE3/F
P12.85331.6 3.60 × 10⁻⁴
S35.135181.31 × 104 2.85 × 10⁻⁴
Ni–P(P)3.18708.7 46.57 1.62 × 10−53.89 × 10−5
Ni–P(S)5.29963.41.86 × 10632.41221.9 1.19 × 10−61.31 × 10−52.89 × 10⁻⁶
Ni–P–SiC(P)3.821501 93.24 0.010977.20 × 10−62.09 × 10⁻⁵
Ni–P–SiC(S)1.5231084.73 × 10856.1516.40.41051.00 × 10−62.35 × 10−61.84 × 10−5