Article

ZnO Nanostructured Thin Films via Supersonic Plasma Jet Deposition

1
Dipartimento di Fisica “Giuseppe Occhialini”, Università degli Studi di Milano-Bicocca, Piazza della Scienza 3, I-20126 Milan, Italy
2
Institute for Microelectronics and Microsystems, Italian National Research Council, Bologna Unit, Via Gobetti 101, I-40129 Bologna, Italy
*
Author to whom correspondence should be addressed.
Coatings 2020, 10(8), 788; https://doi.org/10.3390/coatings10080788
Submission received: 15 July 2020 / Revised: 3 August 2020 / Accepted: 8 August 2020 / Published: 13 August 2020
(This article belongs to the Section Plasma Coatings, Surfaces & Interfaces)

Abstract

:
Zinc Oxide nanostructured thin films were grown by a novel plasma assisted vapour deposition method, which aims to combine the versatility of deposition processes that are mediated by plasma with the capability to control particles diffusion and nucleation. For this purpose, the proposed approach spatially separates into two different vacuum chambers the creation of zinc oxide from a metalorganic precursor from the actual film growth, thanks to the extraction of a supersonic jet of plasma seeded by the precursor fragments. The characterization of the reactor in different plasma conditions has been carried out by means of optical emission spectroscopy (OES). ZnO films with different degrees of purity, thickness uniformity, as well as different morphologies can be obtained varying the deposition parameters. The samples profiles have been collected in order to evaluate deposition rates and films uniformity. The as-prepared as well as annealed thin films were characterized by attenuated total reflection Fourier transform infrared spectroscopy (ATR-FTIR) to evaluate their chemical composition and purity. According to Raman analyses, the annealed samples are high-purity wurtzite-type crystalline zinc oxide films. Atomic force microscopy (AFM) and scanning electron microscopy (SEM) confirm a surface morphology characterized by columnar structures.

1. Introduction

Nanotechnology proves to be extremely attractive for successful applications in various fields, such as electronics, photovoltaics, environmental protection, and chemical industry. In particular, thin-films science and technology play a crucial role in the development of these modern and advanced technologies [1,2]. Depending on the nanostructures features, thin films show very different electrical and optical properties from their bulk crystalline counterparts. The downscaling process in thin film fabrication has two major effects; firstly, the exposed surface appears to be much greater than the thickness of the structures, thus allowing for a better efficiency in surface processes and chemical reactivity; secondly, the dimensional quantum confinement alters the band structures of the material leading to new and exotic optical and electrical characteristics [3]. To maximize the advantages of this technology, it is possible to study and develop techniques to deposit nanostructured thin films of desired characteristics by acting directly on the growth processes controlling the clusterization. The zinc oxide, object of this work, is a semiconductor having a direct band gap of 3.10–3.37 eV at room temperature [4]. High-quality ZnO bulk crystals have a large exciton binding energy of ∼60 meV and a effective total radiative and nonradiative lifetime of excitons of the order of 1 ns [5]. As a result, ZnO posses an intense near-band-edge excitonic emission at room or higher temperatures and it holds great interest as active material. Additionally, ZnO has a high-energy radiation stability and amenability to wet chemical etching, making it a suitable candidate for space application and fabrication of microelectronics devices, respectively. Recently, zinc oxide nanostructures with controlled dimension, size, porosity, crystal facets, and mesoscale architectures have raised great interest in various applications in sensoring material, photocatalysts, solar cells, and light-emitting applications [6,7,8,9]. Among other growth methods, such as sol-gel processes, molecular-beam epitaxy, and RF magnetron sputtering, the plasma-assisted chemical vapor deposition is particularly interesting because of its high growth rate and large-scale applications. The high vacuum conditions guarantee a lower surface damage and the low temperature better adhesion and smaller grain size. Moreover, the Plasma Assisted Supersonic Jet Deposition has proven to be successful for the growth of high-quality ZnO films with interesting nanostructured morphology.

2. Materials and Methods

An innovative method for deposition of zinc oxide nanostructured thin films is the Plasma Assisted Supersonic Jet Deposition (PA-SJD). The PA-SJD is a patent designed and developed at the Centro PlasmaPrometeo of the University of Milano-Bicocca [10]. This method aims to combine the versatility of the deposition processes that are mediated by plasma with systems of controlled aggregation of clusters, separating into two distinct phases the process of the creation of zinc oxide and the growth of thin films on the substrate. Changing the process parameters, different degrees of purity, and uniformity of the films can be obtained, as well as different morphology. The reactor is constituted by two vacuum chambers, in order to decouple the deposition procedure. In the first chamber, a very reactive and dense plasma is generated by a radio frequency inductively coupled source. In this highly reactive environment, a metal-organic precursor in gaseous form is injected and then dissociated by the plasma to obtain zinc oxide nanoparticles. The second chamber is kept at a lower pressure and it is connected to the first one through a nozzle, thus a supersonic jet of plasma is generated. The jet contains the particle seeds to be deposited, which impact on the substrate starting the nucleation processes. Consequently, the reactions that take place in the plasma phase are decoupled from aggregation phenomena that occur during the supersonic expansion, effectively controlling the growth of a nanostructured thin film. In this experimental plasma conditions, the supersonic jet allows for the deposition of clusters on the substrate favoring the growth of columnar structures. The low collisionality of particles in the jet prevents reassembling processes causing the creation of nanostructures of very small size [11]. In order to characterize the deposition system each step is taken into account; firstly, a thermal analysis on the precursor has been performed to estimate its injection efficiency, consisting of vapor pressure curves measurement, thermogravimetrical analysis (TGA), and differential scanning calorimetry (DSC). During the deposition process, plasma is monitored through optical emission spectroscopy (OES), in order to evaluate precursor flux and its dissociation. Thin films are deposited under different conditions and characterized by means of profilometry, Attenuated Total Reflection-Fourier Transform Infrared spectroscopy (ATR-FTIR) spectroscopy, Raman spectroscopy, Atomic Force Microscopy (AFM), and Scanning Electron Microscopy (SEM). Determining purity, morphology, and structure proprieties provides the ability to tune the working conditions to obtain the desired thin film structures.

2.1. PA-SJD Device

A high level of control on the thin films growth can be achieved decoupling the processes of the precursor oxidation and the particles acceleration and deposition onto the substrate. This can be achieved by spatially separating the region where the precursor fragmentation in plasma phase occurs and the region where the deposition of clusters on a substrate takes place. The precursor is dissociated by a reactive plasma in the first chamber, by means of the converging nozzle a supersonic jet of gas and particles is extracted into the second chamber. During deposition processes, the substrates are placed near the Mach disk of the shock wave. Films characteristics, such as thickness, uniformity, purity, and morphology, can be tuned by changing plasma and jet parameters.
The main vacuum vessel, a stainless-steel cylinder (410 mm height, 160 mm inner radius), has been converted into two chambers, fabricating a cylindrical plasma chamber inside (95 mm height, 62.5 mm inner radius) connected to the upper lid of the vessel. The experimental set-up is shown in Figure 1. The chambers are connected through a circular converging nozzle, having a diameter of 6.9 mm, and it accelerates the gas to a sonic speed. The substrates are fixed on an aluminum movable holder placed at the desired distance from the nozzle, along the axis of the jet. A turbomolecular pump and a rotary pump provide the high vacuum conditions in the chambers (the limit pressure inside the deposition chamber is near 10 5 Pa). The gate valve of the main pumping group can be partially closed, reducing the effective pumping speed, and allowing to set a desired pressure inside the deposition chamber (P d ) with negligible variations to the plasma chamber pressure (P p ). The pressure ratio between the two chambers is defined as R = P p /P d and it can be varied from 40 to 1 to model the supersonic jet geometry and energy. During the measurements, pressure in the chambers is monitored using two capacitance pressure gauges and a full range gauge, with an adequate pressure reading precision in the pressure ranges considered (1–10 Pa in the plasma chamber and 0.01–10 Pa in the deposition chamber). The metalorganic precursor is injected in the plasma chamber upon reaching a sufficiently high level power of the plasma discharge. The solid precursor, held in an aluminum tank outside the main vacuum vessel, is heated through a copper heating wire wrapped around the tank, powered by a variable autotransformer. The precursor temperature can be monitored by means of a thermocouple and varied to obtain different flows. A copper pipe, whose opening is controlled through a Swagelok on–off valve, allows the sublimed precursor inlet. The dissociation of the precursor occurs in a plasma of argon and oxygen: the first provides a stable plasma discharge and the second favors the precursor oxidation. Gases are injected directly in the plasma chamber through two different micrometric valves, in order to independently regulate their flows. The flow regimes in the plasma chamber at pressure of 4–8 Pa can be considered continuous, since the Knudsen number is k n < 0.01. Diffusion acts efficiently and the different species are well-mixed in the plasma. While inside the zone of silence in the deposition chamber, k n is calculated from the estimated gas mean free path, the collisional frequency of the supersonic jet, and the length of the Mach disk at the chosen distance from the orifice. The pressure range for the calculation was observed experimentally and it is between 0.13–0.25 Pa. The estimated Knudsen number is 0.04 < k n < 0.08, therefore the flow regime in the supersonic jet region is transitional, guaranteeing an uniform jet over the substrates. The inductively coupled source is a two- and three-quarter loop planar antenna, made of copper wire and cooled by deionized water [12]. The antenna is placed inside the lower lid of the plasma chamber, shielded by a Teflon scaffold and covered by an alumina disk to reduce sputtering. Feeding the antenna through a 13.56 MHz radiofrequency power generator (PFG 1600 RF, Huttinger Elektronic, Ditzingen, Germany) at 450 W, an uniform and stable plasma discharge generates inside the plasma chamber. The supply RF signal is connected to the external edge of the coil with an L-type matching box along the transmission line and the internal end is connected to the ground. Inductive sources generate quite large plasma densities and relatively small electron temperatures at moderate pressures, in the range of 1–100 Pa. This favors dissociation of external, weakly bound chemical groups in organic precursors, partially preserving the backbone structures [13].

2.2. Diagnostics

Thermogravimetric and differential scanning calorimetry analyses of precursor were conducted through a TGA/DSC1 STARe system (Mettler Toledo, Columbus, OH, USA), provided by a 10 6 g resolution balance. The analyses were conducted at the same time by warming the precursor aluminum tank with heating rate of 5 ° C/min at atmospheric pressure. The experiment was conducted in a nitrogen atmosphere in order to prevent unwanted oxidation reactions. The discharge emission spectra were recorded by means of an optical spectrometer (S2000, Ocean Insight, Largo, FL, USA), equipped with a 10 μ m slit and a 2048 pixels CCD, having a spectral band extending from 180 nm to 850 nm and a resolution of 0.3 nm. Emission spectra were captured directly imaging the plasma region through a quartz view-port on the top flange with an IR enhanced optical fiber (FC-IR050-2, Avantes, Apeldoorn, The Netherlands). In order to obtain the real relative intensities of emission lines at different wavelengths, the system was calibrated with both a deuterium and halogen lamp (Avalight-DHc, Avantes, Apeldoorn, The Netherlands) to correct for the device sensitivity. The exposure time was optimized to match the CCD sensitivity, avoiding overcounts. Each spectra was averaged over multiple acquisitions for noise reduction and a dark spectrum with comparable statistics was subtracted. For what concerns thin films, the thickness analyzes were carried out through a Dektak 8 Stylus Profilometer (Veeco, Plainview, NY, USA), equipped with a diamond stylus and capable to provide a vertical resolution of 1 Å. The applied stylus tracking force was 15 mg. The profilometer could measure small vertical features ranging in height from 10 nm to 1 mm. Surface chemical composition of samples was investigated by means of a Fourier Transform Infrared (FTIR) spectrometer (Nicolet iS10, Thermo Fisher Scientific, Waltham, MA, USA), equipped with a ATR sampling accessory (Smart iTR, Thermo Fisher Scientific, Waltham, MA, USA). For each spectrum, 64 coadditions scans with a spectral resolution of 2 cm 1 were recorded. Confocal micro-Raman scattering were performed using a LabRAM (Jobin Yvon, HORIBA, Kyoto, Kyoto, Japan) spectrometer and a He-Ne laser at 632.8 nm as excitation source, focusing the beam on a circular spot of 1 μ m in diameter through the optics of a microscope (Olympus, Shinjuku City, Tokyo, Japan) and an objective with magnification 100× and Numeric Aperture 0.90. The scattered light was detected by means of a Peltier- cooled silicon charge-coupled device cooled at 200 K, after a notch filter (Kaiser Optical Systems, Ann Arbor, MI, USA) with 15 nm of bandwidth and a monochromator with a spectral resolution of 1 cm 1 . Atomic force microscopy (AFM) measurements were carried out using a Solver P47-PRO (NT-MDT, Moscow, Russia), in semi-contact (tapping) mode on dry samples using HA-NC (High Accuracy Non Contact) silicon tips (NT-MDT, Moscow, Russia) of typical spring constant 3.5 N/m. The Scanning Electron Microscope (SEM) was a ZEISS 1530 (Jena, Germany) instrument equipped with a Schottky emitter and operated at a primary beam energy of 10 keV.

3. Results and Discussion

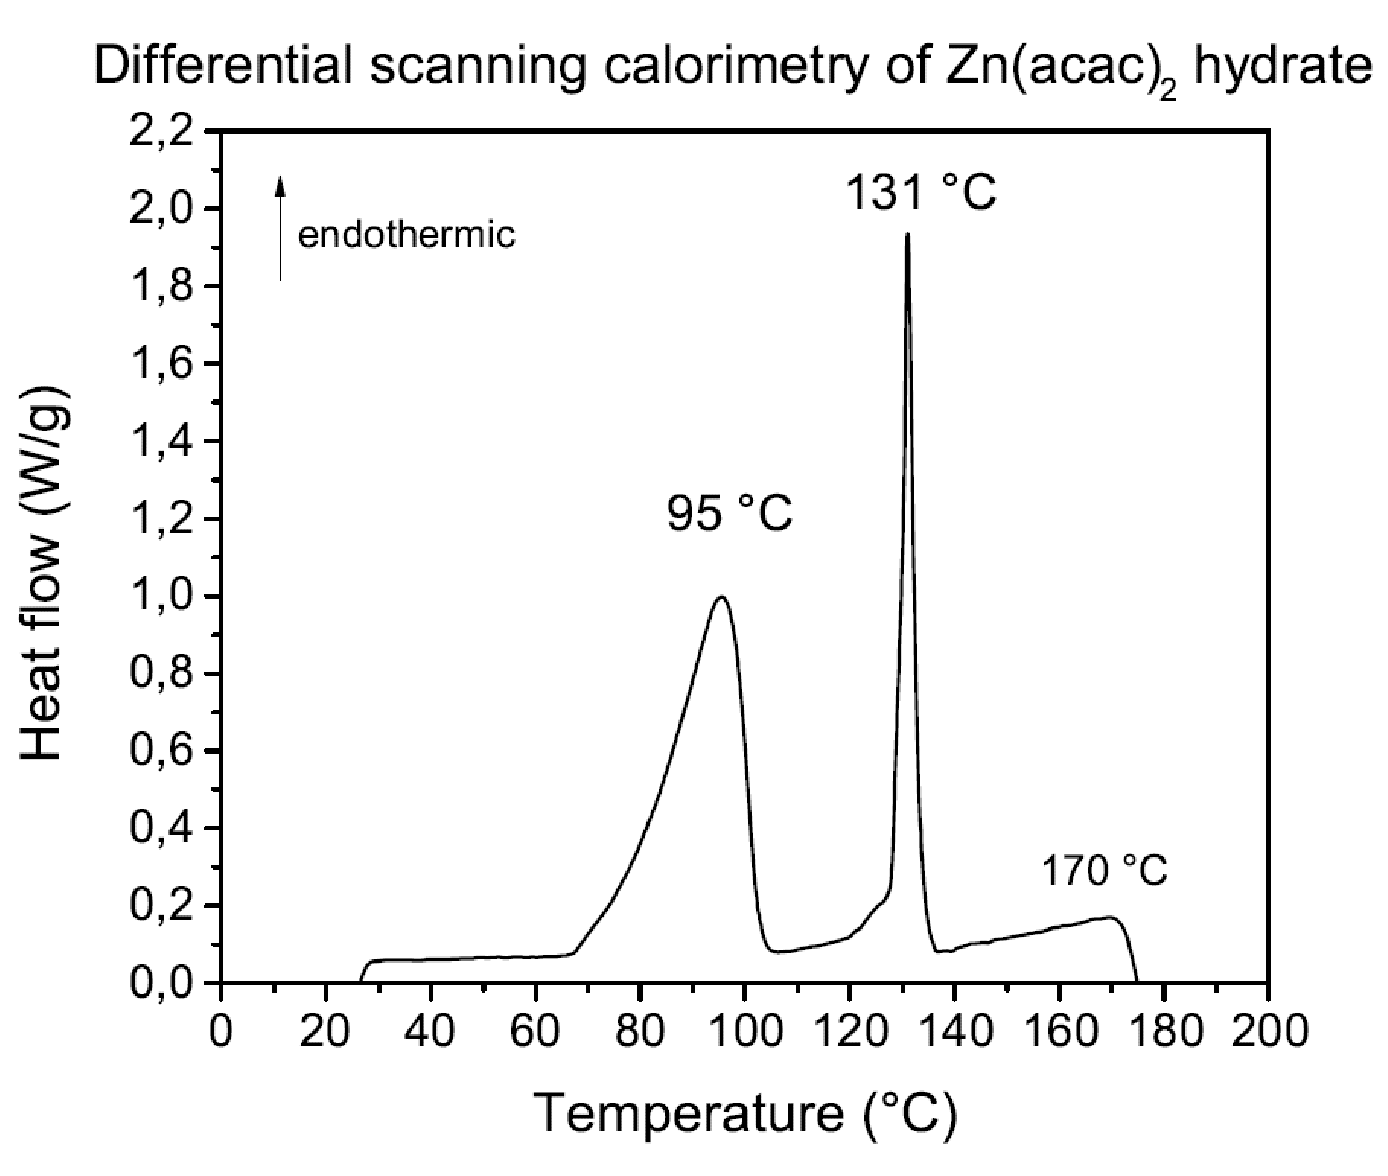
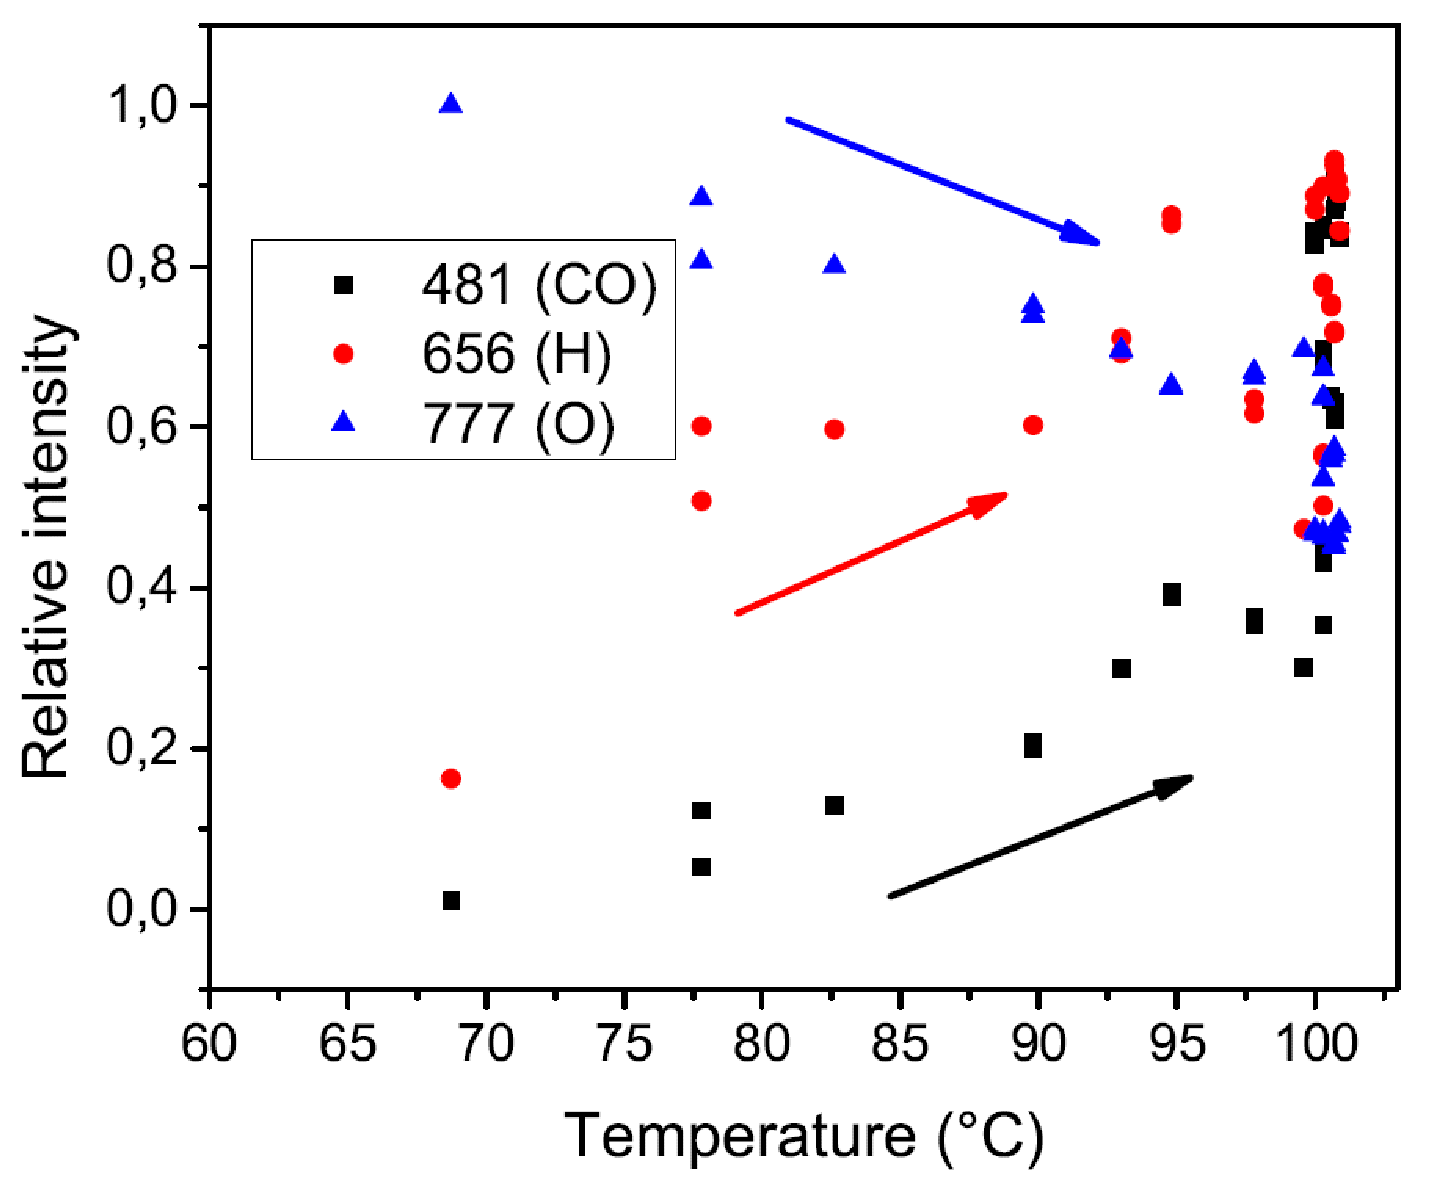
3.1. Thermal Analysis of the Precursor

A well suited precursor for PA-SDJ is a volatile organometallic compound, easily dissociated in an Ar-O 2 plasma. It should be non-toxic for health, environment and mechanical deposition system and it must have an accessible evaporation temperature. The precursor selected for the purpose of this work is zinc acetylacetonate. Zinc acetylacetonate hydrate (also referred as Zn(acac) 2 ), having the chemical structure Zn(C 5 H 7 O 2 ) 2 ·xH 2 O (with 0.7 < x < 1.3), is a convenient zinc oxide precursor and an alternative for the mainly used zinc precursors, diethylzinc and dimethylzinc. Although it is preferred, since it is easier to handle, it has the inconvenient of being solid at room temperature with a sublimation temperature of the order of 100 C [14].
The molecule of zinc acetylacetonate hydrate consists of formal single and double bonds, but, due to electronic delocalisation, the bonds between Zn, C, and O atoms are approximately equal. The relative strengths of the interatomic bonds are listed in Table 1. Zinc acetylacetonate is easily dissociated in plasma, mainly due to the oxidation reactions and dissociation by reactive species. Considering that the plasma temperature for the configuration utilised is approximately 1.5 eV, electrons can easily break the weakest Zn-O bonds following the reaction:
Z n ( C 5 H 7 O 2 ) 2 Z n 2 + + 2 ( C 5 H 7 O 2 )
Oxygen radicals are produced in the plasma because of the dissociation of oxygen molecules:
O 2 + e 2 O + e
The final component of the neutral chemistry that needs to be considered is the oxidation of the atomic zinc released by the decomposition of zinc acetylacetonate. However, thermal decomposition of Zn(acac) 2 may be safely ignored, as no deposition is observed if plasma is not ignited [16]. This only leaves Zn as a potential deposition precursor. Thus, the deposition process can be simply described as a two-step process consisting of atomic zinc adsorption followed by oxidation:
Z n ( g ) + s i t e Z n ( a d )
Z n ( a d ) + O ( g ) Z n O ( b u l k ) + s i t e
Although other species could participate in the oxidation step, atomic oxygen is greatly abundant under plasma operation and has the highest reactivity. To evaluate the temperature at which precursor had to be heated to guarantee a sufficient flux in the plasma chamber, it was necessary to preliminary measure the vapor pressure curves of the zinc acetylacetonate, as there were no previous reported measures in literature. The system to measure the precursor vapor pressure curves is a reservoir which contains the substance, maintained under vacuum by a rotary pump and provided with two inlets, one for the thermocouple and another for the pressure gauge. The tank was heated, in order to reproduce a thermostat, by means of a heat resistant wire wrapped around it, carrying a current generated by a variable autotransformer. The temperature was evaluated through the thermocouple, while the pressure in the container was measured by a capacitive pressure sensor. The system was connected to the pumping units through a valve. The sample was degassed before proceeding with measures by heating, cooling and, consequently, pumping of the residual gases. It should be emphasized that the measurement of vapor pressure curves appears very difficult at less than 1 kPa, as the data are often influenced by important systematic errors due to the sensitivity of the vacuum gauges and the degassing of the tank walls. Additionally, literature lacks in vapor pressures data and, where present, they can show differences of a few tens of percent. The measurements were conducted by heating the sample and by measuring the corresponding pressure inside the reservoir. Data exhibited a certain repeatability during the different sessions. Vapor pressure curves obtained are fitted with the Clausius–Clapeyron equation, in order to estimate the sublimation enthalpy of the compound. Clausius–Clapeyron equation can be rewritten arrested at the first order in a way more useful for the purposes of this work:
P = c o s t + e a + b T
where P is the pressure of the gas, T is its temperature, a is a parameter depending on vapor nature, and b is defined as −E 0 /R, being E 0 the sublimation enthalpy and R the gas constant [17]. In Figure 2 is shown the fit of a typical vapor pressure curve of Zn(acac) 2 hydrate, obtained heating the tank at 2 ° C/min. While Figure 3 shows the curve after the dehydration of the compound, carried out by pumping the gaseous content of the tank (presumably only due to water vapor) after heating at 60 ° C in vacuum conditions. Therefore curve is attributable to the anhydrous form of zinc acetylacetonate, and it is realized by increasing the temperature with a heating rate of 2 ° C/min. From parameter b of Equation (1) is therefore calculated the molar latent heat of sublimation [18] for zinc acetylacetonate hydrate and anhydrous forms: respectively, 111 kJ/mol and 23.5 kJ/mol.
A thermogravimetric analysis (TGA) of a sample of 14 mg of zinc acetylacetonate was carried out, in conjunction with a measurement of differential scanning calorimetry (DSC). The TGA graph obtained for zinc acetylacetonate hydrate is displayed in Figure 4.
The hydration water (approximately 8% of the total mass) is lost between 53 ° C and 100 ° C. A further decomposition of the compound lasts up to 214 ° C, due to parallel reactions including phase transition and the loss via thermal decomposition of acetylacetonate ligands [19]. The DSC analysis was performed to measure the heat flow difference coming from the sample as the temperature increases, making possible the identification of the temperatures at which exothermic or endothermic processes occur for zinc acetylacetonate. Figure 5 shows the heat flow absorbed by the sample while increasing temperature.
Three main endothermic peaks are visible having different characteristics, indicative of their originating process. In general, broad and asymmetrical peaks, such as those at 95 ° C and 170 ° C, are associated with relatively slow processes, such as vapor production. Regarding zinc acetylacetonate hydrate, the peak at 95 ° C may, therefore, be indicative of hydration water loss. The symmetrical narrow peak at 131 ° C is associated with the melting of the anhydrous residue, confirmed by studies conducted on anhydrous zinc acetylacetonate [20]; at 170 ° C is located the peak originated by its vaporization. In literature, reheat experiments have been conducted in order to validate peaks nature. It has been shown that the peak at lower temperature was absent during the reheating process, meaning that the peak was due to an irreversible process and could be attributed to water loss. The peak at 131 ° C was also observed by reheating the sample, confirming its reversibility, thus being compatible with melting. The fusion enthalpy per mole of anhydrous zinc acetylacetonate is evaluated by the area under the 131 ° C peak, giving a value of 16.5 kJ/mol, in good agreement with the literature (17 kJ/mol). By adding the substance vaporization enthalpy value calculated from the peak area at 170 ° C (9.6 kJ/mol), the sublimation enthalpy of one mole of anhydrous zinc acetylacetonate is 26.1 kJ, in great agreement with the result from vapor pressure curve of anhydrous zinc acetylacetonate (23.5 kJ/mol). The molar sublimation enthalpy of anhydrous zinc acetylacetonate is added to the contribution of hydration water loss characteristic peak, centered at 95 ° C, in order to obtain the molar enthalpy of the hydrate compound. The calculated value is 114 kJ per mole of zinc acetylacetonate hydrate, in great agreement with the value measured from vapor pressure curve of 111 kJ/mol. The previous results allowed to tune the precursor flux from 0.3 to 1 g/h.

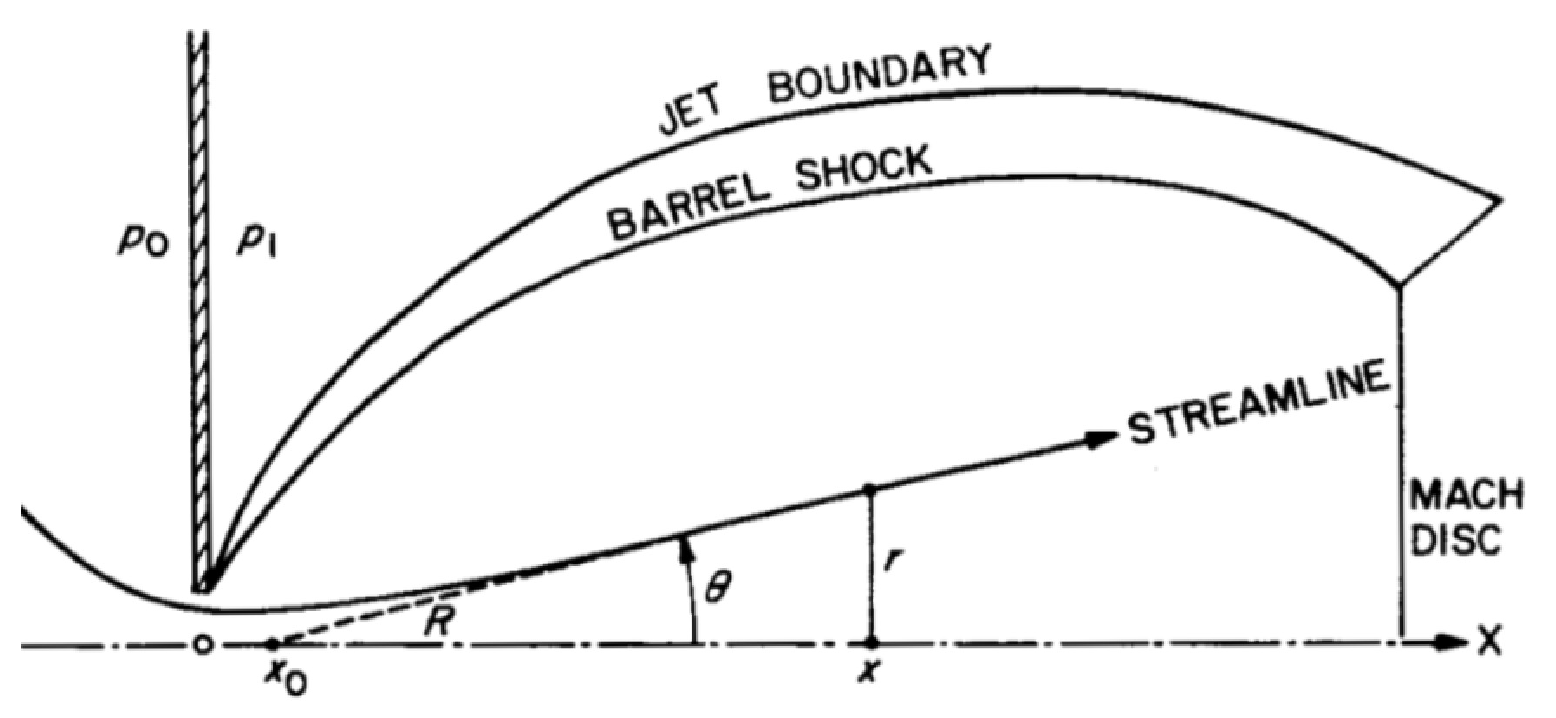
3.2. Characterization of the Plasma Reactor

The samples were deposited in different conditions in order to evaluate the films purity and thickness while changing the working parameters. Pressure in the chamber and the composition of the plasma were changed to select the best working conditions to obtain pure films and desired growth rates, by acting on the precursor injection rate. The distance of substrates from the nozzle was maintained constant at 9 mm, in order to overcome the issues of having the substrate too close to the nozzle (with the risk of perturbing the conditions of the plasma chamber) and at the same time to obtain a sufficiently high deposition rate, rarely guaranteed over great distances. At first, optical emission spectroscopy was employed to evaluate the power at which the transition between E-mode and H-mode occurs, in order to determine the range of power suitable for the deposition process. The inductively coupling is more advisable, because there is a better power transfer to plasma, with consequent higher electron density [21]. Therefore, in stable H-mode, the degree of dissociation of the precursor is higher. In Figure 6 are represented the trends of principal optical line intensities as a function of the RF power. Elements of interest are Argon (Ar) and radical oxygen (O), whose selected lines are those at 751 nm (from 3s 2 3p 5 ( 2 P 1 / 2 0 )4s to 3s 2 3p 5 ( 2 P 1 / 2 0 )4p and 763 nm (from 3s 2 3p 5 ( 2 P 3 / 2 0 )4s to 3s 2 3p 5 ( 2 P 3 / 2 0 )4p) for Argon and 777 nm (from 2s 2 2p 3 ( 4 S 0 )3s to 2s 2 2p 3 ( 4 S 0 )3p) and 615 nm (from 2s 2 2p 3 ( 2 S 0 )3p to 2s 2 2p 3 ( 2 S 0 )4d) for radical oxygen. The intensities were adjusted with the correction factor of the fiber given by the calibration. At a pressure of 8 Pa in the plasma chamber the transition occurs between 210 W and 260 W, while, at lower pressure, the H mode is obtained between 180 W and 210 W. The transition zone results thicker at higher pressure. In both cases a major increase in density of radical oxygen is observed, less evident with Argon. Analyzing the trends of the same lines augmenting the oxygen in the plasma, the transition occurs rapidly between 200 W and 210 W, while with lower oxygen quantities it takes place between 90 W and 115 W. A great increase in radical oxygen density is observed after the transition, less evident when Argon predominates.
As a consequence of this measure, the RF power of 450 W was chosen for all experiments, in a power range in which plasma is stable in H mode. During the deposition process, OES analysis was always conducted in order to evaluate precursor flux, by observing the trend of line at 481 nm, associated at CO molecule, and at 656 nm, associated at H atom, acting as indexes of precursor dissociation. In Figure 7 is shown the typical trend of O, H, and CO lines, while increasing the precursor temperature. By heating it, a major flux of sublimed precursor into the chamber is achieved, and consequently a better dissociation of it in the plasma (visible from the increasing of CO and H lines and the corresponding decrease of oxygen intensity).

3.3. Structural and Chemical Proprieties of the Deposits

Thin films are deposited on various substrates, mainly silicon and aluminium foil. In particular, the samples grown on aluminium foil are best suited for ATR-FTIR analysis, in order to prevent the dispersive effect of light in a medium, such as silicon [22]. The distance of the substrate from the nozzle was maintained constant at 9 mm.

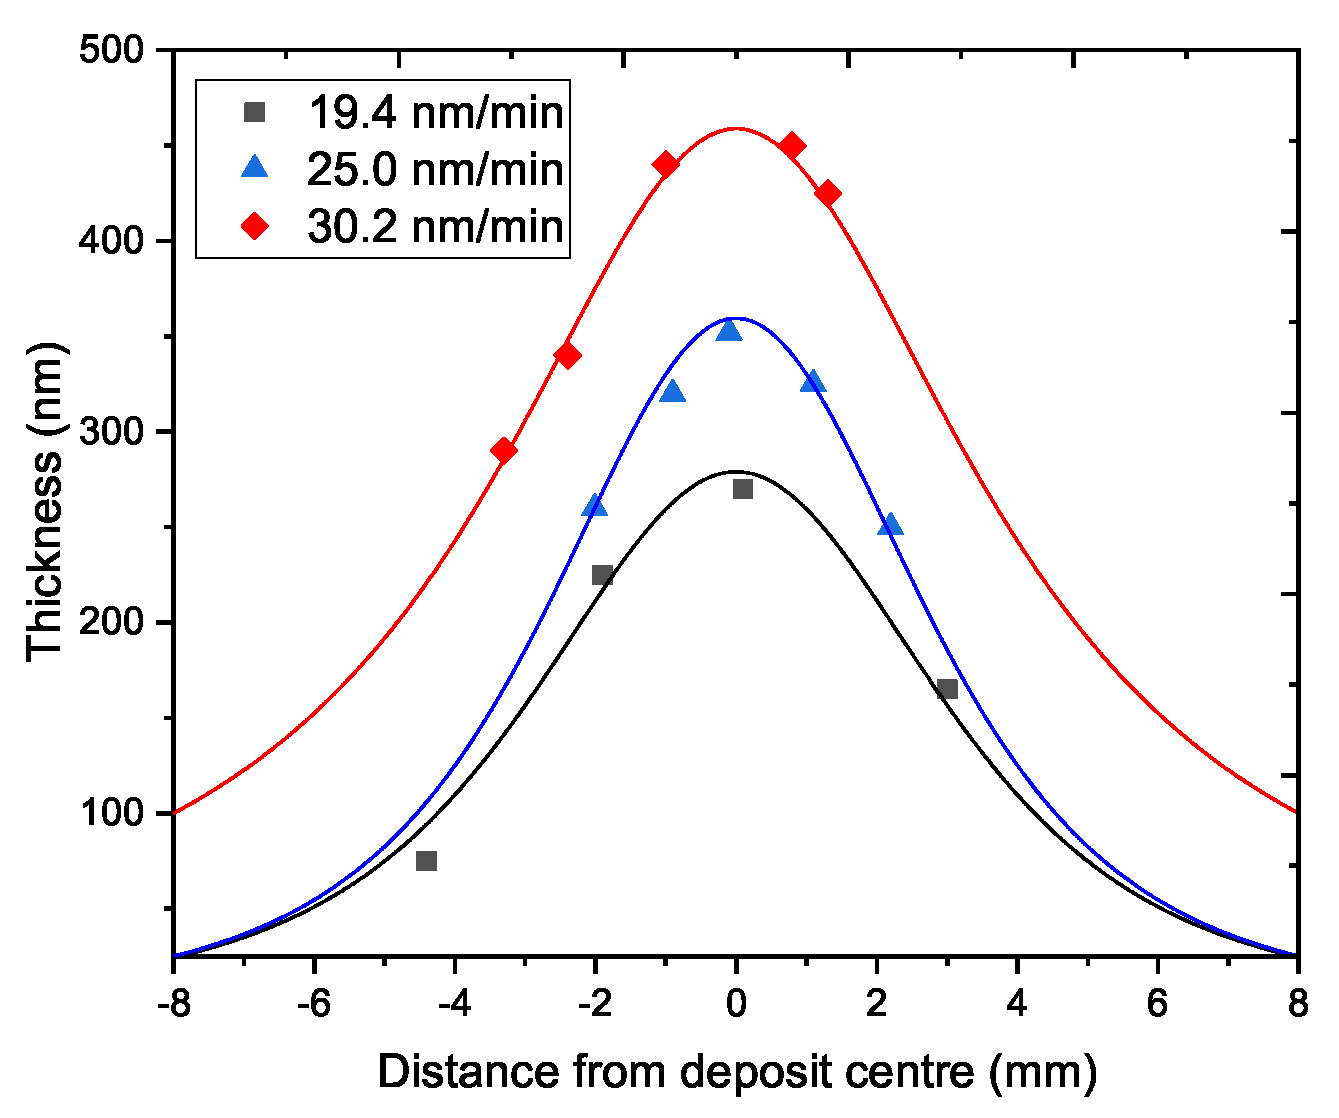
3.3.1. Profilometer Analysis

The sample thickness is measured and averaged in different positions. The deposit distribution is non uniform, a greater amount of material is deposited where the supersonic jet axis intersects the substrate. In order to estimate the profile of the samples, the profiles must be fitted with a formula that takes the angular flow properties into account [23]:
ρ ( r , x ) = ρ ( 0 , x ) cos 2 θ cos 2 ( π θ 2 ϕ )
with ρ particle density, r distance from the point where the measure is taken to the point of incidence of the flow axis, x distance between the nozzle and the substrate, ϕ constant equal to 1.5 for the considered gas mixture, and θ angle given by:
θ = arctan r x x 0
with x 0 distance between the nozzle and the point from which the flux lines would originate if it was a point source (Figure 8). The estimated values of the collected data led to calculation of the maximum thickness of the deposit.
In Figure 9, examples of typical deposit profiles with respect to growth rates are displayed. Deposition rates at 9 mm from the nozzle, with a pressure in the plasma chamber of 8 Pa and a 40% Ar and 60% O 2 plasma and a precursor deposition temperature of 100 C are of about 30 nm/min. This suggests that the growth rate can be tuned varying the precursor temperature, in order to obtain the more desired thickness. Only a slightly major precursor flux is obtained by halving the total pressure in the plasma chamber, presumably with consequences on film morphology. The most thick deposit is 475 nm high with a deposition rate of 34 nm/min. Defining the aspect ratio as the proportionality between film thickness and its width at half maximum, it can be appreciated that the aspect ratio increases while increasing the deposition rate. Thus, by augmenting the quantity of clusters deposited, the film profile becomes sharper.

3.3.2. ATR-FTIR Analysis

The vibrational modes of a pure ZnO crystal at room temperature are E 1 (LO) = 589 cm 1 , A 1 (LO) = 578.5 cm 1 , E 1 (TO) = 412 cm 1 , and A 1 (TO) = 378.5 cm 1 . However, considering that the ATR-FTIR spectrometer used in this work is able to investigate only wavenumbers higher than 650 cm 1 , a direct measure of ZnO peaks was not possible, thus only the presence of impurities-bounded zinc could be detected. Therefore, the ATR-FTIR analysis was conducted in order to assess the purity of the films and identify the presence of any carbonaceous groups, residues of an incomplete oxidation of the precursor.
Figure 10 displays the ATR-FTIR spectra collected on samples deposited starting from different plasma mixture at the same total treatment pressure. The broad peak at 3200 cm 1 is due to the stretching of the OH bond, the last one indicative of water presence in the mixture. The stronger the hydrogen bonds between the molecules, the more this band will be shifted to lower wavenumbers, since these bonds tend to weaken the OH bond, facilitating its stretching [24]. A peak in the lower range at 1524–1691 cm 1 is due to OH bending. Several components are related to carbonaceous functional groups. At 2339 cm 1 , a peak that is assigned to CO 2 suggests that carbon dioxide molecules are formed by reactions involving the organic precursor oxidation and adsorbed on the film surface [25]. Vibrational modes related to the zinc carbonate functional groups generate absorption peaks at 1077 cm 1 and 831 cm 1 due to the CO 3 stretching and a peak centred at 712 cm 1 due to the CO 3 bending [26]. When comparing the spectra, one can surmise that oxygen is fundamental to assure an efficient precursor fragmentation, indeed the higher Ar pressure is the more -CH x groups are retained in films [27]. Moreover, at low oxygen concentration, CO absorption bands are not present. Therefore augmenting the quantity of oxygen in the plasma, a better purity is achieved, and it is almost total when oxygen constitutes the 75% of the plasma. Finally, it could be observed a strong broad band absorption in the spectrum of the most pure sample. This is in good agreement with a hypothesis of polycrystalline films, in which the light absorption is dominated by electron-scattering mechanisms that are linked to grain boundaries in the materials and directly proportional to a power of the incident light wavelength.

3.3.3. The Annealing Process

Annealing alters the physical and chemical properties of a material. Atoms diffuse within the solid material thanks to the thermal energy, so that the material progresses towards its equilibrium state. Simultaneously, the volatile impurities are removed. The annealing process has been conducted in an oven at atmospheric pressure by heating samples for an hour at 500 ° C for films deposited on silicon, at 280 ° C for films deposited on aluminium foil. The lower temperature was used in order to prevent any damage to the aluminum foil and because the temperature was sufficient for an effective removal of impurities. ATR-FTIR analyses confirm the removal of a large part of impurities after the annealing treatments.

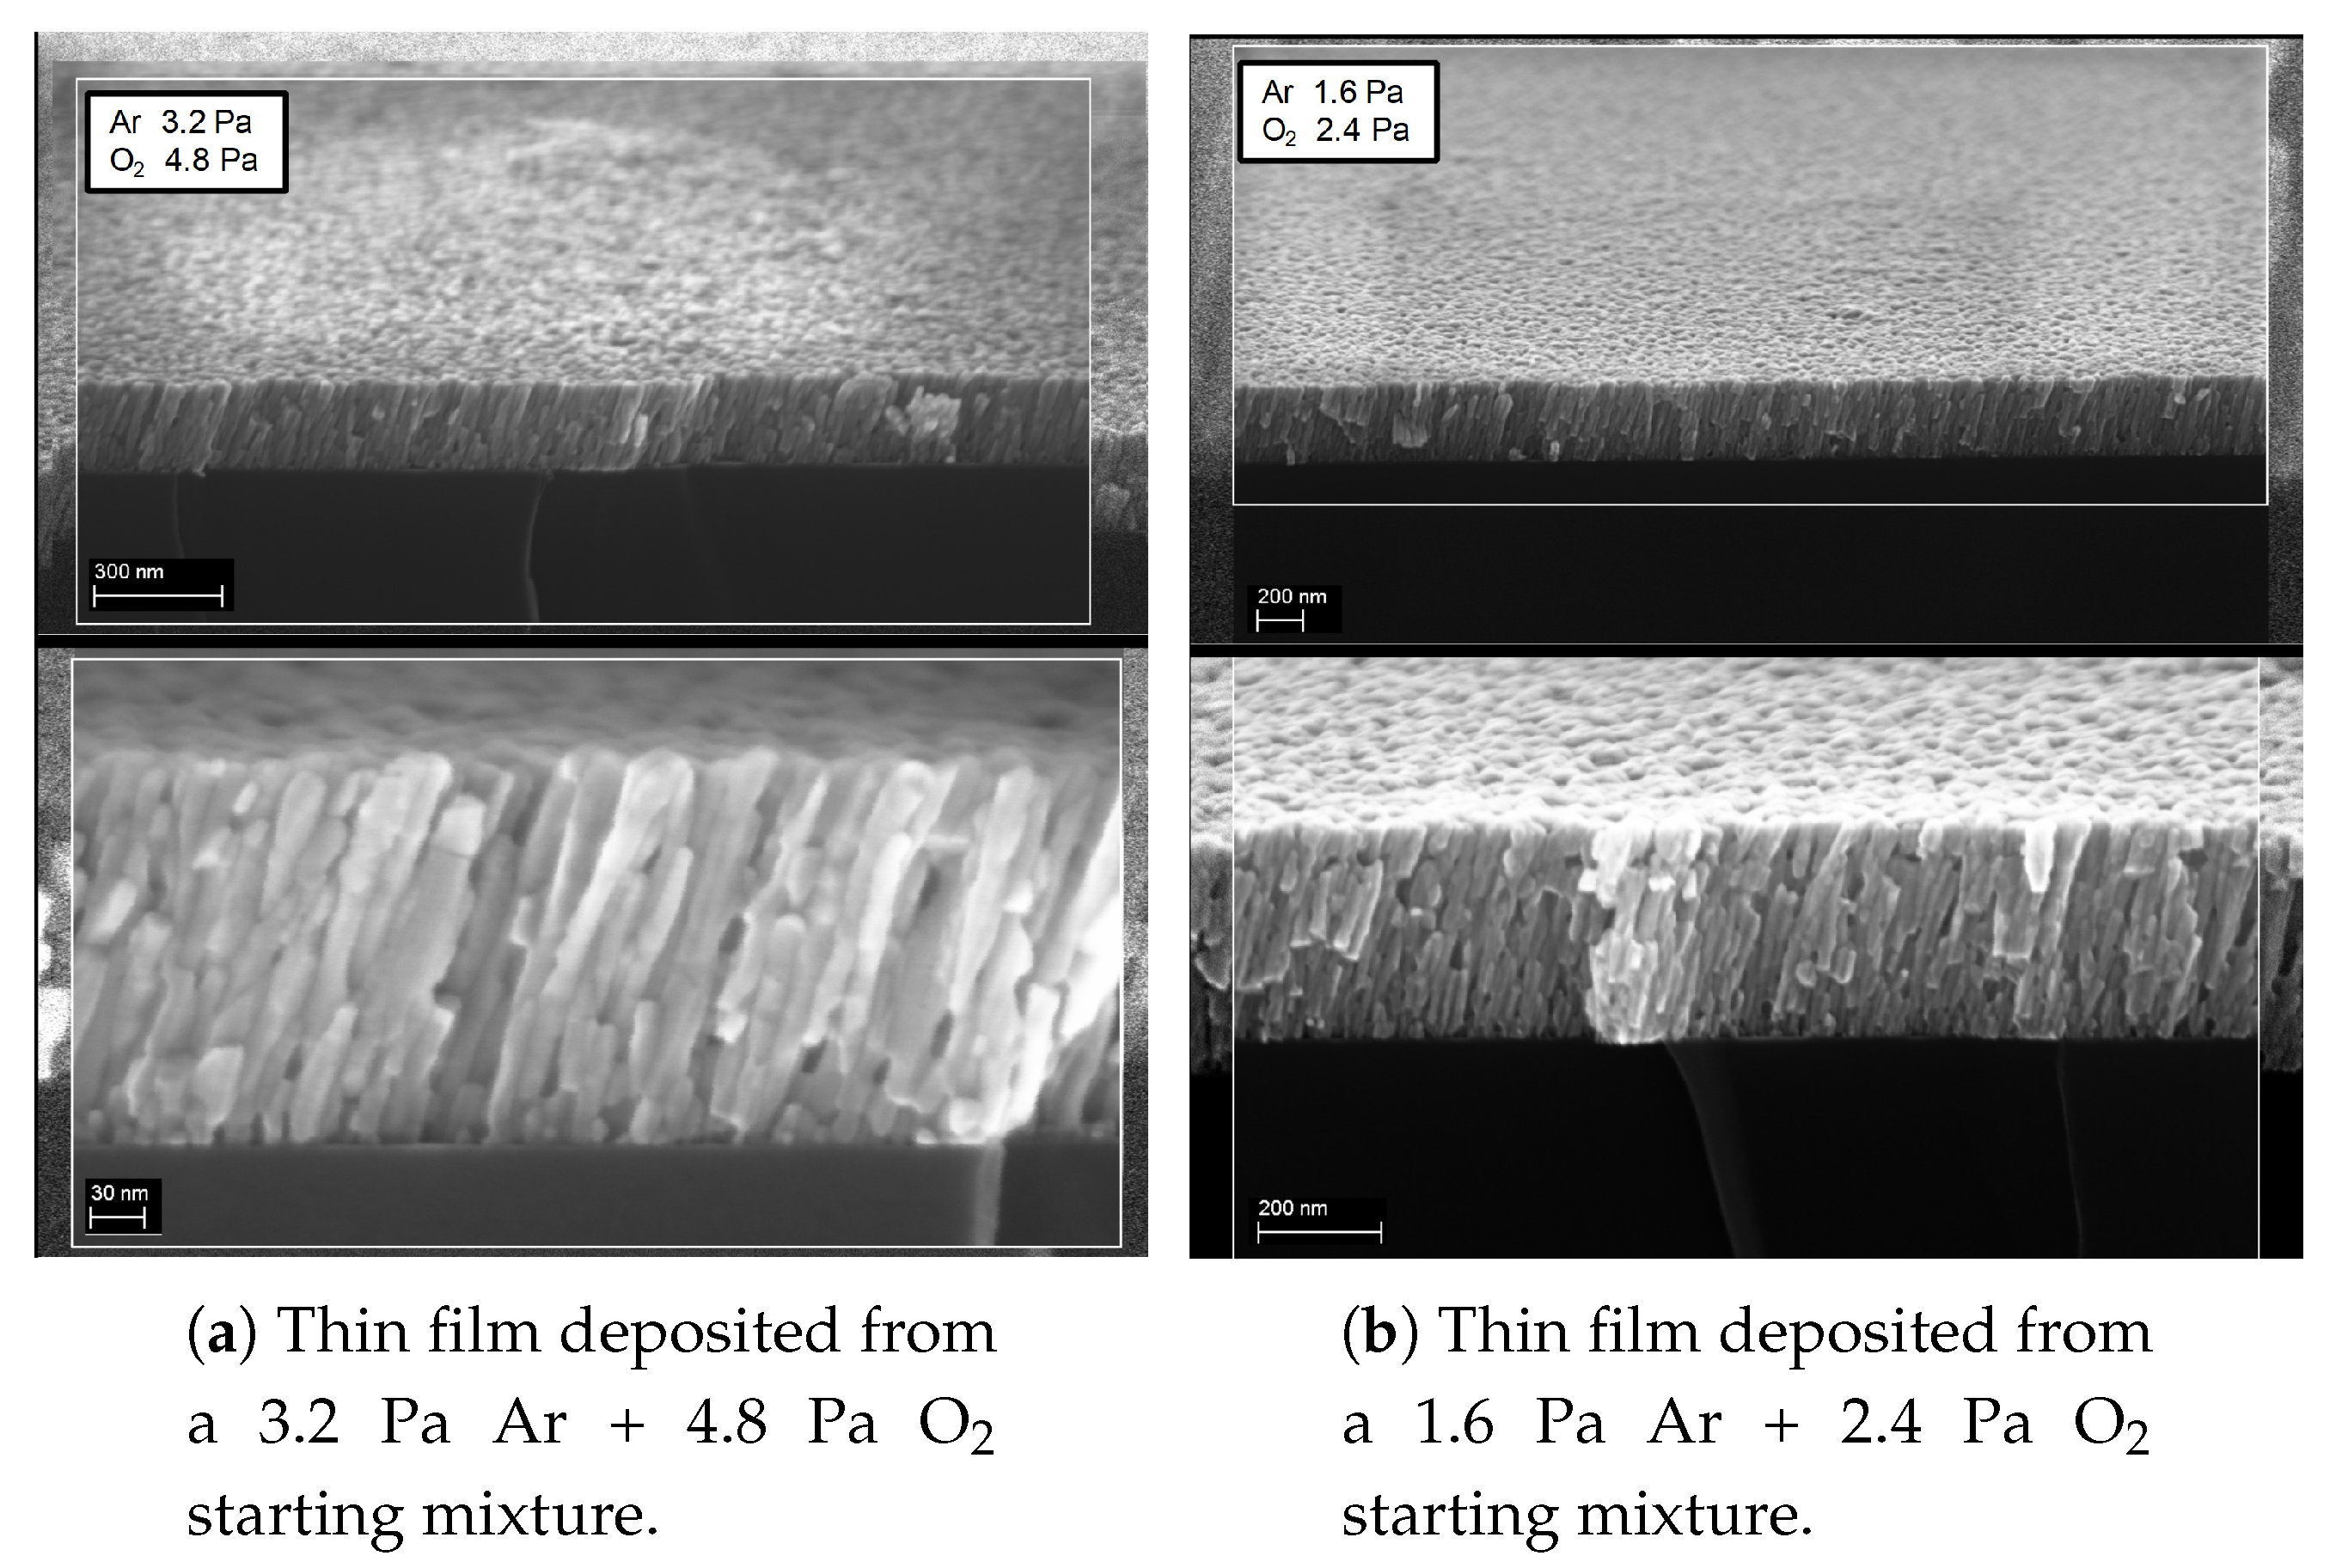
3.3.4. Structural and Morphological of the Annealed Films

For zinc oxide, the zone-centre optical phonons can be classified according to the following irreducible representation: Γ o p t = A 1 + E 1 + 2E 2 + 2B 1 . In this non-centrosymmetric material, IR and Raman activities are not mutually exclusive properties. The polar modes A 1 and E 1 are IR as well as Raman active. Furthermore, Raman activity applies for the non-polar modes E 1 , E 2 high , E 2 low . The B 1 modes are neither Raman nor IR active. As derived from the Raman tensors, all of the Raman active modes can be observed in backscattering geometry, except for the E 1 (LO) mode. Table 2 shows the frequency and the symmetry of the fundamental optical modes in wurtzite ZnO [28,29]. Figure 11 shows the Raman spectrum of an annealed thin film in a Ar 1.6 Pa + O 2 2.4 Pa mixture. The measured absorption is in excellent agreement with peaks enlisted in Table 2. Therefore, the nature of the deposited films can be reasonably attributed to zinc oxide in its wurtzite structure.
AFM and SEM analyses are performed to investigate the film surface morphology. Figure 12 shows the results of an AFM analysis performed on a thin film deposited at P p = 8 Pa. The morphological structure of the film is displayed in a planar and 3D view, grains are visible on sample surface. The surface roughness is calculated as the root mean square of the height distribution [30] and reported in Table 3. The maximum height is 22 nm over the surface.
Figure 13 shows SEM images performed on annealed samples. The samples are deposited in two different total treatment pressure in the plasma chamber (the first P p = 8 Pa, the second P p = 4 Pa) keeping fixed the Ar/O 2 ratio in the mixture. In both cases, films show a uniform distribution of columnar structures with impervious grain boundaries. The obliqueness of the structures is due to shadowing effect related to the geometry of the supersonic jet. Columnar structures are well defined, since their first deposition steps and increase their dimensions as the film grows. Structures are larger for sample deposited with a lower pressure in the plasma chamber. This is in agreement with the major precursor flux at lower pressures behaviour, as previously discussed. For films deposited at 8 Pa, the columns show a diameter that ranges from about 15 nm to 25 nm while growing in height. For samples at lower pressure, the diameters range from about 18 nm to 40 nm. The polycrystalline columns and the porosity of the films could be of great interest in application such as sensor systems, for the large surface area to volume ratio, and solar cells, since a favourite current flow direction enhances power conversion efficiency [31].

4. Summary and Conclusions

In this paper, an innovative deposition technique for the controlled deposition of zinc oxide nanostructured thin films was presented. The novelty of the proposed approach is the segmentation of the growth process in two separate steps: the precursor dissociation and metal oxide particles formation in a reactive cold plasma environment; the film nucleation and assembling controlled by means of a supersonic seeded jet impinging on a substrate. Zinc acetylacetonate was chosen as a metalorganic zinc precursor, despite its wide use very poor literature found on its proprieties. A thermodynamic experimental characterization of Zn(acac) 2 was first performed and the best oxygen concentration to efficiently produce ZnO was estimated. Having knowledge of vapor pressure curves, it was possible to relate the heating temperature to the pressure of the precursor, thus permitting the precursor injection with a controllable flux.
OES revealed the transition between the capacitively coupled mode (E mode) and the inductively coupled mode (H mode), the latter suitable for depositions, being characterized by a major quantity of electrons and reactive species. OES results indicate that the optimal total pressure in the first chamber is in the 4–8 Pa range and the pressure in the second chamber between 0.1–0.4 Pa, in order to obtain a supersonic expansion length large enough to allow depositions at distances of 3–25 mm from the nozzle, along the jet axis. Because of the nature of the expansion, a decrease in the deposition rate was expected by moving away from the nozzle. Therefore, the distance of the substrate from the nozzle was set at 9 mm. The total pressure and gas composition variation influences film morphology and chemical structure. The films characteristics were evaluated by means of contact profilometry, ATR-FTIR spectroscopy, Raman spectroscopy, AFM and SEM. The thickness of films were less than 500 nm and the maximun growth rate was 34 nm/min. It was demonstrated that an increase in aspect ratio is observed increasing the deposition rate. ATR-FTIR was employed in order to obtain information about the film purity. Many CH x and CO x impurities were observed in several samples, a complete combustion occurs only at high oxygen quantities. ATR-FTIR spectra after the thermal treatment showed the excellent removal of any impurity. The Raman spectroscopy confirmed that the zinc oxide is coordinated in a wurtzite structure, the most common and stable form for applications. The wurtzite structure is non-centrosymmetric, so crystals have piezoelectricity properties. This is a basic prerequisite for applications, such as Surface Acoustic Wave (SAW) devices and actuators. AFM measurements revealed the presence of grains with radii of the order of tens nanometers on the film surface, having roughness of the order of nanometers. Thin films morphology is organized in loose packed columns, as assessed by the SEM micrographs, with largest structures obtained at lower pressures in the plasma chamber. Because of these regular and columnar structures, deposited films are promising for a future study on their applicability as sensors, both gas sensors and biosensors, photocatalysts for contaminants degradation, purification and solar cells. Further investigations will be directed to the conductivity, gas sensitivity and selectivity, piezoresponse, and transparency of the nanostructured ZnO thin films.

Author Contributions

Conceptualization, C.C. and C.R.; methodology, E.D.; validation, C.C., C.R. and E.D.; formal analysis, C.C., C.R. and V.M.; investigation, C.C., C.R. and V.M.; resources, C.R.; data curation, E.D.; writing—original draft preparation, C.C.; writing—review and editing, C.C. and C.R.; visualization, E.D.; supervision, C.C. and C.R.; project administration, C.R.; funding acquisition, C.R. All authors have read and agreed to the published version of the manuscript.

Funding

This research was partially funded by CARIPLO Fundation (“Produzione di film sottili e nanostrutture gerarchiche di ossidi, semiconduttori e metalli mediante un plasma supersonico reattivo” Project, 2010–2013, No. 2010.0623).

Acknowledgments

We gratefully acknowledge the technical support of Alessandro Mietner in the device development and experiment execution.

Conflicts of Interest

The authors declare no conflict of interest.

References

  1. Zanini, S.; Grimoldi, E.; Riccardi, C. Development of controlled releasing surfaces by plasma deposited multilayers. Mater. Chem. Phys. 2013, 138, 850–855. [Google Scholar] [CrossRef]
  2. Zanini, S.; Polissi, A.; Maccagni, E.A.; Dell’Orto, E.C.; Liberatore, C.; Riccardi, C. Development of antibacterial quaternary ammonium silane coatings on polyurethane catheters. J. Colloid Interface Sci. 2015, 451, 78–84. [Google Scholar] [CrossRef] [PubMed]
  3. Guozhong, C. Nanostructures and Nanomaterials: Synthesis, Properties and Applications; World Scientific: Singapore, 2004. [Google Scholar]
  4. Klingshirn, C.F.; Waag, A.; Hoffmann, A.; Geurts, J. Zinc Oxide: From Fundamental Properties towards Novel Applications; Springer Science & Business Media: Berlin, Germany, 2010; Volume 120. [Google Scholar]
  5. Özgür, Ü.; Alivov, Y.I.; Liu, C.; Teke, A.; Reshchikov, M.A.; Doğan, S.; Avrutin, V.; Cho, S.J.; Morkoç, H. A comprehensive review of ZnO materials and devices. J. Appl. Phys. 2005, 98, 041301. [Google Scholar] [CrossRef] [Green Version]
  6. Lu, H.; Wang, S.; Zhao, L.; Li, J.; Dong, B.; Xu, Z. Hierarchical ZnO microarchitectures assembled by ultrathin nanosheets: Hydrothermal synthesis and enhanced photocatalytic activity. J. Mater. Chem. 2011, 21, 4228–4234. [Google Scholar] [CrossRef]
  7. Zhang, H.; Sun, J.; Dagle, V.L.; Halevi, B.; Datye, A.K.; Wang, Y. Influence of ZnO facets on Pd/ZnO catalysts for methanol steam reforming. ACS Catal. 2014, 4, 2379–2386. [Google Scholar] [CrossRef]
  8. Gao, G.; Yu, L.; Vinu, A.; Shapter, J.G.; Batmunkh, M.; Shearer, C.J.; Yin, T.; Huang, P.; Cui, D. Synthesis of ultra-long hierarchical ZnO whiskers in a hydrothermal system for dye-sensitised solar cells. RSC Adv. 2016, 6, 109406–109413. [Google Scholar] [CrossRef]
  9. Ramadan, R.; Torres-Costa, V.; Martín-Palma, R.J. Fabrication of Zinc Oxide and Nanostructured Porous Silicon Composite Micropatterns on Silicon. Coatings 2020, 10, 529. [Google Scholar] [CrossRef]
  10. Dell’Orto, E.; Caldirola, S.; Sassella, A.; Morandi, V.; Riccardi, C. Growth and properties of nanostructured titanium dioxide deposited by supersonic plasma jet deposition. Appl. Surf. Sci. 2017, 425, 407–415. [Google Scholar] [CrossRef]
  11. Caldirola, S.; Roman, H.; Riccardi, C. Ion dynamics in a supersonic jet: Experiments and simulations. Phys. Rev. E 2016, 93, 033202. [Google Scholar] [CrossRef]
  12. Biganzoli, I.; Fumagalli, F.; Di Fonzo, F.; Barni, R.; Riccardi, C. A supersonic plasma jet source for controlled and efficient thin film deposition. J. Mod. Phys. 2012, 3, 1626. [Google Scholar] [CrossRef] [Green Version]
  13. Friedrich, J. The Plasma Chemistry of Polymer Surfaces: Advanced Techniques for Surface Design; John Wiley & Sons: Hoboken, NJ, USA, 2012. [Google Scholar]
  14. Baxter, J.B.; Aydil, E.S. Metallorganic chemical vapor deposition of ZnO nanowires from zinc acetylacetonate and oxygen. J. Electrochem. Soc. 2008, 156, H52. [Google Scholar] [CrossRef]
  15. Vovna, V.; Korochentsev, V.; Dotsenko, A. Electronic structures and photoelectron spectra of zinc (II) bis-β-diketonates. Russ. J. Coord. Chem. 2012, 38, 36–43. [Google Scholar] [CrossRef]
  16. Wolden, C.A. The role of oxygen dissociation in plasma enhanced chemical vapor deposition of zinc oxide from oxygen and diethyl zinc. Plasma Chem. Plasma Process. 2005, 25, 169–192. [Google Scholar] [CrossRef]
  17. Macknick, A.; Prausnitz, J. Vapor pressures of heavy liquid hydrocarbons by a group-contribution method. Ind. Eng. Chem. Fundam. 1979, 18, 348–351. [Google Scholar] [CrossRef]
  18. Lucchesi, C.A.; Lewis, W. Latent heat of sublimation of terephthalic acid from differential thermal analysis data. J. Chem. Eng. Data 1968, 13, 389–391. [Google Scholar] [CrossRef]
  19. Musić, S.; Šarić, A.; Popović, S. Formation of nanosize ZnO particles by thermal decomposition of zinc acetylacetonate monohydrate. Ceram. Int. 2010, 36, 1117–1123. [Google Scholar] [CrossRef]
  20. Coates, P.D. A Study of the Preparation and Pyrolysis of β-diketonate and Carboxylate Precursors to Semiconducting Zinc Oxide Films. Ph.D. Thesis, Durham University, Durham, UK, 1994. [Google Scholar]
  21. Barni, R.; Zanini, S.; Riccardi, C. Diagnostics of reactive RF plasmas. Vacuum 2007, 82, 217–219. [Google Scholar] [CrossRef]
  22. Zanini, S.; Riccardi, C.; Orlandi, M.; Grimoldi, E. Characterisation of SiOxCyHz thin films deposited by low-temperature PECVD. Vacuum 2007, 82, 290–293. [Google Scholar] [CrossRef]
  23. Ashkenas, H.; Sherman, F.S. Structure and Utilization of Supersonic Free Jets in Low Density Wind Tunnels; NTRS—NASA Technical Reports Server: Washington, DC, USA, 1965.
  24. Zanini, S.; Massini, P.; Mietta, M.; Grimoldi, E.; Riccardi, C. Plasma treatments of PET meshes for fuel–water separation applications. J. Colloid Interface Sci. 2008, 322, 566–571. [Google Scholar] [CrossRef]
  25. Hlaing Oo, W.; McCluskey, M.; Lalonde, A.; Norton, M. Infrared spectroscopy of ZnO nanoparticles containing CO2 impurities. Appl. Phys. Lett. 2005, 86, 073111. [Google Scholar] [CrossRef] [Green Version]
  26. Pholnak, C.; Sirisathitkul, C.; Suwanboon, S.; Harding, D.J. Effects of precursor concentration and reaction time on sonochemically synthesized ZnO nanoparticles. Mater. Res. 2014, 17, 405–411. [Google Scholar] [CrossRef]
  27. Zanini, S.; Ziano, R.; Riccardi, C. Stable Poly (Acrylic Acid) films from acrylic acid/argon plasmas: Influence of the mixture composition and the reactor geometry on the thin films chemical structures. Plasma Chem. Plasma Process. 2009, 29, 535. [Google Scholar] [CrossRef]
  28. Damen, T.C.; Porto, S.; Tell, B. Raman effect in zinc oxide. Phys. Rev. 1966, 142, 570. [Google Scholar] [CrossRef]
  29. Cuscó, R.; Alarcón-Lladó, E.; Ibanez, J.; Artús, L.; Jiménez, J.; Wang, B.; Callahan, M.J. Temperature dependence of Raman scattering in ZnO. Phys. Rev. B 2007, 75, 165202. [Google Scholar] [CrossRef]
  30. Grimoldi, E.; Zanini, S.; Siliprandi, R.; Riccardi, C. AFM and contact angle investigation of growth and structure of pp-HMDSO thin films. Eur. Phys. J. D 2009, 54, 165–172. [Google Scholar] [CrossRef]
  31. Trifiletti, V.; Ruffo, R.; Turrini, C.; Tassetti, D.; Brescia, R.; Di Fonzo, F.; Riccardi, C.; Abbotto, A. Dye-sensitized solar cells containing plasma jet deposited hierarchically nanostructured TiO2 thin photoanodes. J. Mater. Chem. A 2013, 1, 11665–11673. [Google Scholar] [CrossRef]
Figure 1. Schematic representation of the Plasma Assisted Supersonic Jet Deposition (PA-SJD) setup. The plasma chamber and the deposition chamber are connected by the converging nozzle.
Coatings 10 00788 g001
Figure 2. Fit of hydrate zinc acetylacetonate vapor pressure curves.
Coatings 10 00788 g002
Figure 3. Fit of anhydrous zinc acetylacetonate vapor pressure curves.
Coatings 10 00788 g003
Figure 4. Zinc acetylacetonate TGA in nitrogen atmosphere at atmospheric pressure. Heating rate: 5 ° C/min.
Coatings 10 00788 g004
Figure 5. Zinc acetylacetonate DSC in nitrogen atmosphere at atmospheric pressure. Heating rate: 5 ° C/min.
Coatings 10 00788 g005
Figure 6. E–H mode transition at 8 Pa, with plasma composition of 40% Ar and 60% O 2 .
Coatings 10 00788 g006
Figure 7. Carbon monoxide, hydrogen and oxygen peaks relative intensity versus precursor temperature.
Coatings 10 00788 g007
Figure 8. Geometrical parameters of a supersonic jet [23].
Coatings 10 00788 g008
Figure 9. Data and fit of deposits distribution centered at the jet axis as a function of the growth rate.
Coatings 10 00788 g009
Figure 10. ATR-FTIR analysis of samples deposited (in red) with different plasma compositions at 4 Pa total treatment pressure with respect to the precursor spectrum (in green).
Coatings 10 00788 g010
Figure 11. Raman spectrum of the thickest film deposited, to overwhelm the silicon substrate noise.
Coatings 10 00788 g011
Figure 12. Example of Atomic Force Microscopy (AFM) results of a deposited film.
Coatings 10 00788 g012
Figure 13. SEM micrographs of the columnar structures in two samples different in the starting plasma pressure of 8 Pa in panel (a) and 4 Pa in panel (b).
Coatings 10 00788 g013
Table 1. Summary of the bond energies between carbon, oxygen, hydrogen, and zinc in zinc acetylacetonate hydrate [15].
Bond Energies
BondC-CC-OC-HZn-OO-HC=CC=O
eV3.5763.74.262.8614.7686.2398.271
Table 2. Frequency and simmetry of the fundamental optical modes in wurtzite ZnO.
Wavenumber (cm 1 )Simmetry
101E 2 low
2082TA, E 2 low
332E 2 high , E 2 low
308A 1 (TO)
408E 1 (TO)
437E 2 high
574A 1 (LO)
584E 1 (LO)
Table 3. Surface roughness (RMS) and grains size calculated from the AFM analysis.
Pressure Ar/O 2 (Pa)RMS (nm)Grain Size (nm)
3.2/4.84.1 ± 0.430–40
1.6/2.44.5 ± 0.430–40
1/36.2 ± 0.530–40

