Article

A One-Step Method for Fabrication of Wear-Resistant Amphiphobic Microdimple Arrays Using Under-Liquid Laser Machining

1
National Key Laboratory of Science and Technology on Helicopter Transmission, Nanjing University of Aeronautics & Astronautics, Nanjing 210016, China
2
Institute of Electronic Engineering, Chinese Academy of Engineering Physics, Mianyang 621999, China
3
Key Laboratory of Special Purpose Equipment and Advanced Processing Technology, Ministry of Education & Zhejiang Province, Zhejiang University of Technology, Hangzhou 310014, China
*
Authors to whom correspondence should be addressed.
These authors contributed equally to this work.
Coatings 2020, 10(6), 559; https://doi.org/10.3390/coatings10060559
Submission received: 22 May 2020 / Revised: 8 June 2020 / Accepted: 10 June 2020 / Published: 11 June 2020

Abstract

:
A one-step method using under-liquid laser machining (ULLM) is proposed for fabrication of microdimples on a cemented carbide surface with a wear-resistant amphiphobic property. The influence of laser processing parameters on the depth, width, and surface roughness (Ra) of the microstructures were investigated through single-factor experiments. On the basis of single-factor experiments, multiobjective optimization was carried out so that a desired surface morphology can be achieved. The model describing the relationships between laser processing parameters and corresponding responses was developed based on response surface methodology (RSM), and the adequacy of the model was assessed by analysis of variance (ANOVA) and verified experimentally. Subsequently, the desired microstructure arrays were then fabricated with the optimal processing parameters. Finally, the wear-resistant behaviors were comparatively studied for two kinds of amphiphobic surfaces by rubbing multiple times using 1000 grit metallographic sandpaper. The textured surface fabricated using the ULLM method exhibits excellent mechanical rubbing resistance as it maintains its amphiphobic character even after rubbing 300 m under the pressure of 2.4 MPa. This facile and low-cost method can be not only easily extended to other materials but also applied to fabricate amphiphobic surfaces with wear-resistance and self-healing properties.

1. Introduction

Functional surfaces intentionally designed to be textured or with preferential wettabilities have attracted the attention of the researchers due to their practical applications, including tribological interfaces [1,2], liquid patterning [3,4], droplet manipulation [5,6], and bionic manufacturing [7,8]. On one hand, this kind of technology for fabricating surface texture is effective in terms of the friction reduction and wear resistance, which are achieved by storing lubricant and wear particles during the rubbing process [9]. Over the past few years, surface textures have exhibited excellent performance in the field of tribological interfaces such as piston rings [10], cutting tools [11], and bearings [12]. Among all the fabrication methods for surface textures, the laser machining technique seems to be the most advanced method for tribological applications [13].
On the other hand, surface wettability significantly affects the tribological condition between the friction pairs in the case of lubricant [14]. Inspired by the superhydrophobic property of the lotus leaf in nature [15], a considerable amount of researchers studied surfaces with low wettabilities due to their practical applications in the areas of self-cleaning [16,17,18], microfluid transport [19,20], and friction and wear reduction [21,22]. Overall, surfaces with low wettabilities are achieved by two methods: one is to fabricate the micro/nanostructures onto the amphiphobic surface [23], while the other is to fabricate rough surfaces on the lyophilic surface and subsequently decrease surface energy [24]. Specifically, recent studies have shown that certain techniques such as laser machining [25,26], the sol–gel process [27,28], chemical etching [29], 3D printing [30,31], and spin coating [32,33] are commonly used to fabricate amphiphobic surfaces. In spite of this diversity of fabrication methods, there are still many limitations that need to be overcome, such as template assistance, complex fabrication operations, and specific equipment. Most importantly, few of the surfaces fabricated using the aforementioned methods have been applied practically due to the poor mechanical strength and durability. In particular, the poor mechanical strength severely limits the application of amphiphobic surfaces in the field of tribological interfaces, especially under the conditions of high pressure and long friction length [34], e.g., bearings [35] and cylinders [36]. Hence, it is essential to fabricate a wear-resistant amphiphobic surface. Interestingly, the amphiphobic surfaces fabricated using a laser showed a higher critical load value, thus possibly prolonging the service life of the substrate [37]. In addition, among all the various fabrication methods, laser machining is the most prominent, due to its convenient operation, high efficiency and environmental friendliness. At the same time, the surface morphology of a laser-irritated surface can be theoretically and mathematically predicted [38], and the quantitative evaluation of the roughness parameters can also be obtained from developed mathematical model [39]. As a consequence, laser machining may be an effective technique for overcoming the potential barriers of amphiphobic surfaces and allowing their tribological applications.
The lubricant condition is strongly affected by the wettability of the friction pair surface. However, from the above analysis, it can be seen that most of the studies focused on the surface textures but ignored the advantages of the amphiphobic property of the surface when utilizing the surface textures to improve the tribological performance [11,12,13]. Thus, it is valuable and necessary to combine the textures and wear-resistant amphiphobic properties through laser machining for application in the area of tribology.
In this paper, a reliable and highly efficient method for fabrication of a wear-resistant amphiphobic surface with microdimple arrays on cemented carbide is proposed. This method is realized in one step using laser machining. The traditional two-step fabrication method first requires microstructures to be fabricated on the substrate and then requires a subsequent immersion in a fluorinated solution to decrease the surface energy [34], while this new technique is achieved by laser machining under a fluorinated solution. The hydrophobicity of the surfaces fabricated using the new technique can be well maintained with a water contact angle (WCA) of 97.9° ± 0.6° even after rubbing for 300 m under the pressure of 2.4 MPa. This one-step fabricating method for a microstructured amphiphobic surface shows promise for industrial applications in the field of tribological interfaces.

2. Materials and Methods

2.1. Materials and Reagents

Cemented carbide (YT15-4160511, WC 19%, TiC 15%, and Co 6%) with dimensions of 1.6 × 1.6 × 0.4 cm3 was selected as the specimen material in this study. The fluorinated solution, which was used to decrease the surface energy, was composed of (heptadecafluoro-1,1,2,2-tetradecyl) trimethoxysilane (SICONG, Longyan, Fujian, China) and fluorocarbon solvent (SICONG).

2.2. Methods

2.2.1. Experimental Setup

The laser used in this study was an ytterbium-doped fiber-laser (YLP-F20, SANKE, Shanghai, China) with a maximum power of 20 W, a wavelength of 1064 nm, a pulse duration of 100 ns, and a maximum repetition rate of 200 kHz. A schematic diagram of the under-liquid laser machining (ULLM) processing platform is shown in Figure 1a. The microsyringes and D series driver are pivotal parts for controlling the height so that the distances between the top surface of the sample and the fluorinated solution level is exactly 2 mm (further details can be found in ref. [37], a previous publication by the present authors).
Figure 1b shows a schematic representation of the laser machining process. The morphology of the sample surface was obtained by scanning electron microcopy (SEM, S4800, Hitachi High-Technologies Co., Hitachi, Japan), while the element composition was analyzed by an energy dispersive X-ray spectrometer (EDS, Bruker, London, UK) in conjunction with the SEM. The EDS analysis mode was set as automatic. Peak level correction was carried out before experiments to ensure perfect peak level fitting. After the peak position was obtained, automatic peak identification was carried out by the software.
Meanwhile, the depth, width, surface roughness (Ra) were measured using an Olympus confocal microscope (Olympus, Tokyo, Japan). The static contact angles were measured by a contact-angle goniometer (JC2000DM, Beijing Zhongyi Kexin Technology Co., LTD., Beijing, China) using the sessile drop method.

2.2.2. Experimental Design

In this study, single-factor tests were performed to investigate the influence of single laser machining parameters on the surface morphology; meanwhile, single-factor tests were also used to find the central level for the central composite design method (CCD) in the multiobjective optimization.
During the single-factor tests, the laser power used was in the range of 10–20 W, the laser scanning speed was in the range of 2–20 mm/s, and the number of passes was in the range of 100–500. The zones on the sample surface where the Ra values were measured were chosen by randomly selecting at least 15 continuous microdimples both in perpendicular and parallel directions, and 5 different zones were chosen in total. All the measuring lines were set to connect the center of the 15 dimples. The schematic illustration can be found in supplementary materials. The average value of Ra in the 5 zones was used as the final Ra value.
In order to find the proper laser parameters to obtain the desired depth of microdimples with lower Ra, RSM-based mathematical models describing the responses to the factors were obtained and optimized using the Design-Expert 10.0 software. In these models, the factors are the laser processing parameters (i.e., power, number of passes, scanning speed) and the responses are the geometric parameters of the surface (i.e., the depth and width of the microdimples and the Ra).
The establishment of the mathematical models can be divided into the following steps. First, based on the results of the single-factor experiments, the CCD method considering the surface response was performed to obtain the different levels of the factors. Subsequently, the experimental design and data analysis were completed by using the Design Expert 10.0 software. After fabrication using the ULLM method under the parameters in the 20 groups of experiments designed by the software, the observed geometric parameters of the samples were inputted into the software. The software then outputted the mathematical models. Finally, the accuracy of the mathematical models was experimentally verified using the analysis of variance (ANOVA) method and experiments. The whole experimental process diagram can be found in Figure 2.

2.3. Wear-Resistance Tests

The rubbing test was adapted in order to test the wear resistance of the amphiphobic property of the sample fabricated using the ULLM method (ULLM sample); meanwhile, the sample fabricated by using a laser in the air and then treated by fluorinated solution (LMF sample) is also included in the rubbing tests and is considered as a contrast. Note that the two sample types were fabricated using the same optimal parameters obtained from the aforementioned mathematical models. Figure 3 shows the schematic representation of the rubbing test. During the rubbing test, the pressure between the contact surface was held constant at 2.4 MPa and the sliding length in one direction was set at 0.5 m.

3. Results and Discussion

3.1. Single-Factor Tests for the Laser Parameters

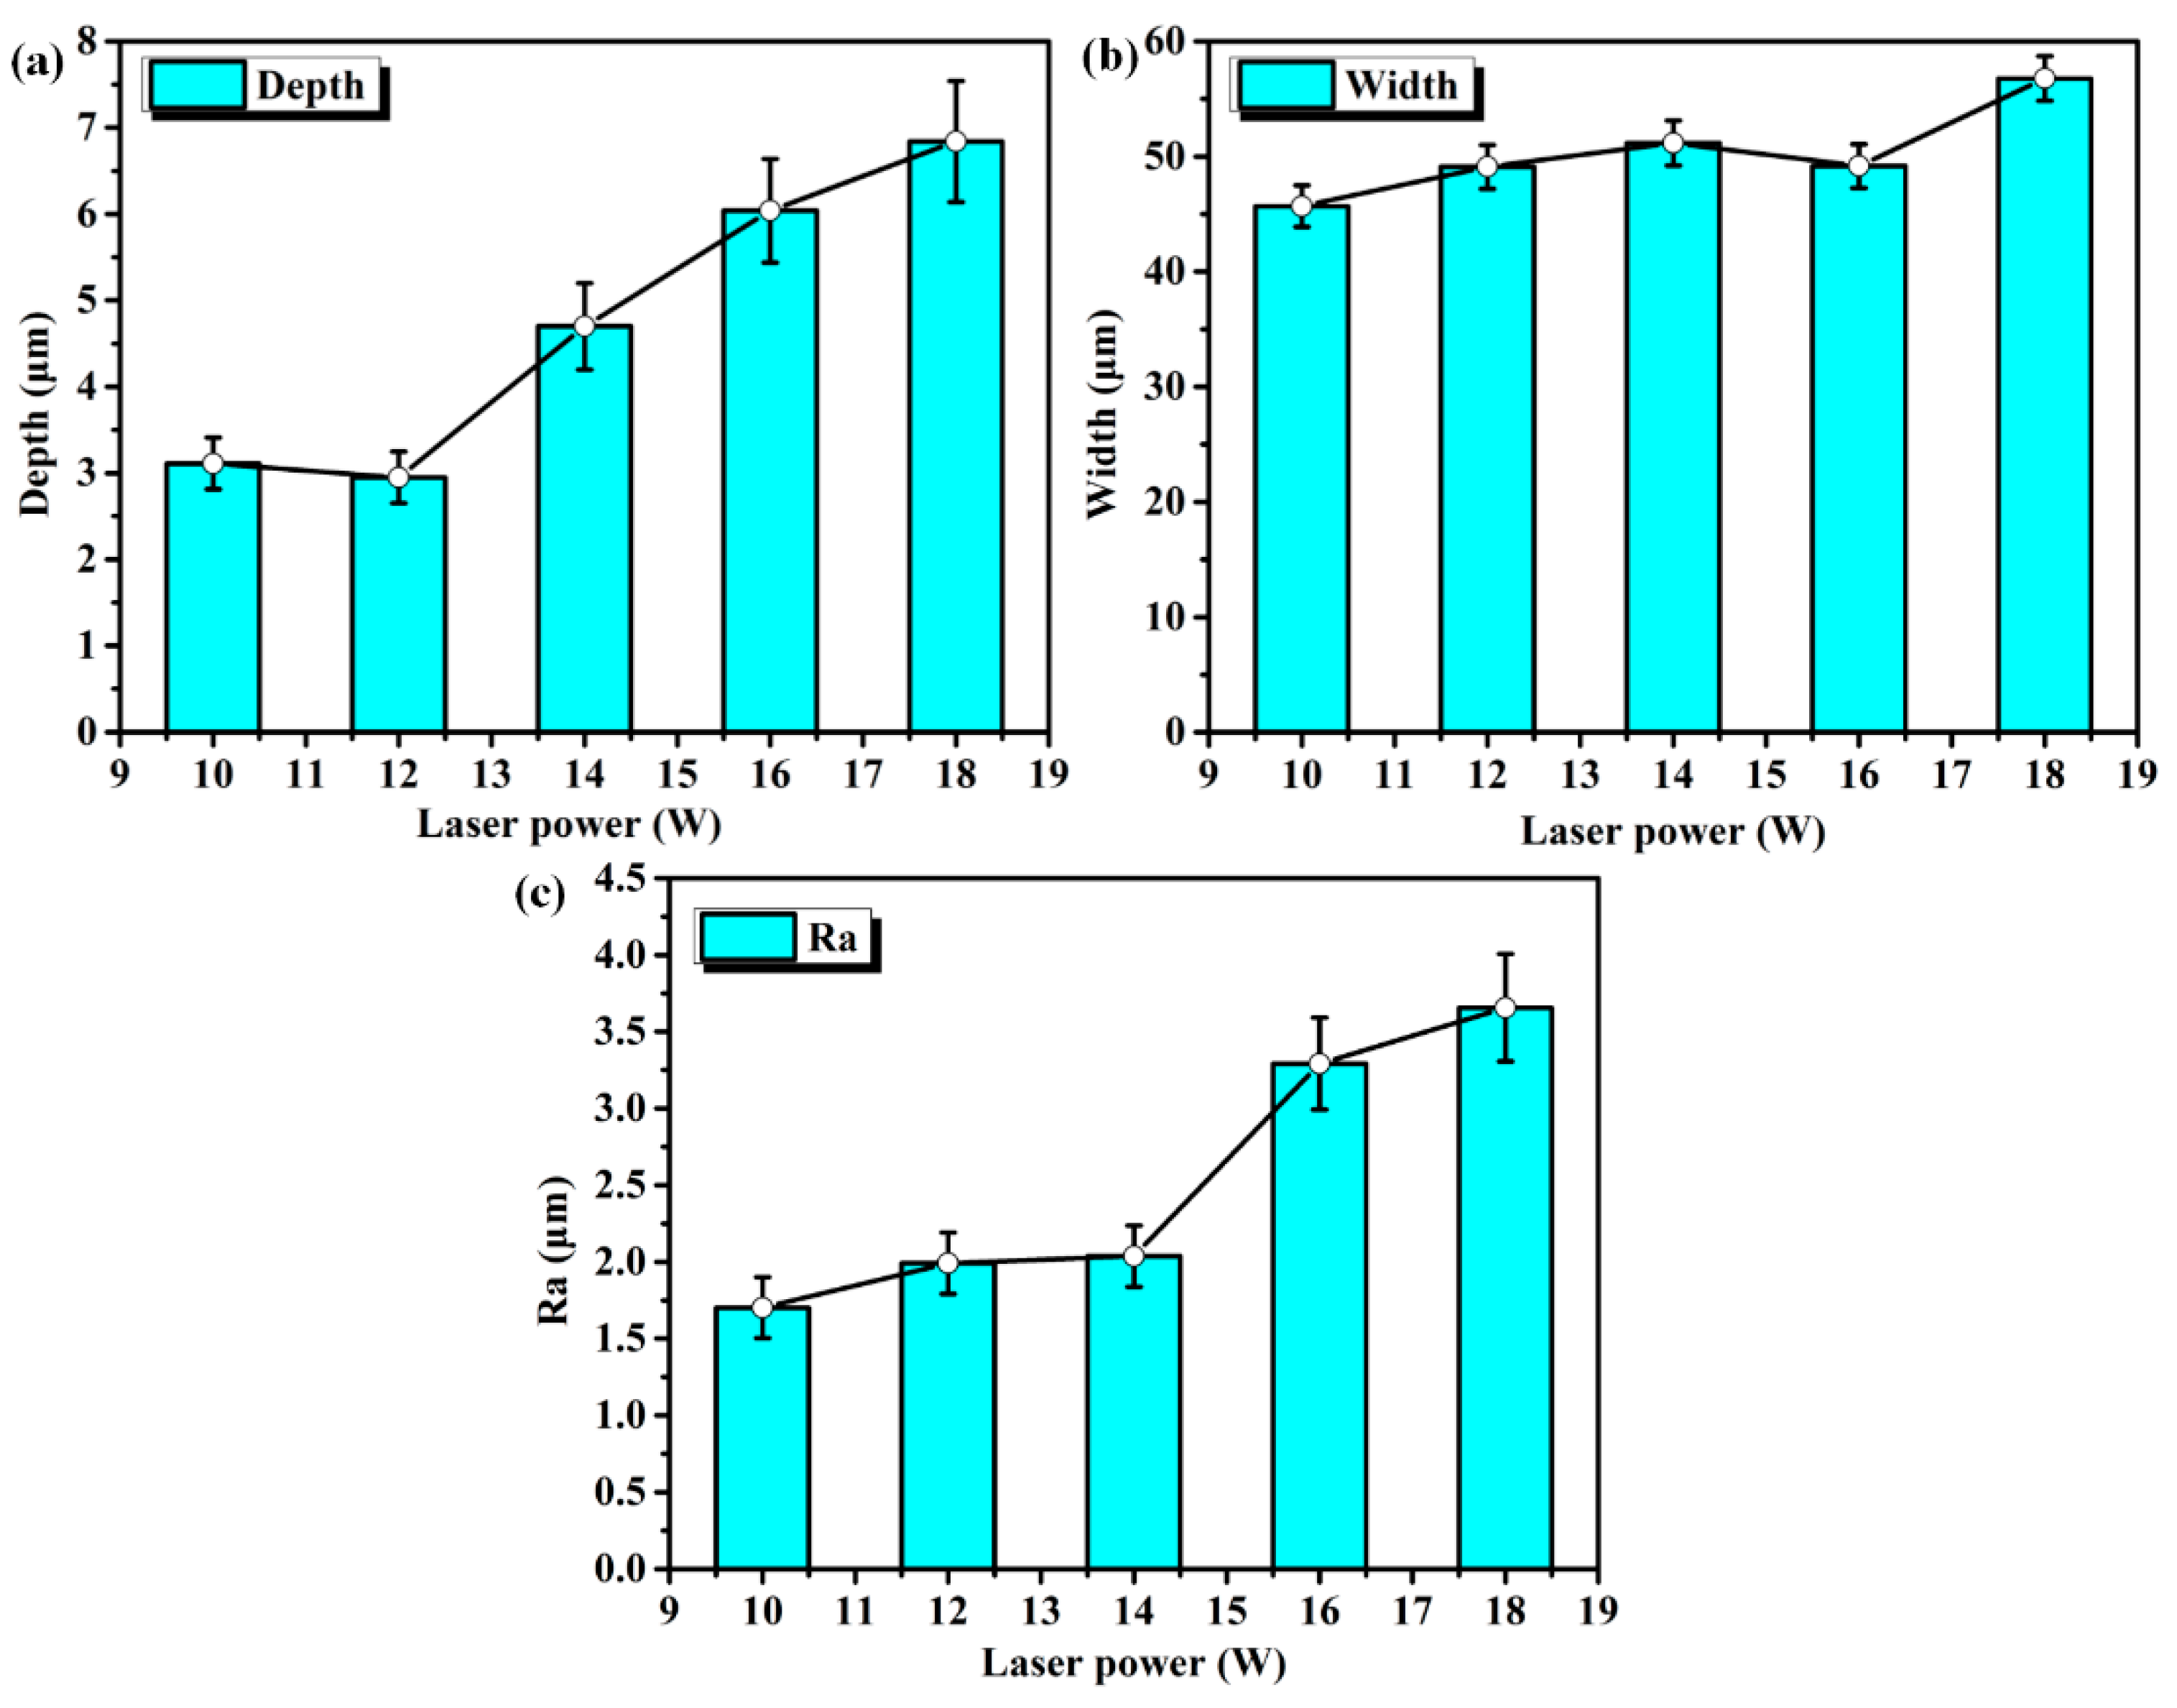
3.1.1. Effect of Laser Power on Microdimple Structure

When the focal spot of a high-energy laser beam touches the surface of a liquid, a considerable amount of energy is absorbed by the liquid, in which a rapid vaporization is induced and results in a keyhole. This keyhole allows the remaining portion of energy to reach the sample surface. The energy that reaches the material’s surface is absorbed to melt and vaporize the material, resulting in material removal. At a higher power, the energy that reaches the material’s surface will be increased, resulting in more material being melted, vaporized, and ionized into a plasma state at a high temperature and pressure. The plasma expansion in the keyhole, which is known as recoil pressure, serves as a removal force to remove more material.
The morphologic and geometric parameters of the microdimples on the ULLM sample surface and the Ra were determined based on the single-factor method. When the average power (P) is 10 W, the contours of the microdimple structures are indistinct and without any interference in both the x-and y-direction (see Figure 4a). As P increases, the contours of the microdimples become clearer, and the overlapping areas in the x-direction are clearly visible. Meanwhile, the longitudinal ridges in the y-direction become narrow (see Figure 4b). The micropores start to appear in the center of the microdimples, and their diameters gradually increase due to increased plasma expansion (Figure 4c).
Overall, the depth, width, and Ra of the microdimples increase with the increasing of P (see Figure 5). It can be seen that when the laser power is 14 W, the Ra is at its minimum. Therefore, the optimal laser power for obtaining the best surface quality is 14 W; this will be considered as the central level in the multiobjective optimization.

3.1.2. Effect of Scanning Speed on Microdimple Structure

It is observed that bubble cavitation occurs in the under-liquid laser machining process. As a bubble collapses, a high-pressure and high-speed liquid jet will impact the surrounding materials. If there is no liquid between workpiece surface and bubbles, the pressure applied on the workpiece surface will be 5.2–12.4 times stronger than that during ambient laser machining [35]. With the increase of scanning speed (v), the microdimple morphology gradually changes from well-defined and complete to blurred and incomplete (see Figure 6). The uniformity of the dimples under a certain v could be described using the shape coefficient, which is a parameter that is used to describe the roundness of a dimple. The shape coefficient greatly increases with the decrease of diameter [38]. This is because the number of pulses per unit spot and spot repetition rate decrease with the increase of v, resulting in a smaller and lower keyhole that serves as a channel for the laser beam to reach the surface and leaving more liquid to serve as a barrier that blocks the pressure induced by bubble cavitation acting on workpiece surface. Therefore, when v is 20 mm/s, the pressure is insufficient to form a clear and intact microstructure (Figure 6c).
When v is in the range of 12–20 mm/s, the depth and width stay constant (Figure 7a,b), indicating that the energy absorbed by the surface is insufficient to form a wider dimple structure at a high speed. The Ra increases as the scanning speed increases (Figure 7c). When v is in the range of 2–12 mm/s, the depth of the dimples decreases and less melting materials spread around the dimple structures; thus, the Ra decreases. The reason for Ra variation could be as follows. Bubble cavitation is observed to be fiercer under the liquid when v increases from 2 to 12 mm/s, resulting in greater material removal at the re-deposited area and thus a decreased Ra. However, when v is in the range of 12–20 mm/s, less bubble cavitation is observed and the incompletely molten materials will turn into aforementioned irregular structures; thus, the Ra increases. It can be seen that when the scanning speed is 12 mm/s, the Ra is at its minimum; this will be considered as the central level in the multiobjective optimization.

3.1.3. Effect of Number of Passes on Microdimple Structure

Figure 8 depicts the morphology of the microdimples after different numbers of passes (N). Overall, as N increases, the morphology of the microdimple becomes more distinct. As can be seen in Figure 8a, less molten materials are formed when N is 100. As N increases, the center area of the laser beam absorbs more energy from laser beam, resulting in an increase of the microporous diameter (Figure 8b,c). Many microsphere structures are formed on the edge of the dimples. Some molten materials are in gas phase under the liquid. After laser beam moves, they will be condensed into solid phase. Thus, the chances for the formation of these structures are increased with increase of N.
As N increases, the depth and Ra of the microdimple structures increase (Figure 9a,c). After 500 processing passes, the depth is 5.47 μm and the Ra is 3.654 μm. Overall, as can be seen in Figure 9b, the width increases first and then decreases, reaching the maximum value of 63.17 μm after 300 processing passes. However, as N increases, the re-melting phenomenon becomes more pronounced. A deeper microstructure allow an easier flow of the molten metal to the central region, resulting in a slight decrease in the width of the microdimple. In this study, the microstructures are expected to be wider when the surface quality is the best. It can be seen that when the number of passes is 300, the width reaches the maximum with the best surface quality; this will be considered as the central level in the multiobjective optimization.

3.2. Multiobjective Optimization

3.2.1. Mathematical Models

The factors and levels are given in Table 1. Experimental response results are listed in Table 2.
The mathematical models can be obtained and expressed as follows:
  • Depth = 6.14 + 4.77 A + 0.92 B − 0.044 C + 0.91 A × B − 0.49 A × C + 1.03 B × C + 0.40 A2 − 0.55 B2 + 0.20 C2 − 1.08 A × B × C + 1.14 A2 × B + 0.72 A2 × C − 0.41 A × B2 − 0.81 A3;
  • Width = 53.11 − 2.41 A + 0.12 B − 0.67 C + 1.89 A × B − 1.98 A × C + 1.85 B × C − 1.45 A2 − 0.12 B2 + 0.30 C2 − 1.14 A × B × C + 0.23 A2 × B + 0.022 A2 × C + 4.95 A × B2 + 1.91 A3;
  • Ra = 1.14 − 0.71 A + 0.18 B + 0.051 C + 0.072 A × B + 0.015 A × C + 0.061 B × C − 0.24 A2 − 0.13 B2 + 0.042 C2 − 0.077 A × B × C − 0.042 A2 × B − 0.027 A2 × C + 0.79 A × B2 + 0.34 A3;
where A, B, and C denote the laser power, number of passes, and scanning speed, respectively.
The adequacy of these mathematical models is verified using the analysis of variance (ANOVA) method and the experiment (see supplementary materials).

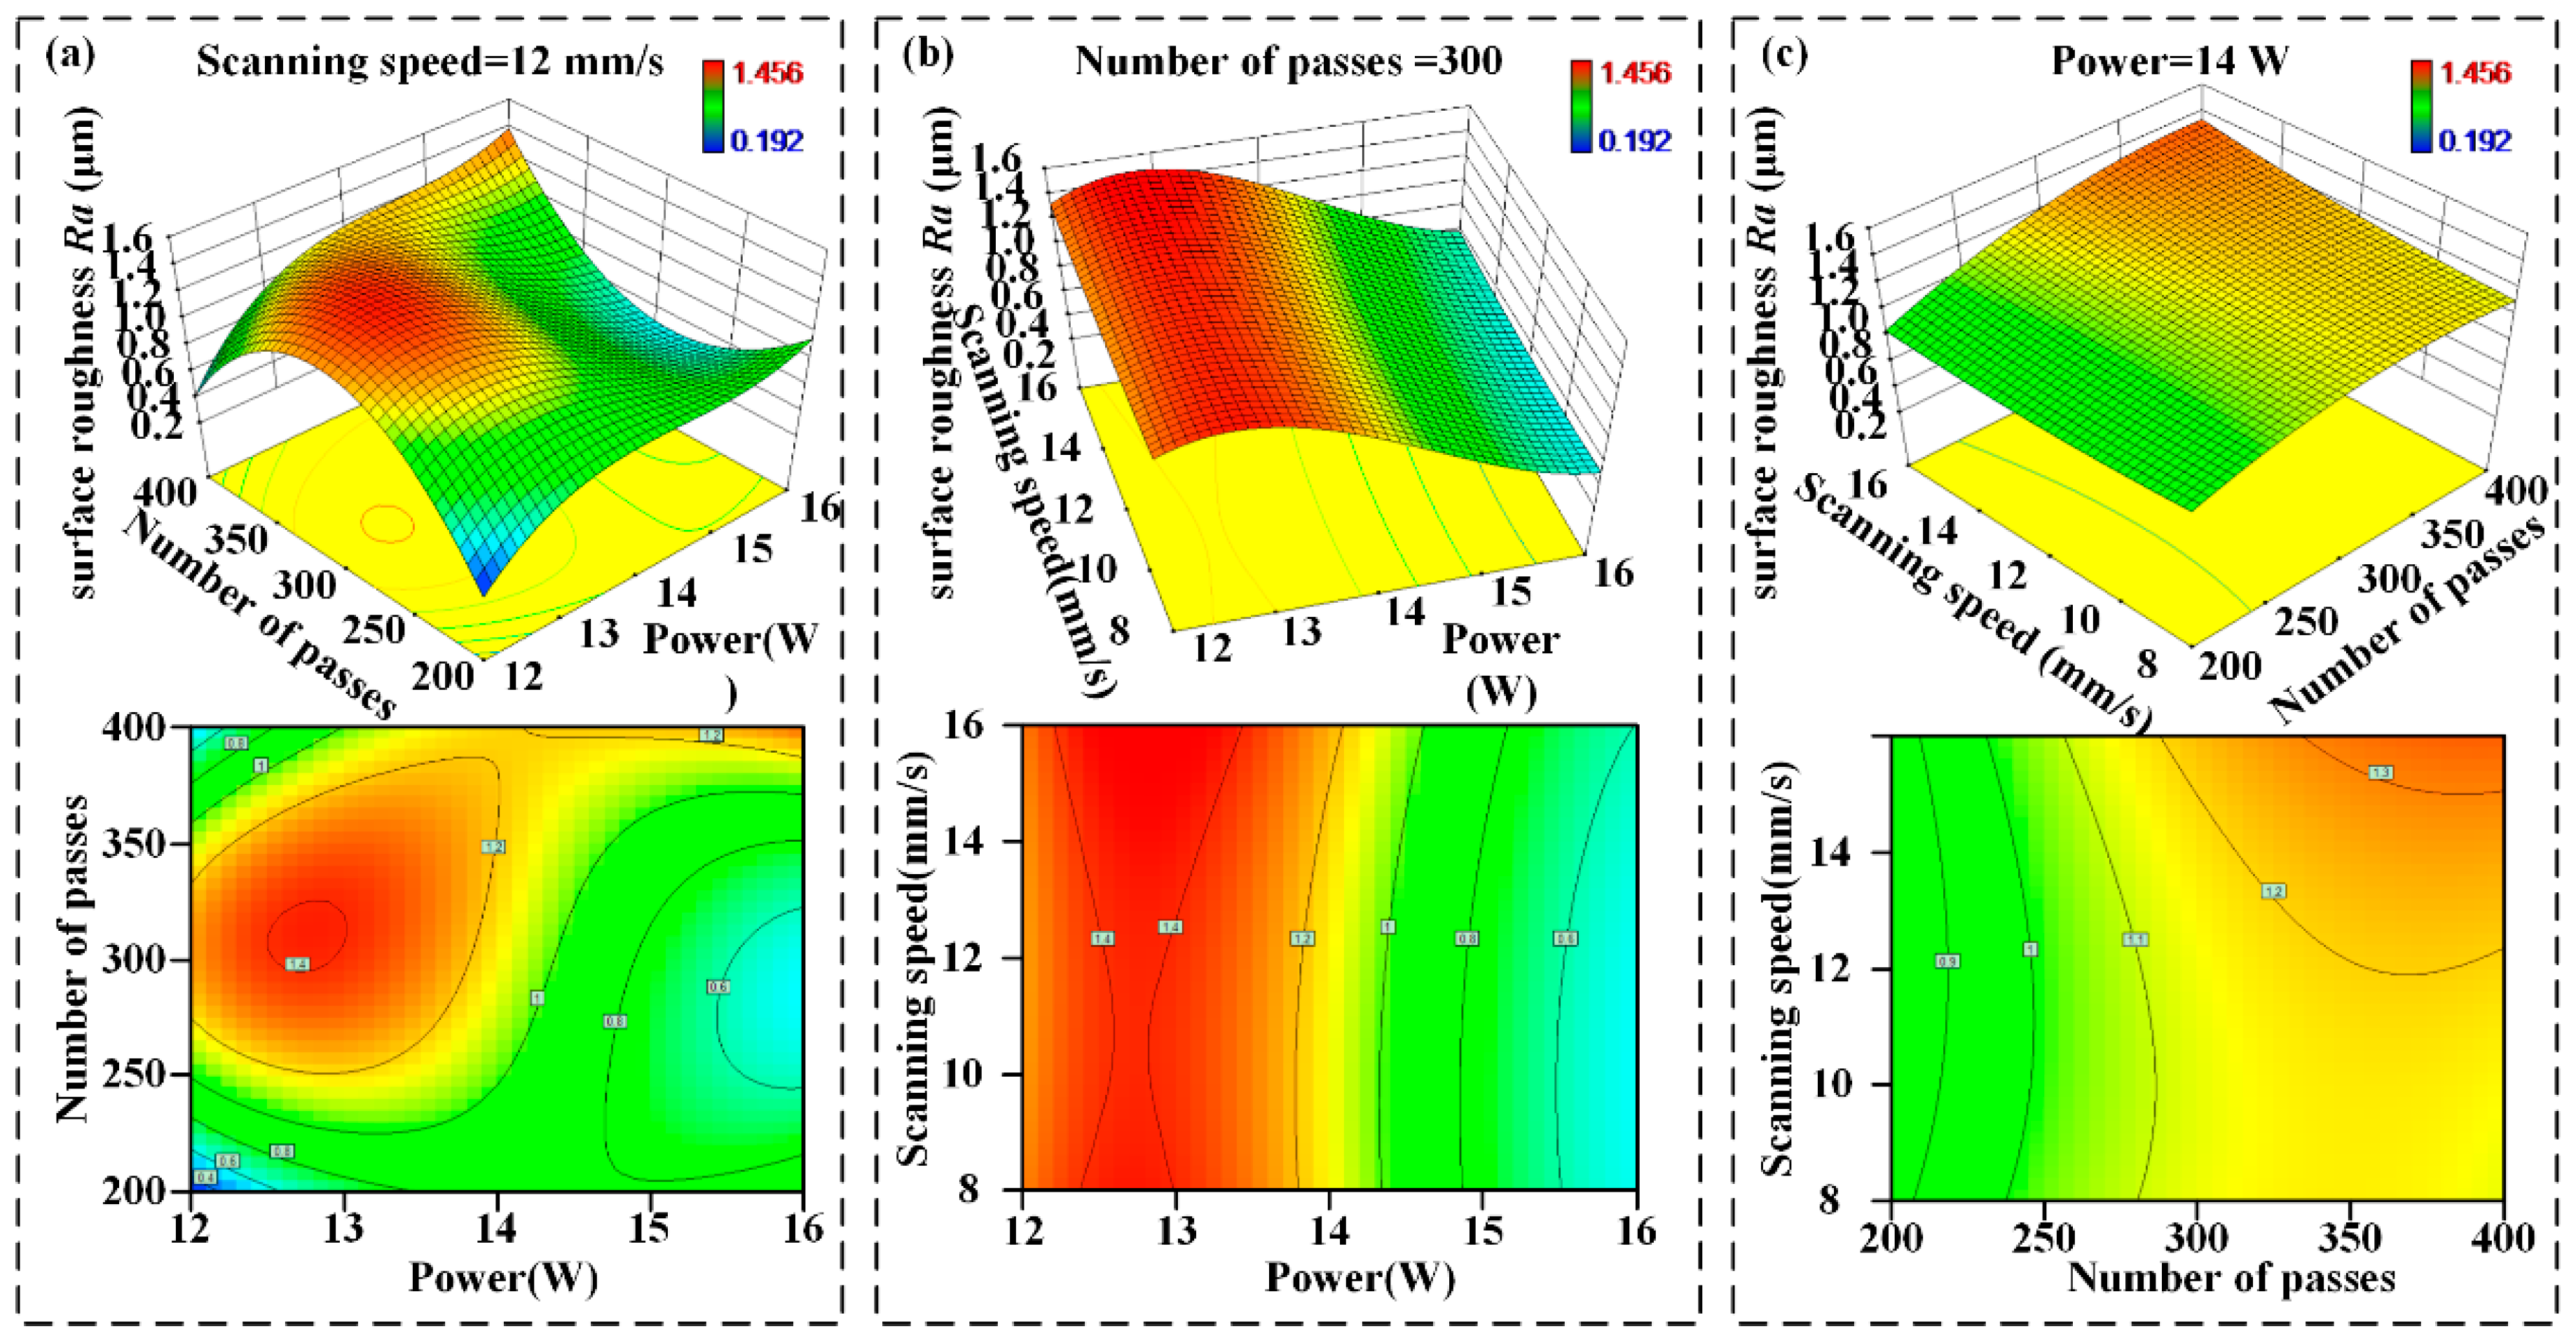
3.2.2. Influence of Laser Processing Parameters on the Responses

Distinct from the analysis considering single factors, this part mainly focus on the synthetical influence of the factors on the responses based on the designed mathematical models. The variations of depth with different laser processing parameters are shown in Figure 10. When P and N are at low values, the value of the depth is minimal (Figure 10a). Conversely, when P and N are at high values, the value of depth reaches the maximum. The contour lines of P and N are elliptical, which indicates that the interaction between P and N is remarkable.
As can be seen in Figure 10b, when v stays constant, the depth increases with the increasing of P. Meanwhile, when P stays constant, the depth is less affected by v. The contour lines of P and v are elliptical, which means the interaction between them is remarkable.
As can be seen in Figure 10c, N and v have little effect on the depth. When v stays constant, the depth increases slowly with the increase of N. When N remains constant, the depth decreases with the increase of v; however, v has little influence on the depth when P reaches 400. The contour lines of and P and v are elliptical, indicating that the interaction between them is significant.
Figure 11 shows the variation of width with different laser process parameters. On one hand, when P is within the range of 12–14 W, the width first increases and then decreases with the increase of N; however, when P is in the range of 14–16 W, the width first decreases and then increases with the increase of N (Figure 11a). On the other hand, when N is in the range of 200–250 or 350–400, the width increases with an increment of P. However, when N is in the range of 250–350, the width increases at first and then decreases with the increase of P. The contour lines of P and N are oval, indicating that the interaction between the two parameters is significant.
As can be seen in Figure 11b, v has little influence on width when P is in the range of 12–14 W. The contour lines of P and v are ellipses, which indicates that the interaction between them is significant. As can be seen in Figure 11c, when N is in the range of 100–300, the width decreases as v increases. When N is in the range of 300–500, the width increases with the increasing of v. The contour lines of N and v are elliptical, which indicates that the interaction between them is significant.
Figure 12 shows the variation of Ra under different laser process parameters. On the one hand, as can be seen in Figure 12a, when P is within the range of 12–14 W, the Ra increases first and then decreases as N increases. Conversely, when P is within the range of 14–16 W, the Ra decreases first and then increases with the increase of N. On the other hand, Ra increases with the increase of P when N is in the range of 250–250 or 350–450. However, when the value of N is in the range of 250–350, the Ra first increases and then decreases with the increase of P. The contour lines of P and N are circular, indicating that the interaction between them is insignificant.
Meanwhile, as P stays constant, v has little effect on the Ra (Figure 12b). The contour lines of P and v are circular, which indicates that the interaction between them is not significant. When v is constant, the Ra increases with N (Figure 12c). When N is constant, v has little influence on Ra. The contour lines of N and v are circular, which indicates that the interaction between them is not significant. In summary, the most significant parameter that affects Ra is v, followed by P and then N.

3.3. Wear-Resistance Tests

Figure 13 shows the WCAs of two surface types after rubbing. Overall, WCAs decrease with the increase in rubbing cycles for the two types of textured amphiphobic samples. Prior to rubbing test, WCAs of the ULLM and LMF samples were 149.3° ± 0.7° and 144.1° ± 0.6°, while OCAs were 135° ± 0.7° and 140° ± 0.9°, respectively. The LMF sample turned hydrophilic (WCA 85° ± 0.8°) and oleophilic (OCA 82° ± 0.7°) after 150 rubbing cycles, while ULLM sample stayed both hydrophobic (WCA 95° ± 0.7°) and oleophobic (OCA 93° ± 1°) even after 300 rubbing cycles, indicating that the hydrophobic layer prepared by the ULLM method shows stronger mechanical strength than that prepared using LMF method. The wetting shift of the LMF sample is presumably attributed to the hydrophobic and oleophobic layers being broken or destroyed during the rubbing process, resulting in the loss of hydrophobic and oleophobic characteristics.
The reasons for the stronger mechanical strength of the amphiphobic layer may be as follows. As shown in Figure 14, the high pressure between two frictional pairs during the rubbing process can result in wear of the uppermost layer, leading to destruction or failure of the hydrophobic layer; however, the wear-resistant amphiphobic surface of the ULLM sample was fabricated using under-liquid laser scanning method, which can form a layer containing a self-similar grid structure that has hydrophobic and oleophobic characteristics. Even if the upper layer is destroyed or broken, the newly exposed layer would also be hydrophobic or oleophobic (details can also be found in ref. [37]). In particular, the wear-resistant amphiphobic layer enables the self-healing process by supplying the neck fracture area with surfactant molecules after the neck area is broken, leading to wear-resistant amphiphobic ability.
The aforementioned assumptions were also verified through EDS results of the surface after rubbing for 300 cycles compared to that prior to rubbing (Figure 15). The EDS results showed the presence of F element on the surface after 300 rubbing cycles. The neck fracture area was supplied by complementary surfactants through self-assembly [37]; consequently, after rubbing, the renewed surface still exhibited a fluorinated surfactant layer that showed amphiphobic properties.

4. Conclusions

The wear-resistant amphiphobic layer with microdimple structures was fabricated on the cemented carbide using the ULLM method in one step. Based on the single-factor experiments and multiobjective optimization, mathematical models were developed that indicate the responses (i.e., the geometric parameters of the microdimple structures) with respect to the factors (i.e., laser processing parameters). Using the laser processing parameters obtained from the multiobjective optimization, the desired geometric parameters of microdimple structures could be realized using the ULLM method; the prediction errors for microstructure depth, width and Ra were 4.90%, 2.94%, and 3.83%, respectively. The amphiphobic layer of the as-prepared sample shows strong mechanical strength and an amphiphobic property that can still be retained even after rubbing for 300 m under the pressure of 2.4 MPa.
This method represents a complement and innovation as compared with the conventional fabricating methods (i.e., LMF method) for wear-resistant hydrophobic surfaces on metal materials. Wear-resistant hydrophobic, oleophobic, or amphiphobic surfaces can be fabricated using this technique, which can be easily extended to other materials as well. As an area for future study, the wear-resistant amphiphobic properties can be assessed using a variety of wear configurations. The substrates can also be extended to other materials. The surface uniformity and the stability of the redeposition within the boundaries could also be predicted using mathematical models.

Supplementary Materials

Supplementary materials are available online at https://www.mdpi.com/2079-6412/10/6/559/s1.

Author Contributions

Conceptualization, L.L. and X.H.; Methodology, X.H.; Software, S.X.; Validation, Y.N. and P.S.; Formal Analysis, P.S.; Investigation, P.S.; Resources, P.S.; Data Curation, P.S.; Writing-Original Draft Preparation, P.S.; Writing-Review & Editing, P.S., X.H., and Y.N.; Visualization, P.S.; Supervision, L.L. and H.Q.; Project Administration, X.H.; Funding Acquisition, X.H. All authors have read and agreed to the published version of the manuscript.

Funding

This research was funded by (National Natural Science Foundation of China, Grant No. 51875285); (Natural Science Foundation of Jiangsu Province, Grant No. BK20190066); (Fundamental Research Funds for the Central Universities, Grant No. NE2020005); (Foundation of the Graduate Innovation Center, Nanjing University of Aeronautics and Astronautics, Grant No. kfjj20190508); and (State Key Laboratory of Mechanical System and Vibration, Grant No. MSV202008).

Acknowledgments

The authors would like to thank Jun Wang from University of New South Wales (Australia) for giving great suggestions to the manuscript.

Conflicts of Interest

The authors declare no conflict of interest.

References

  1. Sun, M.; Ebner, C. Molecular dynamics study of flow at a fluid-wall interface. Phys. Rev. Lett. 1992, 69, 3491–3494. [Google Scholar] [CrossRef] [PubMed]
  2. Jabbarzadeh, A.; Atkinson, J.D.; Tanner, R.I. Wall slip in the molecular dynamics simulation of thin films of hexadecane. J. Chem. Phys. 1999, 110, 2612–2620. [Google Scholar] [CrossRef]
  3. Huang, J.Y.; Lai, Y.K.; Pan, F.; Yang, L.; Wang, H.; Zhang, K.Q.; Fuchs, H.; Chi, L.F. Multifunctional superamphiphobic TiO2 nanostructure surfaces with facile wettability and adhesion engineering. Small 2014, 10, 4865–4873. [Google Scholar] [CrossRef] [PubMed]
  4. Wang, W.; Salazar, J.; Vahabi, H.; Joshi-Imre, A.; Voit, W.E.; Kota, A.K. Metamorphic superomniphobic surfaces. Adv. Mater. 2017, 29, 1700295. [Google Scholar] [CrossRef] [PubMed]
  5. Wang, Y.; Lai, H.; Cheng, Z.; Zhang, H.; Zhang, E.; Lv, T.; Liu, Y.; Jiang, L. Gecko toe pads inspired in situ switchable superhydrophobic shape memory adhesive film. Nanoscale 2019, 11, 8984–8993. [Google Scholar] [CrossRef] [PubMed]
  6. Wang, Y.; Lai, H.; Cheng, Z.; Zhang, H.; Liu, Y.; Jiang, L. Smart superhydrophobic shape memory adhesive surface toward selective capture/release of microdroplets. ACS Appl. Mater. Interfaces 2019, 11, 10988–10997. [Google Scholar] [CrossRef]
  7. Jin, H.; Kettunen, M.; Laiho, A.; Pynnönen, H.; Paltakari, J.; Marmur, A.; Ikkala, O.; Ras, R.H.A. Superhydrophobic and superoleophobic nanocellulose aerogel membranes as bioinspired cargo carriers on water and oil. Langmuir 2011, 27, 1930–1934. [Google Scholar] [CrossRef]
  8. Huang, J.; Lai, Y.; Wang, L.; Li, S.; Ge, M.; Zhang, K.; Fuchs, H.; Chi, L. Controllable wettability and adhesion on bioinspired multifunctional tio2 nanostructure surfaces for liquid manipulation. J. Mater. Chem. A 2014, 2, 18531–18538. [Google Scholar] [CrossRef]
  9. Ma, J.; Duong, H.; Lian, Y.; Lei, S. Assessment of microgrooved cutting tool in dry machining of AISI 1045 steel. J. Manuf. Sci. Eng. 2005, 137, 031001. [Google Scholar] [CrossRef]
  10. Ryk, G.; Etsion, I. Testing piston rings with partial laser surface texturing for friction reduction. Wear 2006, 261, 792–796. [Google Scholar] [CrossRef]
  11. Hu, J.; Xu, H. Friction and wear behavior analysis of the stainless steel surface fabricated by laser texturing underwater. Tribol. Int. 2016, 102, 371–377. [Google Scholar] [CrossRef]
  12. Tala-Ighil, N.; Fillon, M. A numerical investigation of both thermal and texturing surface effects on the journal bearings static characteristics. Tribol. Int. 2015, 90, 228–239. [Google Scholar] [CrossRef]
  13. Rapoport, L.; Moshkovich, A.; Perfilyev, V.; Lapsker, I.; Halperin, G.; Itovich, Y.; Etsion, I. Friction and wear of MoS2 films on laser textured steel surfaces. Surf. Coat. Technol. 2008, 202, 3332–3340. [Google Scholar] [CrossRef]
  14. Zhang, C.; Wang, M.; Wang, X. Effect of surface texture on wear behavior and wear mechanism of metal-polyformaldehyde friction pair. Surf. Technol. 2017, 46, 9–14. [Google Scholar]
  15. Lu, Y. Superior lubrication properties of biomimetic surfaces with hierarchical structure. Tribol. Int. 2018, 119, 131–142. [Google Scholar] [CrossRef]
  16. Liu, S.; Liu, X.; Latthe, S.; Gao, L.; An, S.; Yoon, S.; Liu, B.; Xing, R. Self-cleaning transparent superhydrophobic coatings through simple sol–gel processing of fluoroalkylsilane. Appl. Surf. Sci. 2015, 351, 897–903. [Google Scholar] [CrossRef]
  17. Qu, M.; Ma, X.; He, J.; Feng, J.; Liu, S.; Yao, Y.; Hou, L.; Liu, X. Facile selective and diverse fabrication of superhydrophobic, superoleophobic-superhydrophilic and superamphiphobic materials from kaolin. ACS Appl. Mater. Interfaces 2017, 9, 1011–1020. [Google Scholar] [CrossRef]
  18. Chen, F.; Song, J.; Lu, Y.; Huang, S.; Liu, X.; Sun, J.; Carmalt, C.J.; Parkin, I.P.; Xu, W. Creating robust superamphiphobic coatings for both hard and soft materials. J. Mater. Chem. 2015, 3, 20999–21008. [Google Scholar] [CrossRef] [Green Version]
  19. Li, J.; Zhou, X.; Li, J.; Che, L.; Yao, J.; McHale, G.; Chaudhury, M.K.; Wang, Z. Topological liquid diode. Sci. Adv. 2017, 3, eaao3530. [Google Scholar] [CrossRef] [Green Version]
  20. Li, N.; Wu, L.; Yu, C.; Dai, H.; Wang, T.; Dong, Z.; Jiang, L. Ballistic jumping drops on superhydrophobic surfaces via electrostatic manipulation. Adv. Mater. 2018, 30, 201703838. [Google Scholar] [CrossRef]
  21. Tahmassebi, N.; Moradian, S.; Ramezanzadeh, B.; Khosravi, A.; Behdad, S. Effect of addition of hydrophobic nano silica on viscoelastic properties and scratch resistance of an acrylic/melamine automotive clearcoat. Tribol. Int. 2010, 43, 685–693. [Google Scholar] [CrossRef]
  22. Song, Y.; Nair, R.; Zou, M.; Wang, Y. Adhesion and friction properties of micro/nano-engineered superhydrophobic/hydrophobic surfaces. Thin Solid Film. 2010, 518, 3801–3807. [Google Scholar] [CrossRef]
  23. Kim, H.; Noh, K.; Choi, C.; Khamwannah, J.; Villwock, D. Extreme superomniphobicity of multiwalled 8 nm TiO2 nanotubes. Langmuir 2011, 27, 10191–10196. [Google Scholar] [CrossRef]
  24. Tadanaga, K.; Kitamuro, K.; Matsuda, A.; Minami, T. Formation of superhydrophobic alumina coating films with high transparency on polymer substrates by the sol-gel method. J. Sol-Gel Sci. Techn. 2003, 26, 705–708. [Google Scholar]
  25. Dong, C.; Gu, Y.; Zhong, M.; Li, L.; Sezer, K.; Ma, M.; Liu, W. Fabrication of superhydrophobic cu surfaces with tunable regular micro and random nano-scale structures by hybrid laser texture and chemical etching. J. Mater. Process. Technol. 2011, 211, 1234–1240. [Google Scholar] [CrossRef]
  26. Marco, C.; Eaton, S.; Levi, M.; Cerullo, G.; Turri, S. High-fidelity solvent-resistant replica molding of hydrophobic polymer surfaces produced by femtosecond laser nanofabrication. Langmuir 2011, 13, 8391–8395. [Google Scholar] [CrossRef] [PubMed]
  27. Huang, W.; Lin, C. Robust superhydrophobic transparent coatings fabricated by a low-temperature sol-gel process. Appl. Surf. Sci. 2014, 305, 702–709. [Google Scholar] [CrossRef]
  28. Geng, Z.; He, J. An effective method to significantly enhance the robustness and adhesion-to-substrate of high transmittance superamphiphobic silica thin films. J. Mater. Chem. 2014, 2, 16601–16607. [Google Scholar] [CrossRef]
  29. Barthwal, S.; Kim, Y.; Lim, S. Mechanically robust superamphiphobic aluminum surface with nanopore-embedded microtexture. Langmuir 2013, 29, 11966–11974. [Google Scholar] [CrossRef]
  30. Liu, X.; Gu, H.; Wang, M.; Du, X.; Gao, B.; Elbaz, A.; Sun, L.; Liao, J.; Xiao, P.; Gu, Z. 3D printing of bioinspired liquid superrepellent structures. Adv. Mater. 2018, 30, 1800103. [Google Scholar] [CrossRef]
  31. Dong, Z.; Schumann, M.F.; Hokkanen, M.J.; Chang, B.; Welle, A.; Zhou, Q.; Ras, R.H.A.; Xu, Z.; Wegener, M.; Levkin, P.A. Superoleophobic slippery lubricant-infused surfaces: combining two extremes in the same surface. Adv. Mater. 2018, 30, 1803890. [Google Scholar] [CrossRef] [PubMed] [Green Version]
  32. Cairns, D.R.; Kessman, A.J.; Richter, P.J.; Bottari, F.J.; Randall, N.X. Mechanical and tribological investigations of sol–gel derived SiO2 optical coatings. Wear 2008, 265, 411–416. [Google Scholar] [CrossRef]
  33. Xu, L.; Karunakaran, R.; Guo, J.; Yang, S. Transparent, superhydrophobic surfaces from one-step spin coating of hydrophobic nanoparticles. ACS Appl. Mater. Interfaces 2012, 4, 1118–1125. [Google Scholar] [CrossRef] [PubMed]
  34. Guo, F.; Li, X.M.; Wong, P.L. A novel approach to measure slip-length of thin lubricant films under high pressures. Tribol. Int. 2012, 46, 22–29. [Google Scholar] [CrossRef]
  35. Hong, M.H.; Koh, M.L.; Zhu, S.; Lu, Y.F.; Chong, T.C. Steam-assisted laser ablation and its signal diagnostics. Appl. Surf. Sci. 2002, 911, 197–198. [Google Scholar] [CrossRef]
  36. You; Donghyun; Moin; Parviz. Effects of hydrophobic surfaces on the drag and lift of a circular cylinder. Phys. Fluids 2007, 8, 081701. [Google Scholar]
  37. Hao, X.Q.; Sun, P.C.; Xiao, S.N.; Yang, Y.F.; Li, L. Tribological performance of surface with different wettability under ball-on-disc test. Appl. Surf. Sci. 2020, 501, 144228. [Google Scholar] [CrossRef]
  38. Konovalenko, I.V.; Maruschak, P.O. Application of the properties of fuzzy sets in the computer analysis of the shapes and sizes of tear pits. Mater. Sci. 2018, 53, 548–559. [Google Scholar] [CrossRef]
  39. Lytvynenko, I.V.; Maruschak, P.O.; Lupenko, S.A. Processing and modeling of ordered relief at the surface of heat-resistant steels after laser irradiation as a cyclic random process. Autom. Control Comp. Sci. 2014, 48, 1–9. [Google Scholar] [CrossRef]
Figure 1. (a) Schematic representation of the processing platform; (b) schematic representation of the machining process.
Coatings 10 00559 g001
Figure 2. Experimental design.
Coatings 10 00559 g002
Figure 3. Schematic representation of the rubbing test.
Coatings 10 00559 g003
Figure 4. Microdimple structural morphology under different average laser powers: (a) 10 W; (b) 14 W; (c) 18 W.
Coatings 10 00559 g004
Figure 5. The width, depth, and Ra of microdimple structures under different laser average powers. (a) The influence of laser power on dimple depth. (b) The influence of laser power on dimple width. (c) The influence of laser power on surface roughness Ra.
Coatings 10 00559 g005
Figure 6. Microdimple structural morphology under different scanning speeds: (a) 2 mm/s; (b) 12 mm/s; (c) 20 mm/s.
Coatings 10 00559 g006
Figure 7. The width, depth, and Ra of microdimple structures under different scanning speeds. (a) The influence of scanning speed on dimple depth. (b) The influence of scanning speed on dimple width. (c) The influence of scanning speed on surface roughness.
Coatings 10 00559 g007
Figure 8. Morphology of microdimples created using laser processing with different numbers of passes: (a) 100, (b) 300, (c) 500.
Coatings 10 00559 g008
Figure 9. The width, depth, and Ra of microdimple structures under different numbers of passes. (a) The influence of number of passes on dimple depth. (b) The influence of number of passes on dimple width. (c) The influence of number of passes on surface roughness Ra.
Coatings 10 00559 g009
Figure 10. Variations of depth with different laser process parameters: (a) effects of number of passes and power on depth; (b) effects of scanning speed and power on depth; (c) effects of scanning speed and number of passes on depth.
Coatings 10 00559 g010
Figure 11. Variations of width with different laser process parameters: (a) effects of number of passes and power on width; (b) effects of scanning speed and power on width; (c) effects of scanning speed and number of passes on width.
Coatings 10 00559 g011
Figure 12. Variations of the Ra with different laser process parameters: (a) effects of number of passes and power; (b) effects of scanning speed and power; (c) effects of scanning speed and number of passes.
Coatings 10 00559 g012
Figure 13. Variation of the water contact angles and oil contact angles with the number of rubbing cycles. (a) The water contact angles of ULLM and LMF sample decrease with the increase of rubbing cycles. (b) The oil contact angles of ULLM and LMF sample decrease with the increase of rubbing cycles.
Coatings 10 00559 g013
Figure 14. Schematic illustration of the wear-resistance mechanism.
Coatings 10 00559 g014
Figure 15. EDS results of the hydrophobic surface prepared using under-liquid laser machining (ULLM) method: (a) the amphiphobic surface prior to rubbing; (b) after 300 rubbing cycles.
Coatings 10 00559 g015
Table 1. Values of factors in different levels.
FactorsSymbolUnitLevel 1Level 2Level 3Level 4Level 5
PowerAW1012141618
Number of passesB1100200300400500
Scanning speedCmm/s58121618
Table 2. Experimental results of the multiobjective optimization.
Test NumberA (W)B (1)C (mm/s)Depth (μm)Width (μm)Ra (μm)
11220082.43650.5830.450
21620086.55057.3950.948
31240080.51341.5340.316
416400812.59460.4441.411
512200160.55147.2720.192
616200167.01250.7101.058
712400167.05850.1690.610
8164001612.84256.5961.456
910300122.62547.0140.534
10183001210.78757.7561.424
1114100123.26752.6150.501
1214500125.77852.8870.974
131430056.83955.1981.178
1414300186.53152.7681.310
1514300126.17452.4121.173
1614300126.28353.6251.072
1714300126.03953.3051.122
1814300126.35653.5341.303
1914300125.93253.2401.066
2014300126.07952.5271.094

