Article

Re-Oxidation of ZnO Clusters Grown on HOPG

1
Departamento de Física Aplicada and Instituto Nicolás Cabrera, Universidad Autónoma de Madrid, Francisco Tomás y Valiente 7, E-28049 Madrid, Spain
2
Instituto de Cerámica y Vidrio, CSIC, Kelsen, 5, E-28049 Madrid, Spain
3
Instituto de Ciencias de Materiales de Madrid, CSIC, Sor Juana Inés de la Cruz 3, E-28049 Madrid, Spain
*
Author to whom correspondence should be addressed.
Coatings 2020, 10(4), 401; https://doi.org/10.3390/coatings10040401
Submission received: 19 March 2020 / Revised: 10 April 2020 / Accepted: 14 April 2020 / Published: 18 April 2020
(This article belongs to the Special Issue 1D, 2D and 3D ZnO: Synthesis, Characterization and Applications)

Abstract

:
This article studies the chemical interaction between ZnO and highly oriented pyrolytic graphite for as grown and thermally treated samples. In-situ X-ray photoelectron spectroscopy and ex-situ Raman spectroscopy confirm that graphite is affected by these processes, becoming oxidized and defective only in the presence of ZnO clusters that become recrystallized upon thermal re-oxidation processes performed at 400 °C. By comparing these results with other identical experiments performed with ZnO clusters grown on graphene and even with CoO clusters grown on graphite, the present results show how the interaction of the ZnO clusters with graphitic substrates depend on two factors—firstly, the mode of growth and corresponding morphology, and secondly, the reactivity of the graphitic substrates, either graphene or graphite. The results presented here will help us understand the fundamental interactions in ZnO/graphitic heterostructures and to define their operating limits.

1. Introduction

The main purpose of the present article is to study the chemical interactions between as grown ZnO and highly oriented pyrolytic graphite (HOPG) before and after a set of thermal treatments. ZnO has been deeply studied in the last few decades due to its important optoelectronic properties, particularly its wide band gap at room temperature (~3.3 eV) and large exciton binding energy (~60 meV) [1,2,3]. These characteristics make ZnO an excellent low-cost candidate substitute for indium tin oxide (ITO) as a transparent conducting oxide in many applications [4,5]. On the other hand, the impossibility to achieve comparable p-type doping levels (in terms of both electrical conductivity and long-term stability) has hindered its application in optoelectronic devices, many of which need both types of doping. Nevertheless, research on ZnO has moved to the study of its nanostructures and its interactions with other materials in order to enhance and tune their properties [6]. In this sense, since its rediscovery in 2004, graphene has represented the paradigm of bi-dimensional (2D) materials, and multiple publications have referred to its combination with other traditional three-dimensional (3D) compounds [7,8]. ZnO-graphene structures find applications in multiple fields, such as in high-performance supercapacitors [9], environmental decontamination by photocatalysis [10,11], sensors [12], and solar cells [13].
However, the absence of graphene-based mass devices is related to the well-known difficulty in achieving large areas of non-defective graphene and due to the uncontrolled behavior of graphene heterostructures under more realistic conditions than those offered by laboratories. In order to clarify the role of each factor (environment, substrate, 3D-nanostructured material, and graphene), recent publications of our group have shown the different behaviors of ZnO growth on graphene supported on polycrystalline copper and on highly oriented pyrolytic graphite (HOPG). Despite the equivalent uppermost atomic monolayer, the reactive thermal evaporation of metallic zinc under an oxygen atmosphere at room temperature shows a stronger chemical interaction with graphene, conserving the metallic state during the very early stages of growth and being able to decouple the graphene from copper by inducing the formation of a Cu2O interlayer [14]. On the other hand, this same deposition process on HOPG induces the growth of almost stoichiometric islands of ZnO [15]. These results point out to the necessity to deeply characterize the interaction of ZnO with different graphitic substrates, especially those comparable to graphene on their surface ordering, in order to elucidate the interaction details and the reasons why they are substrate- and environment-dependent.
We would like to emphasize that, in contrast to other chemical and physical deposition techniques commonly used for industrial and research processes, reactive thermal evaporation reduces the energy of the evaporated ions and the chemical aggressiveness of chemical methods that could directly interact with the substrate. Thus, this technique represents the best option to investigate this deposit–substrate interaction and subsequently could be extended to other methods of growth. Besides, this method also allows the study of growth and the application of different thermal treatments performed in a vacuum chamber directly attached to a XPS spectrometer.
Hence, the interactions between HOPG and metal oxides have also been the focus of multiple reports due to the catalytic properties of these tandem systems and a renewed interest in HOPG after the 2D-graphene revolution. In this sense, nanopatterning on graphite has attracted much attention in the past years due to the ease of transferring these innovations directly to graphene nanopatterning for graphene cutting and nanolithography purposes. For example, different metallic nanoparticles such as Ni, Fe, Au, and Ag have been used for this purpose [16,17]. However, our group has shown that this nanopatterning process can be better performed by re-oxidizing CoO ultra-thin films at lower temperatures than by using metallic nanoparticles (moving from the range 600–800 °C, depending on the particle, to 400 °C) due to an initial weakening of the sigma bonds of HOPG induced by the deposited CoO [18,19,20]. These results will open the door to the study of the interactions between HOPG and other metal oxides that present catalytic properties, such as ZnO.
Taking into account the two above mentioned novel topics, here we present a fundamental study of the interactions between ZnO and HOPG. We describe, by means of X-ray photoelectron and Raman spectroscopies, the effects of depositing ZnO on HOPG at room temperature and its interactions after the equivalent re-oxidation thermal treatments that lead to nanopatterning in the case of CoO. The different electronic configurations of Co ([Ar] 4 s2 3 d7) and Zn ([Ar] 4 s2 3 d10) naturally traduce different catalytic properties, tempered in the case of ZnO due to the electronic completion of its 3 d orbitals. Further, the different modes of growth, i.e., Stranski–Krastanov and Volmer–Weber, for CoO and ZnO respectively, will also determine their distinct morphological interfaces and thus the different metal oxide/HOPG interactions. The results are presented in two main sections. First, the X-ray photoelectron spectroscopy (XPS) characterization of the as grown ZnO on HOPG is shown, followed by a description of the ZnO/HOPG interactions after thermal treatments. Subsequently, these results are discussed and compared to those obtained for CoO/HOPG and ZnO on graphene/Cu sheets systems. In this way, we highlight how the initial reactivity of the deposited material together with the particular characteristics of the graphitic substrates determine the morphology and reactivity of the whole system.

2. Materials and Methods

ZnO was grown at room temperature by reactive thermal evaporation of metallic zinc under an oxygen (O2) atmosphere at 2 × 10⁻³ mbar. The preparation chamber had a base pressure of 5 × 10⁻⁹ mbar. Metallic zinc beads from Goodfellow (purity 99.99%) were evaporated using a Knudsen type evaporator at 10 cm from the sample, working at a very low evaporation rate to study in detail the early stages of growth. The HOPG substrate from Bruker (ZYB grade, Billerica, MA, USA) was cleaved in air and then introduced in vacuum. The substrate cleanliness was checked by XPS confirming only the initial presence of negligible traces of intercalated molecular oxygen. During evaporation, the graphite substrates were maintained at room temperature, since the contribution of the evaporation cell to the temperature of the substrate was negligible. More details regarding the evaporation process can be found elsewhere [15]. ZnO was grown on HOPG by successive evaporations, being the sample analyzed in-situ by X-ray photoelectron spectroscopy (XPS) for each step. A complete explanation of the procedure for the estimation of the amount of deposited material in each step by in-situ XPS measurements can be found elsewhere [15]. Ex-situ Raman spectroscopy was performed on the as grown and thermally treated samples. Ex-situ atomic force microscopy (AFM) measurements were taken on as grown samples. A ZnO powder sample from Goodfellow (99.99%) was also measured by XPS as reference.
ZnO/HOPG samples were subjected to three different kind of thermal processes named as 400 °C-UHV, R1, and R2. The first treatment, 400 °C–UHV, consisted on annealing ZnO/HOPG samples at 400 °C in ultra-high-vacuum (UHV) conditions (base pressure 5 × 10⁻⁹ mbar) during one hour. R1 and R2 were re-oxidation processes. For treatment R1, the samples were heated up to 400 °C under UHV conditions and then exposed to O2 for 1 h (PO2 = 2 × 10⁻³ mbar) while maintaining that temperature. Whereas for treatment R2, the samples were first exposed to O2 and then heated up to 400 °C for 1 h under oxygen exposure. In all cases, temperature ramps were set at 10 °C/min, and the O2 re-oxidation pressure was set at 2 × 10⁻³ mbar. In R1 and R2, the O2 valve was closed when the sample was below 100 °C. The samples were characterized by means of XPS before and after the thermal treatments. For comparison purposes, the as grown samples were exposed to different pressures of O2 at room temperature. A quadrupole mass spectrometer (Pfeiffer PrismaPlus QMG 220 M, resolution: 0.5 a.m.u.) made possible the study of the composition of the chamber atmosphere during the different thermal treatments.
The XPS measurements were performed with a CLAM-4 MDC hemispherical electron analyzer from Thermo Fisher Scientific using the Mg Kα anode. The pass energy was set at 20 eV, giving an overall resolution of 0.9 eV. The energy scale for HOPG was calibrated by setting the HOPG C 1 s peak at 284.3 eV. The spectra have been fitted using the XPS Peak software, version 4.1. The Raman spectra were taken using a confocal Raman microscope with a spectral resolution of 0.02 cm−1 coupled with an AFM instrument (ALPHA 300RA, WITec, Uim, Germany), with laser excitation at 532 nm and a 100× objective lens (NA = 0.9). If not indicated, the incident laser power was 0.5 mW. The optical diffraction resolution was limited to about 200 nm laterally and 500 nm vertically. The samples were mounted in a piezo-driven scan platform having 4 nm lateral and 0.5 nm vertical positioning accuracy and also equipped with an active vibration isolation system (active at 0.7–1000 Hz). The images were processed and analyzed with the WiTec Project Plus 2.08 software. AFM images were taken with a Nanotec AFM microscope in non-contact dynamic (tapping) mode using commercial tips from Nanosensors. The images were processed and analyzed with the WSxM software (5.0 Develop 8.2, Nanotech Electrónica, Madrid, Spain) [21].
X-ray diffraction (XRD) patterns were taken in grazing incidence with a X-pert PRO Theta/2Theta diffractometer from Panalytical, using Cu Kα radiation (Cu Kα = 1.5406 Å) and an incidence angle of 2°. High resolution SEM images were taken with a Field Emission Gun-Scanning Electron Microscope Philips XL30 S-FEG (Philips, California, CA, USA)

3. Results

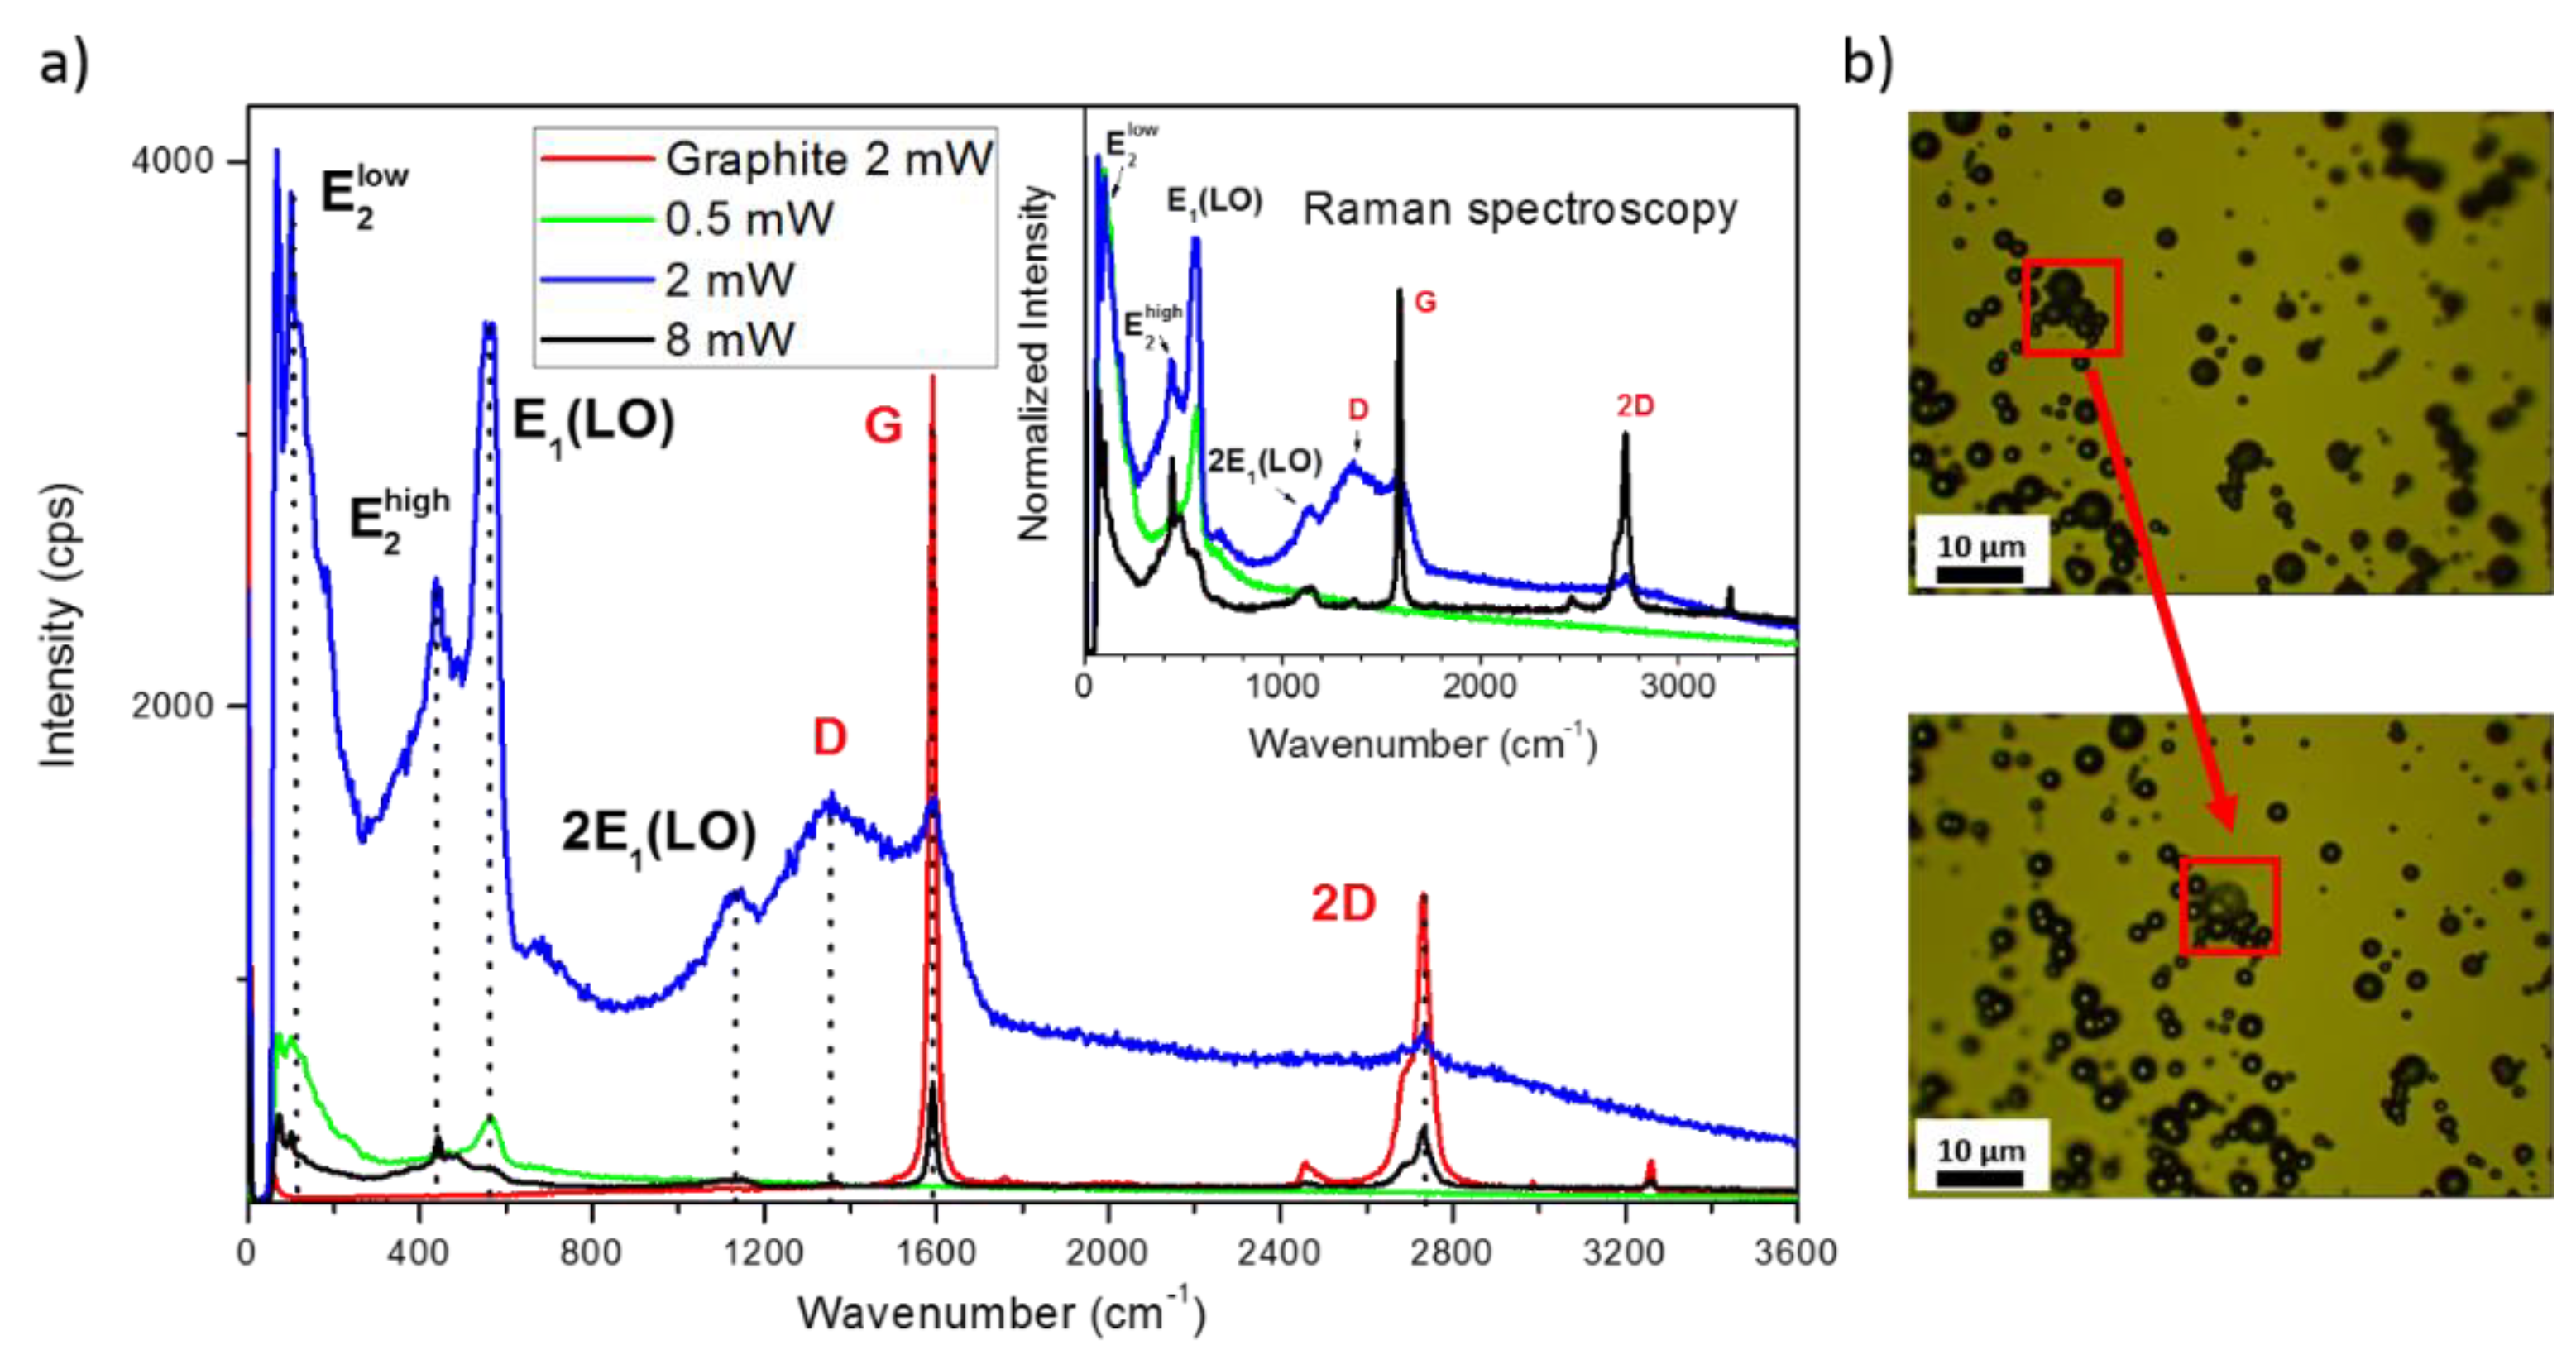
3.1. XPS Characterization of as Grown ZnO/HOPG

ZnO grown on HOPG follows a Volmer–Weber mode of growth characterized by two different regimens [15]. First, ZnO nucleates very rapidly on the HOPG defects (especially at the steps), keeping the terraces almost clean due to the high diffusion of Zn atoms. These structures become continue, forming caterpillar shapes, while isolated nucleation points at the terraces lead to individual clusters. Further evaporation produces the creation of new nucleation centers, but ZnO is preferentially deposited on the previous oxide structures, thus leading to the formation of very large structures (2 μm height). Further morphological details of the ZnO growth can be found elsewhere [15]. This mode of growth, in which increased amounts of material are deposited while a very low percentage of the surface is covered, induces an important underestimation on the number of the equivalent monolayers (Eq-ML) of the deposit measured by XPS. This is the reason why we have also indicated the total evaporation time together to the estimated Eq-ML. Moreover, these high structures prevent the measurement of the ZnO/HOPG interface and practically lead to the measurement of bulk ZnO structures. Despite these circumstances, the XPS data show changes as a function of the deposition time for both the ZnO and the HOPG substrate.
Figure 1 and Figure 2 show the XPS Zn 2 p and O 1 s spectra of the deposit, respectively. Figure 1a shows the XPS Zn 2 p3/2 spectra as a function of the deposition time and coverage (Eq-ML). The Zn 2 p3/2 peak is located around 1022.4 eV [22], while the ghost peak of the C 1 s due to the oxidation of the magnesium anode initially dominates at an energy of ~1006 eV. The deposited ZnO has a nearly-perfect Zn/O stoichiometric composition rate of 1:1, as stated before by Factor Analysis [15]. Nevertheless, some interesting features can be extracted from this region, such as those shown in Figure 1b,c for the energy splitting of both Zn 2 p3/2 and Zn 2 p1/2 peaks due to Spin-Orbit (S–O) interaction for each stage of growth. Figure 1b shows a tiny shift of about 0.2–0.3 eV to lower binding energies from the very first growth stages (below 10 min of evaporation). Further, in Figure 1c, the S–O splitting of these two contributions clearly decreases 0.15 eV as a function of the deposition time, and thus as a function of the coverage and size of the ZnO clusters until its stabilization at roughly 23.15 eV, which in fact is the value obtained from the ZnO powder reference sample. The insert AFM image in Figure 1c shows a nanometric structure (4 nm height) along a graphite step at the very early stages of growth. Although the size of these types of structures (together to the low coverage of the surface) is almost enough to hinder the signal from the ZnO/HOPG interface, its low dimension could induce size effects on Zn 2 p spectra, as reported previously for other metal oxides [23,24,25]. On the other hand, S–O variations due to multiplet effects produced in low and high spin configurations, such as those reported for Mn, Ni or Co [26], could be discarded due to the completion of the Zn 3 d orbitals.
In the case of the O 1 s region, Figure 2a shows the O 1 s spectra as a function of deposition time and coverage (Eq-ML). Besides, Figure 2b shows the O 1 s fitted spectrum for the final ZnO evaporation step (40 Eq-ML, 30 min). The spectrum is composed by two contributions. The main peak at 531.3 eV is associated to oxygen in the ZnO lattice, whereas the shoulder at 533.0 eV can be associated to hydroxide groups [27] and the defects related to oxygen atom vacancies in the matrix [28]. Figure 2c depicts the relative weight between these two contributions as a function of deposition time. The values are gradually stabilized around 0.8 and 0.2 for the O–Zn and OH contributions, respectively, which is in agreement with the literature [27]. Two details of this figure should be highlighted. First, the final coverages were taken at two different take-off angles, increasing the relative amount of OH/defect contribution with the angle. This fact indicates the surface nature of the OH contribution, in agreement with other reported works [29] where termination of some ZnO facets, such as (0001) and (000-1), in OH groups was due to thermodynamic stabilization. Secondly, in the very early stages of growth (marked by the red striped box), the O–Zn contribution seems overestimated. The overlapping between the initial O-HOPG signal from molecular oxygen intercalated between the graphite layers and the OH/defect contribution makes it very difficult obtain the correct fitting of this region for the very early stages of growth.
Moving towards the effects on the HOPG substrate, the C 1 s XPS spectra are shown in Figure 3a as a function of the coverage. Figure 3b offers this same information by comparing the normalized shape of the C 1 s peak. Finally, Figure 3c shows the evolution of the relative weight of each of the components of the fittings shown in Figure 3a. Although for the initial stages there are no changes, the final evaporation steps show a no negligible evolution of defects (sp3 contribution at ~285 eV [30]) and graphite oxides (C–O and C=O at ~286 and ~289 eV, respectively [31,32]) from the initial asymmetric peak corresponding to sp2 hybridization [33]. Likely, this graphite signal does not correspond to the ZnO/HOPG interface but to the non-covered graphite surface. Therefore, changes on HOPG correspond to extended effects of ZnO/HOPG interaction on the ZnO cluster surroundings, which are only visible by XPS once coalescence is almost achieved.

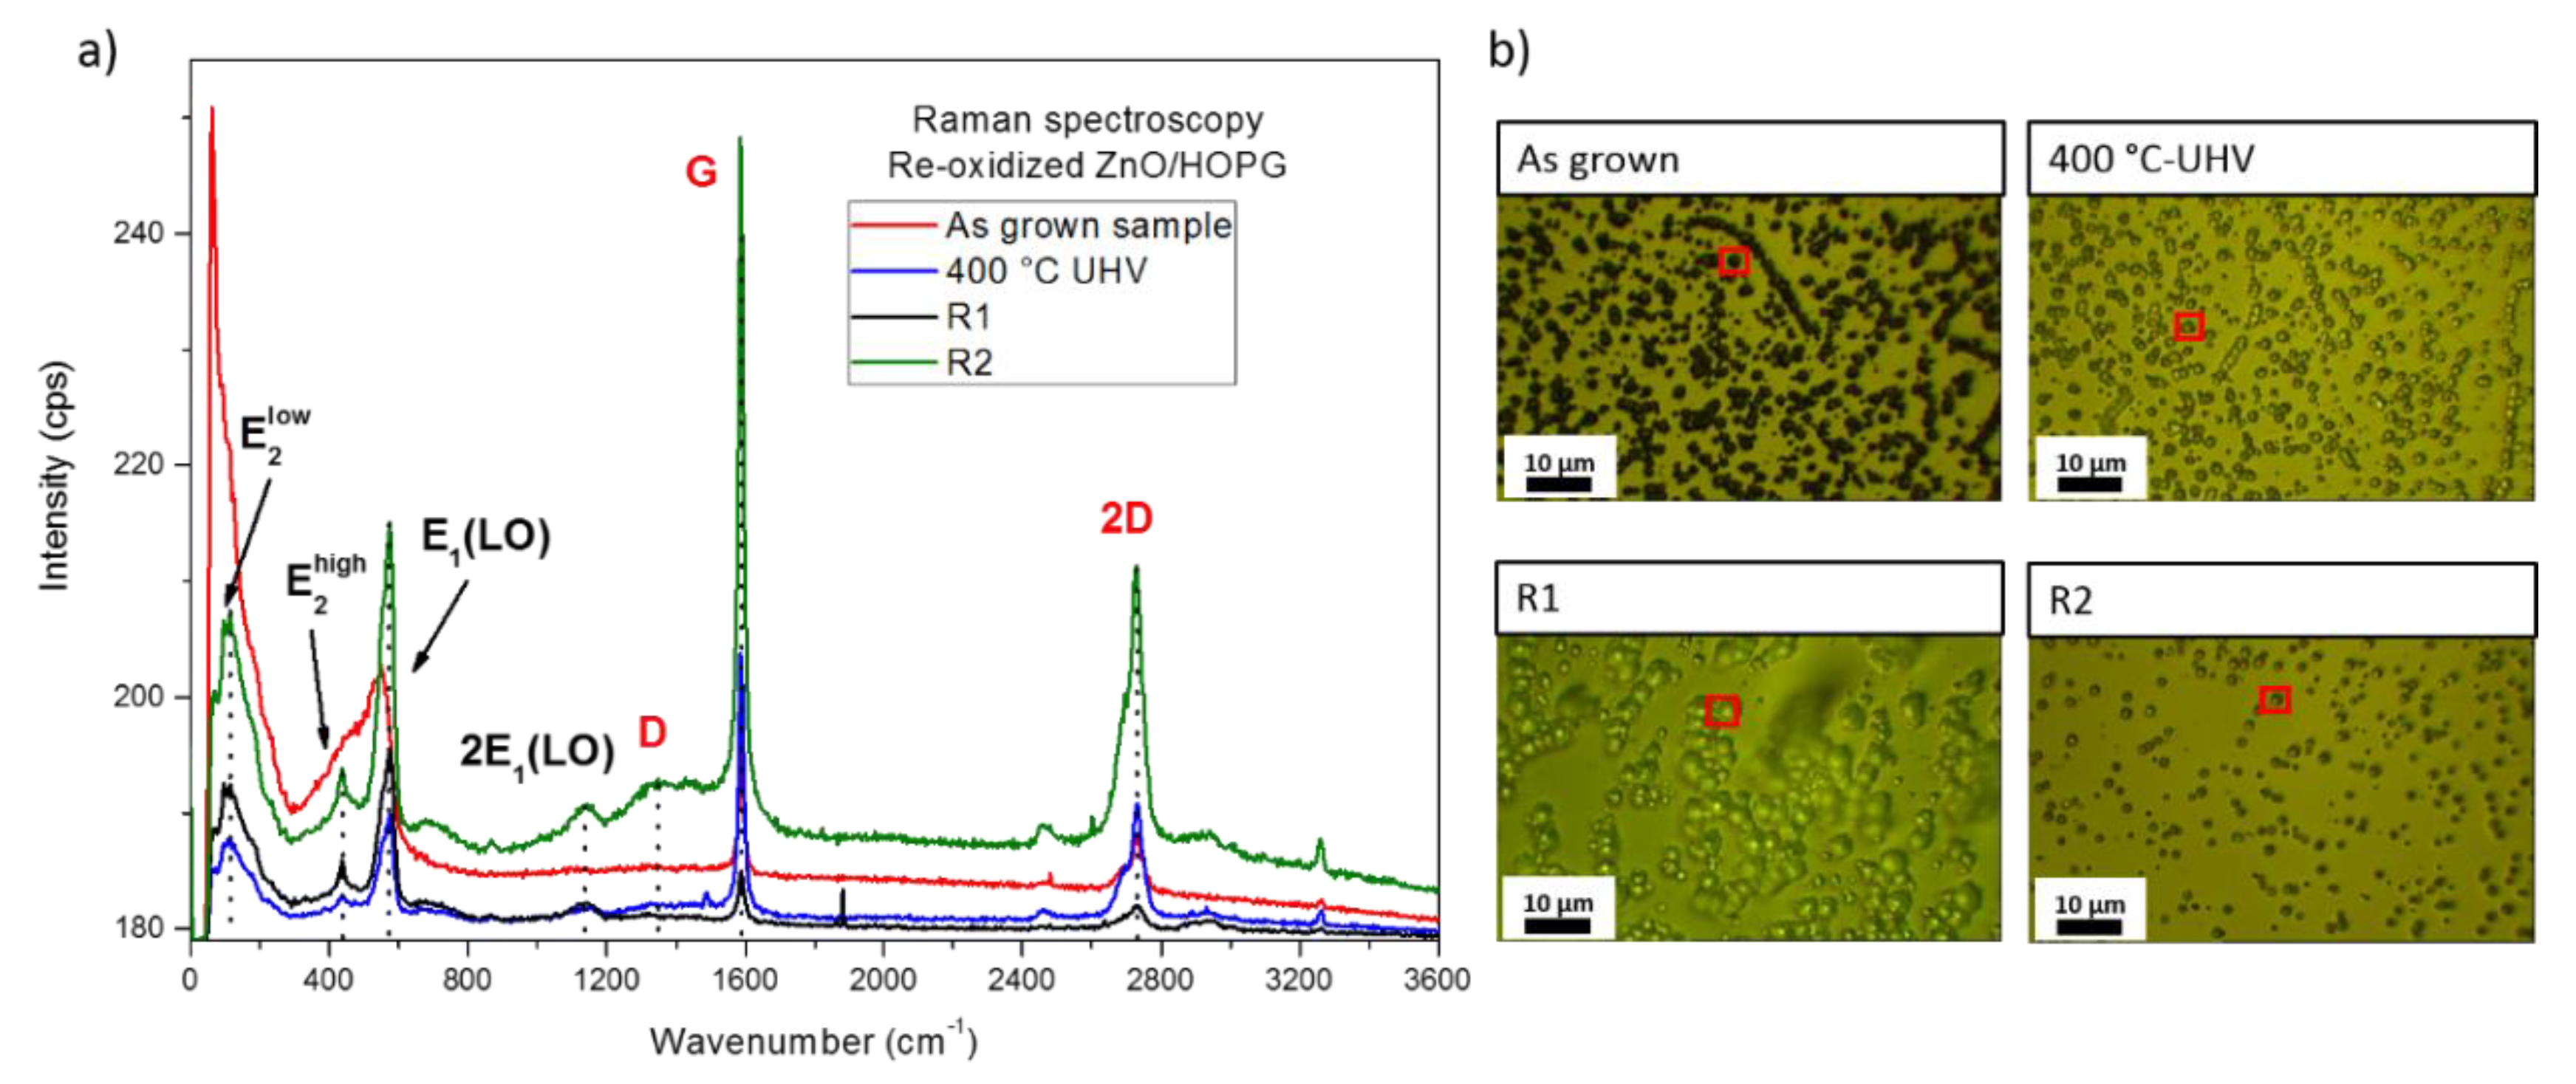
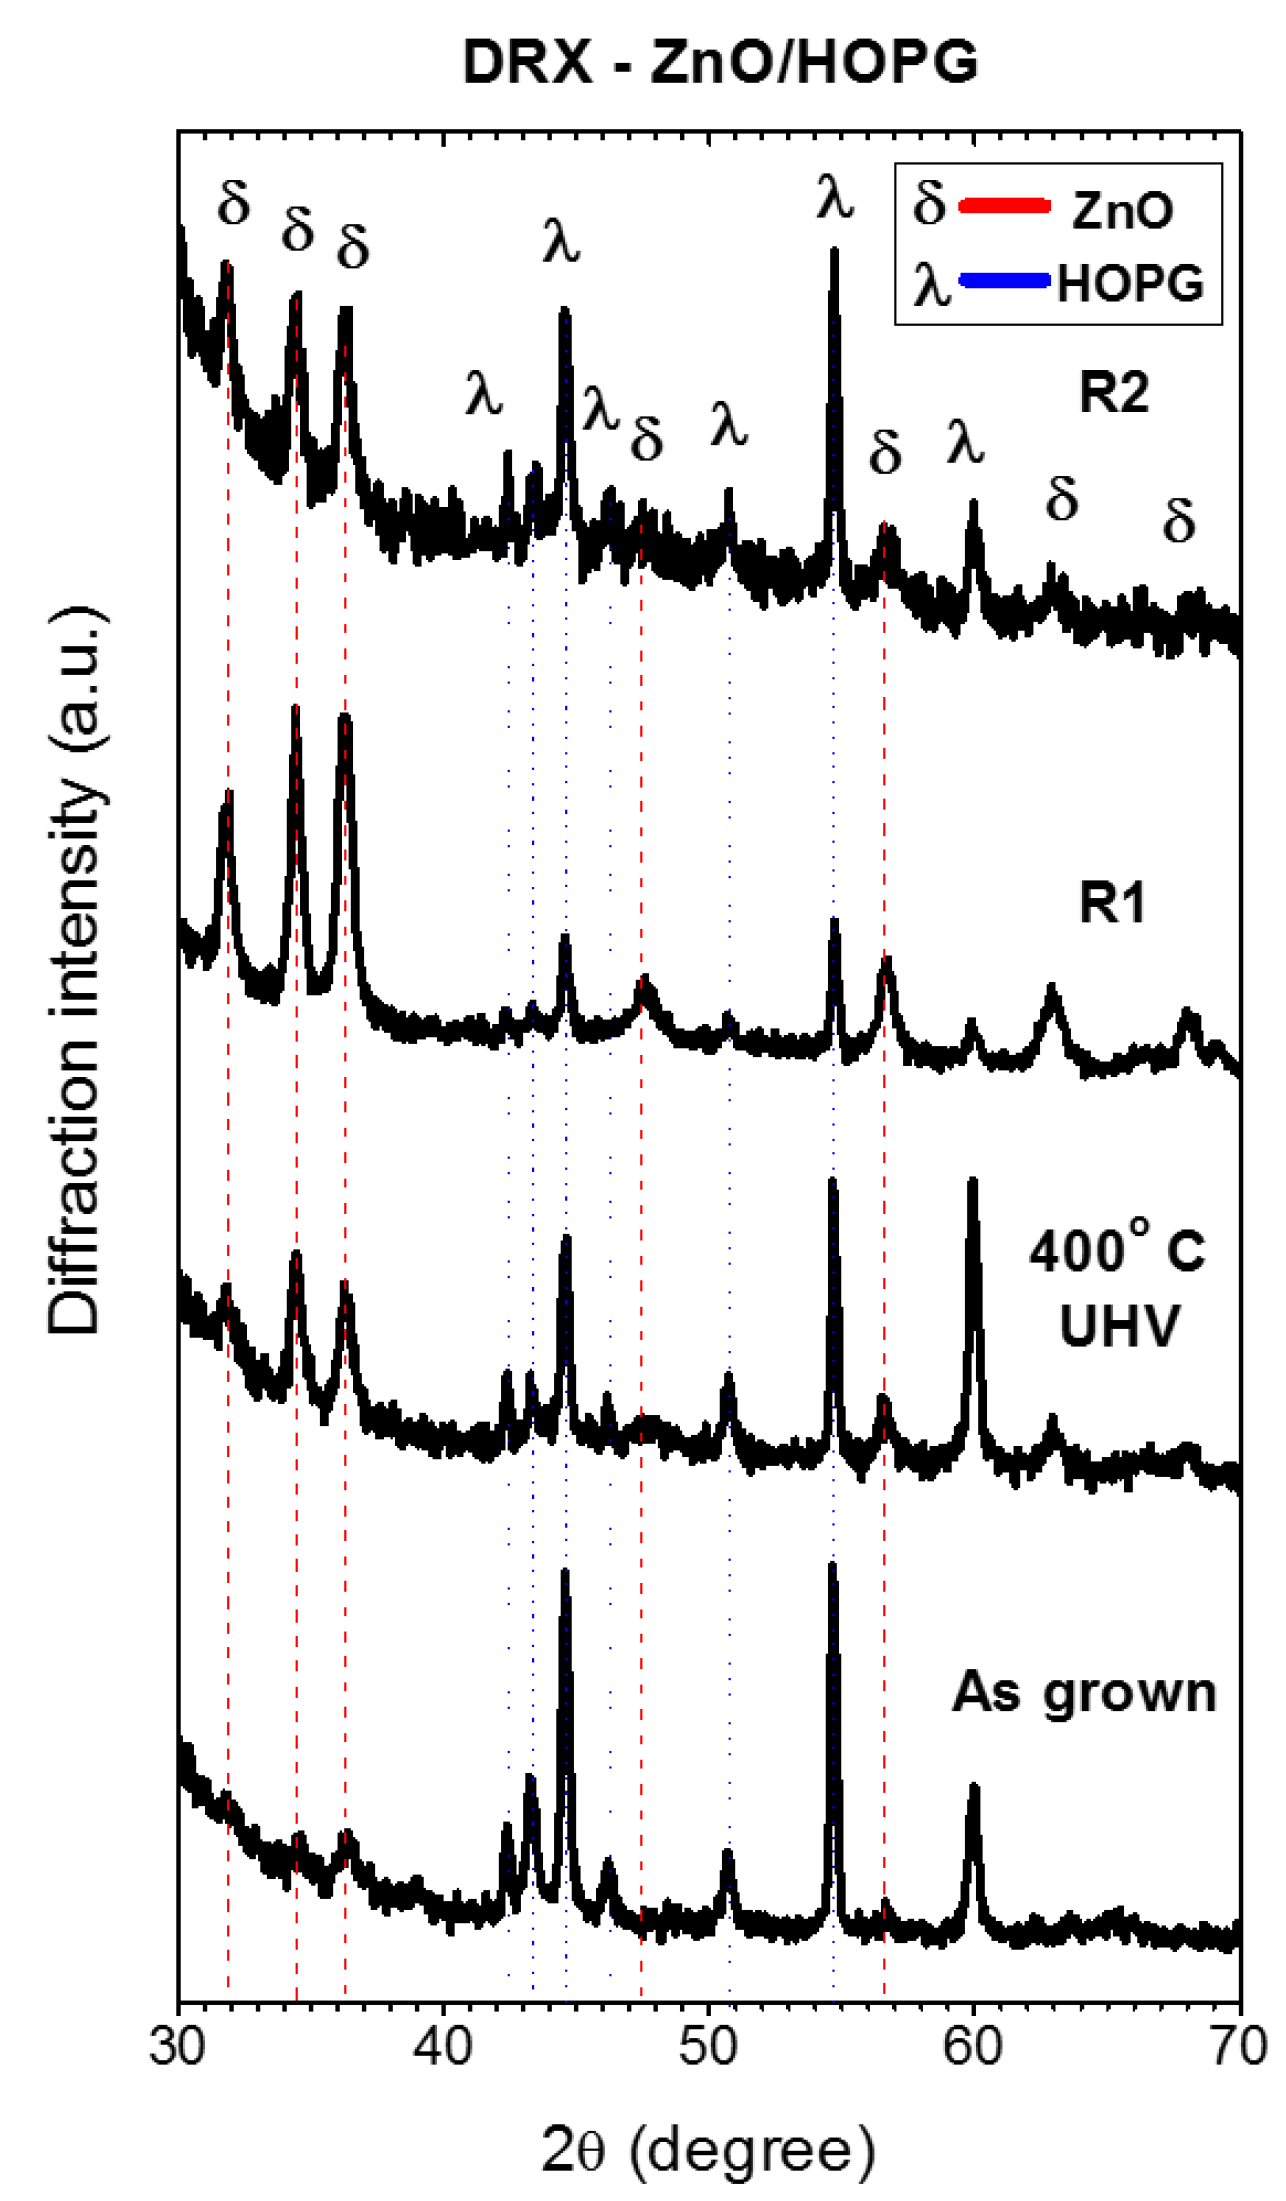
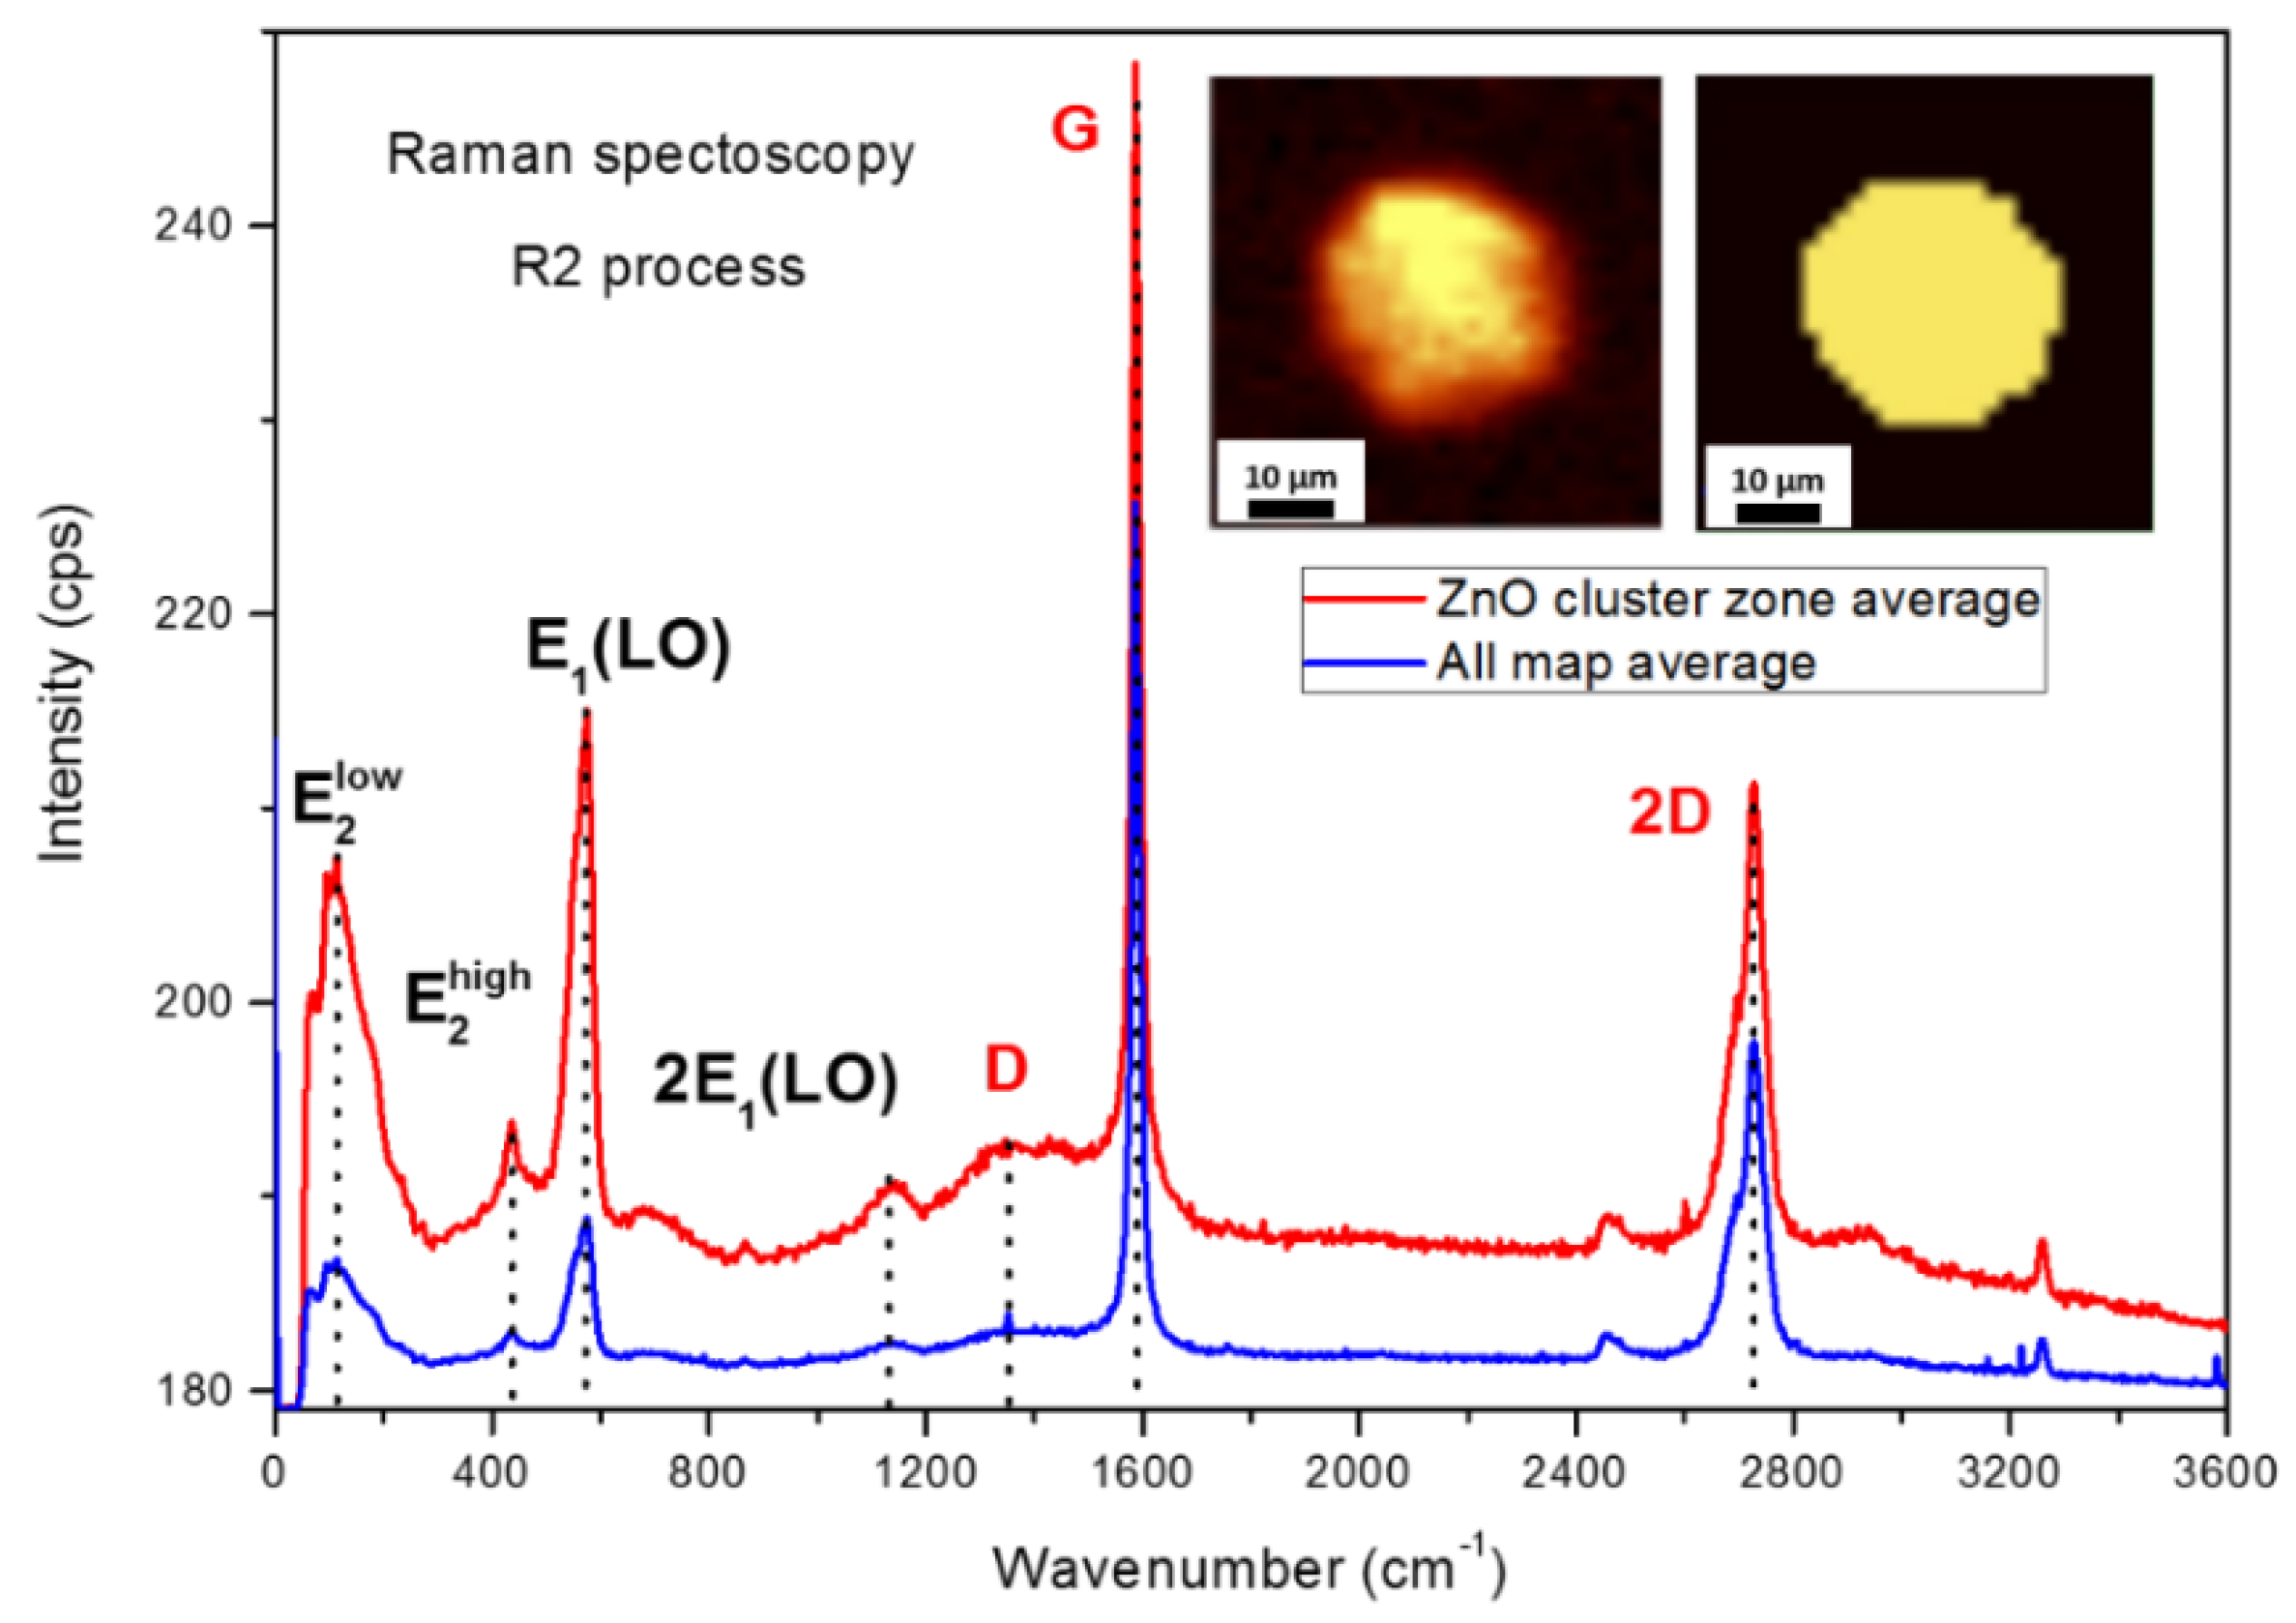
3.2. Thermal Re-Oxidation of ZnO/HOPG

ZnO/HOPG samples grown after 12 min of evaporation (0.2 Eq-ML, as deduced from the XPS intensities) were submitted to different thermal treatments: 400 °C-UHV, R1, and R2 (see Materials and Methods section). This same stage of growth was set for all treated samples to avoid misinterpretation of the results due to factors beyond the thermal treatment, such as possible differences on the size of the ZnO clusters (see Figure 1). In addition, as grown samples were exposed to 10−5 and 10−3 mbars of O2 at RT for comparison purposes. Figure 4a shows the Zn LMM Auger spectra of the as grown sample together with the five different processes described above. As it can be seen, although for all cases the oxide spectrum dominates, the as grown samples and those exposed to O2 at RT present two features at ~992 and ~995 eV characteristic of metallic state [22], indicating the development of defects and oxygen vacancies during growth. This situation is different from the results reported previously in [15], where stoichiometric ZnO was deposited. This could be probably related to the fact that the samples shown in Figure 4 were evaporated in a single step, thus reducing the total dose of O2 because, after each evaporation step, two minutes of oxygen exposure was added to ensure complete oxidation. However, these minor contributions disappear independently of the thermal treatment used. Figure 4b shows the O 1 s normalized spectra, including the one taken from the ZnO powder reference sample. As it can be appreciated, after the thermal treatment the main peak is shifted 0.5 eV to lower binding energies, fitting very well with the reference spectra. As will be discussed below, this shift is related to the recrystallization of ZnO and a reduction of defects. Nevertheless, the most striking effect consists on the intensity decrease of the shoulder associated to hydroxides or defects. In agreement with the previous Zn LMM Auger spectra and the discussion of Figure 2b,c, the reduction of this shoulder can be associated to the decrease of the number of oxygen vacancies.
On the other hand, Figure 4c shows changes on the percentage of the amount of oxygen in comparison to the as grown samples, confirming that these thermal treatments imply deeper oxidation of the ZnO together with the reduction of defects, even for the annealing under UHV conditions. In this particular case, the oxidation could be explained as a recrystallization of the sample with the hydroxyl groups available in the preparation chamber (in spite of the low base pressure). Further, Figure 4d shows (compared to the as grown samples) the Zn 2 p3/2 and O 1 s energy shifts and the S–O split of the Zn 2 p contribution. Both, Zn and O contributions shift to lower binding energies, although this shift is greater for the Zn 2 p (the C 1 s contribution showed no energy change). The S–O splitting also showed very similar behavior, reducing its value in a parallel way to the energy shift of the Zn 2 p3/2 and O 1 s contributions. These changes can be associated to an increment on the size of the ZnO structures. Therefore, from the XPS analysis it can be inferred that all thermal processes indicate a recrystallization of the ZnO clusters, where the amount of oxygen vacancies is reduced and the size of the ZnO is increased, possibly by an aggregation process. This is confirmed by the SEM images shown in Figure 5, where larger and more compact ZnO structures are found for the treated samples, especially in the case of R2 process, which shows the greatest difference in Figure 4d compared to the as grown samples. In the same line, we also report an increase of the total XPS signal from the substrate. However, no changes on the shape or binding energy of the graphite C 1 s region were observed (see Figure 4e). Finally, mass spectrometry measurements performed during the three thermal treatments did not show any variation on the residual gases in the vacuum chamber.
Next, we present the ex-situ Raman measurements for these experiments. The advantage of this technique compared to XPS is that it can be used to analyze the substrate under the ZnO clusters and follow any kind of chemical and structural changes on both, the ZnO deposits and the graphite. Figure 6a shows the Raman spectra taken at the red square areas drawn on the optical images of Figure 6b for the as grown and three samples submitted to the same thermal treatments as before. Two different behaviors can be distinguished. Regarding ZnO, the E2low band at ~99 cm−1 is ascribed to Zn sub-lattice, E2high at ~439 cm−1 is associated to oxygen vibrations, and E1(LO) at ~590 cm−1 is strongly affected by defects as oxygen vacancies [34]. In this way, the as grown sample presents a very broad band at 350–600 cm−1, indicating a very amorphous growth and the existence of a great number of oxygen vacancies defects, confirming the previous XPS conclusions. On the other hand, after the thermal treatment at 400 °C in UHV, this defect band decreases, thus resolving separately the E2high and E1(LO) contributions and appearing the second order 2E1(LO) peak at ~1145 cm−1. Therefore, these thermal treatments induce a clear recrystallization of the ZnO clusters. XRD patterns in Figure 7 confirm this recrystallization process. Firstly, as grown ZnO shows a diffraction pattern dominated by HOPG contributions, especially the (002) orientation (not shown here), with a very low intensity of ZnO contributions and with no clear preferred orientation. Besides, low intense (100) metallic Zn peaks (such as (100) at ~39°) seem to appear. This is in line with previous Zn LMM and Raman measurements that indicate a messy and defective oxide growth with important oxygen deficiencies. Moreover, ZnO diffraction peaks gain intensity after the thermal treatments, in correspondence with the Raman spectra behavior. Finally, the diffraction pattern shows multiple ZnO orientations with similar intensities, dismissing the idea of a preferred recrystallized direction. Focusing now on the HOPG substrate, the clean graphite Raman spectrum is defined by two main contributions, the G and 2D bands at ~1586 and 2727 cm−1, respectively [35]. The first one is associated with the doubly degenerate zone center E2g mode, while the 2D band is ascribed to the second order of the zone-boundary phonons. Initially, only these two bands were measured. It can be seen that a broad contribution at ~1350 cm−1, corresponding to the D band, only after the R2 process (coinciding with the most crystallized ZnO) appears. This broad contribution is associated to defective graphite. Therefore, according to Raman spectroscopy, it seems to be clear that also the HOPG substrate suffers changes after these thermal treatments (in contrast with XPS measurements). Finally, the optical images depicted in Figure 6b show a clear modification of the cluster being lightened after the thermal process, in agreement with the reduction on the number of defects and the corresponding increase of the expected transparency characteristic of ZnO.
Figure 8 and Figure 9 show in more detail these Raman measurements, as they are very useful to determine where and how this modification of the graphite is achieved. In this sense, Figure 8 shows two Raman spectra taken from the same marked area in Figure 6b for the R2 process sample. The blue spectrum (bottom) shows the average of the complete mapped area (shown in the left inset for the ZnO defective band intensity at 590 cm−1), whereas the red spectrum only shows the average of the cluster area (right inset shows the mask used for this purpose). The significant differences on signal intensity between both spectra occur because the Raman spectrometer focus was maintained constant on the ZnO clusters, being 2 μm higher than the graphite substrate. Nevertheless, in addition to the evident increase of the ZnO signal, the graphite D band corresponding to the defects clearly increases below the cluster in comparison to the rest of the free HOPG surface. Therefore, the modification of the substrate only takes place at the interface between ZnO and HOPG, being in this way invisible to XPS measurements during the early stages of growth. On the other hand, Figure 9a shows a series of punctual Raman spectra taken with different laser power doses on a specific ZnO cluster of the as grown ZnO/HOPG sample (see Figure 9b). In sake of clarity, the insert plot in Figure 9a shows the same normalized spectra focused on the ZnO region. For low laser powers (green, 0.5 mW), there is no modification of the initial defective ZnO (the graphite bands are hidden by the ZnO). However, at 2 mW power (blue), the ZnO defects band is now resolved with two contributions (E1high and E1(LO)), indicating that recrystallization has taken place. Hence, the local heating laser power plus atmospheric O2 induce a local recrystallization equivalent to that from the heating R1 and R2 process. In the case of the graphite, a very prominent D band appears, with a weaker and broader G band (2D band almost disappears). This new graphite spectrum is very similar to the oxidized graphite or coal [36]. This picture is completely different for the free HOPG surface using this same power (red spectrum), which shows no D band and a very strong and narrow G band. Consequently, there is no modification of graphite by this laser power, being the interaction with the recrystallized ZnO induced by the thermal heating of the laser the cause of graphite modification. Finally, if the power is increased to 8 mW the cluster is destroyed (see Figure 9b), decreasing the E1(LO) ZnO defect bands and recovering the good quality graphite. Therefore, these experiments confirm that graphite is modified by ZnO at the interface at the same time that ZnO is recrystallized.

4. Discussion

From the previous section, various observations can be highlighted: (1) As grown ZnO is amorphous, showing not-negligible amounts of defects. (2) The ZnO/graphite interface is inaccessible for XPS measurements due to the Volmer–Weber mode of growth of ZnO and the height of these structures (of the order of micron). (3) ZnO recrystallizes by different thermal treatments, decreasing the number of defects and increasing the size of the structures by aggregation process. No products derived from carbon gasification reaction were measured by mass spectroscopy. (4) Raman spectroscopy is sensitive to the ZnO/HOPG interface being able to follow changes on the graphite substrate during the recrystallization (especially when induced by high laser powers).
The previous experiments show that ZnO is less reactive than CoO on HOPG and does not lead to a patterning process by carbon gasification reaction of the HOPG. We point out two reasons for this. In first place, the morphology of the mode of growth is completely different. In case of CoO, the Stranski–Krastanov mode implies a CoO monolayer that maximizes the interface and thus the interaction between the metal oxide and the HOPG [20]. Further studies demonstrated that CoO acts as an oxygen pump into the graphite, weakening its sigma bonds and reducing the temperature at which nanopatterning can be performed [19,20]. This wetting layer is indispensable to weakening the graphite surface that will be patterned by the re-oxidized CoOx nanoparticles. Besides, these nanoparticles are of a nanometric size, thus, their movement can be promoted by moderately high temperatures such as 400 °C. On the contrary, ZnO nucleation on graphite is very difficult for the initial stages of growth, keeping free most of the surface of the terraces and hardly interacting with graphite thus conserving the strength of the sigma bonds. In addition, ZnO clusters are much bigger than the CoO nanoparticles. It is interesting to note that the temperatures used in this work cannot induce their movement along the HOPG surface (no channels were measured by AFM after the thermal processes R1 or R2). Nevertheless, systems with low density of ZnO structures, as those shown here, find applications on different fields, as electronic devices [37] and photocatalysis [38].
The second factor that prevents the same behavior is the lower reactivity of Zn and ZnO compared to Co and cobalt oxides. The reason of this is the electronic configuration of both elements: the complete 3 d orbitals of Zn barely participate on the bonds, as its electronic configuration is much more stable than for Co. In this sense, although a low intense interaction between ZnO and HOPG can be observed, it is not enough to induce a weakening of the graphite lattice at room temperature nor to induce a carbon gasification reaction during the thermal treatments. Esconjauregu et al. [39] showed how, for the growth of carbon nanotubes, the catalytic activity of metals depends strongly on their d-states: few d-vacancies (i.e., Co) provide the best performance, while metals with full d-orbitals (i.e., Zn) only show activity at a nanoscale level. Nevertheless, this ZnO–graphite interaction is not negligible, and it is clear from Figure 8 and Figure 9 that ZnO promotes defects and oxidization on graphite. This effect should be taken into account in ZnO/graphitic heterostructures, such as composites of ZnO/graphene and ZnO/graphene-oxide (ZnO/GO) and ZnO/graphene stacked systems.
On the other hand, ZnO deposition on HOPG presents important differences with respect to the growth on graphene supported on polycrystalline copper substrates. Although it is true that the mode of growth is equivalent (e.g., Wolver-Weber), the size of these structures is completely different (micrometric against nanometric) [15]. Furthermore, ZnO/graphene/Cu samples show deposition rates strongly dependent on the stage of the reaction mechanism that finally induces the electronic decoupling of graphene by the formation of a thin layer of Cu2O below the graphene. During this reaction, deposited Zn remains in the form of metallic nanoclusters [14]. Therefore, the reactivity of Zn/ZnO does not depend solely on its electronic configuration but also on the type and reactivity of the substrate. In spite of the equivalent uppermost atomic layer, these experiments confirm again how HOPG is more inert than graphene on Cu, thus its interaction with ZnO can only be observed by applying high temperatures.

5. Conclusions

ZnO clusters on HOPG have been submitted at the same thermal treatments than 2 Eq-ML of CoO grown on HOPG. Although no carbon gasification reaction was observed with ZnO, a clear interaction between ZnO and HOPG has been observed after the thermal processes. On the one side, ZnO recrystallizes, decreasing the number of oxygen defects and increasing the cluster size by an aggregation process. On the other hand, oxidation and defect development of the graphite substrate are promoted by interaction with ZnO at the interface. The observed differences between CoO and ZnO can be explained by two facts: the morphology resulting from the mode of growth and the lower Zn/ZnO reactivity. The very different chemical interactions between different graphitic substrates with an equivalent atomic uppermost layer (HOPG and graphene/Cu substrates) highlight the cross relations between the deposited material, substrates, and environment. Finally, the results for ZnO/HOPG interactions will facilitate a better understanding of ZnO/graphitic heterostructures and possible issues regarding their operation under extreme conditions.

Author Contributions

Data curation, C.M.; Formal analysis, C.M., A.d.C., J.M. and P.P.; Data curation, A.C. and J.M.; Funding acquisition, L.S.; Supervision, L.S.; Writing—original draft, C.M.; Writing—review and editing, L.S. All authors have read and agreed to the published version of the manuscript.

Funding

This investigation was funded by the MINECO of Spain through the FIS2015-67367-C2-1-P project and by the Comunidad de Madrid through the NANOMAGCOST-CM P2018/NMT4321 project. One of the authors (C.M.) thanks MCIU for the FPU14/02020 grant.

Acknowledgments

We thank SEGAINVEX-UAM and SIdI-UAM for their technical support.

Conflicts of Interest

The authors declare no conflict of interest

References

  1. Özgür, Ü.; Alivov, Y.I.; Liu, C.; Teke, A.; Reshchikov, M.A.; Dogán, S.; Avrutin, V.; Cho, S.-J.; Morkoç, H. A comprehensive review of ZnO materials and devices. J. Appl. Phys. 2005, 98, 041301. [Google Scholar] [CrossRef] [Green Version]
  2. Ataev, B.M.; Bagamadova, A.M.; Djabrailov, A.M.; Mamedo, V.V.; Rabadanov, R.A. Highly conductive and transparent Ga-doped epitaxial ZnO films on sapphire by CVD. Thin Solid Films 1995, 260, 19–20. [Google Scholar] [CrossRef]
  3. Kim, H.; Gilmore, C.M.; Horwitz, J.S.; Piqué, A.; Murata, H.; Kushto, G.P.; Schlaf, R.; Kafafi, Z.H. Transparent conducting aluminum-doped zinc oxide thin films for organic light-emitting devices. Appl. Phys. Lett. 2000, 76, 259. [Google Scholar] [CrossRef]
  4. Zhou, X.H.; Hu, Q.-H.; Fu, Y. First-principles LDA+U studies of the In-doped ZnO transparent conductive oxide. J. Appl. Phys. 2008, 104, 063703. [Google Scholar] [CrossRef]
  5. Rousset, J.; Saucedo, E.; Lincot, D. Extrinsic doping of electrodeposited zinc oxide films by chlorine for transparent conductive oxide applications. Chem. Mater. 2009, 21, 534–540. [Google Scholar] [CrossRef]
  6. Klingshirn, C. ZnO: From basics towards applications. Phys. Status Solidi 2007, 244, 3027–3073. [Google Scholar] [CrossRef]
  7. Upadhyay, R.K.; Soin, N.; Roy, S.S. Role of graphene/metal oxide composites as photocatalysts, adsorbents and disinfectants in water treatment: A review. RSC Adv. 2014, 4, 3823–3851. [Google Scholar] [CrossRef]
  8. Su, Y.; Li, S.; Wu, D.; Zhang, F.; Liang, H.; Gao, P.; Cheng, C.; Feng, X. Two-Dimensional carbon-coated graphene/metal oxide hybrids for enhanced lithium storage. ACS Nano 2012, 6, 8349–8356. [Google Scholar] [CrossRef] [PubMed]
  9. Saranya, M.; Ramachandran, R.; Wang, F. Graphene-zinc oxide (G-ZnO) nanocomposite for electrochemical supercapacitor applications. J. Sci. Adv. Mater. Devices 2016, 1, 454–460. [Google Scholar] [CrossRef] [Green Version]
  10. Raizada, P.; Sudhaik, A.; Singh, P. Photocatalytic water decontamination using graphene and ZnO coupled photocatalysts: A review. Mater. Sci. Energy Technol. 2019, 2, 509–525. [Google Scholar] [CrossRef]
  11. Lonkar, S.P.; Pillai, V.; Abdala, A. Solvent-free synthesis of ZnO-graphene nanocomposite with superior photocatalytic activity. Appl. Surf. Sci. 2019, 465, 1107–1113. [Google Scholar] [CrossRef]
  12. Anand, K.; Singh, O.; Singh, M.P.; Kaur, J.; Singh, R.C. Hydrogen sensor based on graphene/ZnO nanocomposite. Sens. Actuators B Chem. 2014, 195, 409–415. [Google Scholar] [CrossRef]
  13. Tavakoli, M.M.; Tavakoli, R.; Yadav, P.; Kong, J. A graphene/ZnO electron transfer layer together with perovskite passivation enables highly efficient and stable perovskite solar cells. J. Mater. Chem. A 2019, 7, 679–686. [Google Scholar] [CrossRef] [Green Version]
  14. Morales, C.; Urbanos, F.J.; del Campo, A.; Leinen, D.; Granados, D.; Rodríguez, M.A.; Soriano, L. Electronic decoupling of graphene from copper induced by deposition of ZnO: A complex substrate/graphene/deposit/environment interaction. Adv. Mater. Interfaces 2020, 1902062. [Google Scholar] [CrossRef]
  15. Morales, C.; Black, A.; Urbanos, F.J.; Granados, D.; Méndez, J.; del Campo, A.; Yubero, F.; Soriano, L. Study of the interface of the early stages of growth under quasi-equilibrium conditions of ZnO on graphene/Cu and graphite. Adv. Mater. Interfaces 2019, 6, 1801689. [Google Scholar] [CrossRef]
  16. Konishi, S.; Sugimoto, W.; Murakami, Y.; Takasu, Y. Catalytic creation of channels in the surface layers of highly oriented pyrolytic graphite by Cobalt nanoparticles. Carbon 2006, 44, 2338–2340. [Google Scholar] [CrossRef]
  17. Datta, S.S.; Strachan, D.R.; Khamis, S.M.; Johnson, A.T. Crystallographic etching of few-layer graphene. Nano Lett. 2008, 8, 1912–1917. [Google Scholar] [CrossRef] [Green Version]
  18. Díaz-Fernández, D.; Méndez, J.; del Campo, A.; Mossanek, R.J.O.; Abbate, M.; Rodríguez, M.A.; Domínguez-Cañizares, G.; Bomatí-Miguel, O.; Gutiérrez, A.; Soriano, L. Nanopatterning on highly oriented pyrolytic graphite surfaces promoted by cobalt oxides. Carbon 2015, 85, 89–98. [Google Scholar] [CrossRef]
  19. Morales, C.; Díaz-Fernández, D.; Prieto, P.; Lu, Y.H.; Kersell, H.; del Campo, A.; Escudero, C.; Pérez-Dieste, V.; Ashby, P.; Méndez, J.; et al. In situ study of the carbon gasification reaction of highly oriented pyrolytic graphite promoted by cobalt oxides and the novel nanostructures appeared after reaction. Carbon 2020, 158, 588–597. [Google Scholar] [CrossRef]
  20. Morales, C.; Díaz-Fernández, D.; Mossanek, R.J.O.; Abbate, M.; Méndez, J.; Pérez-Dieste, V.; Escudero, C.; Rubio-Zuazo, J.; Prieto, P.; Soriano, L. Controlled ultra-thin oxidation of Graphite promoted by cobalt oxides: Influence of the initial 2D CoO wetting layer. Appl. Surf. Sci. 2009, 509, 145118. [Google Scholar] [CrossRef]
  21. Horcas, I.; Fernández, R.; Gómez-Rodríguez, J.M.; Colchero, J.; Gómez Herrero, J.; Baró, A.M. WSXM: A software for scanning probe microscopy and a tool for nanotechnology. Rev. Sci. Instrum. 2007, 78, 013705. [Google Scholar] [CrossRef] [PubMed]
  22. Deroubaix, G.; Marcus, P. X-ray photoelectron spectroscopy analysis of copper and zinc oxides and sulphides. Surf. Interface Anal. 1992, 18, 39–46. [Google Scholar] [CrossRef]
  23. Díaz-Fernández, D.; Salas, E.; Méndez, J.; Mossanek, R.J.O.; Abbate, M.; Morales, C.; Domínguez-Cañizares, G.; Castro, G.R.; Gutiérrez, A.; Soriano, L. Ultra-thin CoO films grown on different oxide substrates: Size and support effects and chemical stability. J. Alloys Compd. 2018, 758, 5–13. [Google Scholar] [CrossRef]
  24. Rodriguez, J.A.; Campbell, R.A.; Goodman, D.W. Interaction of ultrathin films of copper with rhodium (100) and ruthenium(0001): An XPS study. J. Phys. Chem. 1991, 95, 2477–2483. [Google Scholar] [CrossRef]
  25. Wu, Y.; Garfunkel, E.; Madey, T.E. Initial stages of Cu growth on ordered Al2O3 ultrathin films. J. Vac. Sci. Technol. A Vac. Surf. Films 1996, 14, 1662–1667. [Google Scholar] [CrossRef]
  26. Kowalczyk, S.P.; Ley, L.; McFeely, F.R.; Shirley, D.A. Multiplet splitting of the manganese 2 p and 3 p levels in MnF2, single crystals. Phys. Rev. B 1975, 11, 1721–1727. [Google Scholar] [CrossRef] [Green Version]
  27. Dupin, J.-C.; Gonbeau, D.; Vinatier, P.; Levasseur, A. Systematic XPS studies of metal oxides, hydroxides and peroxides. Phys. Chem. Chem. Phys. 2000, 2, 1319–1324. [Google Scholar] [CrossRef]
  28. Benito, N.; Recio-Sánchez, G.; Escobar-Galindo, R.; Palacio, C. Formation of antireflection Zn/ZnO core-shell nano-pyramidal arrays by O2+ ion bombardment of Zn surfaces. Nanoscale 2017, 9, 14201–14207. [Google Scholar] [CrossRef]
  29. Kotsis, K.; Staemmler, V. Ab initio calculations of the O 1 s XPS spectra of ZnO and Zn oxo compounds. Phys. Chem. Chem. Phys. 2006, 8, 1490–1498. [Google Scholar] [CrossRef]
  30. Rousseau, B.; Estrade-Szwarckopf, H.; Thoman, A.-L.; Brault, P. Stable C-atom displacements on HOPG surface under plasma low-energy argon-ion bombardment. Appl. Phys. A 2003, 77, 591–597. [Google Scholar] [CrossRef]
  31. Yang, D.; Velamakanni, A.; Bozoklu, G.; Park, S.; Stoller, M.; Piner, R.D.; Stankovich, S.; Jung, I.; Field, D.A.; Ventrice, C.A., Jr.; et al. Chemical analysis of graphene oxide films after heat and chemical treatments by X-ray photoelectron and Micro-Raman spectroscopy. Carbon 2009, 47, 145–152. [Google Scholar] [CrossRef]
  32. Haubner, K.; Murawski, J.; Olk, P.; Eng, L.M.; Ziegler, C.; Adolphi, B.; Jaehne, E. The route to functional graphene oxide. Chem. Phys. Chem. 2010, 11, 2131–2139. [Google Scholar] [CrossRef] [PubMed]
  33. Webb, M.J.; Palmgren, P.; Pal, P.; Karis, O.; Grennberg, H. A simple method to produce almost perfect graphene on highly oriented pyrolytic graphite. Carbon 2011, 49, 3242–3249. [Google Scholar] [CrossRef] [Green Version]
  34. Scepanovic, M.; Grujic-Brojcin, M.; Vojisavljevic, K.; Bernikcm, S.; Sreckovic, T. Raman study of structural disorder in ZnO nanopowders. J. Raman Spectrosc. 2010, 41, 914–921. [Google Scholar] [CrossRef]
  35. Reich, S.; Thomsen, C. Raman spectroscopy of graphite. Philos. Trans. R. Soc. Lond. Ser. A Math. Phys. Eng. Sci. 2004, 362, 2271–2288. [Google Scholar] [CrossRef]
  36. Kelemen, S.R.; Fang, H.L. Maturity trends in Raman spectra from kerogen and coal. Energy Fuels 2001, 15, 653–658. [Google Scholar] [CrossRef]
  37. Errico, V.; Arrabito, G.; Plant, S.R.; Medaglia, P.G.; Palmer, R.E.; Falconi, C. Chromium inhibition and size-selected Au nanocluster catalysis for the solution growth of low-density ZnO nanowires. Sci. Rep. 2015, 5, 12336. [Google Scholar] [CrossRef]
  38. Gayathri, S.; Jayabal, P.M.; Kottaisamy, M.; Ramakrishnan, V. Synthesis of ZnO decorated graphene nanocomposite for enhanced photocatalytic properties. J. Appl. Phys. 2014, 115, 173504. [Google Scholar] [CrossRef]
  39. Esconjauregui, S.; Whelan, C.M.; Maex, K. The reasons why metals catalyze the nucleation and growth of carbon nanotubes and other carbon nanomorphologies. Carbon 2009, 47, 659–669. [Google Scholar] [CrossRef]
Figure 1. (a) XPS Zn 2 p spectra as a function of the coverage and deposition time for the growth of ZnO on highly oriented pyrolytic graphite (HOPG); (b) Zn 2 p3/2 and Zn 2 p1/2 binding energies as a function of deposition time; (c) Zn 2 p spin-orbit splitting (S–O) as a function of the deposition time. Insert: AFM detail of a ZnO nanostructure grown along a HOPG step after 2 min of deposition.
Coatings 10 00401 g001
Figure 2. (a) XPS O 1 s spectra as a function of the coverage and deposition time for the growth of ZnO on HOPG. (b) XPS O 1 s fitting of ZnO on HOPG after 30 min of deposition; (c) relative intensities of O–Zn and defects/OH components as a function of the deposition time.
Coatings 10 00401 g002
Figure 3. (a) XPS C 1 s fitted spectra as a function of the coverage for the growth of ZnO on HOPG; (b) normalized XPS C 1 s spectra as a function of the coverage and deposition time; (c) relative intensities of the C 1 s spectra fitting components as a function of deposition time.
Coatings 10 00401 g003
Figure 4. (a) Auger Zn LMM XPS spectra as a function of the thermal treatment; (b) normalized XPS O 1 s spectra for as grown ZnO/HOPG sample and after different thermal treatments; (c) O–Zn component increase for the O 1 s spectra as a function of the thermal treatment; (d) S–O splitting (black square, left axis) and O 1 s and Zn 2 p3/2 shifts (right axis, red circle and green rhombuses, respectively) as a function of the thermal treatment; (e) normalized XPS C 1 s spectra for clean HOPG and ZnO/HOPG samples after different thermal treatments.
Coatings 10 00401 g004
Figure 5. 10,000× magnification SEM images for as grown and thermal treated ZnO/HOPG samples.
Coatings 10 00401 g005
Figure 6. (a) Average Raman spectra for each thermal treatment. Main ZnO bands (black labels) and graphite bands (red labels) are indicated; (b) optical images of ZnO clusters on HOPG after different thermal treatments. Red squares indicate the mapped area.
Coatings 10 00401 g006
Figure 7. X-ray diffraction patterns of as grown and thermal treated ZnO/HOPG samples. The samples details are given in the figure. Some HOPG (λ, 00-012-0212) and ZnO (δ, 01-075-1526) diffraction peaks are also indicated.
Coatings 10 00401 g007
Figure 8. Averaged Raman spectra (blue) for the R2 thermal treatment at 10−3 mbar for the complete mapped zone and averaged Raman spectra (red) applying a mask only in the ZnO cluster area. Main ZnO bands (black labels) and graphite bands (red labels) are indicated. Inserts: left: mapping at ~590 cm−1 (E1(LO) ZnO band) of the whole area; right: mask applied to the ZnO clusters.
Coatings 10 00401 g008
Figure 9. (a) Averaged Raman spectra sample of as grown ZnO/HOPG at different laser powers. Red spectrum depicts clean HOPG of this sample; (b) optical images of the mapped area before (top) and after (bottom) high laser power (8 mW) exposure.
Coatings 10 00401 g009

