Static and Dynamic Magnetic Properties of FeGa/FeNi (FeNi/FeGa) Bilayer Structures


Abstract
1. Introduction
2. Materials and Methods
2.1. Preparation
2.2. Characterization
3. Results and Discussion
3.1. Structure and Morphology of FeNi/FeGa(FeGa/FeNi) Bilayer
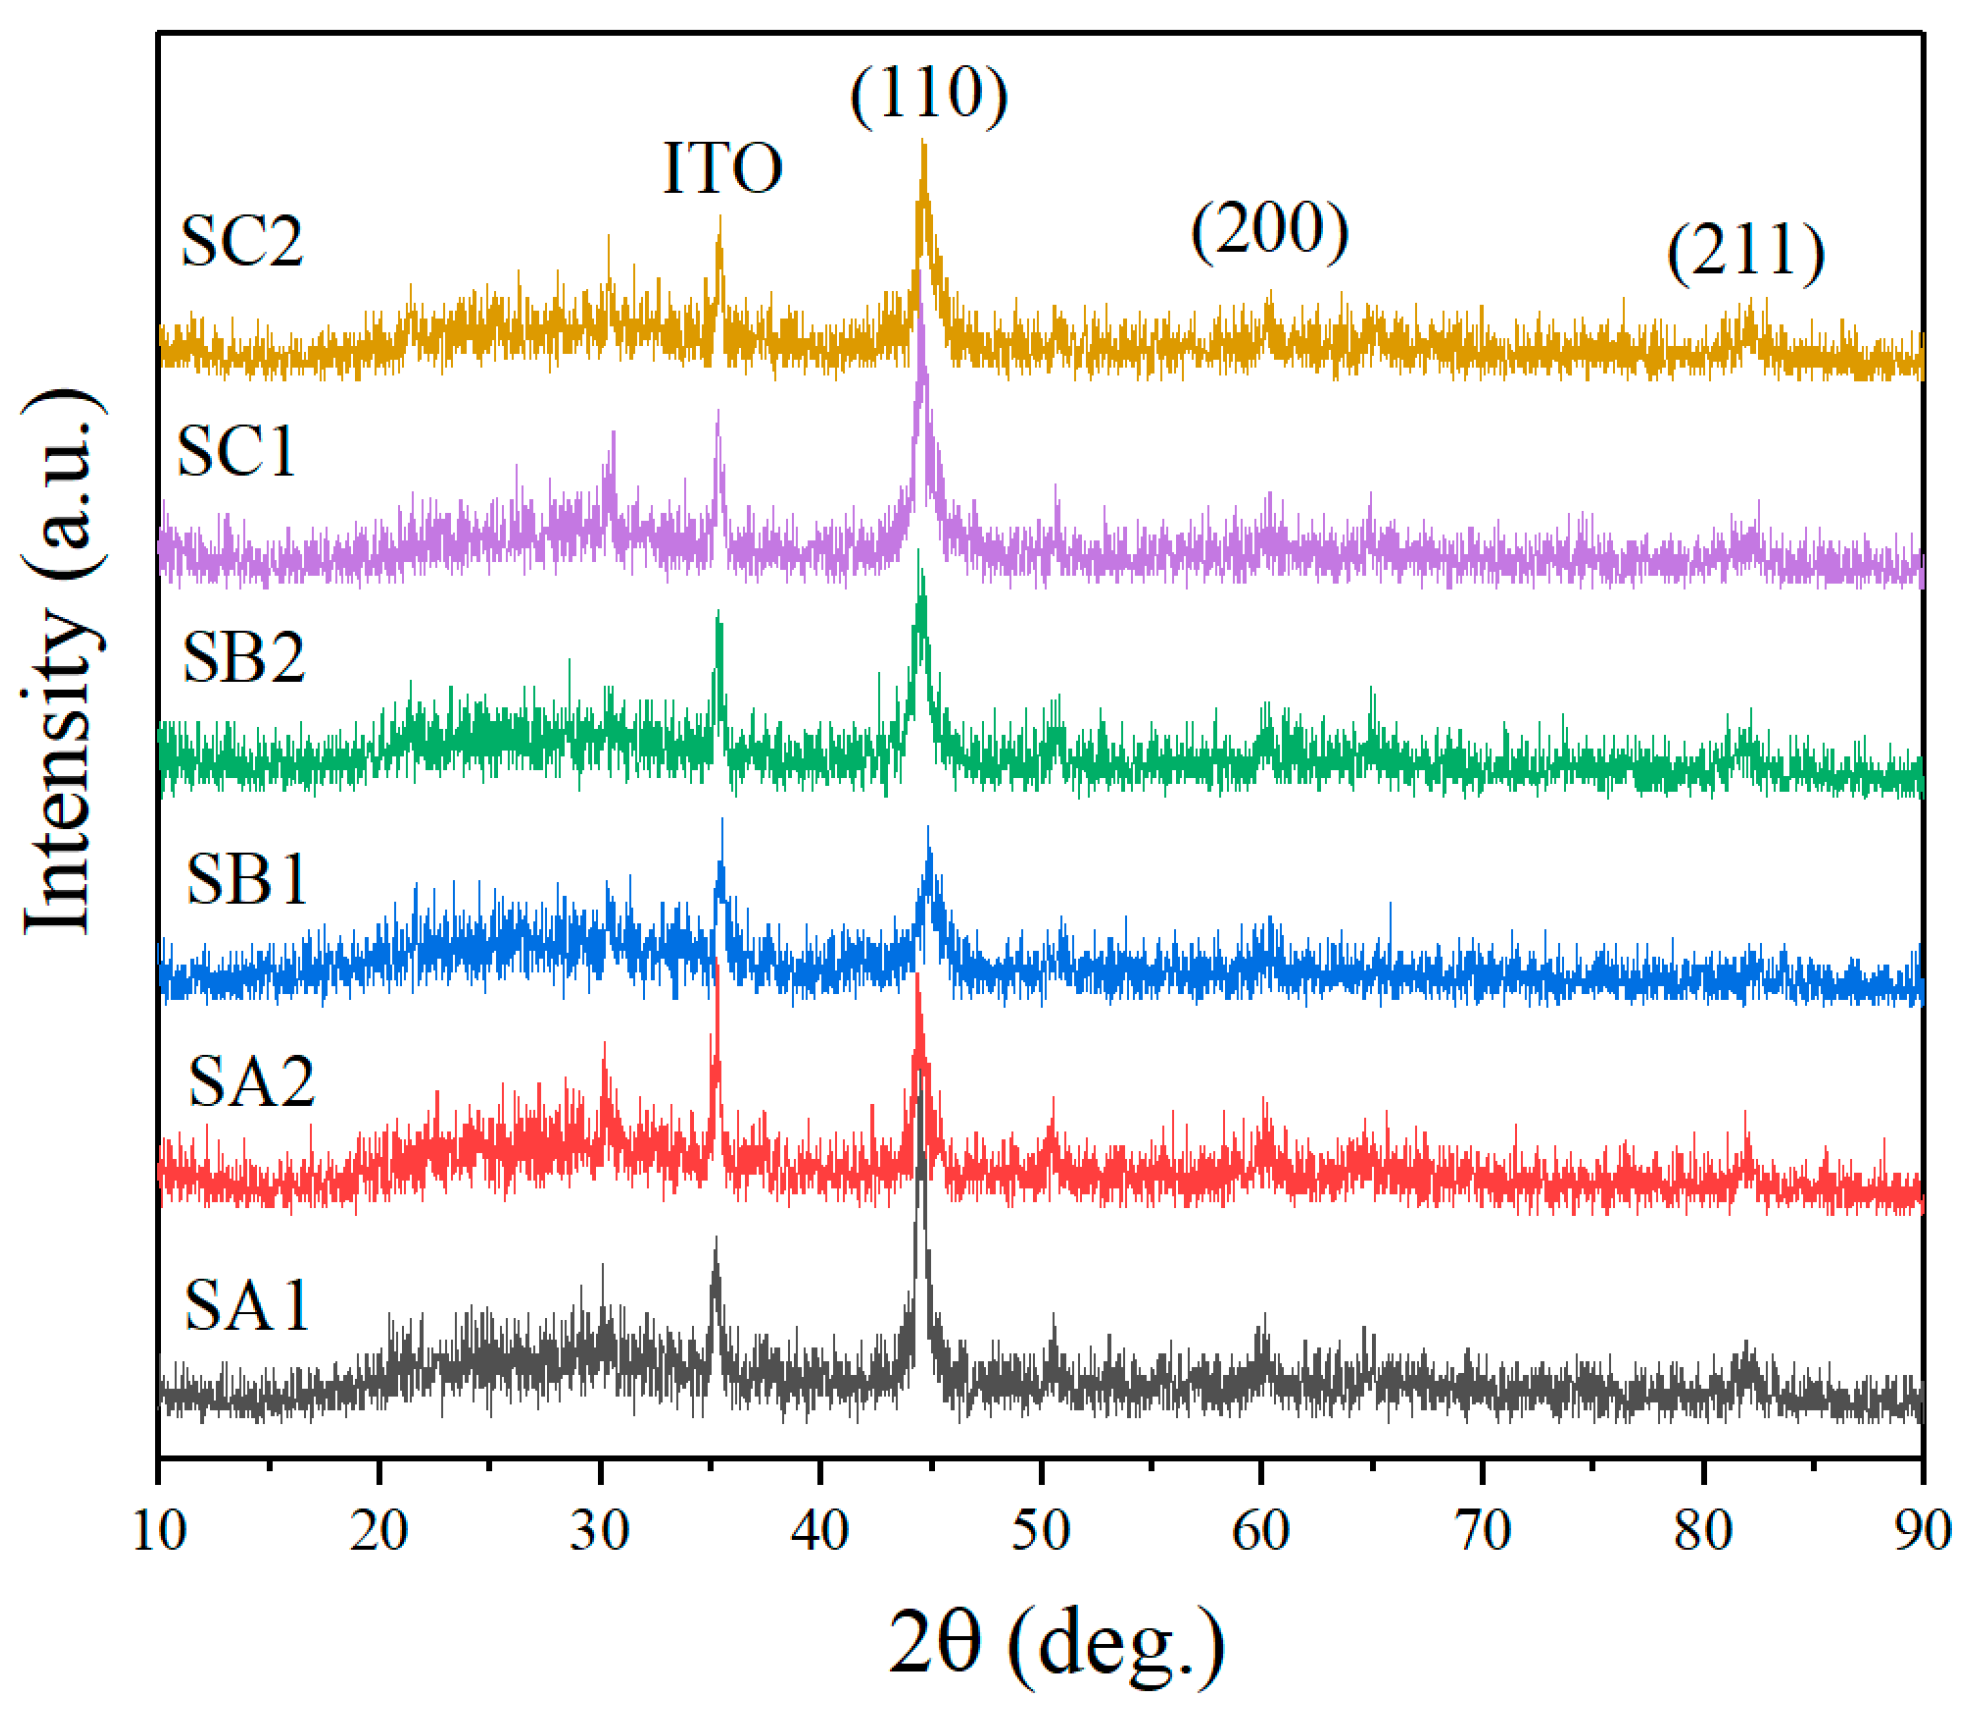
3.1.1. Structure
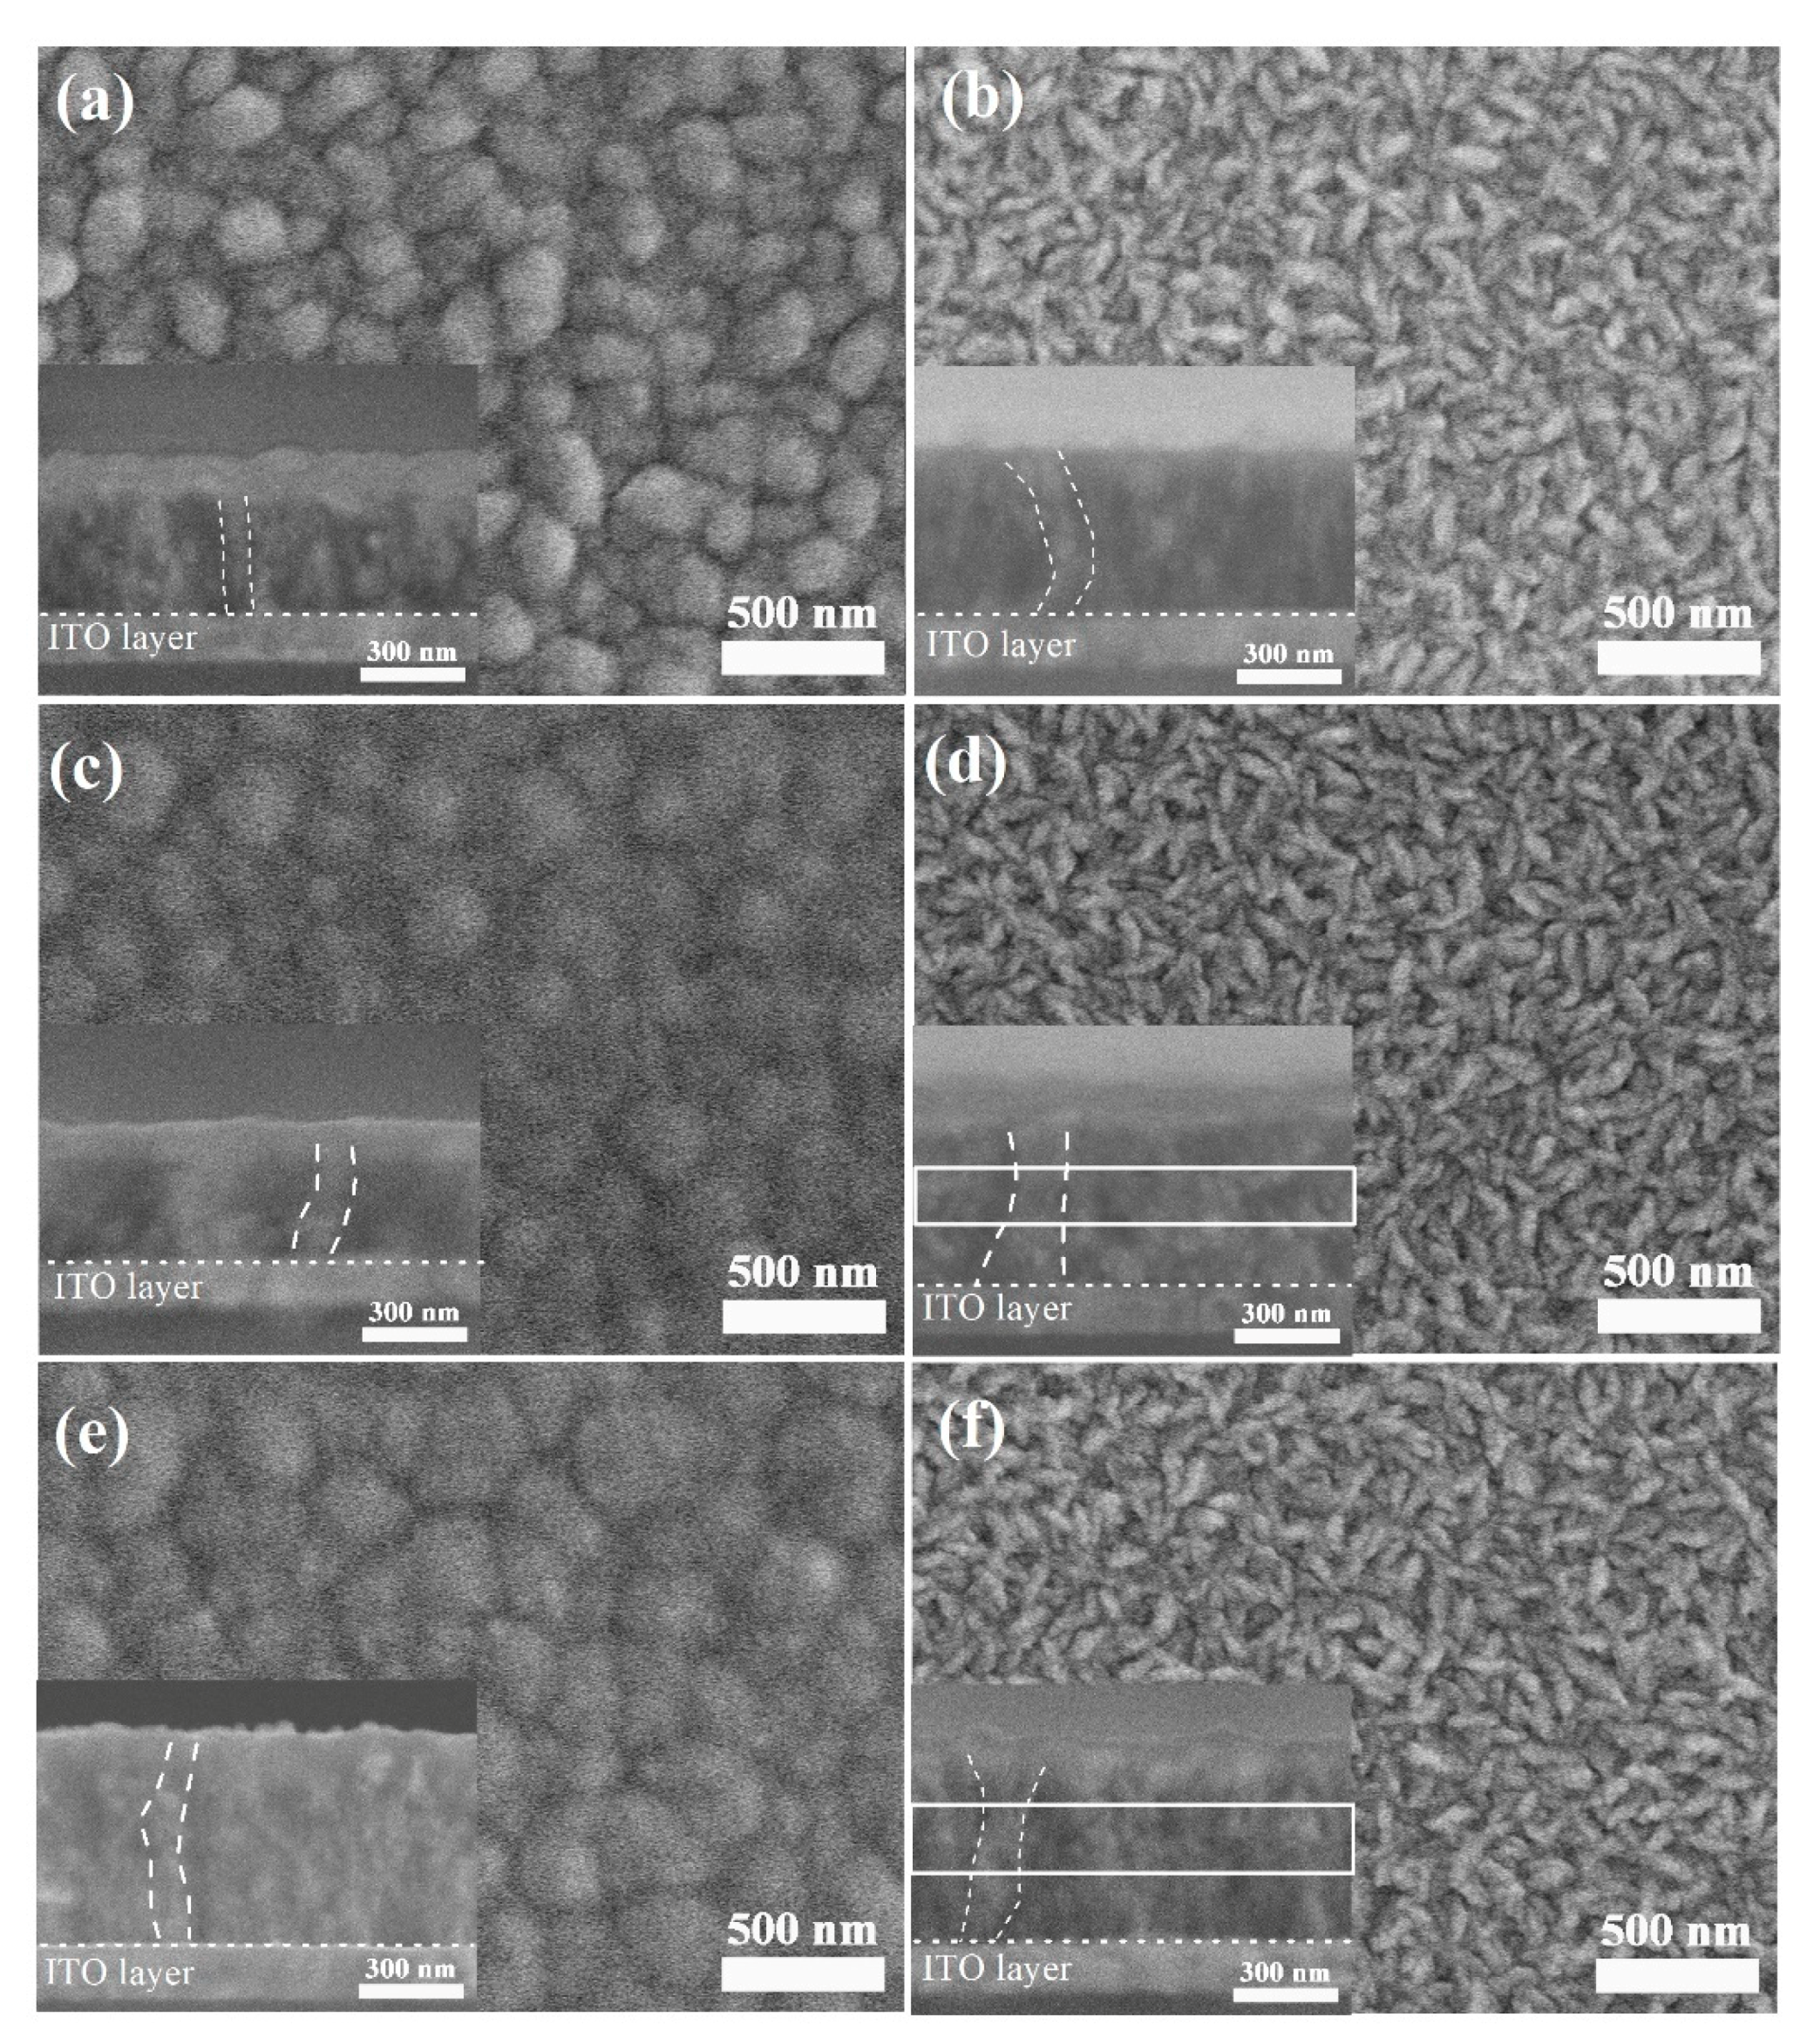
3.1.2. Morphology
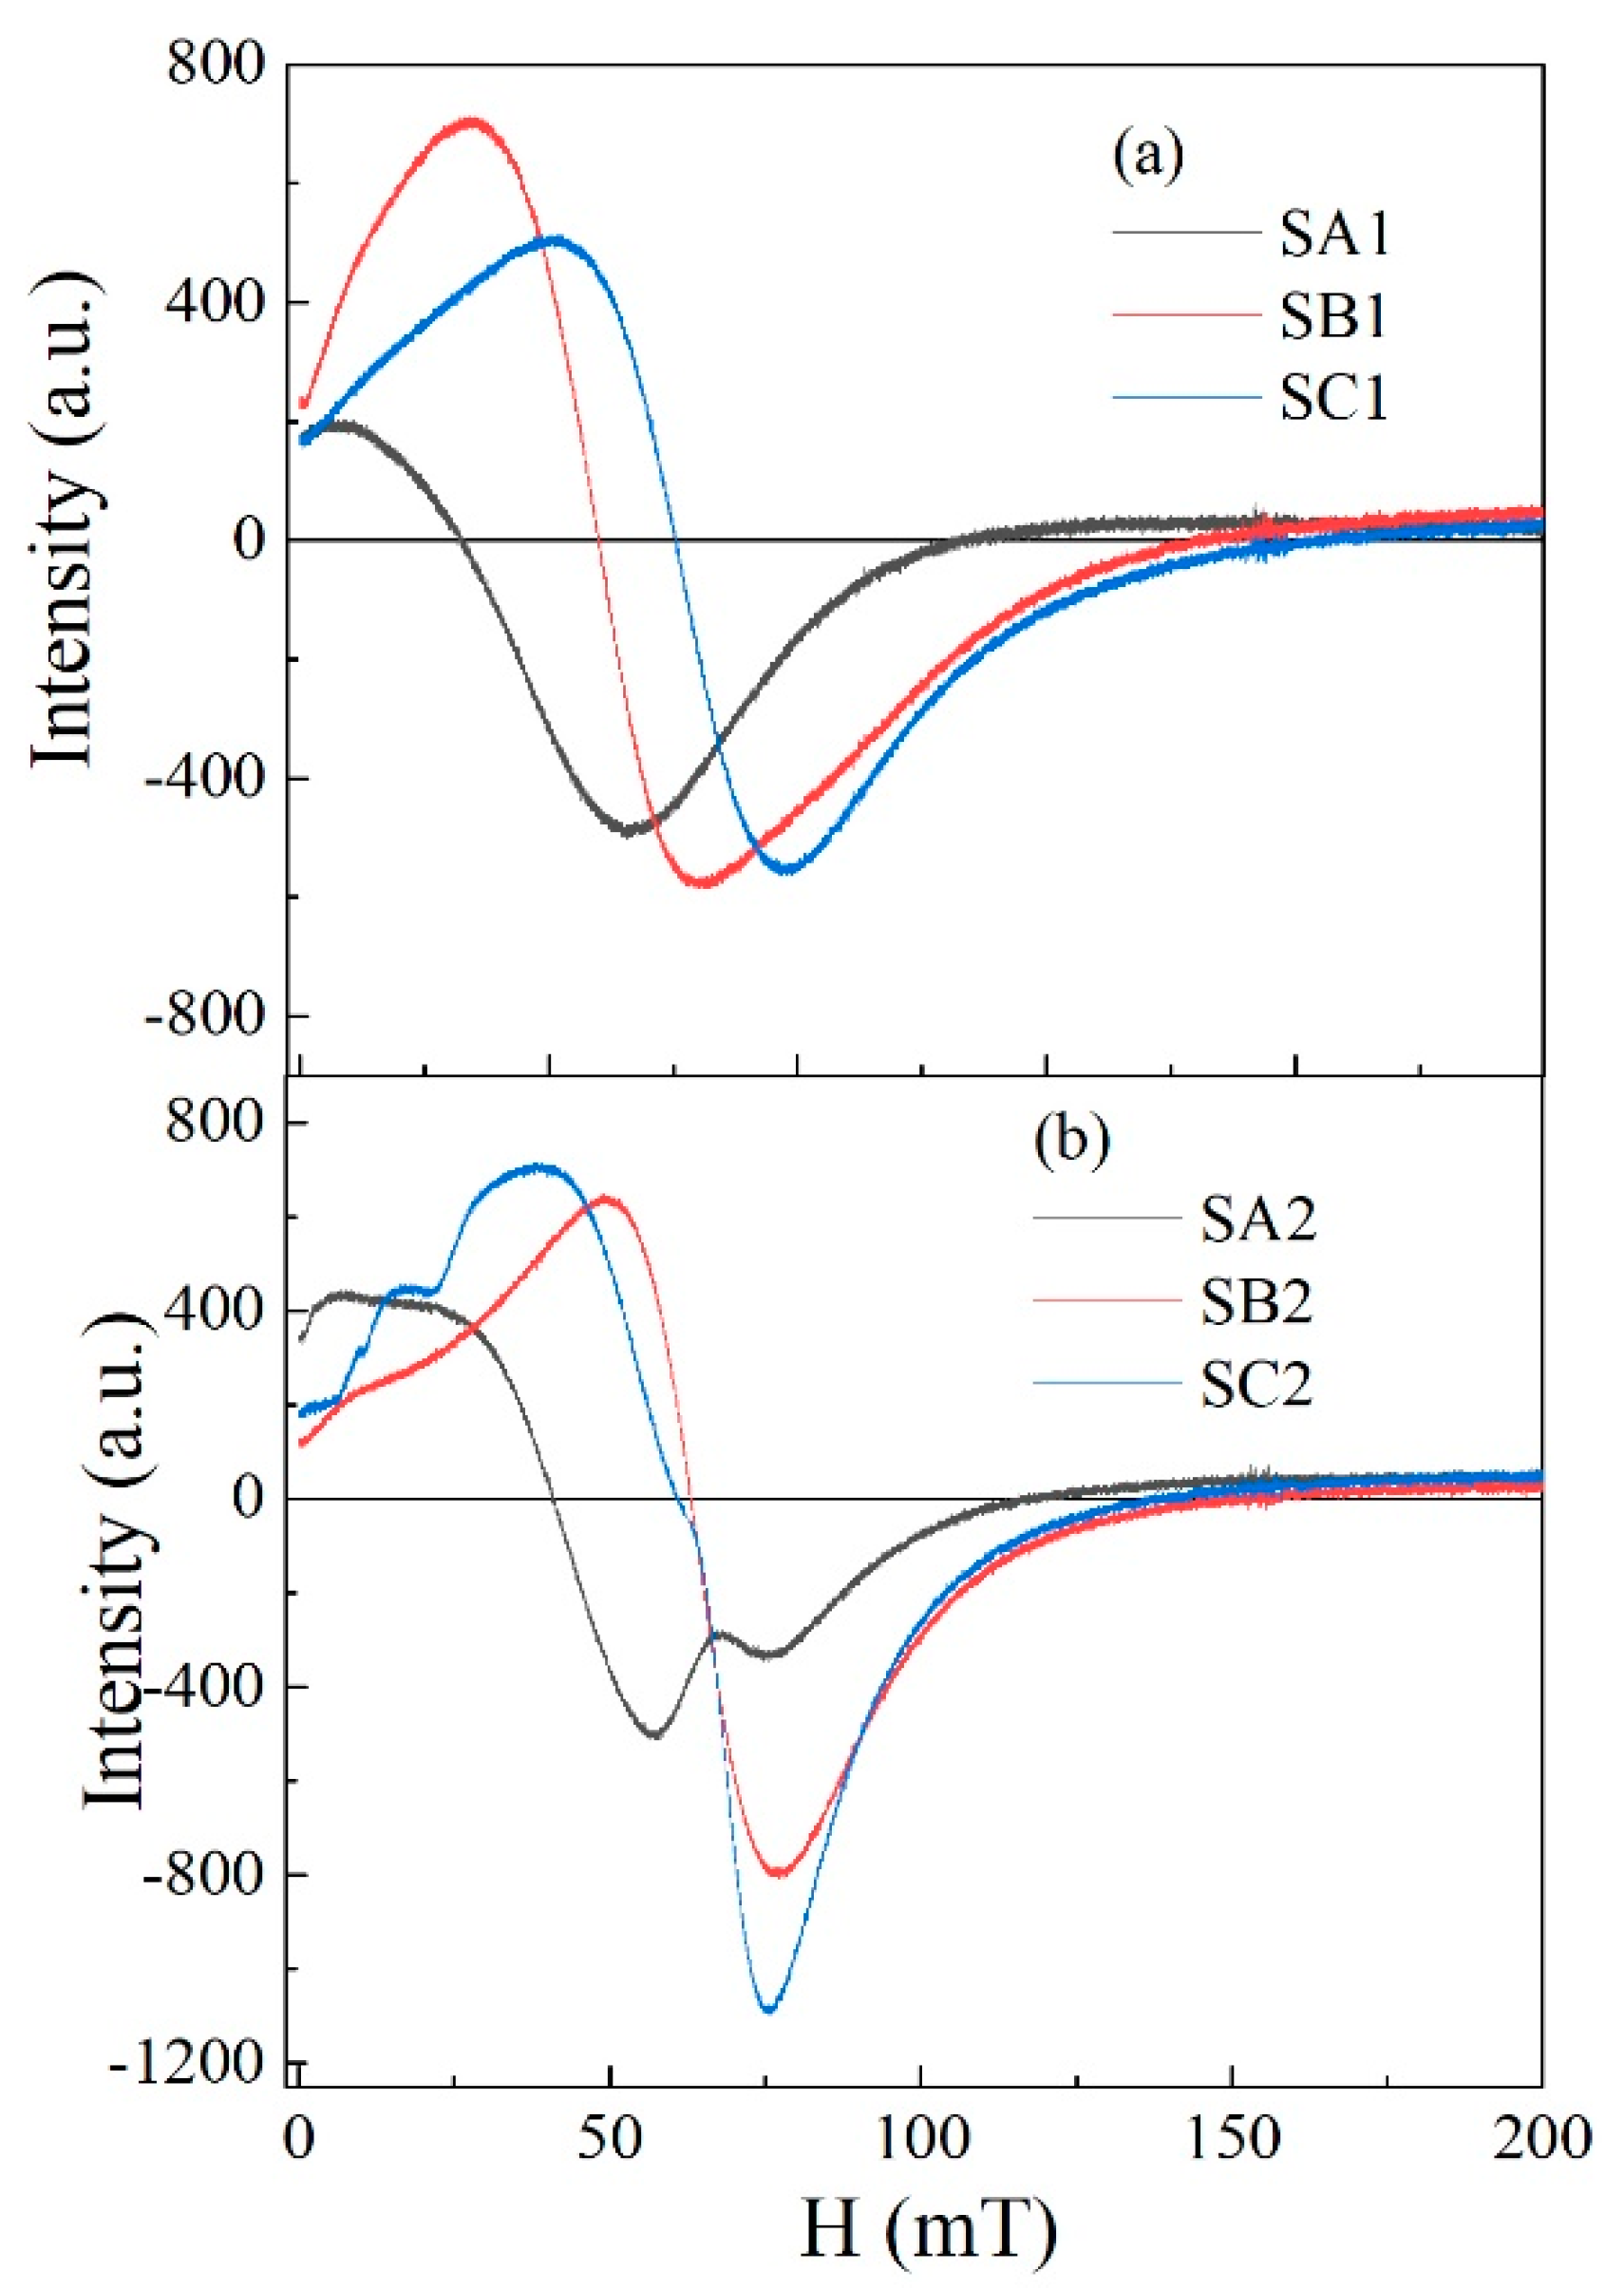
3.2. Static Magnetic Properties of FeGa/FeNi (FeNi/FeGa) Films
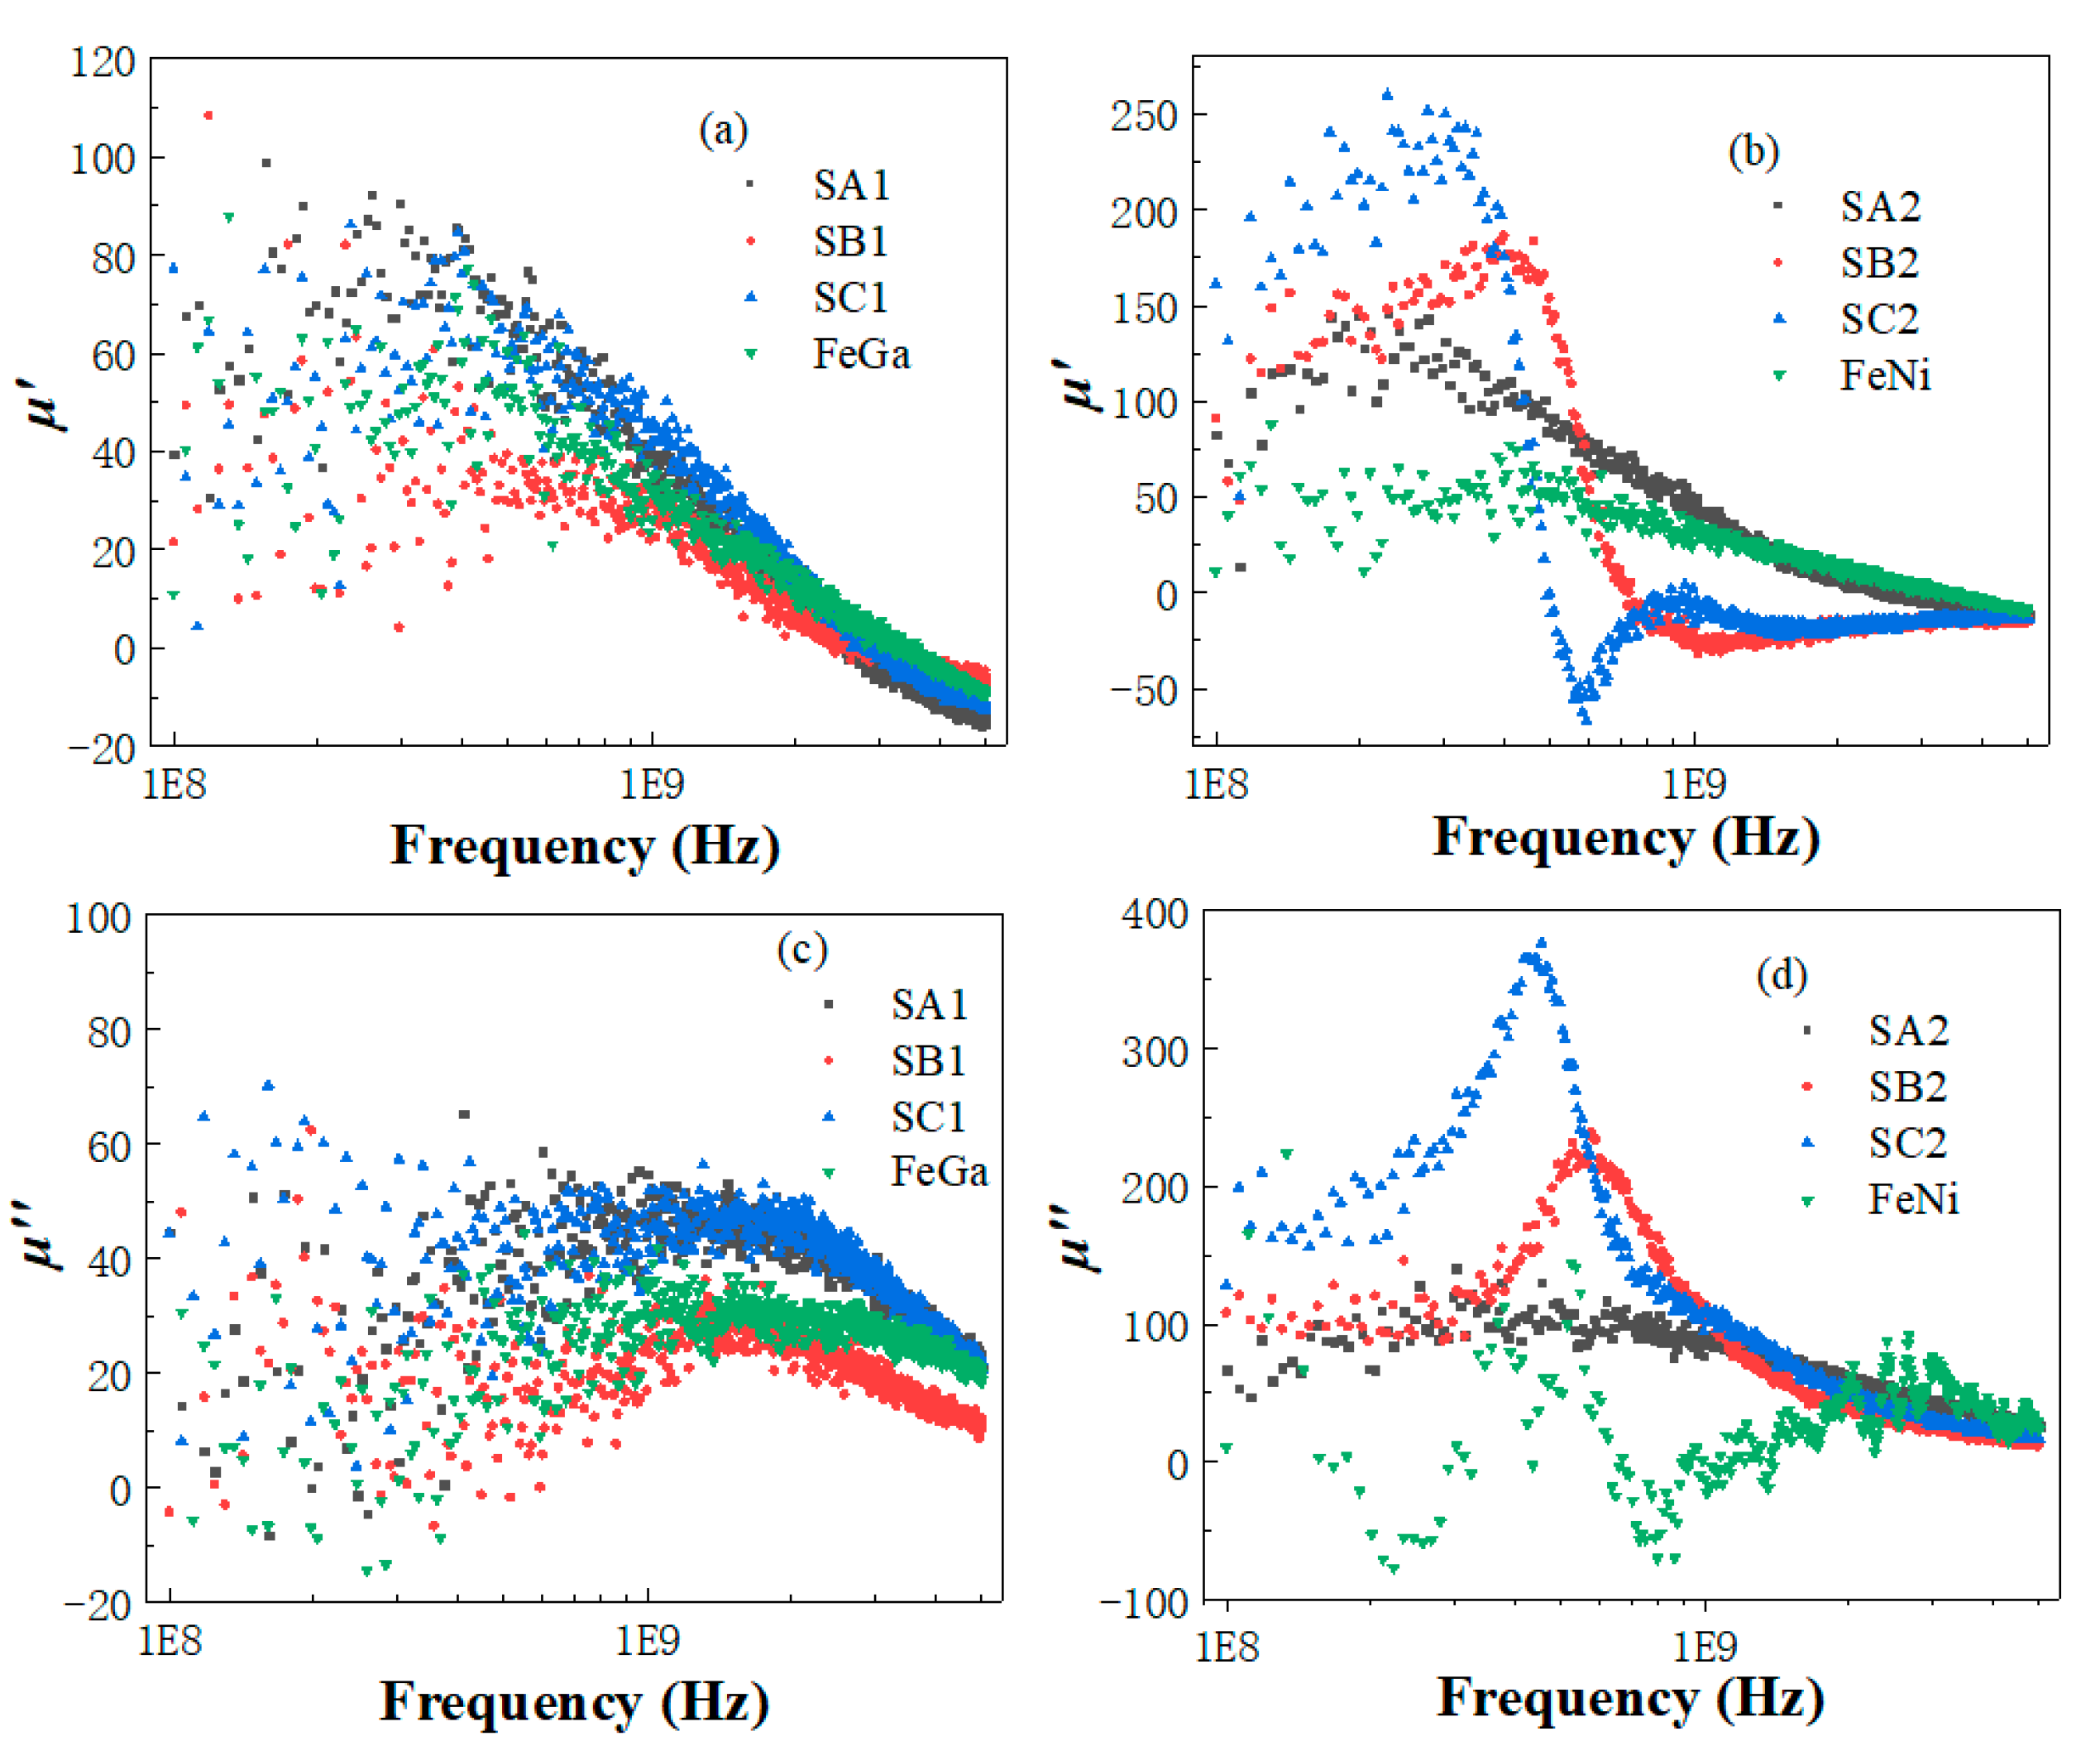
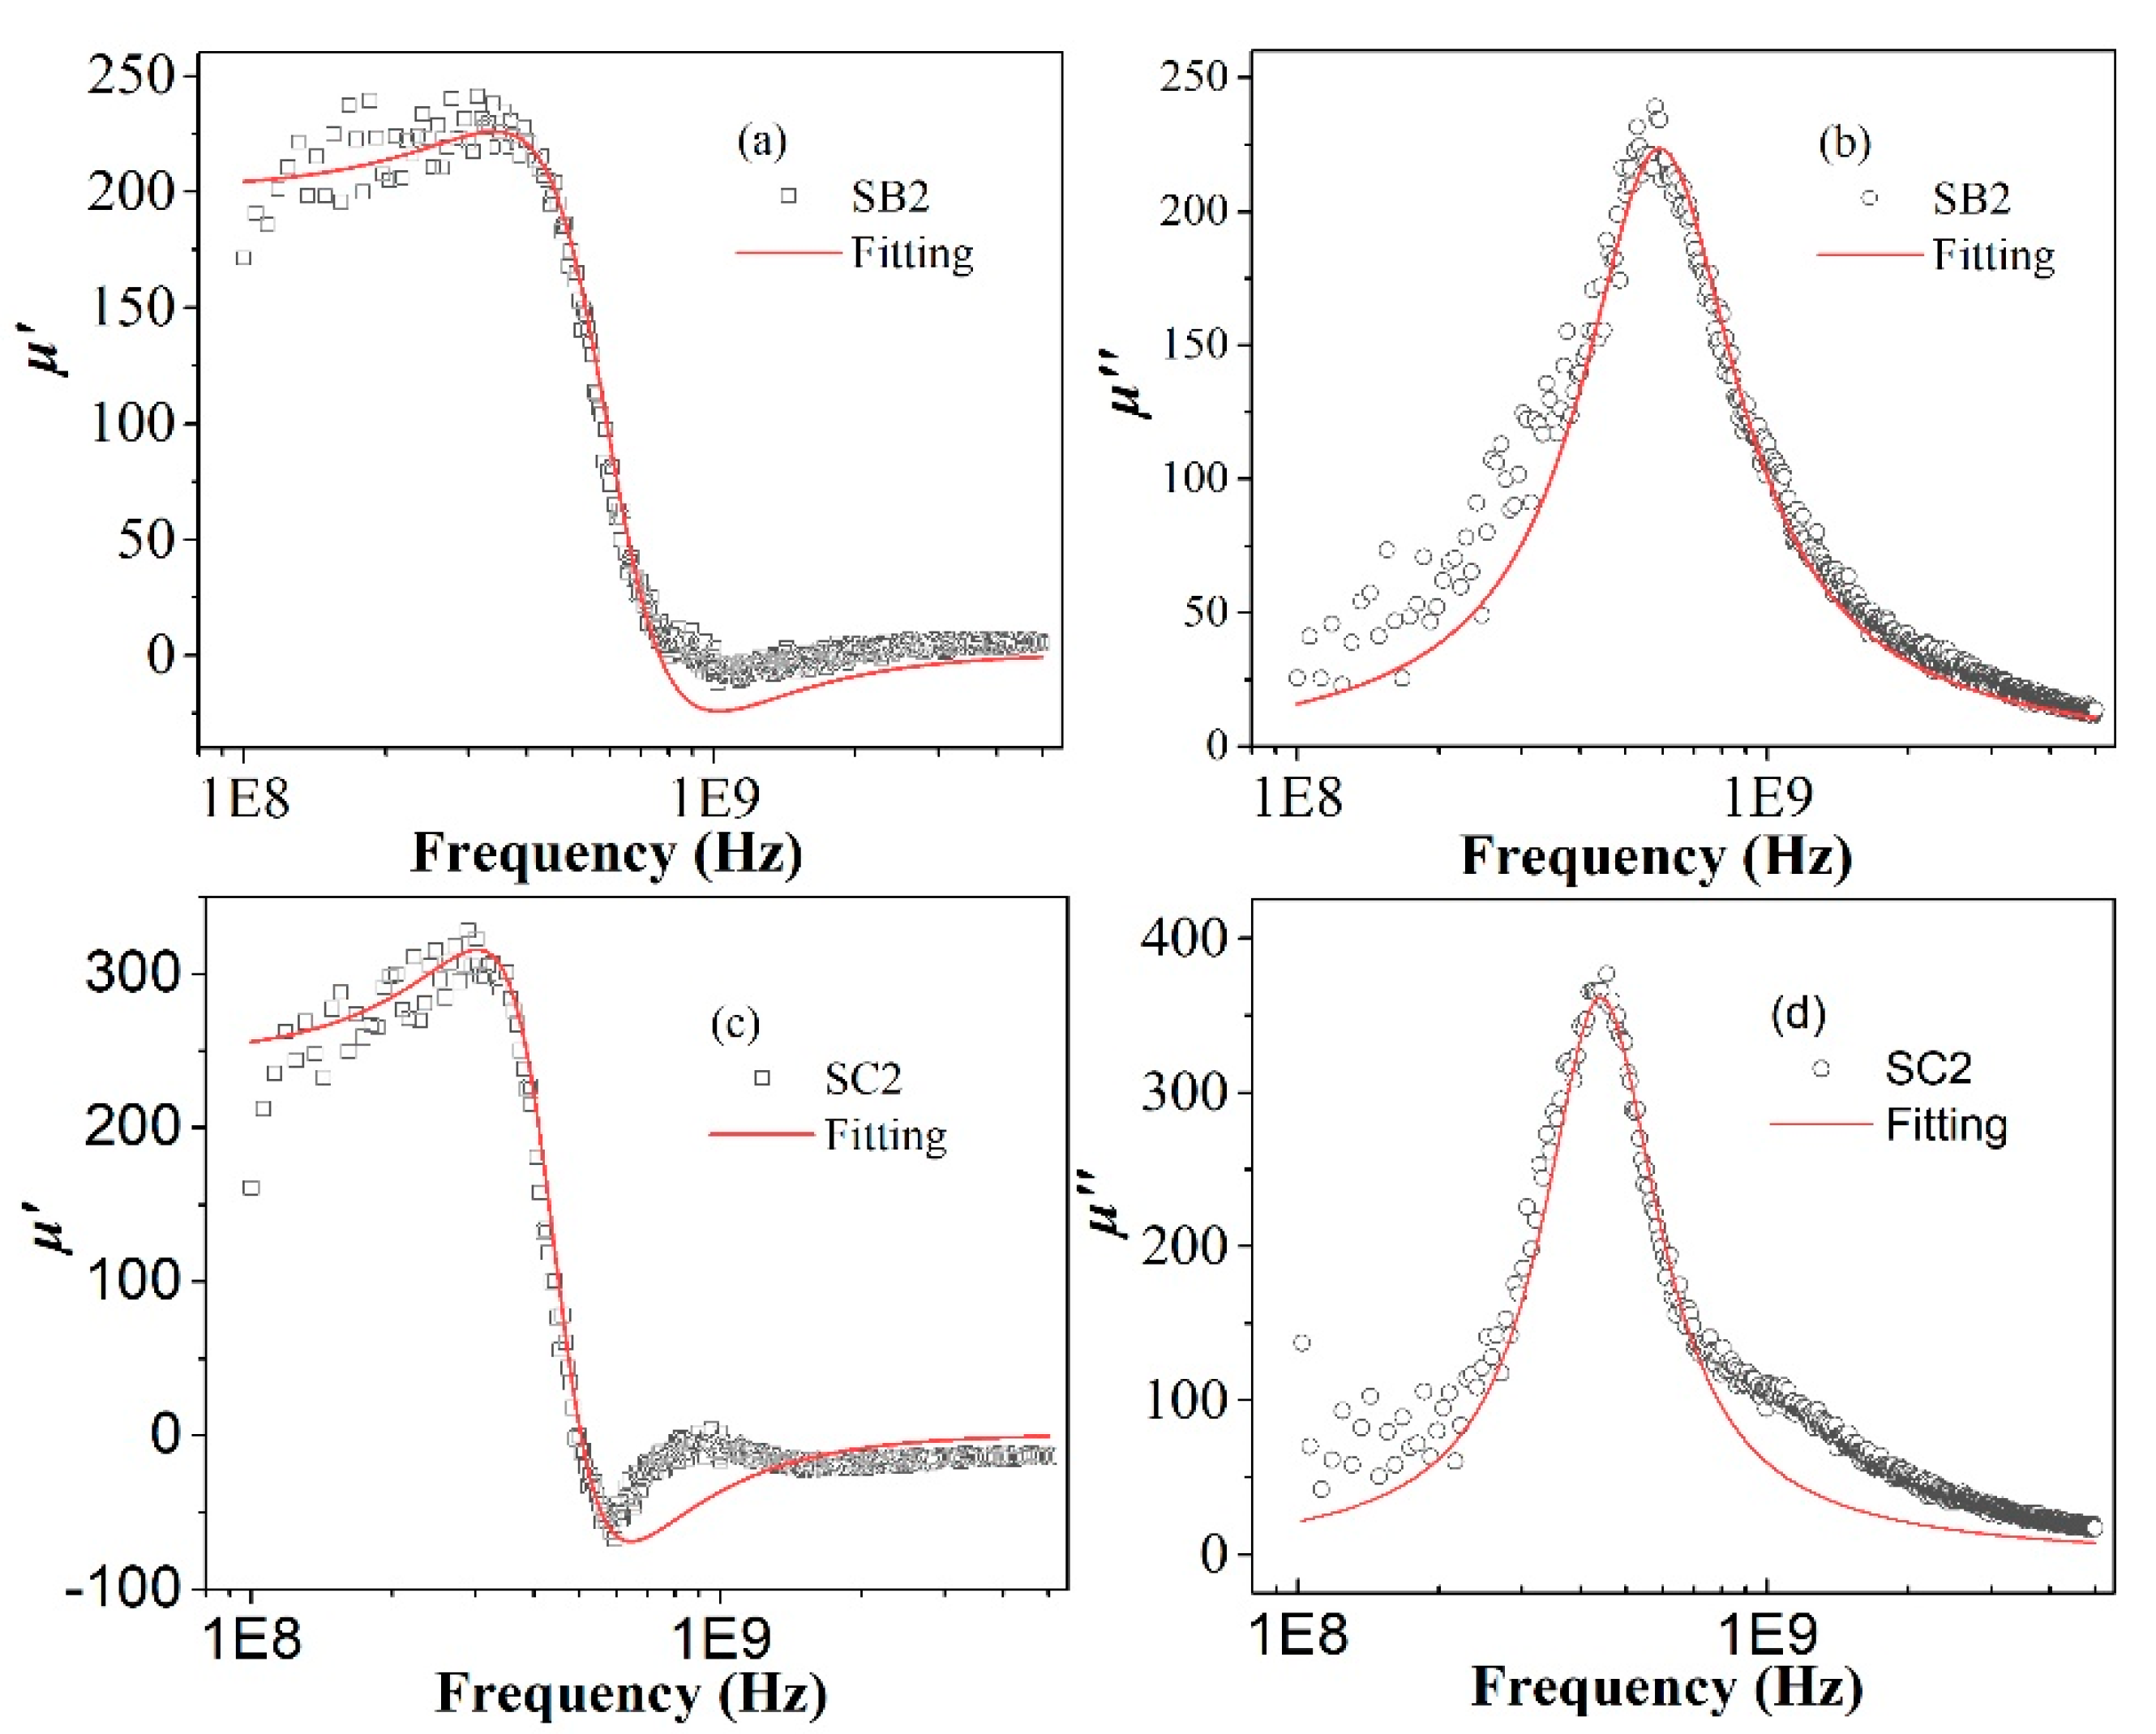
3.3. Dynamic Magnetic Properties of FeGa/FeNi (FeNi/FeGa) Films
4. Conclusions
Author Contributions
Funding
Acknowledgments
Conflicts of Interest
References
- Alvarez-Quiceno, J.C.; Cabrera-Baez, M.; Ribeiro, R.A.; Ávila, M.A.; Dalpian, G.M.; Osorio-Guillén, J.M. Emergence of competing magnetic interactions induced by Ge doping in the semiconductor FeGa3. Phys. Rev. B 2016, 94, 014432. [Google Scholar] [CrossRef]
- Fin, S.; Tomasello, R.; Bisero, D.; Marangolo, M.; Sacchi, M.; Popescu, H.; Eddrief, M.; Hepburn, C.; Finocchio, G.; Carpentieri, M.; et al. In-plane rotation of magnetic stripe domains in Fe1−x Gax thin films. Phys. Rev. B 2015, 92, 224411. [Google Scholar] [CrossRef]
- Clark, A.E.; Restorff, J.B.; Wun-Fogle, M.; Lograsso, T.A.; Schlagel, D.L. Magnetostrictive properties of body-centered cubic Fe-Ga and Fe-Ga-Al alloys. IEEE Trans. Magn. 2000, 36, 3238–3240. [Google Scholar] [CrossRef]
- Atulasimha, J.; Flatau, A.B. A review of magnetostrictive iron–gallium alloys. Smart Mater. Struct 2011, 20, 043001. [Google Scholar] [CrossRef]
- Kuanr, B.K.; Camley, R.E.; Celinski, Z.; McClure, A.; Idzerda, Y. Single crystal Fe1—xGax thin films for monolithic microwave devices. J. Appl. Phys. 2014, 115, 17C112. [Google Scholar] [CrossRef]
- Osaka, T.; Takai, M.; Hayashi, K.; Ohashi, K.; Saito, M.; Yamada, K. A soft magnetic CoNiFe film with high saturation magnetic flux density and low coercivity. Nature 1998, 392, 796–798. [Google Scholar] [CrossRef]
- Yu, Y.; Zhan, Q.; Wei, J.; Wang, J.; Dai, G.; Zuo, Z.; Zhang, X.; Liu, Y.; Yang, H.; Zhang, Y.; et al. Static and high frequency magnetic properties of FeGa thin films deposited on convex flexible substrates. Appl. Phys. Lett. 2015, 106, 162405. [Google Scholar] [CrossRef]
- Ge, J.; Sun, L.; Zhang, F.R.; Zhang, Y.; Shi, L.A.; Zhao, H.Y.; Zhu, H.W.; Jiang, H.L.; Yu, S.H. A stretchable electronic fabric artificial skin with pressure-, lateral strain-, and flexion-sensitive properties. Adv. Mater. 2016, 28, 722–728. [Google Scholar] [CrossRef] [PubMed]
- Zhang, X.; Zhan, Q.; Dai, G.; Liu, Y.; Zuo, Z.; Yang, H.; Chen, B.; Li, R.W. Effect of buffer layer and external stress on magnetic properties of flexible FeGa films. J. Appl. Phys. 2013, 113, 17A901. [Google Scholar] [CrossRef]
- Cao, D.; Wang, Z.; Pan, L.; Feng, H.; Cheng, X.; Zhu, Z.; Wang, J.; Liu, Q.; Han, G. Controllable magnetic and magnetostrictive properties of FeGa films electrodeposited on curvature substrates. Appl. Phys. A 2016, 122, 938. [Google Scholar] [CrossRef]
- Rementer, C.R.; Fitzell, K.; Xu, Q.; Nordeen, P.; Carman, G.P.; Wang, Y.E.; Chang, J.P. Tuning static and dynamic properties of FeGa/NiFe heterostructures. Appl. Phys. Lett. 2017, 110, 242403. [Google Scholar] [CrossRef]
- Pérez-Landazábal, J.I.; Recarte, V.; Sánchez-Alarcos, V.; Rodríguez-Velamazán, J.A.; Jiménez-Ruiz, M.; Link, P.; Cesari, E.; Chumlyakov, Y.I. Lattice dynamics and external magnetic-field effects in Ni-Fe-Ga alloys. Phys. Rev. B 2009, 80, 144301. [Google Scholar] [CrossRef]
- Zhang, Y.; Gan, T.; Wang, T.; Wang, F.; Shi, W. Giant magnetoimpedance effect in Fe75. 5Cu1Nb3Si13.5B7 ribbon/FeGa film composite. J. Magn. Magn. Mater. 2016, 417, 37–41. [Google Scholar] [CrossRef]
- Lupu, N.; Chiriac, H.; Pascariu, P. Electrochemical deposition of FeGa/Ni Fe magnetic multilayered films and nanowire arrays. J. Appl. Phys. 2008, 103, 07B511. [Google Scholar] [CrossRef]
- Dai, G.; Xing, X.; Shen, Y.; Deng, X. Stress-controlled dynamic susceptibility in FeGa stripes. J. Appl. Phys. 2018, 123, 243902. [Google Scholar] [CrossRef]
- Endo, Y.; Sakai, T.; Miyazaki, T.; Shimada, Y. Effect of Film Thickness on the High Frequency Magnetic Properties of Polycrystalline Fe–Ga Films. IEEE Trans. Magn. 2017, 53, 1–5. [Google Scholar] [CrossRef]
- Tran, T.Q.; Lee, J.K.Y.; Chinnappan, A.; Jayathilaka, W.A.D.M.; Ji, D.; Kumar, V.V.; Ramakrishna, S. Strong, lightweight, and highly conductive CNT/Au/Cu wires from sputtering and electroplating methods. J. Mater Sci. Technol. 2020, 40, 99–106. [Google Scholar] [CrossRef]
- Tran, T.Q.; Lee, J.K.Y.; Chinnappan, A.; Loc, N.H.; Tran, L.T.; Ji, D.; Jayathilaka, W.A.D.M.; Kumar, V.V.; Ramakrishna, S. High-performance carbon fiber/gold/copper composite wires for lightweight electrical cables. J. Mater Sci. Technol. 2020, 42, 46–53. [Google Scholar] [CrossRef]
- Zhang, X.; Zhan, Q.; Dai, G.; Liu, Y.; Zuo, Z.; Yang, H.; Chen, B.; Li, R.W. Effect of mechanical strain on magnetic properties of flexible exchange biased FeGa/IrMn heterostructures. Appl. Phys. Lett. 2013, 102, 022412. [Google Scholar] [CrossRef]
- Jiang, J.S.; Bader, S.D. Magnetic reversal in thin film exchange-spring magnets. Scr. Mater. 2002, 47, 563–568. [Google Scholar] [CrossRef]
- Fullerton, E.E.; Jiang, J.S.; Bader, S.D. Hard/soft magnetic heterostructures: Model exchange-spring magnets. J. Magn. Magn. Mater 1999, 200, 392–404. [Google Scholar] [CrossRef]
- Zhang, Y.; Huang, C.; Duan, Z.; Shi, W. Tuning static and dynamic magnetic properties of FeGa/Mn film. J. Magn. Magn. Mater. 2019, 477, 4–8. [Google Scholar] [CrossRef]
- Sun, K.; Pu, Z.; Yang, Y.; Chen, L.; Yu, Z.; Wu, C.; Jiang, X.; Lan, Z. Rietveld refinement, microstructure and ferromagnetic resonance linewidth of iron-deficiency NiCuZn ferrites. J. Alloys Compd. 2016, 681, 139–145. [Google Scholar] [CrossRef]
- Wang, Z.; Feng, E.; Zhang, Y.; Liu, Q.; Wang, J. Optimum electrodeposition conditions of FeCoZr films with in-plane uniaxial anisotropy for high frequency application. Mater. Chem. Phys. 2012, 137, 499–502. [Google Scholar] [CrossRef]
- Wei, J.; Wang, J.; Liu, Q.; Li, X.; Cao, D.; Sun, X. An induction method to calculate the complex permeability of soft magnetic films without a reference sample. Rev. Sci. Instrum. 2014, 85, 054705. [Google Scholar] [CrossRef]
- Raveendran, N.L.; Pandian, R.; Murugesan, S.; Asokan, K.; Kumar, R.R. Phase evolution and magnetic properties of DC sputtered Fe-Ga (Galfenol) thin films with growth temperatures. J. Alloys Compd. 2017, 704, 420–424. [Google Scholar] [CrossRef]
- Ma, J.; Li, J.; Ni, X.; Zhang, X.; Huang, J. Microwave resonance in Fe/SiO2 nanocomposite. Appl. Phys. Lett. 2009, 95, 102505.ss. [Google Scholar] [CrossRef]
- Yan, L.; Wang, J.; Han, X.; Ren, Y.; Liu, Q.; Li, F. Enhanced microwave absorption of Fe nanoflakes after coating with SiO2 nanoshell. Nanotechnology 2010, 21, 095708. [Google Scholar] [CrossRef]


| Bottom layer | FeGa (500 s) | FeNi (200 s) | FeGa (200 s) | FeNi (500 s) | FeGa (500 s) | FeNi (500 s) |
| Top layer | FeNi (200 s) | FeGa (500 s) | FeNi (500 s) | FeGa (200 s) | FeNi (500 s) | FeGa (500 s) |
| Name | SA1 | SA2 | SB1 | SB2 | SC1 | SC2 |
| Samples | SA1 | SA2 | SB1 | SB2 | SC1 | SC2 | FeNi | FeGa |
|---|---|---|---|---|---|---|---|---|
| Hc (Oe) | 32.0 | 13.7 | 43.9 | 27.4 | 34.1 | 18.9 | 50.4 | 36.4 |
| Mr/Ms | 0.78 | 0.87 | 0.65 | 0.45 | 0.67 | 0.53 | 0.35 | 0.86 |
© 2020 by the authors. Licensee MDPI, Basel, Switzerland. This article is an open access article distributed under the terms and conditions of the Creative Commons Attribution (CC BY) license (http://creativecommons.org/licenses/by/4.0/).
Share and Cite
Wang, Z.; Wang, F.; Hou, Z.; Xu, C.; Cao, D. Static and Dynamic Magnetic Properties of FeGa/FeNi (FeNi/FeGa) Bilayer Structures. Coatings 2020, 10, 383. https://doi.org/10.3390/coatings10040383
Wang Z, Wang F, Hou Z, Xu C, Cao D. Static and Dynamic Magnetic Properties of FeGa/FeNi (FeNi/FeGa) Bilayer Structures. Coatings. 2020; 10(4):383. https://doi.org/10.3390/coatings10040383
Chicago/Turabian StyleWang, Zhen, Fenglong Wang, Zhaoyang Hou, Chunlong Xu, and Derang Cao. 2020. "Static and Dynamic Magnetic Properties of FeGa/FeNi (FeNi/FeGa) Bilayer Structures" Coatings 10, no. 4: 383. https://doi.org/10.3390/coatings10040383
APA StyleWang, Z., Wang, F., Hou, Z., Xu, C., & Cao, D. (2020). Static and Dynamic Magnetic Properties of FeGa/FeNi (FeNi/FeGa) Bilayer Structures. Coatings, 10(4), 383. https://doi.org/10.3390/coatings10040383