Article

The Effect of Carbon Ink Rheology on Ink Separation Mechanisms in Screen-Printing

1
Specific IKC, College of Engineering, Bay Campus, Swansea University, Crymlyn Burrows, Swansea SA1 8EN, UK
2
Welsh Centre for Printing and Coating, College of Engineering, Bay Campus, Swansea University, Crymlyn Burrows, Swansea SA1 8EN, UK
*
Author to whom correspondence should be addressed.
Coatings 2020, 10(10), 1008; https://doi.org/10.3390/coatings10101008
Submission received: 22 September 2020 / Revised: 10 October 2020 / Accepted: 20 October 2020 / Published: 21 October 2020

Abstract

:
Screen-printable carbon-based inks are available in a range of carbon morphologies and concentrations, resulting in various rheological profiles. There are challenges in obtaining a good print when high loading and elasticity functional inks are used, with a trade-off often required between functionality and printability. There is a limited understanding of how ink rheology influences the ink deposition mechanism during screen-printing, which then affects the print topography and therefore electrical performance. High speed imaging was used with a screen-printing simulation apparatus to investigate the effect of viscosity of a graphite and carbon-black ink at various levels of solvent dilution on the deposition mechanisms occurring during screen-printing. With little dilution, the greater relative volume of carbon in the ink resulted in a greater tendency towards elastic behavior than at higher dilutions. During the screen-printing process this led to the ink splitting into filaments while remaining in contact with both the mesh and substrate simultaneously over a greater horizonal length. The location of separating filaments corresponded with localized film thickness increases in the print, which led to a higher surface roughness (Sz). This method could be used to make appropriate adjustments to ink rheology to overcome print defects related to poor ink separation.

Graphical Abstract

1. Introduction

Conductive carbon-based inks are used in several printed electronics applications due to their electrical properties and relative low cost when compared with alternative functional materials such as silver. They are widely used in applications including resistive heaters [1,2], electrochemical sensors [3,4], printed batteries [5,6] and perovskite photovoltaics [7,8]. Screen-printing is the main manufacturing process being used for depositing these carbon inks, due to its relative simplicity, affordability and maturity in the sector, as well as its ability to print a wide rheological range of inks with high loading of functional material [9].
A range of carbon morphologies and carbon concentrations are used in screen-printing inks, to tailor the print quality, in terms of print continuity, low surface roughness without any gaps in the print, as well as the resultant electrical performance for a variety of printed electronics applications [9,10,11,12]. The solvent used can be altered to determine the drying and curing rate of an ink, to improve process productivity without hindering the print consistency or electrical performance [13,14]. The binders used are typically determined by the curing temperature, substrate material and compatibility with the particular application [14]. These different combinations produce a wide range of rheological profiles of screen-printing carbon-based inks, each requiring different press settings for optimal performance. The effects of changing press parameters including squeegee pressure, snap-off distance (the distance between the screen and the substrate) and print speed have been shown to vary with the rheology of the ink. Where changes in these settings lead to variations in print deposit thicknesses, print continuity, surface roughness and resultant conductivity [15,16,17,18,19,20,21]. However, due to limitations in modelling the complex rheological properties of screen-printing inks and a lack of understanding in the physical mechanism by which ink is transferred, there have not been predictive models available to assist in identifying the optimal parameters to use for a given ink.
There are two historical analytical models which try to describe the physical mechanism by which ink is transferred from the mesh to the substrate and subsequently separated, both conceived in the 1980’s by Riemer [22,23,24,25] and Messerschmitt [26]. Riemer [23] proposed that the screen mesh acts like pistons in a syringe, forcing the ink onto the substrate as columns of ink exiting from a tube. After the print stroke, the mesh is released by its own tension, while the ink remains on the substrate due to adhesive forces between the ink and substrate. The ink would then slump after it had been released from the mesh to form the print. Alternatively, Messerschmitt [26] proposed that the separation forces would not be able to overcome the adhesion between the ink and mesh in such a way. This would induce a flow, creating a combination of shear and extensional forces which would lead to the ink splitting between the mesh and substrate. This process was described through four key stages consisting of adhesion, extension, flow then separation.
In order to experimentally identify if either of these models were appropriate, the authors [27,28] conducted a high-speed imaging study with a camera fixed to the side of a custom-made screen-printing apparatus, enabling these separation mechanisms to be visualised in real time. The experiment visualised the effects of snap off distance (gap between mesh and substrate) and print speed on the ink deposition mechanism during screen-printing for a carbon-based ink, and was able to identify similarities between the flow mechanisms being observed and the four key stages of ink transfer outlined by Messerschmitt [26]. These were split up into two quantifiable regions, consisting of adhesion to extension for the first region where the ink remains in continuous contact with the mesh and substrate, followed by flow to separation in the second region where the main body of ink splits off into filaments which eventually separate (Figure 1). The lengths of these separation regions varied quantifiably with changes in line width, snap off distance and print speed which related to the quantity of ink deposited and the homogeneity of the print [27,28].
However, this previous work was limited since it did not consider the effect of ink rheology on these mechanisms. Screen-printing inks have a vast range of rheological profiles, depending on the particle morphologies, interactions between particles, particle size distribution as well as solvents and resins used [9,10,11,12,29,30]. Work by Holder et al. [31] and Claypole et al. [32] have identified rheological methods for optimising the formulation of screen-printing inks containing high volumes of functional materials, covering a wide range of ink viscosities and viscoelastic characteristics which can be quantifiably related to the quality of the print produced. Therefore, changing the rheological profile of the ink should also create quantifiable changes in the ink separation stages which could be related to the print quality and performance.
The aim of this study was to improve the understanding of how the rheological profiles of carbon-based inks influence the ink deposition and separation mechanisms in screen-printing, as well as how these relate to the print quality produced. High speed imaging was conducted using the custom-made screen-printing apparatus [27], to visualise and quantify the effect of ink rheology on the relative extents of the ink separation stages. To achieve this, a commercial carbon ink was diluted to varying extents with solvent to give a range of rheological profiles for comparison with the resultant deposition and separation mechanisms occurring during screen-printing. Rheological analyses were conducted to quantify the differences in viscosity and viscoelasticity of the dilutions, while thermogravimetric analysis (TGA) were conducted to provide an estimate of the mass lost during drying to enable the wet film thicknesses to be calculated. Wet film thickness was then used to compare changes in the amount of ink deposited prior to solvent losses during drying. Topography analyses were then conducted on the resulting prints to provide a comparison between the ink separation mechanisms and print quality produced. To relate this more comprehensively to print performance, a comparison study was also conducted on a screen-printing press to assess the effect of ink dilution on the print topography of a greater range of line widths and printed solid areas.

2. Materials and Methods

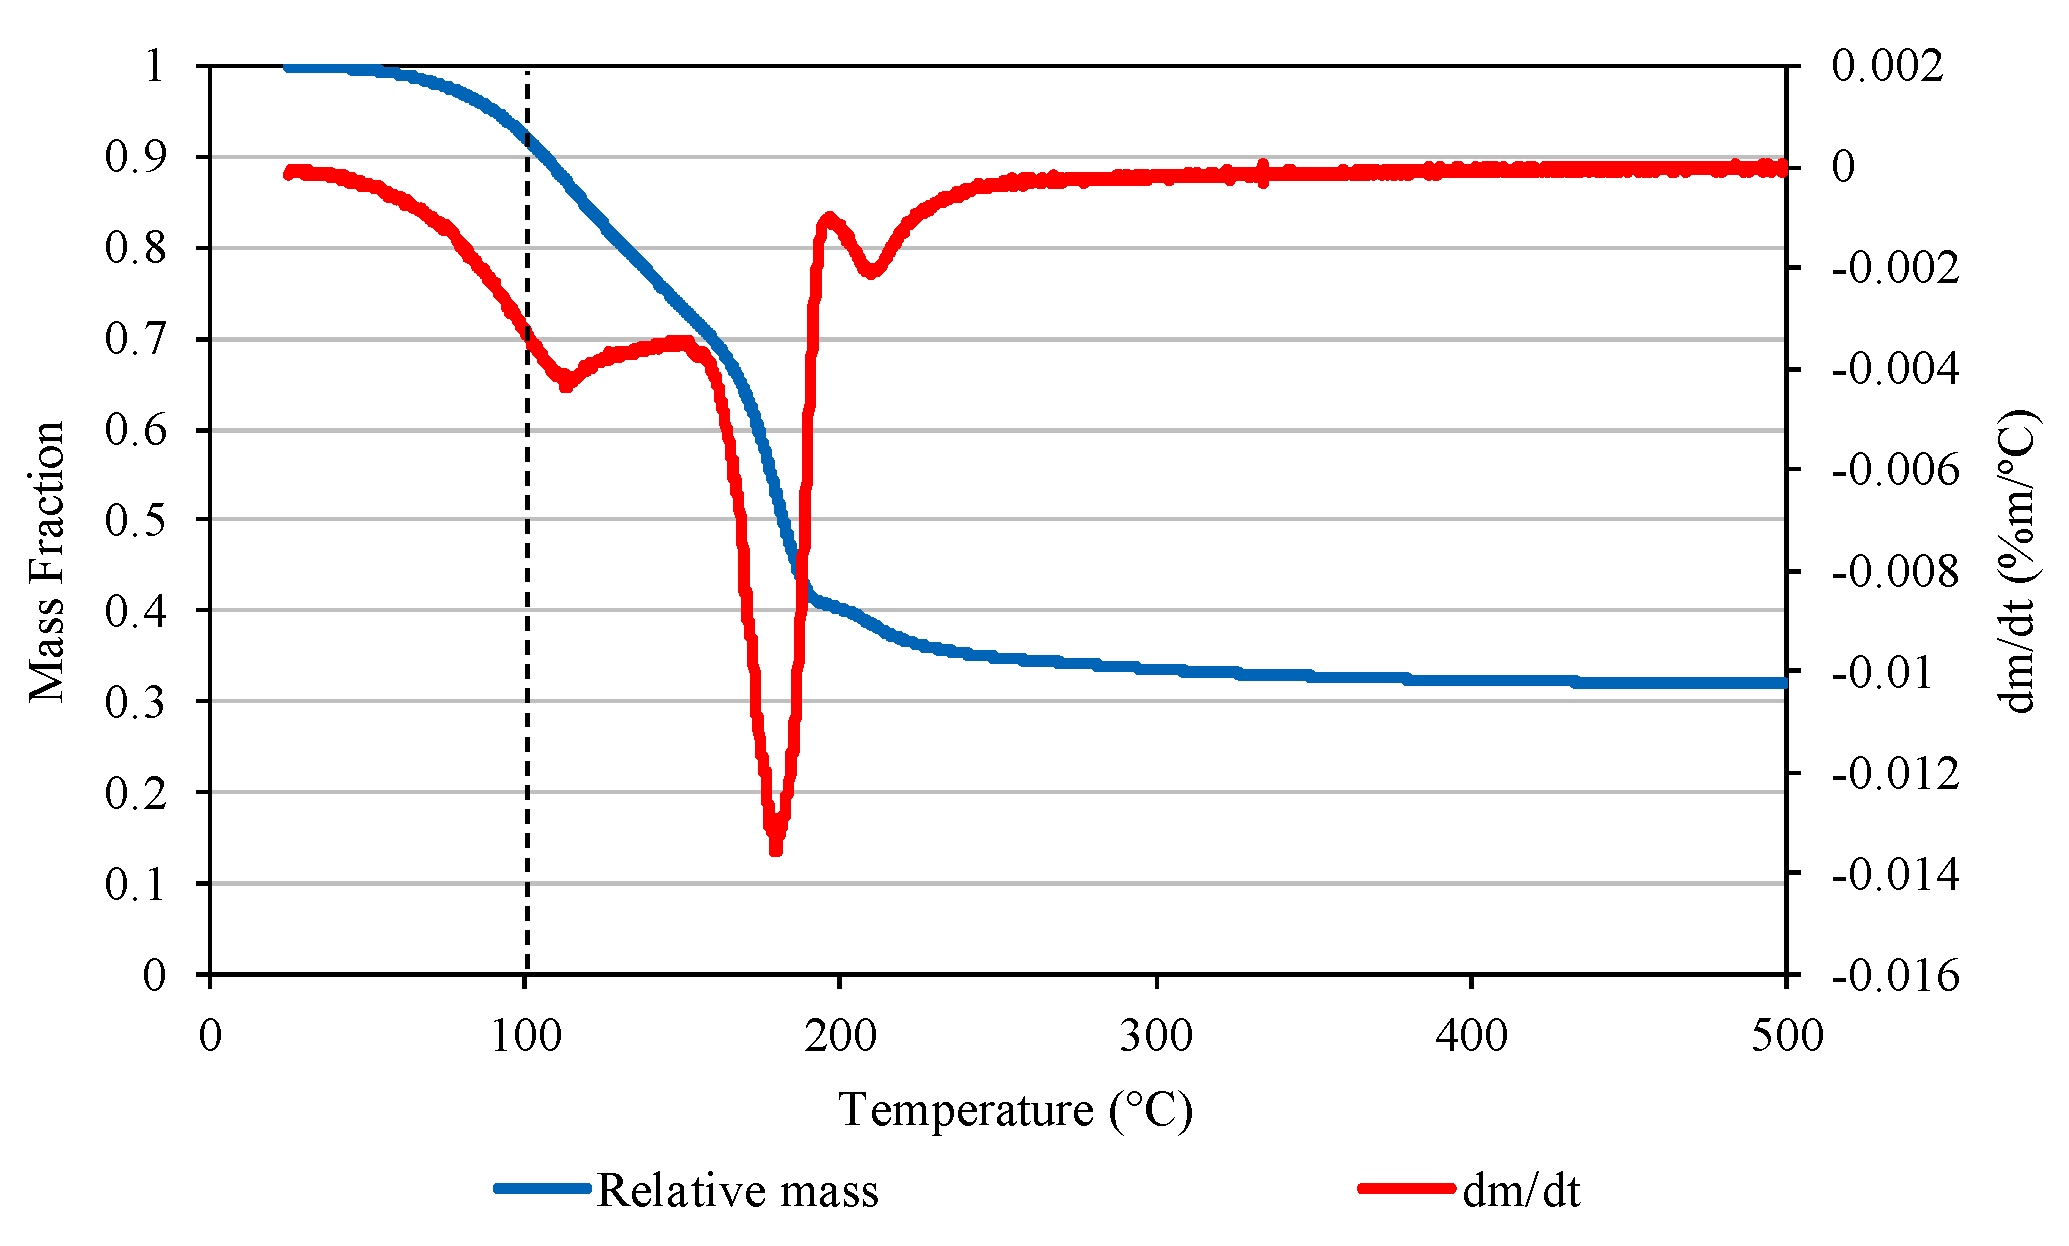
2.1. Characterisation of Ink Rheology and TGA

The study used a commercial carbon ink by Gwent Electronics Materials (GEM) (GEM C2150317D3 carbon paste) as supplied and diluted with 2.5 wt.%, 5 wt.%, and 10 wt.% 1-Methoxy-2-propanol (solvent choice and maximum dilution percentage of 10 wt.% advised by the manufacturer as a method for reducing the ink viscosity).
TGA was used to establish the evaporative characteristics of the undiluted ink to provide an estimate of the mass lost during drying to enable the wet film thickness values to be estimated. This was carried out by a Perkin Elmer Pyris 1 (Perkin Elmer Inc., Waltham, MA, United States) analysis with a temperature ramp to 500 °C over a period of 1 h (8 °C/min) in a nitrogen atmosphere to allow evaporation of the solvent content and decomposition of the binder.
Rheological evaluation was carried out using a combination of shear, viscoelastic and extensional measurements. Shear viscosity measurements were carried out on a Malvern Bohlin rotational rheometer (Gemini Bohlin Nano, Malvern Instruments, Malvern Panalytical Ltd, Malvern, UK) with a 2° 20 mm stainless steel cone and a parallel plate held at 25 °C. Ink viscosity was measured as the shear rate was gradually increased to 100 s−1 and then reduced back to 1 s−1. Viscoelastic measurements were carried out on a Malvern Kinexus Pro Rheometer (Malvern Instruments, Malvern Panalytical Ltd., Malvern, UK) with a 40 mm roughened plate and roughened parallel plate (to minimise the effect of slip). Amplitude (strain) sweep measurements were conducted to establish the linear viscoelastic range at 0.1, 1, and 10 Hz. Then using a stress within the established linear viscoelastic region, a frequency sweep from 0.1 to 10 Hz was conducted.

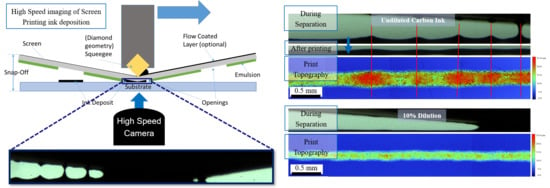
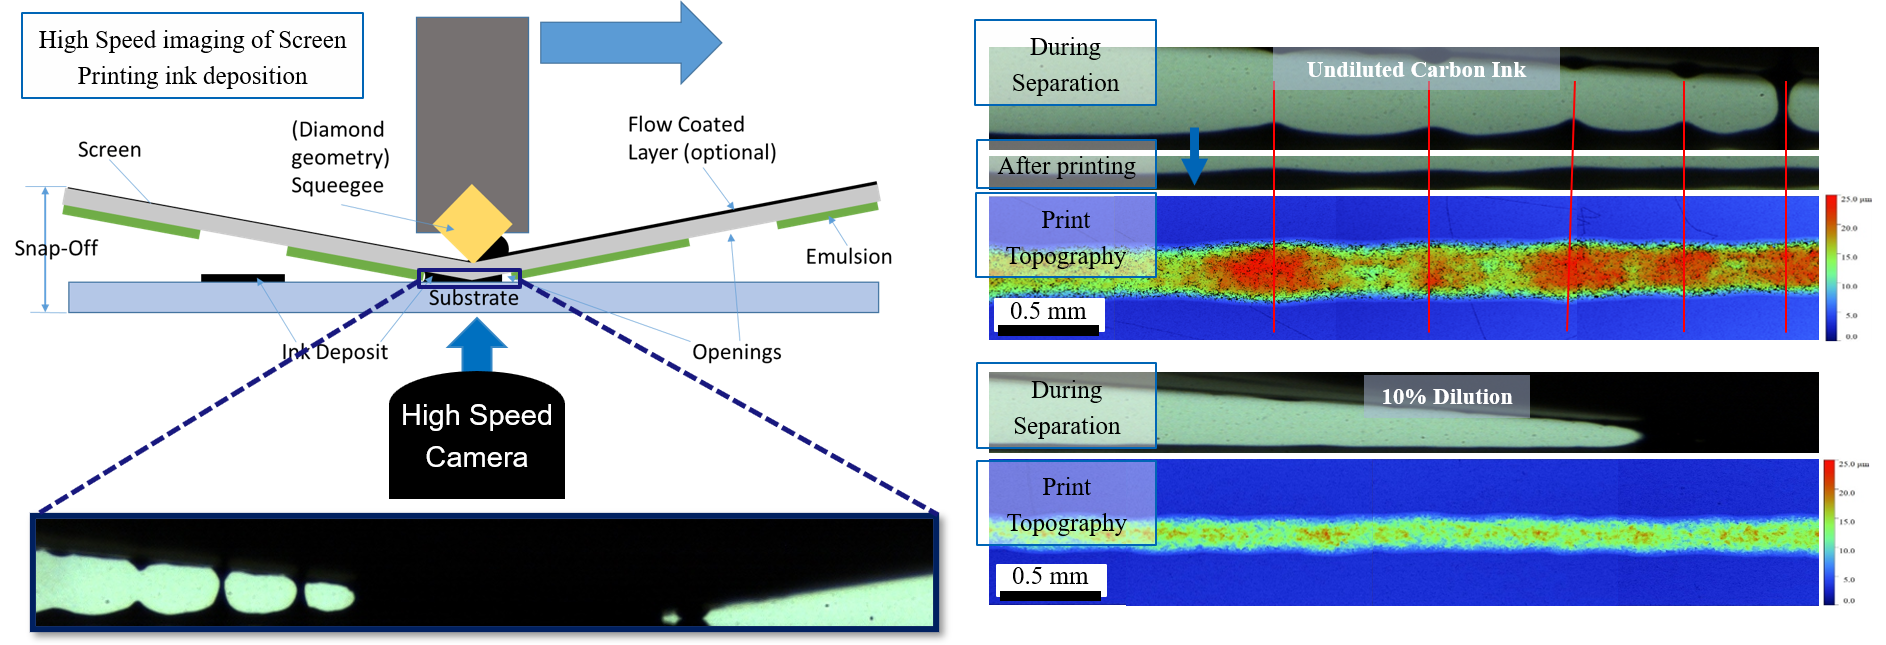
2.2. Visualisation of Screen-Printing Process

Printing was conducted on a custom-made screen-printing apparatus which allowed the mesh-substrate separation to be visualised during the print via the high-speed camera. Squeegee motion in the print direction (x axis) and vertical movement perpendicular to the print direction (z axis) was controlled by stepper motors (NEMA23 Stepper Motors from Ooznest, Essex, UK) powering lead screws on linear actuators. It was programmed using Arduino with Grbl Controller 3.0 (open source) software to set the speed and distance of the movement. This allowed the squeegee to be brought in to contact with the screen, then brought across the screen to transfer the ink. A labelled diagram and photograph of the apparatus is shown in previous studies [27]. A polyester mesh at 22.5° with 61 threads per cm, 64 µm thread diameter and 12-micron emulsion was used to print the image. A 65–70 Shore A hardness diamond squeegee was used, along with a snap distance (distance between screen and substrate) of 1.825 mm and squeegee travel speed of 300 cm/min (50 mm/s). The substrate was polyethylene terephthalate (PET—Melinex® 339, DuPont Teijin Films (175 µm thickness) opaque white). The print image consisted a continuous 200 µm wide line in the direction of squeegee travel (line width selected for analytical purposes outlined previously [27,28]).
High speed imaging of the print cycle on the apparatus was conducted at the interface between the screen and the substrate using a Photron FastCam Mini High-Speed Camera (Photron, Tokyo, Japan) at a frame rate of 125 frames per second with 5× magnification, and a 10,000-lux lamp used for backlighting. Camera images were processed in ImageJ (Version. 1.52v) [33] to evaluate the adhesion to extension and flow to separation stages [27,28]. For each test, the lengths of these flow regions were measured over 15 evenly spread intervals across the visible length of the print process, where the full contact region (where the ink was in simultaneous contact with the mesh and substrate) could be seen (image frames taken from around every 0.024 s). Each dilution was printed 3 times, with each print assessed using ImageJ as described previously. Producing 45 measurements which were used to calculate the average lengths of the flow regions for each dilution.
Comparison prints were conducted on a full-sized screen-printing press for the same ink dilutions to allow a comparison of print topography and electrical performance over a greater range of line widths as well as solid patches to enable a more effective study of surface roughness. A DEK 248 flatbed screen-printing press was used with the same substrate. With a polyester mesh containing 61 threads per cm, 64 µm thread diameter and 13-micron emulsion. A 65–70 Shore A hardness diamond squeegee of 130 mm length with snap off distance of 1 mm, with a downward squeegee force of 9 kg and print/flood speed of 70 mm s−1. The print image included a series of 25-mm-long lines of nominal widths, from which the 500 µm and 700 µm line widths were assessed, and a 45-mm square solid patch for sheet resistance and resistivity assessment. Printed samples were dried in a conveyor dryer at 100 °C for 15 min.

2.3. Characterisation of Print Topography and Electrical Properties

White light interferometry (NT9300, Veeco Instruments, Inc., Plainview, NY, USA) was used to measure a full three-dimensional surface profile of the lines printed on the custom screen-printing apparatus. The dry ink film thickness was then calculated as the average thickness of the substrate subtracted from the average thickness of the ink. 5× magnification was used, giving a measurement area of 1.2 mm by 0.93 mm (at a resolution of 736 pixels × 480 pixels with sampling at 1.67 µm intervals). A total of 12 measurements were conducted for each dilution to calculate the average and standard deviations in line width and thickness. This was obtained over three print samples, where each printed line was measured in 4 evenly spaced points. Geometric features were assessed over each of these discrete measurements.
Comparison prints conducted on the DEK-248 were assessed in the same way. 500 and 700 µm nominal width lines were each measured in 3 evenly spaced points over the line, with 3 print samples assessed for each ink dilution. For the printed squares, analyses were conducted in the centre of the print for average surface roughness (Sa) and average maximum surface roughness (Sz) values. As well as over the edge of the solid print, so that the printed ink film thickness could be evaluated (12 measurements for each for each dilution).
The wet film thickness was also calculated based on the TGA analysis of the undiluted ink, used to identify the relative mass of solvents, binder and carbon in the ink. As the solvents were evaporated off during drying, the dry film thickness was estimated as a solvent free solid film containing the remaining binder and carbon from the ink. Therefore, the volume percentage of the solvent lost during drying was used to estimate the wet film thicknesses for the different ink dilutions.
Two- and four-point probe measurements were conducted to find the line resistance, sheet resistance and resistivity values of the printed lines and squares produced on the DEK 248 screen-printer. The sheet resistance measurements were conducted on the printed 45 mm × 45 mm squares using a 4-point probe method. A SDKR-13 probe (NAGY Messsysteme GmbH/NAGY Instruments, Gäufelden, Germany) with a tip distance of 1.3 mm was used with a Keithley 2400 digital Sourcemeter (Keithley Instruments, Cleveland, OH, United States), with subsequent conversion to sheet resistance using the appropriate correction factor from the data table proposed by Smits [34]. A total of 36 measurements (over 3 samples) were conducted for each dilution. Line resistance was measured using the same multimeter in two-point mode for the 700 and 500 µm nominal width lines over three prints for each of the ink dilutions.

3. Results

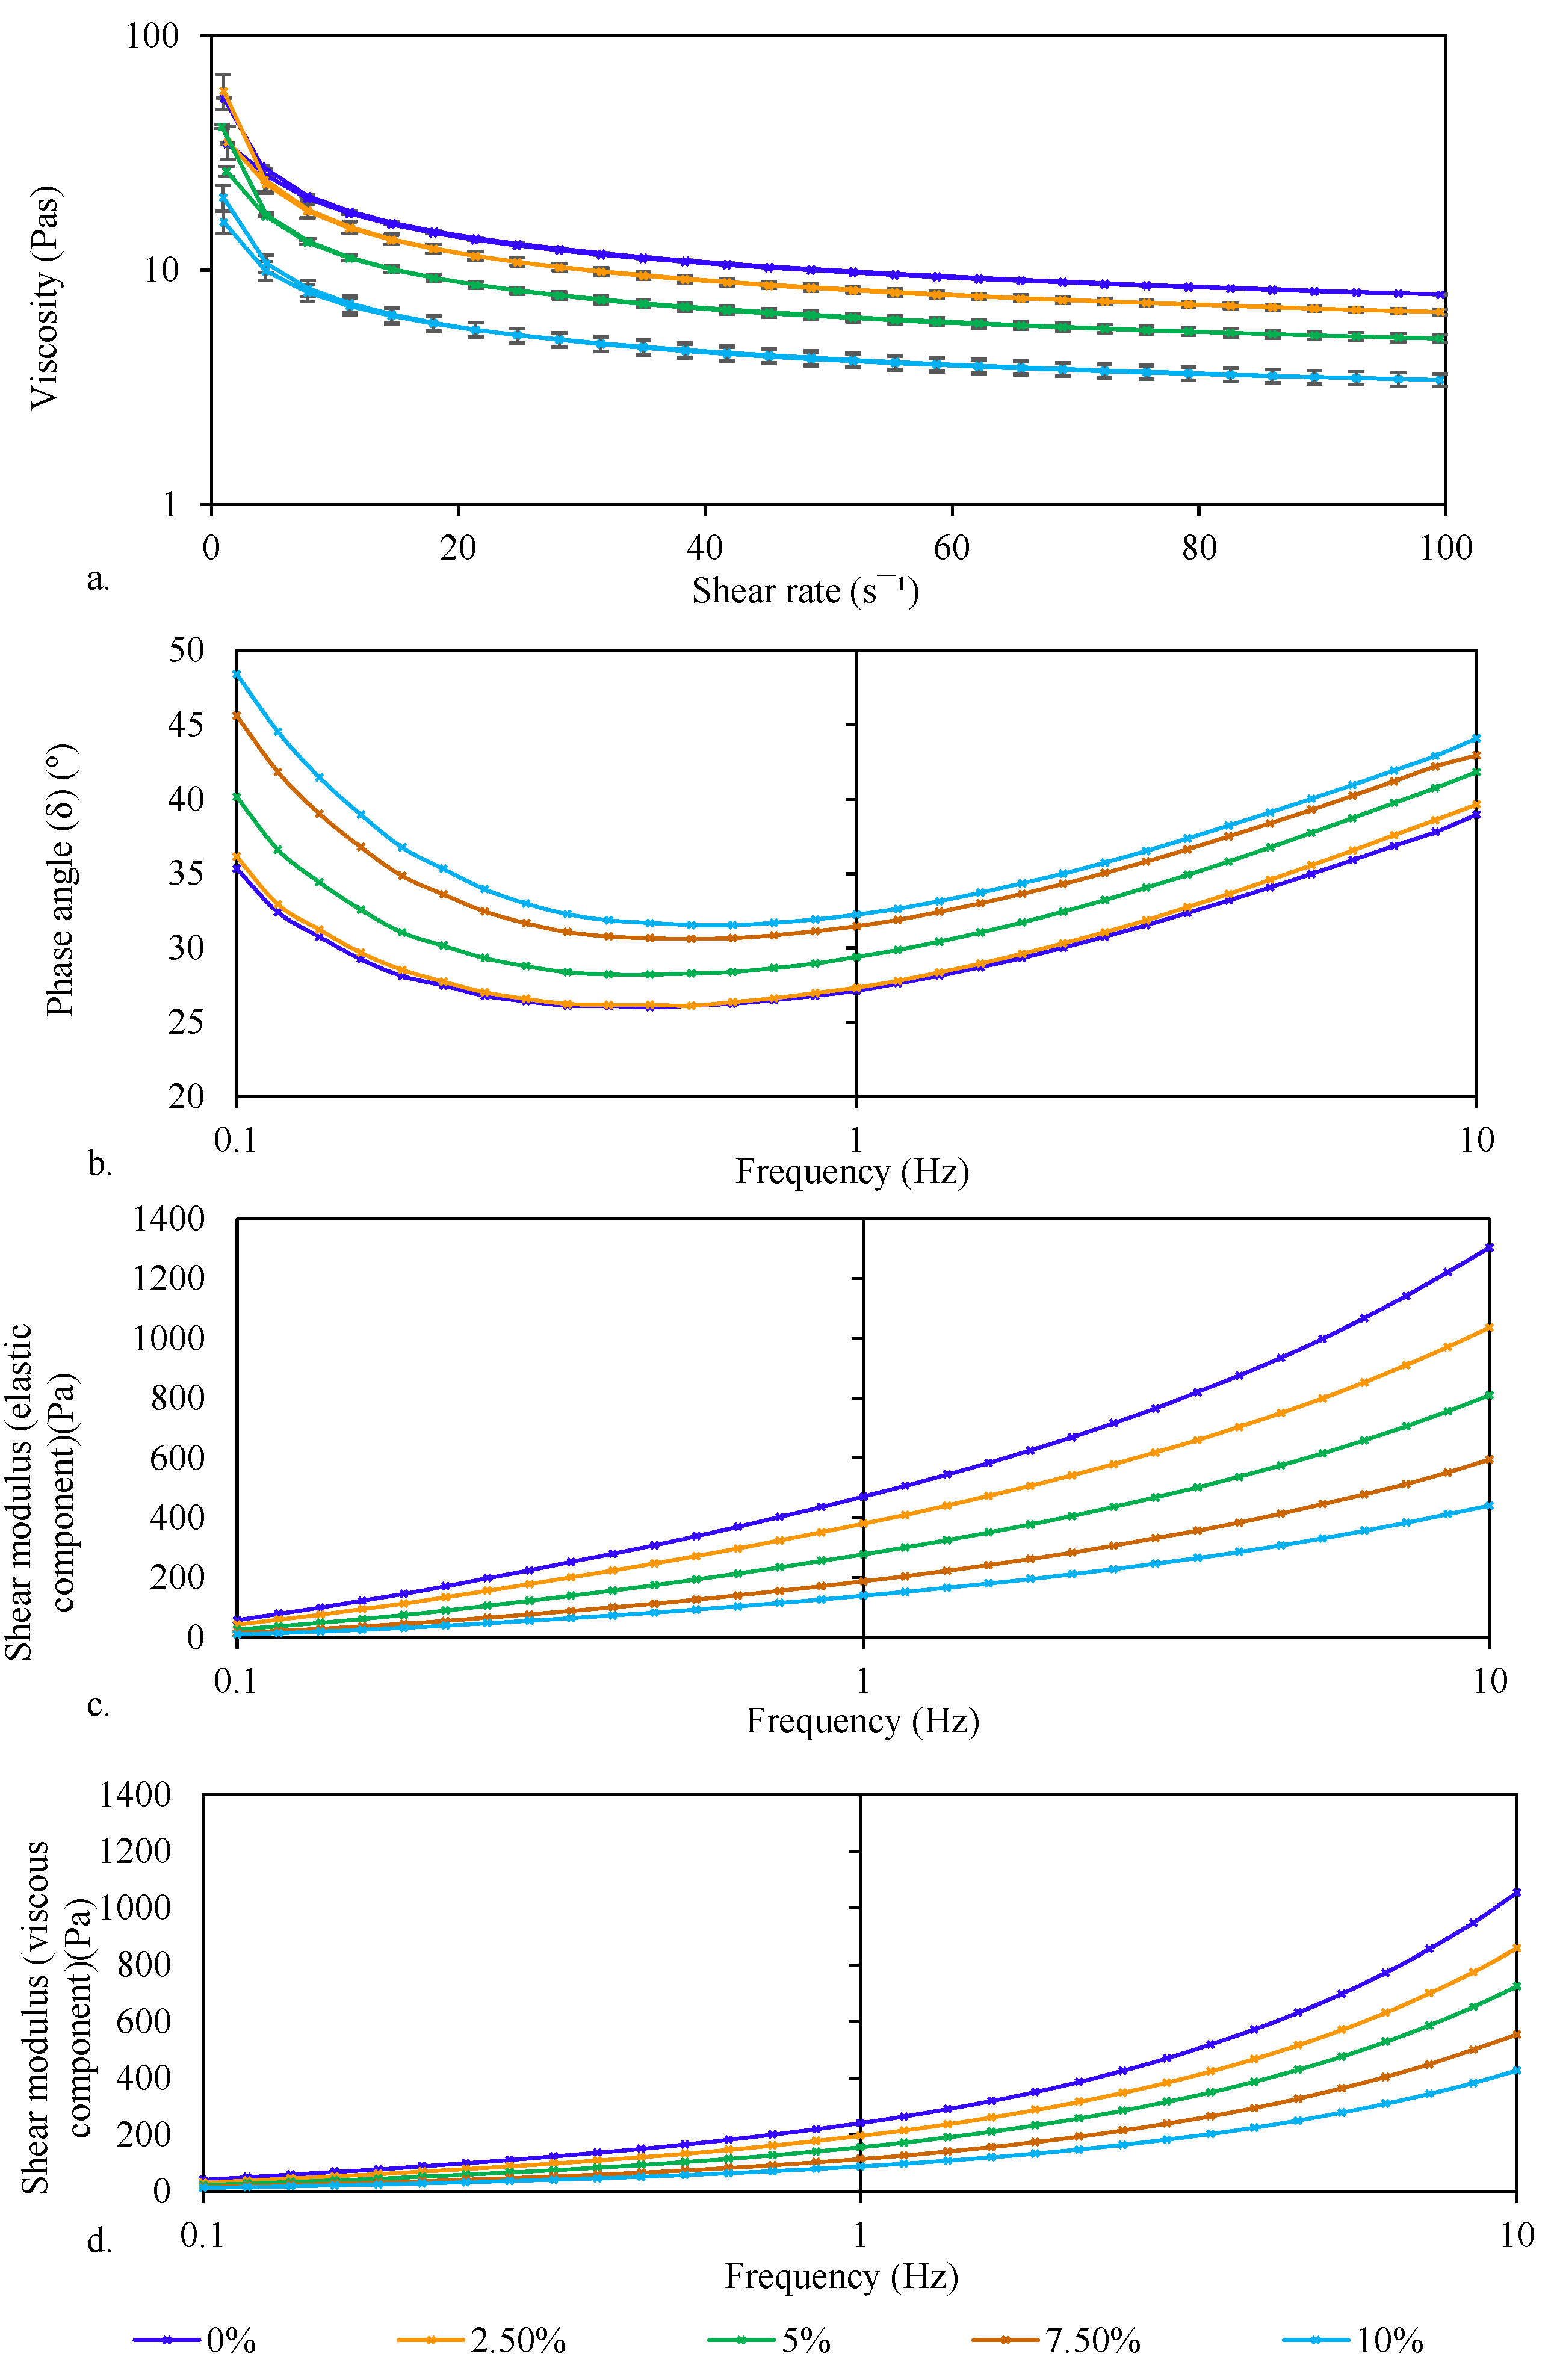
3.1. Characterisation of Ink Rheology and TGA

The TGA plot in Figure 2 shows the mass fraction remaining after heating the undiluted ink at various temperatures. At 500 °C, all solvent and resin materials have been removed from the sample, leaving only the carbon black and graphite materials which make up 32 wt.% of the initial mass of the ink. There are two distinctive changes in the rate of mass loss at around 170 and 210 °C which relate to the boiling points of the primary and secondary solvents in the ink, which are 2-Butoxyethanol and Terpineol respectively. Therefore, by 210 °C all of the solvents will have been evaporated off.
A further mass loss of around 3 wt.% occurred between 220 and 350 °C, presumed to be due to the thermal degradation of the binder. In this experiment, inks were dried at 100 °C to prevent damage to the substrate. On the TGA graph, only 10 wt.% has been lost at this point. However, given sufficient residence time, it had been found that all of the solvent will evaporate off to form a solvent free solid film (asymptotic at 0.3) [14]. This was used to calculate the wet film thickness based on the dry film thickness measurements, with the solvent mass of the other inks calculated based on the dilution weight percentage.
The viscosity data is presented in Figure 3 as plots of viscosity vs shear rate (a), phase angle vs oscillation frequency (b), elastic modulus (G’) vs oscillation frequency (c) and finally viscous modulus (G’’) vs oscillation frequency. The viscosity profiles (Figure 3a) show that all dilutions were highly shear thinning, meaning that the ink would flow more readily when subjected to higher shear rates during printing. The most significant reductions in viscosity occurred between 1 to 50 s−1. With increases in dilution, the shear thinning (pseudoplasticity) profile was found to have a similar rate of reduction in viscosity, but with a gradually reducing initial and final viscosity values. This is likely due to a reduction in particle to particle interactions associated with the reductions in relative volume of carbon particles in the solvent-resin matrix, enabling particles to align more readily with the flow. As well as this, there would be less hydrodynamic disturbance in the flow field as there are fewer particles for it to be diverted around [32]. All dilutions also showed relatively little hysteresis over the shear rates assessed, when shear was reduced back down to 1 from 100 s–1, suggesting the ink would take little time to recover to its initial viscosity after flow during printing.
Dilution of the ink led to reductions in elastic modulus (G’) at all measured frequencies. As with viscosity, this is associated with fewer particle to polymer and particle to particle interactions which are able to elastically store energy [32,35,36]. Viscous modulus (G’’) also reduced with dilution. For this ink, G’ was consistently larger than G’’, resulting in a more dominant elastic rather than viscous response as demonstrated with a phase angle (δ) typically below 45°. This greater elasticity would result in inks taking longer to separate.
The phase angles of the carbon ink were found to increase with dilution due to a greater relative reduction in elastic than viscous forces with dilution. The phase angle increased from 27° for the undiluted ink to 32° for the 10 wt.% diluted ink at a frequency of 1 Hz but there was little change in phase angle between the undiluted ink and 2.5 wt.% dilution across the frequencies tested, suggesting that this small dilution had relatively little effect on the elasticity of the ink. Further increases in dilutions led to a larger increase in δ, from around 27° at 2.5 wt.% dilution, to around 29° at 5 wt.% dilution at a frequency of 1 Hz, with similar increases in phase angle at lower and higher frequencies. Along with a comparable increase when going from 5 wt.% to 10 wt.% dilution, where phase angle increased to around 32° at 1 Hz.
G’ and G’’ both increased with frequency, while phase angle increased between frequencies of 0.3 and 10 Hz. The increase in moduli is a result of a greater number of particle-particle and particle-polymer interactions due to an increase in the frequency at which they are being agitated. At low agitation frequencies (below 0.3 Hz), the greater elastic response may be due to insufficient shear to align the particles and enable flow.

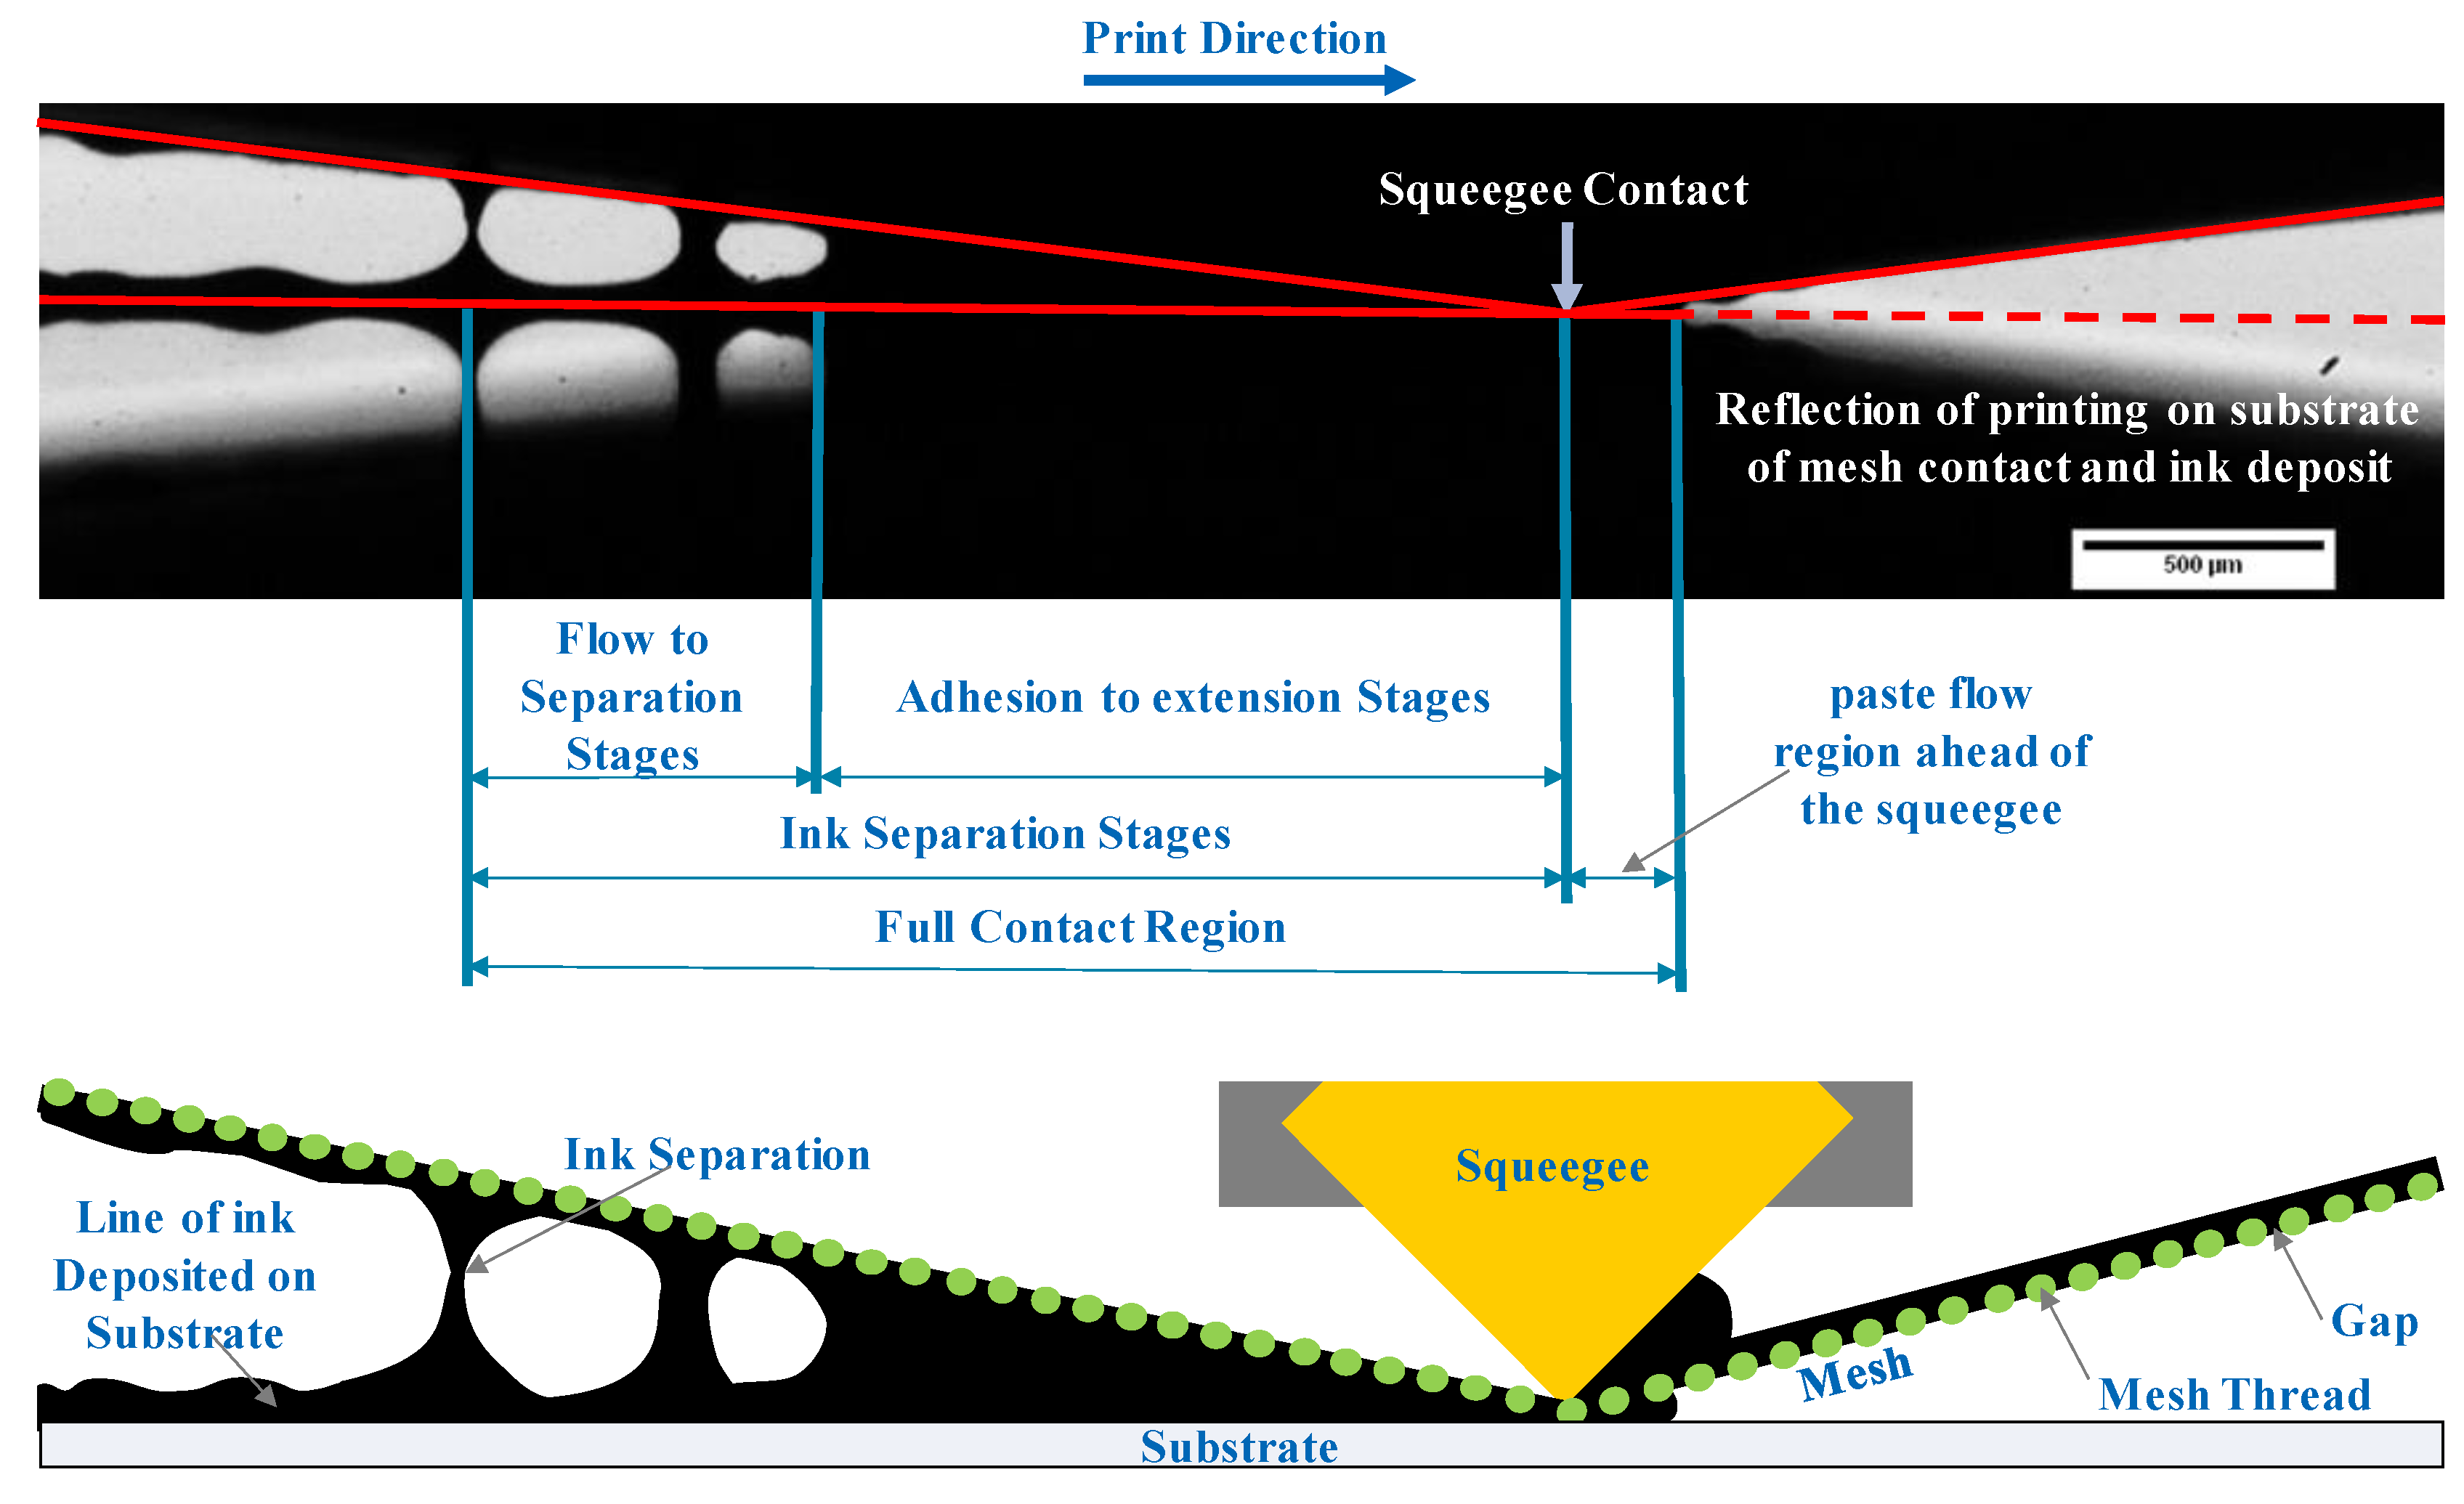
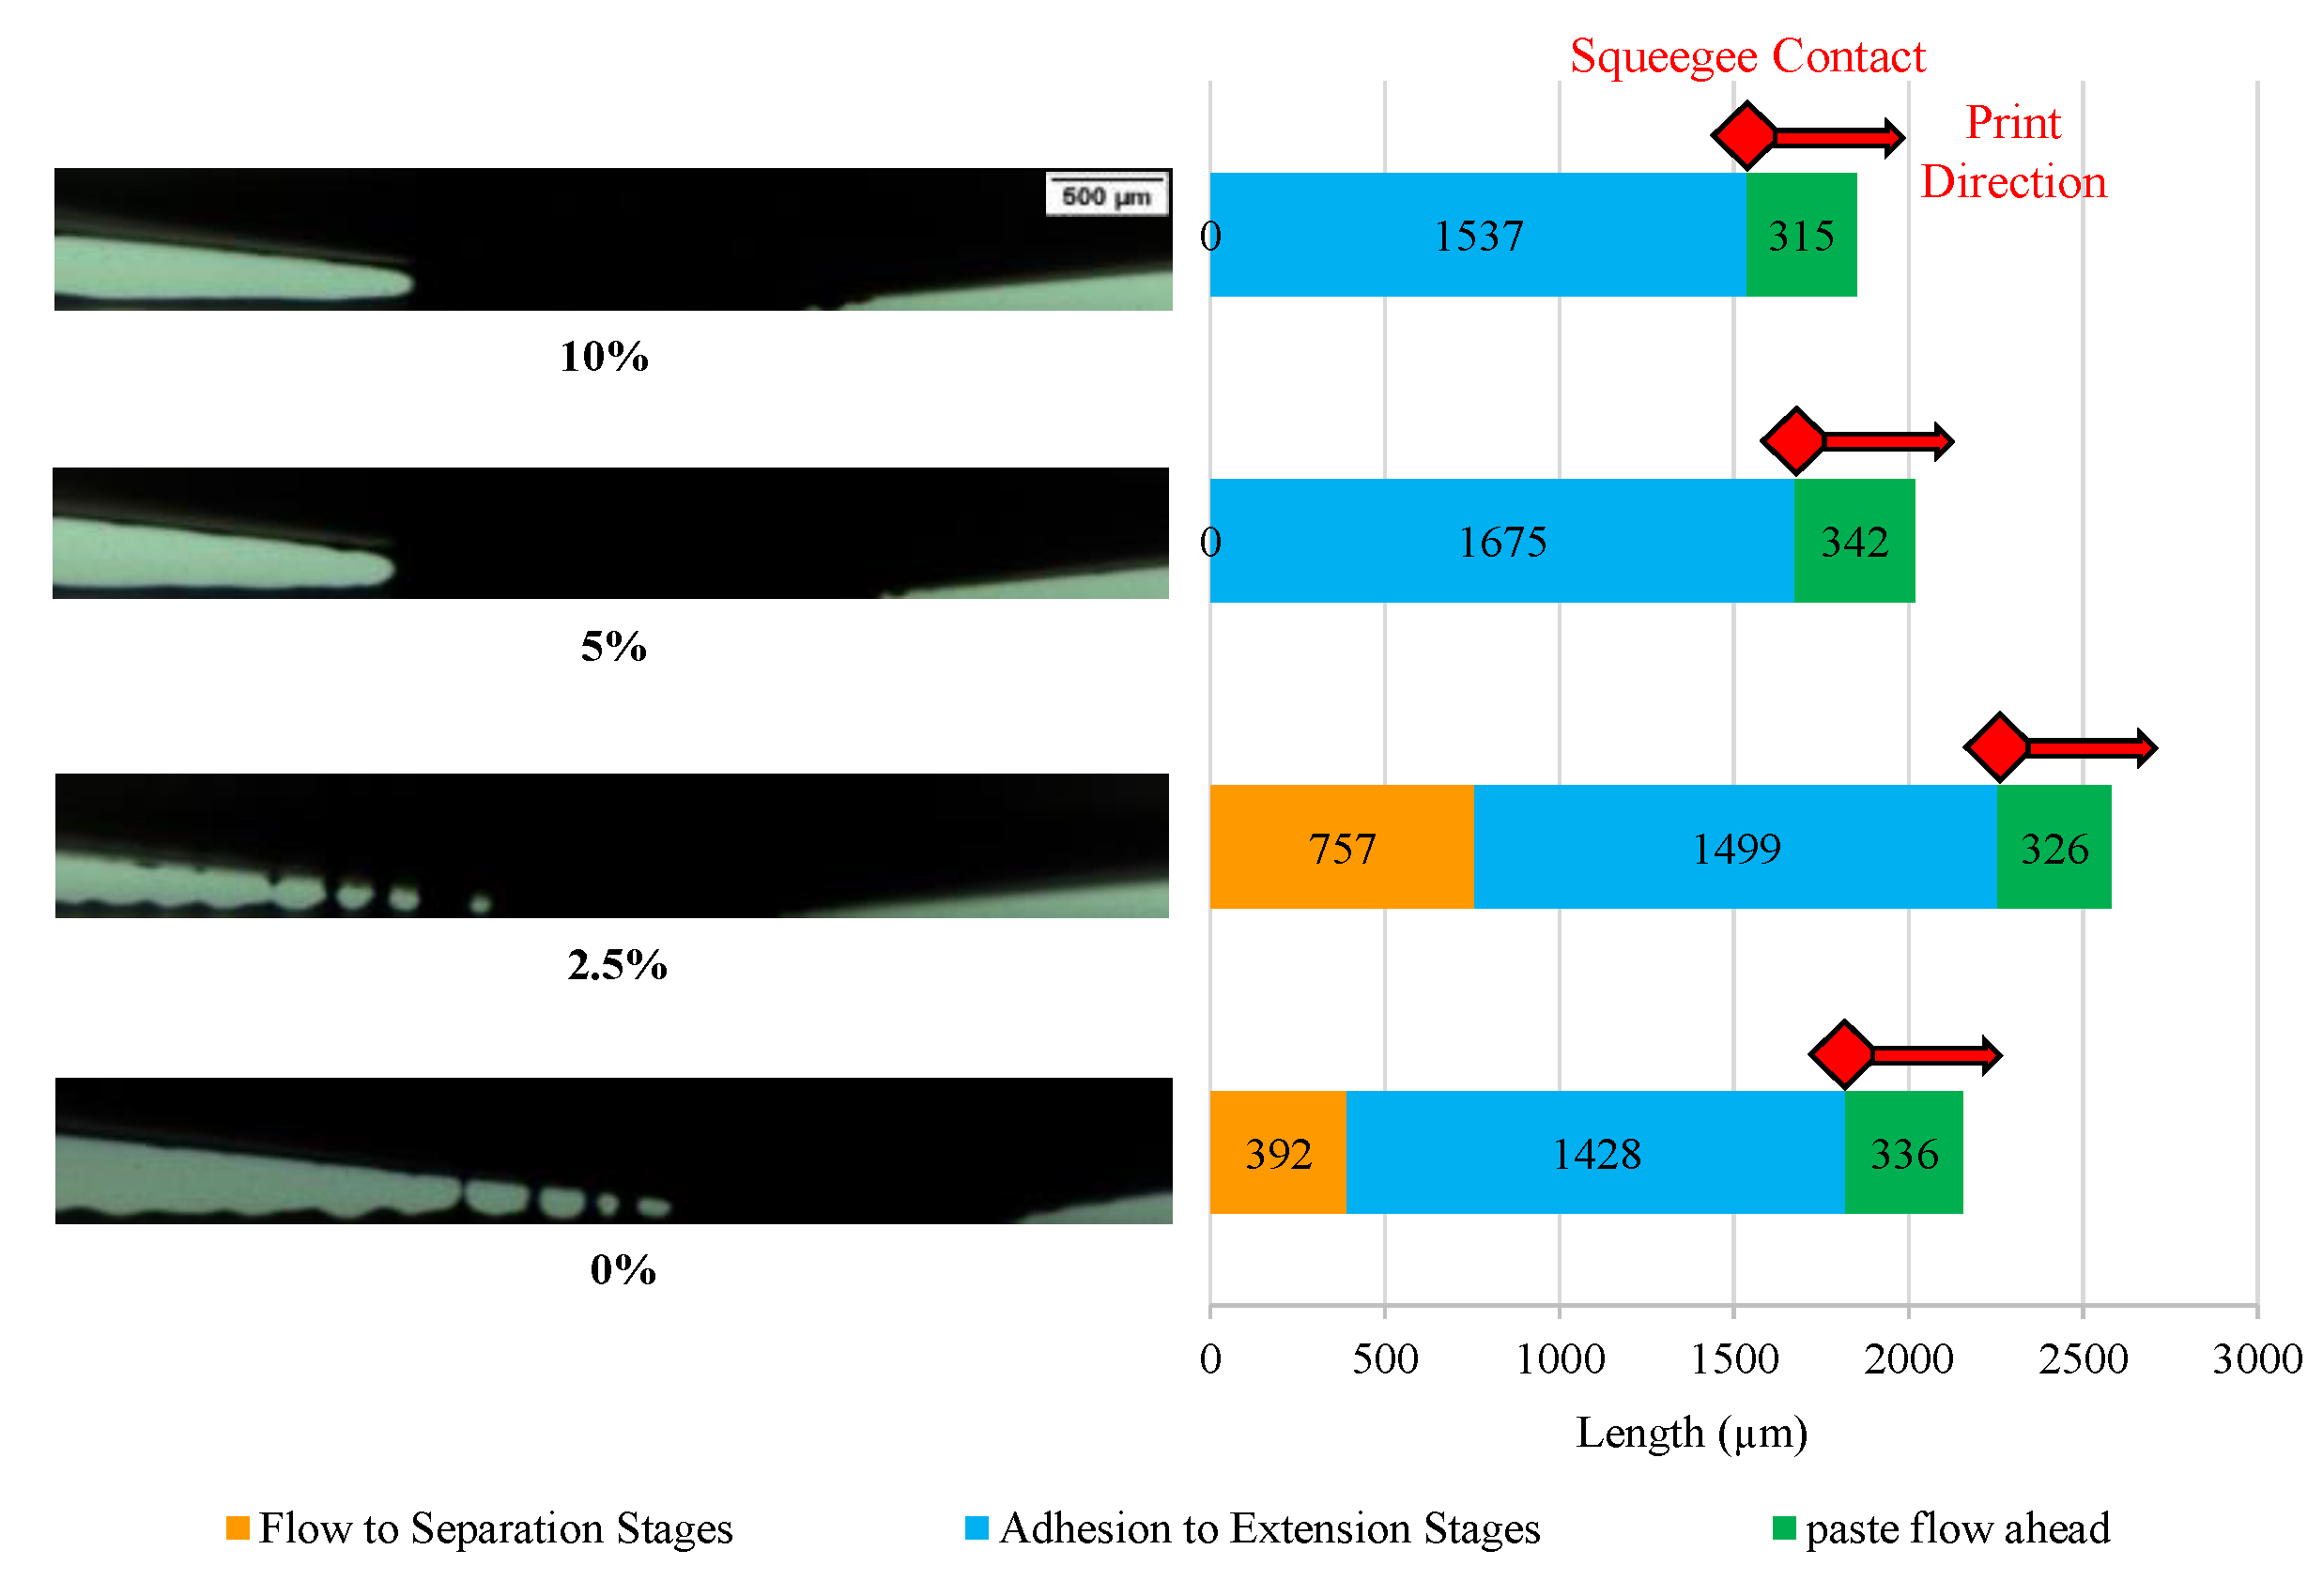
3.2. Ink Separation Mechanisms

An illustration of the ink deposition mechanisms at the various dilutions is shown in Figure 4. Images of the print interface are shown along with a chart of the relative lengths of each of the printing stages (as outlined in Figure 1 and Messerschmitt’s four stages of ink separation [26]). Dilution of the ink increases the length of the adhesion to extension stages with negligible effect on the paste flow length ahead of the squeegee. More significantly, the flow to separation stages were found to cease at higher dilutions (5% to 10%) (Figure 4).
Between the undiluted ink (0 wt.%) and 2.5 wt.% diluted ink, there was a relatively small increase in the average adhesion to extension stage lengths, from 1428 µm to 1499 µm and an increase in the average flow to separation stage lengths from 392 to 757 µm, leading to an overall increase in the full contact area from 2156 to 2582 µm. Both inks showed similarities in deposition patterns, where both print cycles exhibited regular filamentation after the extension stage. They both produced an average of around 10 filaments over each assessed print cycle, which led to subsequent necking and ink splitting across the flow to separation stages. This similarity is in line with the rheological profiles of the inks as there was little change in the viscosity or phase angle between these two inks, when compared with the other dilutions.
The inks with higher dilutions of 5 wt.% and 10 wt.% solvent only exhibited the first two stages of the four stages of ink separation, where the inks adhered to the substrate, then extended into a long, continuous body of ink connecting the mesh and substrate. Unlike the 0 and 2.5% dilutions, the 5% and 10% dilutions did not then separate into individual filaments. Instead these dilutions yielded directly after the extension zone, enabling a clean separation of ink between the mesh and substrate without forming any tears in the extended body of ink. In terms of the separation lengths, there was a reduction in the full contact distance lengths with increases in dilution concentration, from 2582 µm at 2.5 wt.% dilution, to 2017 µm at 5 wt.% dilution, then to 1852 µm 10 wt.% dilution. However, there was an increase in the adhesion to extension lengths, from 1499 µm at 2.5 wt.%, to 1675 µm at 5 wt.%. However, this then reduced to 1537 µm at 10 wt.%, but this is still higher than the adhesion to extension lengths observed at 2.5 wt.% dilution and in the undiluted ink. The undiluted ink and the 2.5 wt.% dilution were found to have lower phase angle than the higher dilutions and therefore have a greater elastic response due to the greater number of particle-particle and particle-polymer interactions. This elasticity resulted in the ink splitting off into filaments while remaining in contact with both the mesh and substrate simultaneously over a greater horizonal length in both cases. This also supports the reduction in the full contact length with increases in dilution, as the adhesion to extension stage remains similar for all dilutions, rather than separate directly after the adhesion to extension stage, the more elastic inks form filaments while remaining in contact with both the mesh and substrate for a longer distance afterwards.
The greater interparticle distance of the higher dilutions resulted in fewer particle-particle interactions and therefore more liquid like behaviour. This enabled the ink to cleanly separate after the extension stage.
Comparisons between peaks in the print profile and the location of filament separation during ink separation are shown in Figure 5 for a study conducted on both the undiluted ink and 10 wt.% dilution being printed as 200 µm lines. On the print produced with the undiluted ink, there were a series of raised areas across the print profile which were around 10 µm higher than the average film thickness either side of these peaks. When comparing the print profile with the corresponding high-speed imaging of the ink separation mechanism for the given line, it was found that the locations of these peaks corresponded with the location where the filaments separated and was not related to mesh geometry (61 threads/com corresponds with features every 0.16 mm). These peaks can lead to increases in print roughness and reductions in print homogeneity. Whereas the 10 wt.% ink which did not form any filaments during ink separation had a far more consistent print profile with only small areas of high film thickness, most likely due to the random orientation of the graphite flakes in the ink, as seen in previous studies [10,37].

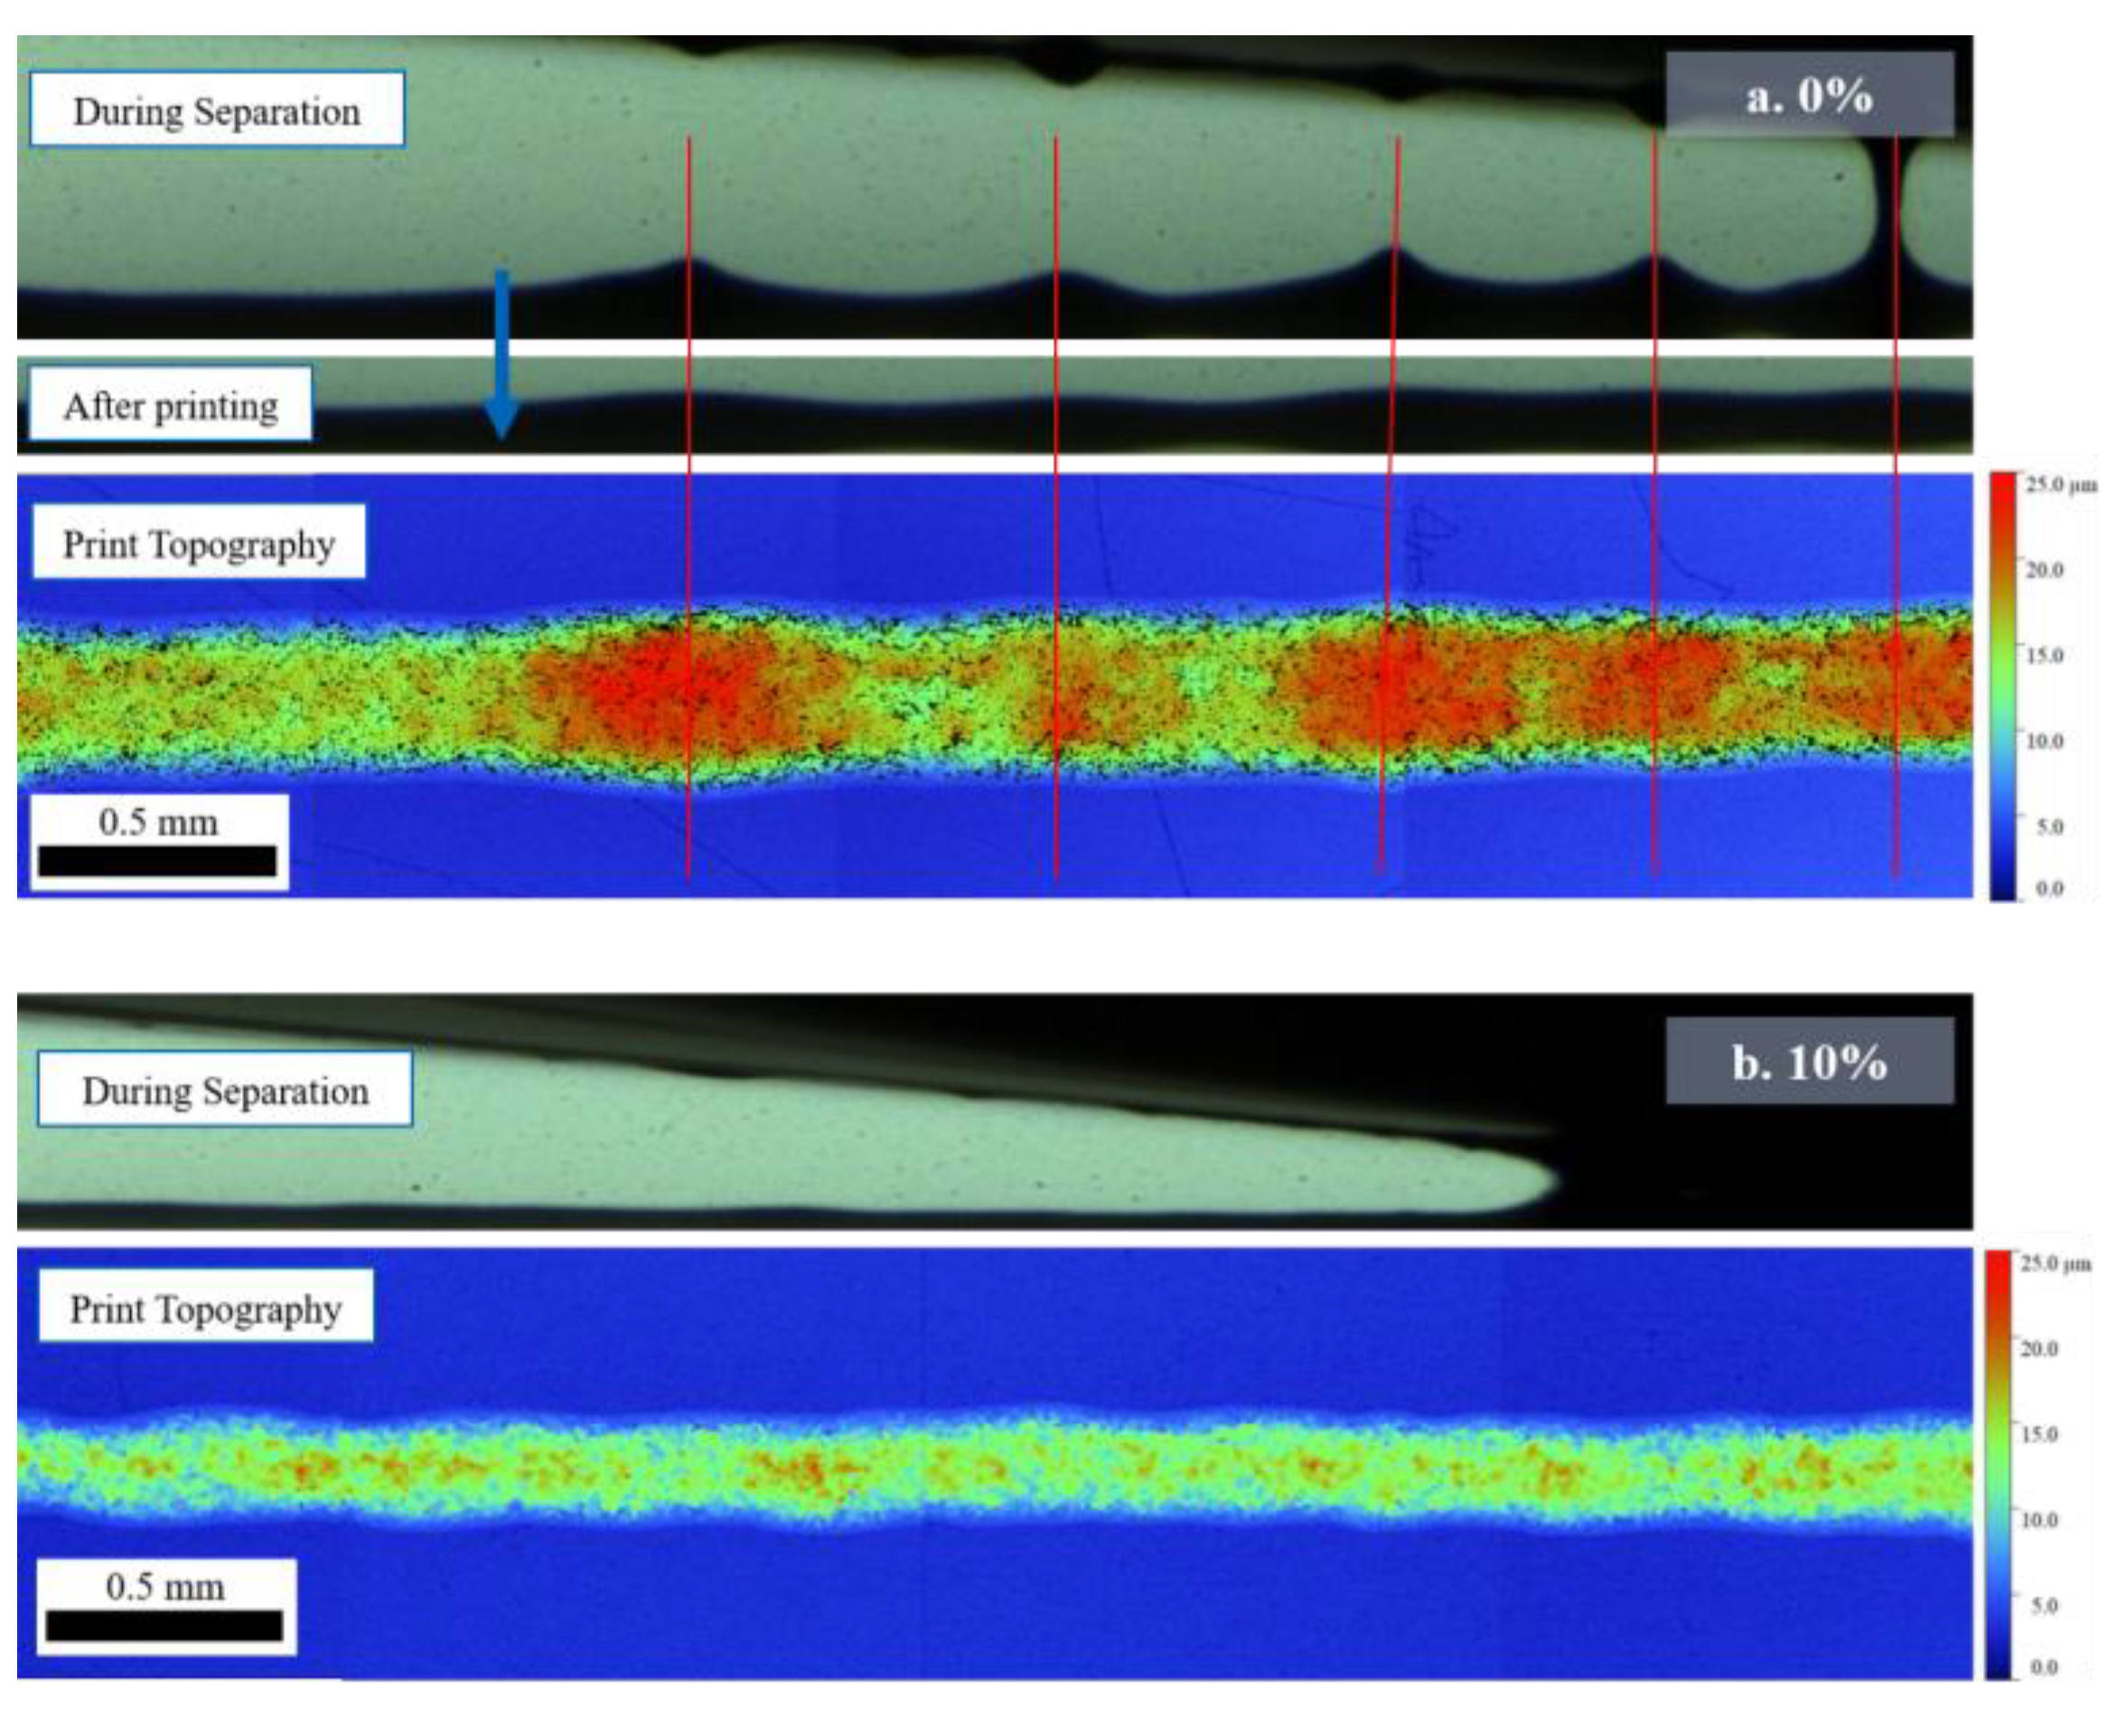
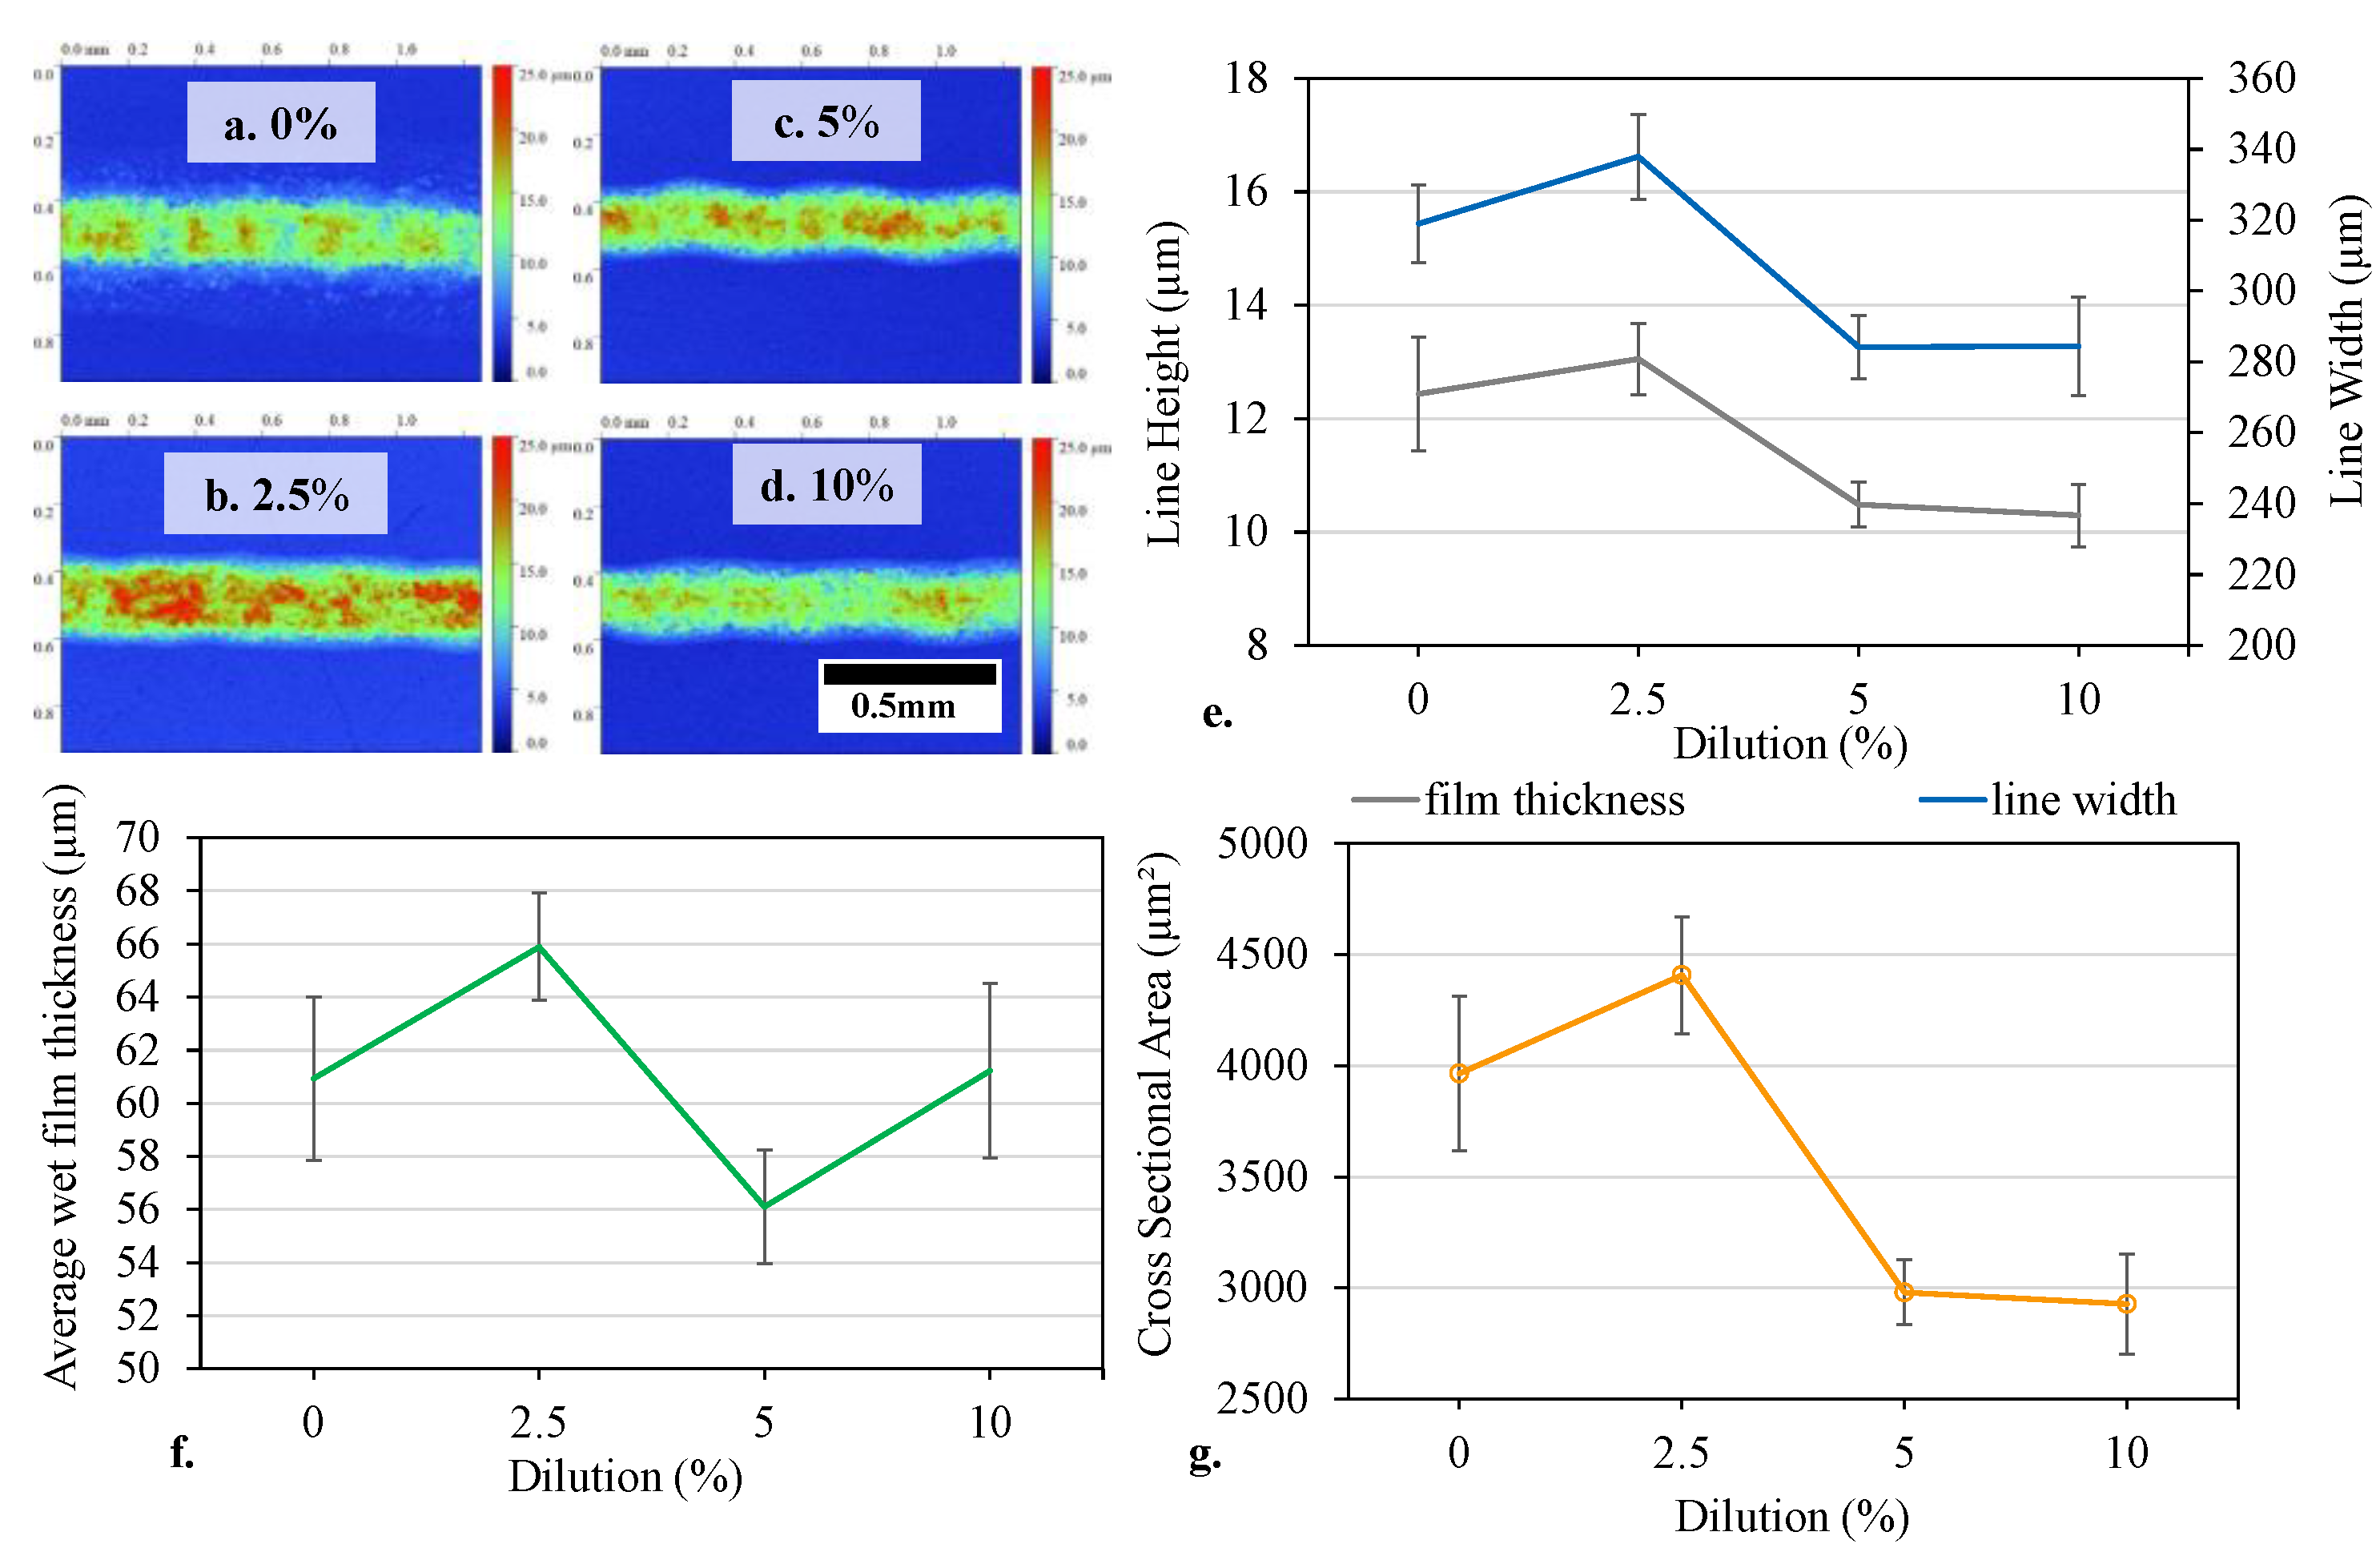
3.3. Print Characterisation

3.3.1. Custom Screen-Printing Apparatus

The ink film thickness (wet and dry) and line widths of the prints produced for each of the ink dilutions on the custom screen-printing apparatus are compared in Figure 6, with corresponding topography images of the prints (Figure 6a–d). There was an overall reduction in the average dry film thicknesses and line widths of the printed lines as the ink was diluted. Although the general trend was of reduced ink deposition with dilution, the 2.5 wt.% diluted ink produced a slightly higher dry film thickness (13 µm) than the undiluted ink (12.4 µm), while the 5 wt.% and 10 wt.% dilutions produced similar average film thicknesses (10.5 and 10.3 µm respectively). Line width and therefore cross-sectional area of the deposits also followed similar trends. Average line widths for undiluted, 2.5%, 5% and 10% dilution were 318, 338, 284, and 284 µm, respectively. The corresponding cross-sectional areas (CSA) of ink deposits (calculated by multiplying the film thickness by the line width) were 3966, 4409, 2980, and 2927 µm², respectively.
When comparing the ink deposition (thickness, width and area) with the print stages visualised in Figure 5, there was a correlation between amount of ink deposited and the overall length, and therefore contact time, of the print stages (i.e. an increase then decrease). In terms of line width, the initial increase in line width may be due greater slumping as the ink viscosity is increased, but eventually this is counteracted by the reduction in solid content, leading to narrower line widths. A general trend of reduction in dry ink deposit with dilution would be expected due to the lowering of solid content with dilution. However, when solvent mass was accounted for these differences became less significant (Figure 6f).
Despite the similarities in wet film deposit, in the context of average deposit weight, there was a notable change in the separation mechanisms due to the increase in solvents and reduction in carbon loading, as illustrated in Figure 5 and Figure 6, which resulted in differing topographies of printed lines.
Resistance data for the printed lines produced on the custom screen-printing apparatus is shown in Figure 7. Data is presented as measured but also in terms of resistivity (R * (A/l) where R is the resistance, A is the cross-sectional area of the print and l the length (6 mm)). As the ink was diluted to 2.5% there was a reduction in line resistance due to the greater amount of ink deposit. As the ink was further diluted, the resistance increased due to the decline in ink deposition between 2.5% and 10% dilution. When considered in terms of resistivity, there was a steady drop in resistivity between 0% and 5% dilution, with little change between the 5% and 10% dilution. In this sense, the printed line became more effective per amount of ink deposited as it was diluted. This can be correlated with the smoothness of the printed lines; in the undiluted state, the print produces undulation in both width and height (Figure 6), while diluted ink produces lines which are more consistent although the overall deposit of ink is lower.

3.3.2. Full Scale Printing Press

The average film thickness (wet and dry) and line widths of the 500 and 700 µm lines, along with the film thickness (wet and dry) of the printed solid squares produced on the screen printer for each of the ink dilutions are shown in Figure 8. Corresponding topography images of the 500 µm lines are also shown (Figure 8a–d). There was a gradual reduction in the average dry film thickness of both the printed lines and squares with dilution (Figure 8g). The average dry film thickness of the 500 µm lines reduced from 8 µm for the undiluted ink to 5 µm for the ink diluted by 10 wt.%. The changes in the estimated wet film thickness with increases in solvent dilution were less significant than those seen with the dry film thicknesses (Figure 8h). As with the printed lines produced on the screen-printing apparatus, this indicates that the increased solvent loss with higher diluted inks accounts for some of the reduction in the dry film thickness.
There was an initial increase in the line width from the undiluted ink to the 2.5 wt.% dilution, as the ink viscosity reduced and caused the lines to slump more. This led increases in average line width from 779 to 857 µm for the 700 µm line and increases in width from 644 to 707 µm for the 500 µm line when going from the undiluted ink to the 2.5 wt.% However, this was then countered by the reduction in solid content which led to overall narrower lines with higher dilutions, as also shown in the lines produced on the custom screen-printing apparatus (Figure 6). This led to an overall reduction in the average line to 779 µm for the nominal 700 µm line and to 611 µm for the 500 µm line for the ink diluted by 10 wt.% (Figure 8e).
However, when the total cross-sectional area (CSA) of ink deposited was considered, the trend was comparable with the changes in film thickness (Figure 8f). There was a reduction in CSA after each increase in dilution. This can also be observed in the white light microscopy images shown in Figure 8a–d, which showed a reduction in the film thickness with increases in dilution percentage, but relatively little visible change in the line width or print consistency and roughness. This is also supported by the surface roughness values in Figure 9, measured on the centre of the printed squares, which showed little change with dilution. Fluctuations in roughness lay within the standard deviation (illustrated by error bars), although the 2.5 wt.% dilution had a higher average maximum surface roughness (Sz). This higher average Sz may be due to the larger flow to separation stage length of the 2.5 wt.% dilution, where the greater number of filaments formed during separation lead to a greater amplitude in the print surface.
Both Screen-printing presses show an overall reduction in the film thickness deposited with dilution, as the film thickness is related to the carbon concentration of the ink. However, there were some differences in the print behaviours due to assessing different line widths, differences in screen sizes and press speed capabilities.
The electrical characterisation of the prints conducted on the screen press for the series of ink dilutions is shown in Figure 10. The chart shows the average line resistance (Figure 10a) and resistivity (Figure 10b) for the 500 µm and 700 µm lines, as well as the average sheet resistance (Figure 10c) and sheet resistivity (Figure 10d) of the printed squares. Sheet resistances are displayed as measured (with the correction factor) and, to account for the variation in film thickness after post processing, resistivities were also calculated as the product of sheet resistance and ink film thickness. Reductions in the quantity of ink deposited were found to cause increases in line and sheet resistances. However, there was relatively little change in line resistance for both widths assessed between the undiluted ink (0 wt.%) and 5 wt.% diluted ink, as shown in Figure 10a. The nominal 700 µm line produced an average line resistance of 0.86 KΩ for the undiluted ink, 0.83 KΩ for the 2.5 wt.% diluted ink and 0.86 KΩ for the 5 wt.% diluted ink. Small dilutions in the ink up to 5 wt.% have a negligible effect on the line resistance, which are within standard deviation. However, this then increased to 1.02 KΩ for the 10 wt.% diluted ink. Similar trends were found for the 500 µm nominal width lines. Where the average line resistance was 1.10 KΩ for the undiluted ink, 1.13 KΩ for the 2.5 wt.% diluted ink and 1.16 KΩ for the 5 wt.% diluted ink, which then increased to 1.52 KΩ for the 10 wt.% diluted ink. When the cross-sectional area of the ink deposited is taken into account, there was an overall reduction in the line resistivity from 2.3 × 10⁻⁴ Ω·m for the undilute ink to 1.86 × 10⁻⁴ Ω·m for the 10 wt.% dilution for the 700 µm nominal width lines. The most significant reduction for the 700 µm line was between the undilute ink and the 2.5 wt.% dilution, with further dilutions leading to changes within standard deviation. The 500 µm nominal width lines showed a gradual reduction in resistivity from 2.3 × 10⁻⁴ Ω·m for the undilute ink to 1.99 × 10⁻⁴ Ω·m. This aligns with the changes seen in Figure 6, where the improvement in the smoothness of the printed lines resulted in a better overall electrical performance for a given area of ink deposited.
The sheet resistance values gradually increased with dilution, from the undiluted ink to 10 wt.% dilution, as shown in Figure 10b. However, there was relatively little fluctuation in the average sheet resistivity since the film thickness was accounted for (Figure 10c). The changes in resistivity were less significant on these larger printed squares than with the printed lines as the edge effects are less significant. Variations in average sheet resistivity for the various ink dilutions were found to be negligible. This was a result of the countering effects of the average sheet resistance increasing with greater dilutions, while the average film thickness reduced with greater dilutions, although there was a slight overall increase. The 2.5 wt.% diluted ink was found to produce the lowest average sheet resistivity of 0.013 Ω·cm and the 10 wt.% diluted ink produced the highest average sheet resistivity of 0.014 Ω·cm.

4. Discussion

The correspondence between longer adhesion to extension lengths and a lack of filamentation during ink separation has also been observed by the authors [27] in previous studies on the undiluted ink. When assessing the effect of snap distance, lower snap off distances were found to produce longer adhesion to extension lengths. These enabled the inks to yield at a lower force, leading to clean separation without the formation of filaments. In both cases, this clean separation without the formation of filaments may be due to the elastic response of the ink. In the previous study, the increase in snap off distance would result in the mesh and substrate moving apart at a greater rate. This increase in separation rate can be related to the viscoelastic studies conducted on the undilute ink, where higher frequencies resulted in a greater elastic response (Figure 3b).
The increase in dilution led to reductions in the interparticle distances, leading to fewer particle to particle and particle to polymer interactions that elastically store energy, as shown in Figure 3b when comparing the dilutions at any given frequency. This resulted in the more elastic undiluted and 2.5 wt.% dilution splitting off into filaments while remaining in contact with both the mesh and substrate simultaneously over a greater horizonal length. This also supports the reduction in the full contact length with increases in dilution, as the adhesion to extension stage remains similar for all dilutions, while rather than separate, the more elastic inks form filaments while remaining in contact with both the mesh and substrate for a longer distance afterwards.
In itself, this would suggest a trend of smoother ink films with increased dilution leading to a reduction in filamentation, as the formation of filaments during separation led to a series of peaks and troughs on the ink film surface. Figure 8 identified that the locations of the filaments during separation led to notable raised areas on the printed film which increased the surface roughness, while the average surface roughness was unaffected. This is most likely due to the random orientation of the large graphite flakes in the ink determining this, with flakes measuring up to tens of microns, as quantified in previous studies [10,37]. Therefore, this separation mechanism may have a more significant effects on inks with contain smaller particles or which recover to their initial viscosity in a shorter time period.
The extent of the effect of filament formation on print roughness is also related to the recovery time of the ink, which in this case was relatively fast, as shown by the relatively little hysteresis shown for all dilutions over the shear rates assessed (Figure 3). Therefore, the surface roughness of inks with a quicker recovery time may be more adversely affected by the formation of filaments during printing, whereas an ink with a longer recovery time would be less affected. Additionally, an ink with a lower phase angle and greater elasticity would also be greater effected, leading to more filaments forming during separation. In severe cases, this could lead to the formation of more significant peaks and troughs in the print profile. This could cause print defects such as agglomerations or mesh marking, where there are significantly raised areas in the print profile which correspond with the frequency of the mesh used that in severe cases are surrounded by areas of little or no ink deposit. Mesh marking has been observed in other studies with highly viscous and elastic inks, where it has had a significant impact of the electrical performance of the print [10,37,38,39]. The elasticity of the ink can depend on several factors including the particle morphologies, interactions between particles, particle size distribution as well as solvents and resins used. [9,10,11,12,22,23]. Therefore, the presence of filamentation during ink separation during screen-printing can have detrimental effects on the print roughness and therefore performance. This cannot be predicted with shear rheological analyses alone, therefore this method provides a way of relating the rheological profile of the ink with the ink separation mechanisms during printing which influence the print profile. This can enable the ink to be modified to reduce the elasticity and observe and quantify the presence of filaments and their effect on the print profile without the need for large print runs.

5. Conclusions

These studies have used high-speed imaging to identify the effect of altering the carbon concentrations of carbon-based screen-printing inks on the deposition and separation mechanisms in screen-printing. The results correlated with the deposition theory by Messerschmitt, although the final two stages of Messerschmitt’s ink deposition theory were not present in all inks assessed. This was the case for the inks which were diluted by 5 wt.% or higher of solvent due to a reduction in the interparticle distance leading to less particle-particle interaction and resulting in lower elasticity. This resulted in more liquid like behavior that enabled the ink to separate after the extension stage. Rather than remaining in simultaneous contact with the mesh and substrate for a greater distance and form filaments prior to separation as with the more elastic undiluted ink and 2.5 wt.% dilution. There were clear correlations between the average cross-sectional area of printed lines and the average length of the flow to separation stages. With the higher viscosity inks (<5 wt.% diluted) which produced filamentation during separation, depositing greater dry film thicknesses due to greater carbon content, which resulted in lower line and sheet resistances with better electrical performances. Although there was little change in Sa, the 2.5 wt.% dilution was found to have a greater Sz due to its greater number of filaments formed during separation. This was a result of the filament locations creating peaks in the print topography which led to a greater amplitude in the print profile. As the shear rheological analyses alone do not identify the point at which the ink separation mechanisms during screen-printing alter with changes in viscosity and viscoelasticity, this technique can be used to improve the understanding of how ink rheology and print quality are interlinked. This has shown that the rheological profile of screen-printing inks can have quantifiable effects on the ink separation mechanisms during screen-printing which relate to the print profile and performance. Therefore, by identifying this relationship between the filament formation during ink separation and the subsequent print roughness, this technique could be used during ink formulation alongside traditional rheological analyses to optimize the rheological properties to improve print continuity and therefore performance without the need for large print runs. To understand how these ink separation stage lengths vary with a greater range of inks, substrates and settings, future work should be conducted on other functional materials and graphics-based screen-printing inks of a range of rheological profiles.

Author Contributions

Conceptualization, S.-J.P.; methodology, S.-J.P. and E.J.; validation, S.-J.P.; formal analysis, S.-J.P.; investigation, S.-J.P.; data curation, S.-J.P.; writing—original draft preparation, S.-J.P.; writing—review and editing, S.-J.P., C.P., E.J., and T.C.; visualization, S.-J.P., C.P., and E.J.; supervision, C.P., E.J., and T.C.; funding acquisition, T.C. All authors have read and agreed to the published version of the manuscript.

Funding

This research was funded by the European Social Fund via the Welsh Government, the Engineering and Physical Sciences Research Council (Grant Reference: EP/L015099/1), as well as by icmPrint through the Materials and Manufacturing Academy (M2A) Doctoral Training Scheme.

Conflicts of Interest

The authors declare no conflict of interest.

References

  1. Philip, B.; Jewell, E.; Greenwood, P.; Weirman, C. Material and process optimization screen printing carbon graphite pastes for mass production of heating elements. J. Manuf. Process. 2016, 22, 185–191. [Google Scholar] [CrossRef]
  2. Kang, J.; Kim, H.; Kim, K.S.; Lee, S.K.; Bae, S.; Ahn, J.H.; Kim, Y.; Choi, J.; Hong, B.H. High-performance graphene-based transparent flexible heaters. Nano Lett. 2011, 11, 5154–5158. [Google Scholar] [CrossRef] [PubMed]
  3. Tehrani, Z.; Burwell, G.; Azmi, M.M.; Castaing, A.; Rickman, R.; Almarashi, J.; Dunstan, P.; Miran Beigi, A.; Doak, S.H.; Guy, O.J. Generic epitaxial graphene biosensors for ultrasensitive detection of cancer risk biomarker. 2D Mater. 2014, 1, 025004. [Google Scholar] [CrossRef]
  4. Morrin, A.; Killard, A.J.; Smyth, M.R. Electrochemical characterization of commercial and home-made screen-printed carbon electrodes. Anal. Lett. 2003, 36, 2021–2039. [Google Scholar] [CrossRef] [Green Version]
  5. Tehrani, Z.; Korochkina, T.; Govindarajan, S.; Thomas, D.J.; O’Mahony, J.; Kettle, J.; Claypolea, T.C.; Gethin, D.T. Ultra-thin flexible screen printed rechargeable polymer battery for wearable electronic applications. Org. Electron. 2015, 26, 386–394. [Google Scholar] [CrossRef]
  6. Suren, S.; Kheawhom, S. Development of a high energy density flexible zinc-air battery. J. Electrochem. Soc. 2016, 163, A846–A850. [Google Scholar] [CrossRef] [Green Version]
  7. Baker, J.; Hooper, K.; Meroni, S.; Pockett, A.; McGettrick, J.; Wei, Z.; Escalante, R.; Oskam, G.; Carnie, M.; Watson, T. High throughput fabrication of mesoporous carbon perovskite solar cells. J. Mater. Chem. A 2017, 5, 18643–18650. [Google Scholar] [CrossRef] [Green Version]
  8. Zhang, L.; Liu, T.; Liu, L.; Hu, M.; Yang, Y.; Mei, A.; Han, H. The effect of carbon counter electrodes on fully printable mesoscopic perovskite solar cells. J. Mater. Chem. A 2015, 3, 9165–9170. [Google Scholar] [CrossRef]
  9. Oxfall, H.; Ariu, G.; Gkourmpis, T.; Rychwalski, R.W.; Rigdahl, M. Effect of carbon black on electrical and rheological properties of graphite nanoplatelets/poly(ethylene-butyl acrylate) composites. Express Polym. Lett. 2015, 9, 66–76. [Google Scholar] [CrossRef] [Green Version]
  10. Phillips, C.; Al-Ahmadi, A.; Potts, S.J.; Claypole, T.; Deganello, D. The effect of graphite and carbon black ratios on conductive ink performance. J. Mater. Sci. 2017, 52, 9520–9530. [Google Scholar] [CrossRef] [Green Version]
  11. Lei, H.; Pitt, W.G.; McGrath, L.K.; Ho, C.K. Resistivity measurements of carbon-polymer composites in chemical sensors: Impact of carbon concentration and geometry. Sens. Actuators B Chem. 2004, 101, 122–132. [Google Scholar] [CrossRef]
  12. Jewell, E.H.; Hamblyn, S.M.; Claypole, T.C.; Gethin, D.T. The impact of carbon content and mesh on the characteristics of screen printed conductive structures. Circuit World 2013, 39, 13–21. [Google Scholar] [CrossRef]
  13. Jewell, E.; Philip, B.; Greenwood, P. Improved manufacturing performance of screen printed carbon electrodes through material formulation. Biosensors 2016, 6, 30. [Google Scholar] [CrossRef] [PubMed] [Green Version]
  14. Philip, B.; Jewell, E.; Worsley, D. The impact of solvent characteristics on performance and process stability of printed carbon resistive materials. J. Coat. Technol. Res. 2016, 13, 911–920. [Google Scholar] [CrossRef] [Green Version]
  15. Pan, J.; Tonkay, G.L.; Quintero, A. Screen printing process design of experiments for fine line printing of thick film ceramic substrates. J. Electron. Manuf. 1999, 9, 203–213. [Google Scholar] [CrossRef]
  16. Molamphy, T.A.; Stephenson, M.I.; Murphy, E.A. Application of experimental design to the solder paste screen printing process. Solder. Surf. Mt. Technol. 1992, 11, 4–6. [Google Scholar] [CrossRef]
  17. Jewell, E.H.; Claypole, T.C.; Gethin, D.T. The Impact of ink rheology on the image transfer mechanism in screen printing. In Proceedings of the Institute of Non Newtonian fluid mechanics, Conference on Rheology, Cardiff, UK, April 2003; Institute of Non Newtonian fluid mechanics: Cardiff, UK, 2003. [Google Scholar]
  18. Cao, K.; Cheng, K.; Wang, Z. Optimization of Screen Printing Process. In Proceedings of the 7th Electronics Packaging Technology Conference (IEEE Cat. No. 05EX1233C), Singapore, 7–9 December 2005; IEEE: Singapore, 2006. [Google Scholar]
  19. Fox, I.J.; Bohan, M.F.J.; Claypole, T.C.; Gethin, D.T. Film thickness prediction in halftone screen-printing. Proc. Inst. Mech. Eng. Part E J. Process Mech. Eng. 2003, 217, 345–359. [Google Scholar] [CrossRef]
  20. Mannan, S.H.; Ekere, N.N.; Ismail, I.; Lo, E.K. Squeegee deformation study in the stencil printing of solder pastes. IEEE Trans. Compon. Packag. Manuf. Technol. Part A 1994, 17, 470–476. [Google Scholar] [CrossRef]
  21. Jewell, E.H.; Claypole, T.C.; Gethin, D.T. Viscosity control in the screen printing of ceramic transfers. Surf. Coat. Int. Part B Coat. Trans. 2003, 86, 155–163. [Google Scholar] [CrossRef]
  22. Riemer, D.E. The direct emulsion screen as a tool for high resolution thick film printing. In Proceedings of the 21st Electronic Component Conference Proceedings, Washington, DC, USA, 10–12 May 1971; Institute of Electrical and Electronics Engineers: New York, NY, USA, 1971. [Google Scholar]
  23. Riemer, D.E. The theoretical fundamentals of the screen printing process. Microelectron. Int. 1989, 6, 8–17. [Google Scholar] [CrossRef]
  24. Riemer, D.E. Analytical engineering model of the screen printing process: Part I. Solid State Technol. 1988, 8, 107–111. [Google Scholar]
  25. Riemer, D.E. Analytical engineering model of the screen printing process: Part II. Solid State Technol. 1988, 9, 85–90. [Google Scholar]
  26. Messerschmitt, E. Rheological considerations for screen printing inks. Screen Print. 1982, 72, 62–65. [Google Scholar]
  27. Potts, S.J.; Phillips, C.; Jewell, E.; Clifford, B.; Lau, Y.C.; Claypole, T. High-speed imaging the effect of snap-off distance and squeegee speed on the ink transfer mechanism of screen-printed carbon pastes. J. Coat. Technol. Res. 2020, 17, 447–459. [Google Scholar] [CrossRef] [Green Version]
  28. Potts, S.J.; Phillips, C.; Claypole, T. High Speed Imaging of Ink Separation in Screen-Printing. In Advances in Printing and Media Technology, Proceedings of the 46th International Research Conference of Iarigai, Stuttgart, Germany, 15–18 September 2019; Ridgway, C., Ed.; The International Association of Research Organizations for the Information, Media and Graphic Arts Industries: Darmstadt, Germany, 2019. [Google Scholar]
  29. Rueda, M.M.; Auscher, M.C.; Fulchiron, R.; Perie, T.; Martin, G.; Sonntag, P.; Cassagnau, P. Rheology and applications of highly filled polymers: A review of current understanding. Prog. Polym. Sci. 2017, 66, 22–53. [Google Scholar] [CrossRef]
  30. Barnes, H.A. A Handbook of Elementary Rheology, 1st ed.; The University of Wales Institute of Non-Newtonian Fluid Mechanics, Department of Mathematics: Wales, UK, 2000. [Google Scholar]
  31. Holder, A.J.; Claypole, J.; Claypole, T.; Cooper, P.G.; Williams, P.R.; Curtis, D.J. Fourier transform controlled stress parallel superposition (FT-CSPS): Validation and application in processing printable functional materials. Phys. Fluids 2018, 30, 077105. [Google Scholar] [CrossRef] [Green Version]
  32. Claypole, A.; Claypole, J.; Holder, A.; Claypole, T.C.; Kilduff, L. Rheology of high-aspect-ratio nanocarbons dispersed in a low-viscosity fluid. J. Coat. Technol. Res. 2020, 17, 1003–1012. [Google Scholar] [CrossRef] [Green Version]
  33. Rueden, C.T.; Schindelin, J.; Hiner, M.C.; DeZonia, B.E.; Walter, A.E.; Arena, E.T.; Eliceiri, K.W. ImageJ2: ImageJ for the next generation of scientific image data. BMC Bioinform. 2017, 18, 1–26. [Google Scholar] [CrossRef] [PubMed]
  34. Smits, F.M. Measurement of sheet resistivities with the four-point probe. Bell Syst. Tech. J. 1958, 37, 711–718. [Google Scholar] [CrossRef]
  35. Trappe, V.; Weitz, D.A. Scaling of the viscoelasticity of weakly attractive particles. Phys. Rev. Lett. 2000, 85, 449–452. [Google Scholar] [CrossRef] [PubMed] [Green Version]
  36. Amari, T.; Uesugi, K.; Suzuki, H. Viscoelastic properties of carbon black suspension as a flocculated percolation system. Prog. Org. Coat. 1997, 31, 171–178. [Google Scholar] [CrossRef]
  37. Potts, S.J.; Lau, Y.C.; Dunlop, T.; Claypole, T.; Phillips, C. Effect of photonic flash annealing with subsequent compression rolling on the topography, microstructure and electrical performance of carbon-based inks. J. Mater. Sci. 2019, 54, 8163–8176. [Google Scholar] [CrossRef] [Green Version]
  38. Jewell, E.; Hamblyn, S.; Claypole, T.; Gethin, D. Deposition of high conductivity low silver content materials by screen printing. Coatings 2015, 5, 172–185. [Google Scholar] [CrossRef] [Green Version]
  39. Willfahrt, A. Screen printed thermoelectric devices. Linköping Stud. Sci. Technol. 2014, 1663, 49. [Google Scholar]
Figure 1. Labelled high-speed camera image identifying the different stages occurring during ink deposition and separation [27].
Coatings 10 01008 g001
Figure 2. TGA analyses of the undiluted ink.
Coatings 10 01008 g002
Figure 3. Viscosity profiles (a) and viscoelastic profiles assessing changes in phase angle (δ); (b), storage modulus (G’); (c) and loss modulus (G’’); (d) of the different dilutions of the carbon ink.
Coatings 10 01008 g003
Figure 4. High-speed camera images at 5× magnification and quantification of the average print stage lengths for deposition of the carbon ink diluted by 0 wt.% to 10 wt.%.
Coatings 10 01008 g004
Figure 5. Comparison of filament separation positions and the topography profile (created from a series of stitched white light interferometry scans at 5× magnification) of a 200 µm line printed with the (a) undiluted ink and (b) 10 wt.% dilution.
Coatings 10 01008 g005
Figure 6. White light interferometry topography images (at 5× magnification) of the printed lines diluted by (a) 0 wt.%, (b) 2.5 wt.%, (c) 5 wt.% and (d) 10 wt.%, with graphs (e) of the measured dry film thickness and width and (f) of the corresponding changes in estimated wet film thickness, as well as (g) cross sectional area (error bars represent standard deviation).
Coatings 10 01008 g006
Figure 7. Average line resistance (a) and resistivity (b) for the 200 µm lines conducted on the custom screen-printing apparatus for the printed carbon inks diluted between 0 wt.% and 10 wt.%.
Coatings 10 01008 g007
Figure 8. White light interferometry topography images of 500 µm printed lines conducted on the DEK 248 Screen-printer at 5× magnification, diluted by (a) 0 wt.%, (b) 2.5 wt.%, (c) 5 wt.%, and (d) 10 wt.%, with a graph of the corresponding changes in line width (e), cross sectional area (f), measured dry film thickness (g) and estimated wet film thickness (h) for the 500 µm and 700 µm lines, as well as the film thickness of the printed squares (error bars represent standard deviation).
Coatings 10 01008 g008
Figure 9. The average surface roughness (a) and average maximum surface roughness (b) of the printed squares conducted on the DEK 248 Screen printer for the printed carbon inks diluted between 0 wt.% and 10 wt.%.
Coatings 10 01008 g009
Figure 10. Average line resistance (a) and resistivity (b) for the 500 µm and 700 µm lines, as well as average sheet resistance (c) and sheet resistivity (d) of the printed squares conducted on the DEK 248 Screen printer for the printed carbon inks diluted between 0 wt.% and 10 wt.%.
Coatings 10 01008 g010
Publisher’s Note: MDPI stays neutral with regard to jurisdictional claims in published maps and institutional affiliations.

