
A Time Series Analysis Evaluating Antibiotic Prescription Rates in Long-Term Care during the COVID-19 Pandemic in Alberta and Ontario, Canada

 , ,
, ,
Abstract
:1. Introduction
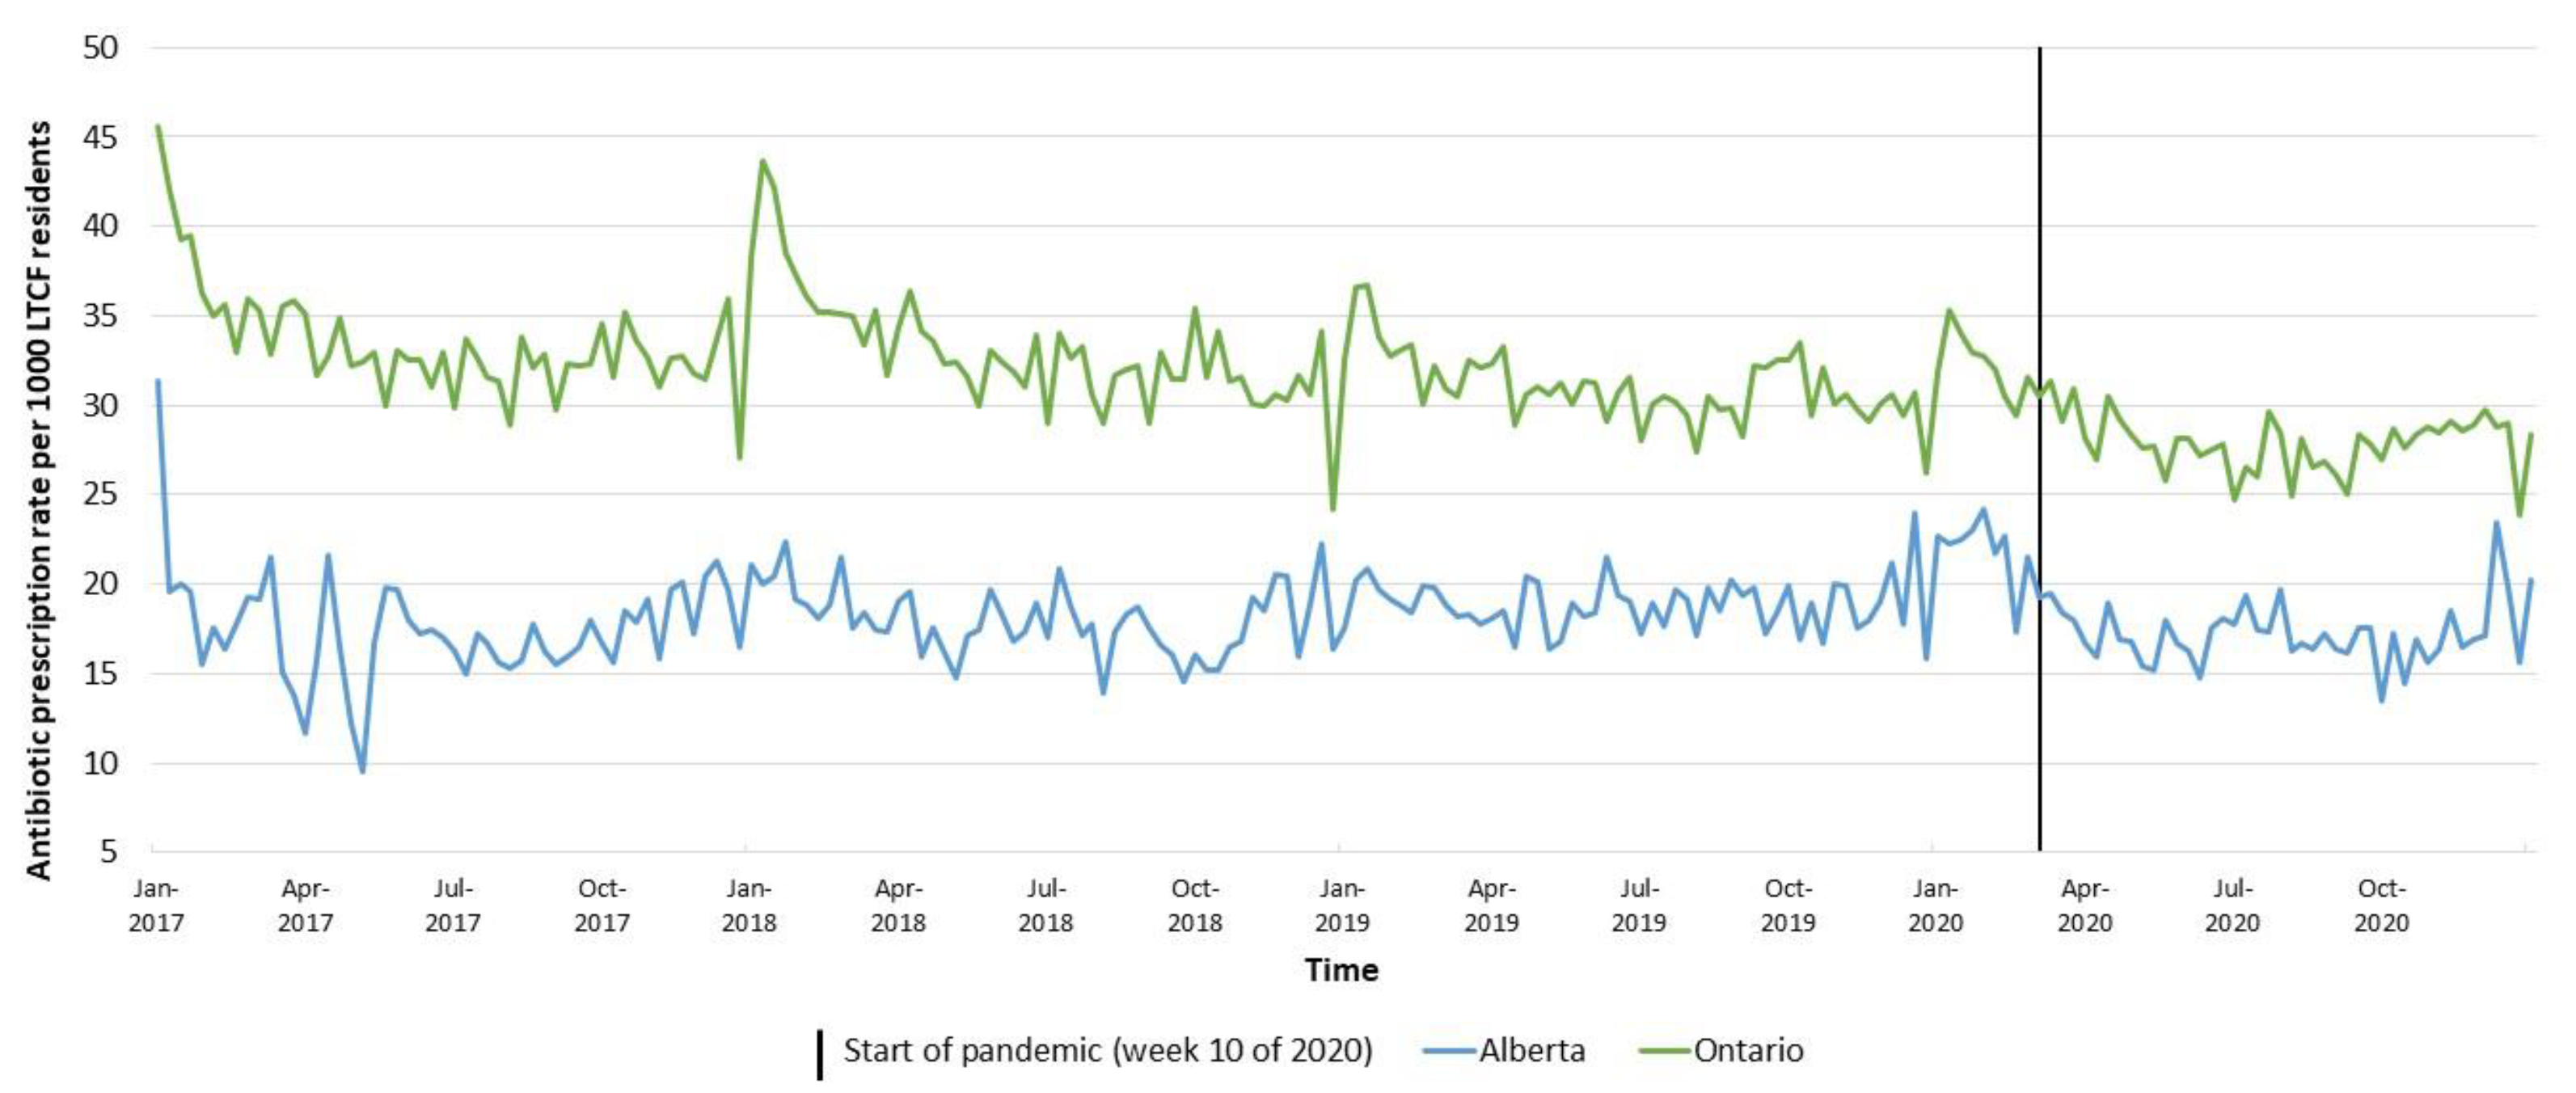
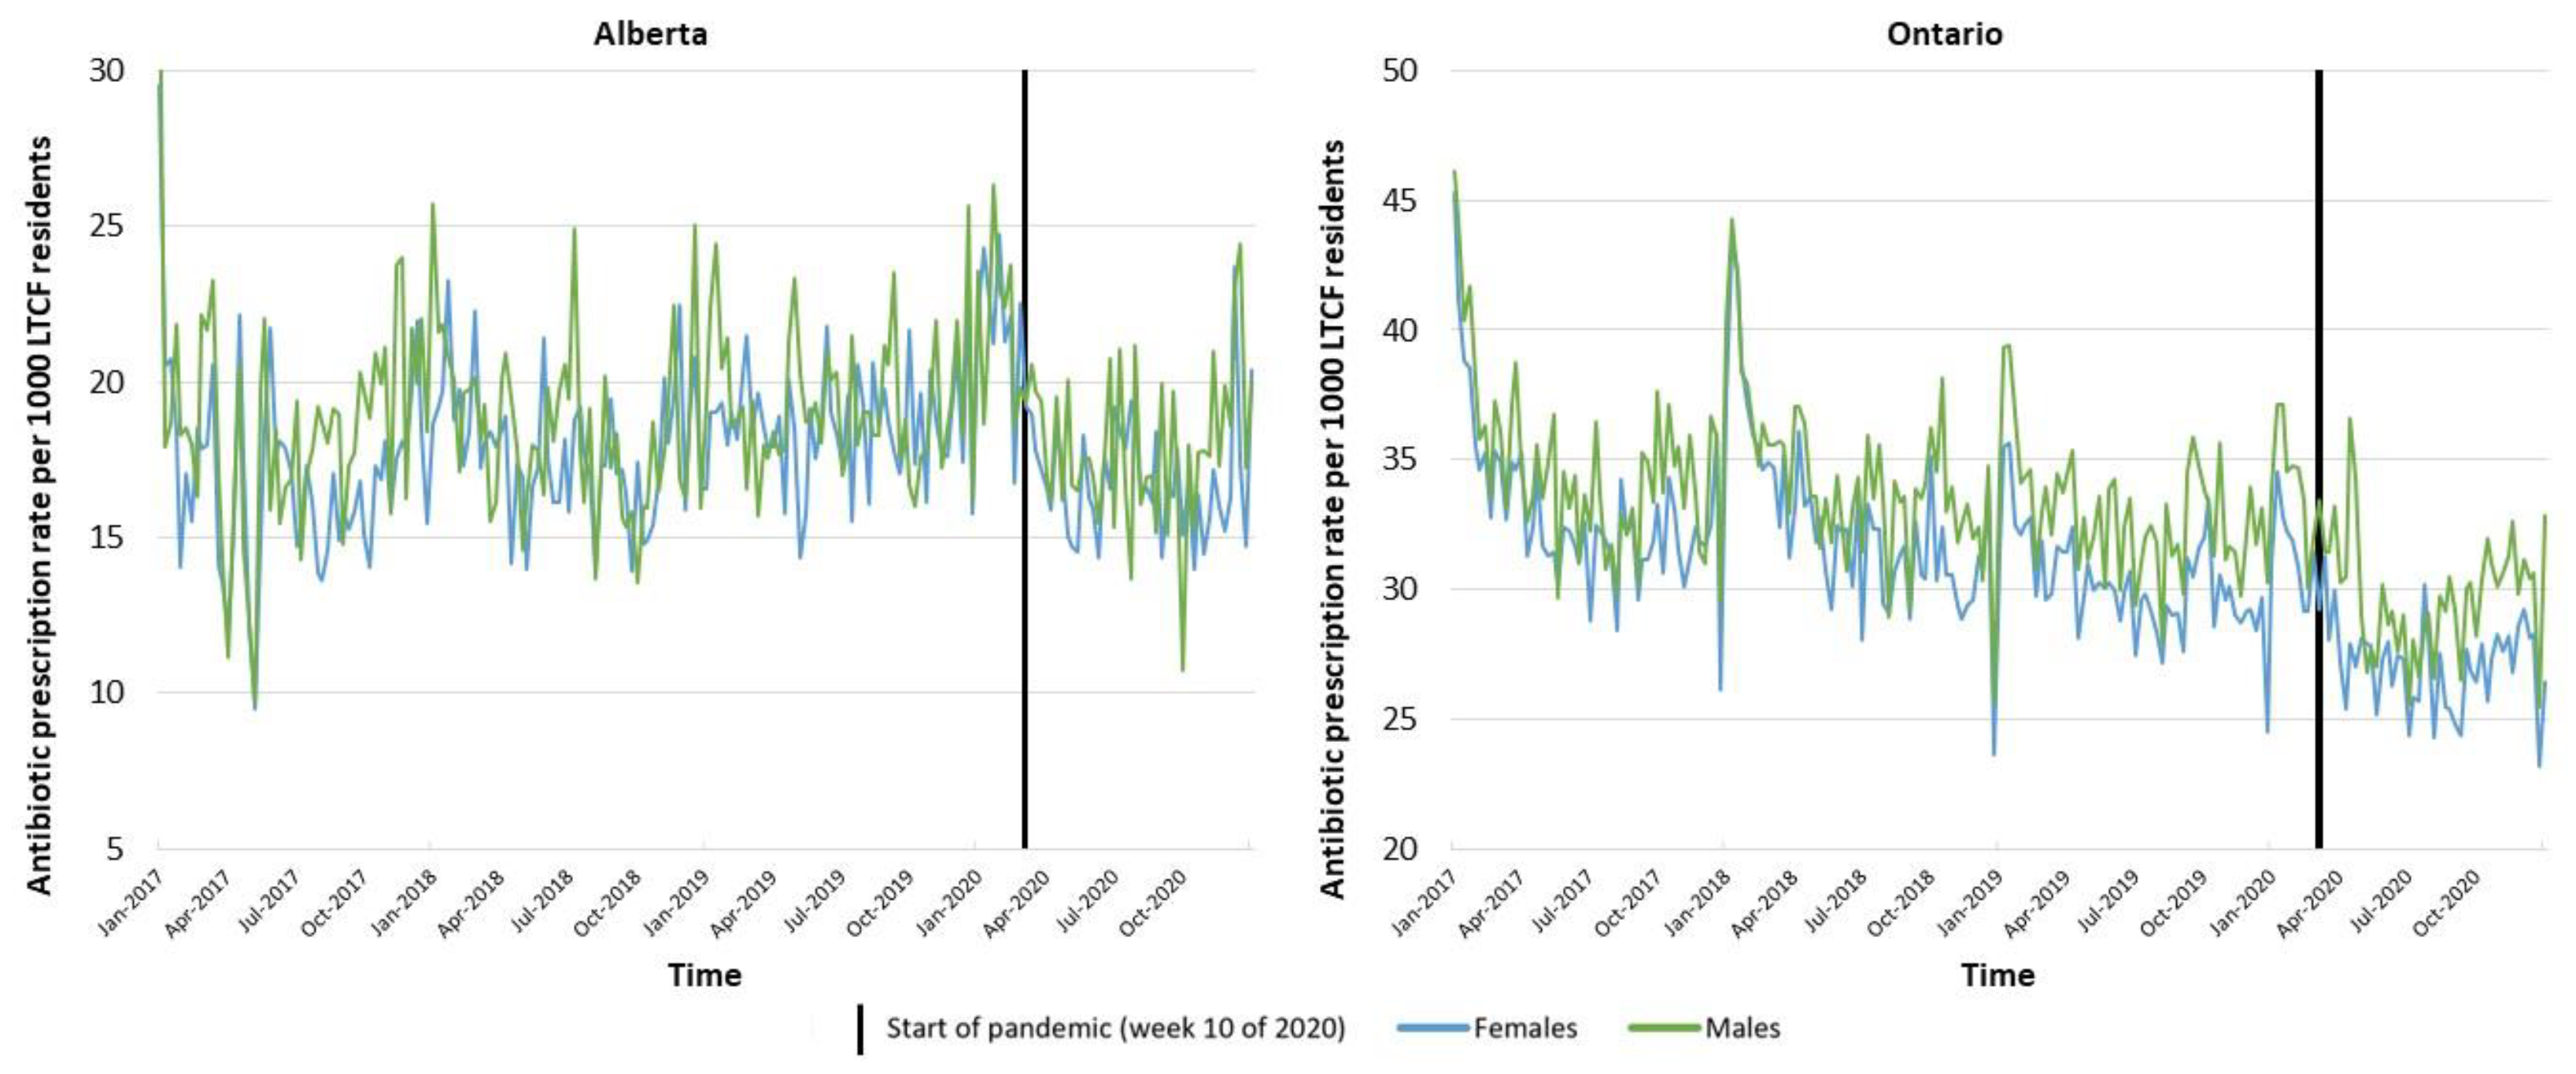
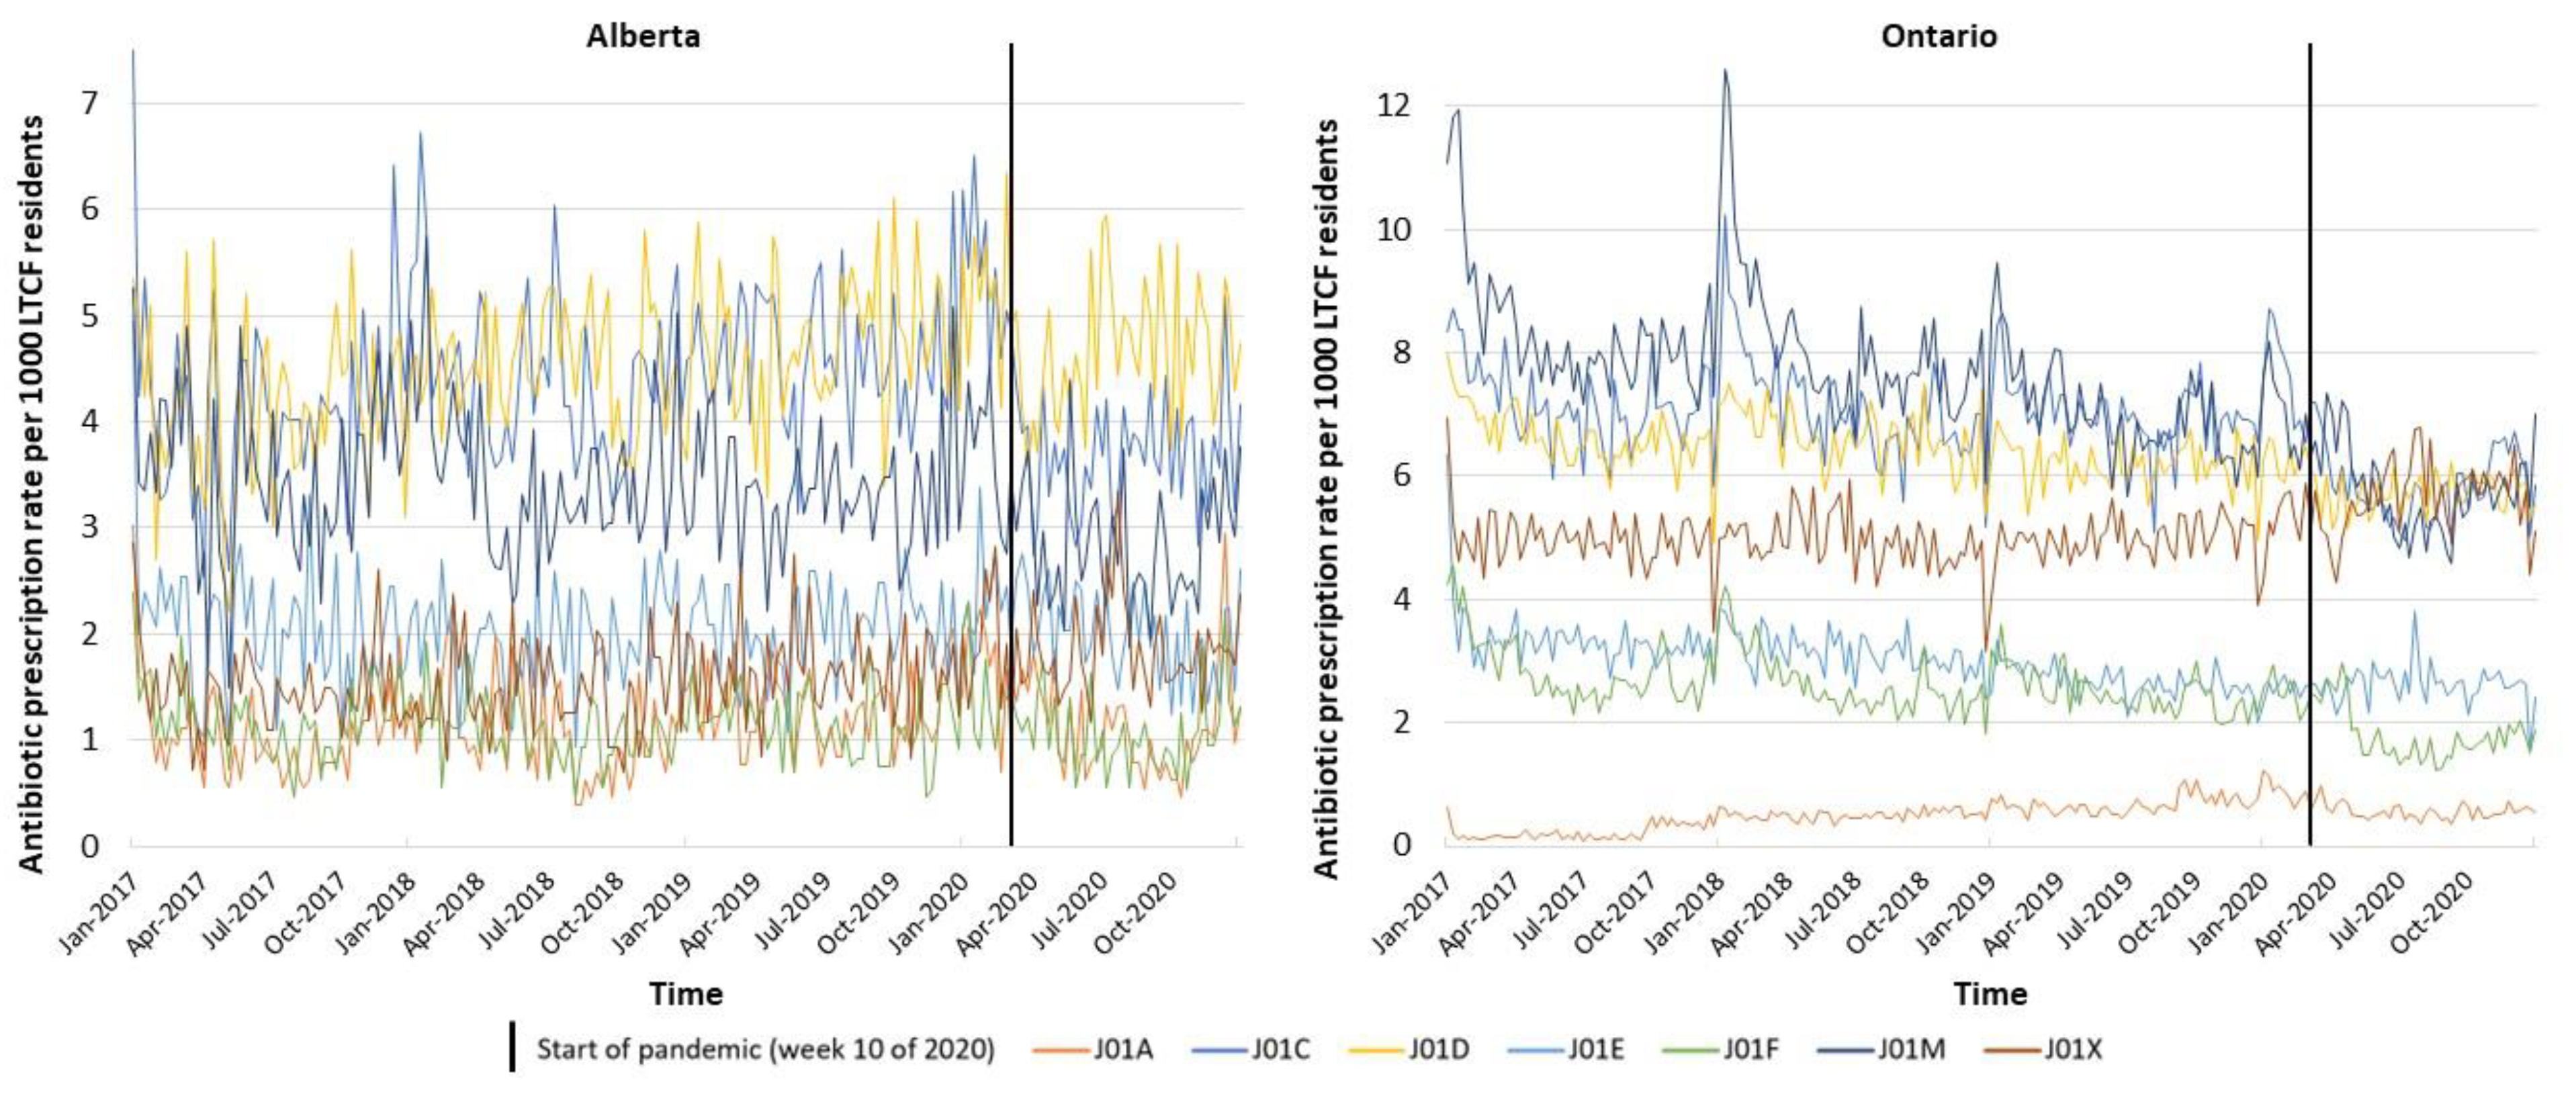
2. Results
3. Discussion
4. Materials and Methods
4.1. Study Design
4.2. Data Sources
4.3. Outcomes and Statistical Analyses
5. Conclusions
Supplementary Materials
Author Contributions
Funding
Institutional Review Board Statement
Informed Consent Statement
Data Availability Statement
Acknowledgments
Conflicts of Interest
References
- Zhang, A.; Surette, M.D.; Schwartz, K.L.; Brooks, J.I.; Bowdish, D.M.; Mahdavi, R.; Manuel, D.G.; Talarico, R.; Daneman, N.; Shurgold, J.; et al. The collapse of infectious disease diagnoses commonly due to communicable respiratory pathogens during the COVID-19 pandemic: A time series and hierarchical clustering analysis. Open Forum Infect. Dis. 2022, 9, ofac205. [Google Scholar] [CrossRef]
- Rezel-Potts, E.; L’Esperance, V.; Gulliford, M.C. Antimicrobial stewardship in the UK during the COVID-19 pandemic: A population-based cohort study and interrupted time-series analysis. Br. J. Gen. Pract. 2021, 71, e331–e338. [Google Scholar] [CrossRef]
- Niemenoja, O.; Taalas, A.; Taimela, S.; Bono, P.; Huovinen, P.; Riihijärvi, S. Time series analysis of the incidence of acute upper respiratory tract infections, COVID-19 and the use of antibiotics in Finland during the COVID-19 epidemic: A cohort study of 833 444 patients. BMJ Open 2022, 12, e046490. [Google Scholar] [CrossRef]
- Boeijen, J.A.; van der Velden, A.W.; Hullegie, S.; Platteel, T.N.; Zwart, D.L.M.; Damoiseaux, R.A.M.J.; Venekamp, R.P.; van de Pol, A.C. Common Infections and Antibiotic Prescribing during the First Year of the COVID-19 Pandemic: A Primary Care-Based Observational Cohort Study. Antibiotics 2021, 10, 1521. [Google Scholar] [CrossRef]
- Guisado-Gil, A.B.; Benavente, R.S.; Villegas-Portero, R.; Gil-Navarro, M.V.; Valencia, R.; Peñalva, G.; Cisneros, J.M. Has the COVID-19 pandemic wiped out the seasonality of outpatient antibiotic use and influenza activity? A time-series analysis from 2014 to 2021. Clin. Microbiol. Infect. 2022, 28, 881.e7–881.e12. [Google Scholar] [CrossRef]
- Knight, B.D.; Shurgold, J.; Smith, G.; MacFadden, D.R.; Schwartz, K.L.; Daneman, N.; Tropper, D.G.; Brooks, J. The impact of COVID-19 on community antibiotic use in Canada: An ecological study. Clin. Microbiol. Infect. 2022, 28, 426–432. [Google Scholar] [CrossRef]
- Kitano, T.; Brown, K.A.; Daneman, N.; MacFadden, D.R.; Langford, B.J.; Leung, V.; So, M.; Leung, E.; Burrows, L.; Manuel, D.; et al. The Impact of COVID-19 on Outpatient Antibiotic Prescriptions in Ontario, Canada; An Interrupted Time Series Analysis. Open Forum Infect. Dis. 2021, 8, ofab533. [Google Scholar] [CrossRef]
- Mamun, A.A.; Saatchi, A.; Xie, M.; Lishman, H.; Blondel-Hill, E.; Marra, F.; Patrick, D.M. Community Antibiotic Use at the Population Level During the SARS-CoV-2 Pandemic in British Columbia, Canada. Open Forum Infect. Dis. 2021, 8, ofab185. [Google Scholar] [CrossRef]
- Ouslander, J.G.; Grabowski, D.C. COVID-19 in Nursing Homes: Calming the Perfect Storm. J. Am. Geriatr. Soc. 2020, 68, 2153–2162. [Google Scholar] [CrossRef]
- Liu, M.; Maxwell, C.J.; Armstrong, P.; Schwandt, M.; Moser, A.; McGregor, M.J.; Bronskill, S.E.; Dhalla, I.A. COVID-19 in long-term care homes in Ontario and British Columbia. Can. Med. Assoc. J. 2020, 192, E1540–E1546. [Google Scholar] [CrossRef]
- Canadian Institute for Health Information. The Impact of COVID-19 on Long-Term Care in Canada: Focus on the First 6 Months; CIHI: Ottawa, ON, Canada, 2021. [Google Scholar]
- Schwartz, K.L.; Achonu, C.; Brown, K.A.; Langford, B.; Daneman, N.; Johnstone, J.; Garber, G. Regional variability in outpatient antibiotic use in Ontario, Canada: A retrospective cross-sectional study. Can. Med. Assoc. Open Access J. 2018, 6, E445–E452. [Google Scholar] [CrossRef] [Green Version]
- Gillies, M.B.; Burgner, D.P.; Ivancic, L.; Nassar, N.; Miller, J.E.; Sullivan, S.G.; Todd, I.M.F.; Pearson, S.; Schaffer, A.L.; Zoega, H. Changes in antibiotic prescribing following COVID-19 restrictions: Lessons for post-pandemic antibiotic stewardship. Br. J. Clin. Pharmacol. 2022, 88, 1143–1151. [Google Scholar] [CrossRef]
- Gouin, K.A.; Creasy, S.; Beckerson, M.; Wdowicki, M.; Hicks, L.A.; Lind, J.N.; Geller, A.I.; Budnitz, D.S.; Kabbani, S. Trends in Prescribing of Antibiotics and Drugs Investigated for Coronavirus Disease 2019 (COVID-19) Treatment in US Nursing Home Residents During the COVID-19 Pandemic. Clin. Infect. Dis. 2022, 74, 74–82. [Google Scholar] [CrossRef]
- Campitelli, M.A.; Bronskill, S.E.; Maclagan, L.C.; Harris, D.A.; Cotton, C.A.; Tadrous, M.; Gruneir, A.; Hogan, D.B.; Maxwell, C.J. Comparison of Medication Prescribing Before and After the COVID-19 Pandemic Among Nursing Home Residents in Ontario, Canada. JAMA Netw. Open 2021, 4, e2118441. [Google Scholar] [CrossRef]
- Norman, C.; Svensson, M.; Schmidt, I.; Bergfeldt, V.S.; Obeid, R.; Ternhag, A.; Struwe, J.L. Reduced dispensing of prescribed antibiotics during the COVID-19 pandemic has not increased severe complications from common infections. BMC Public Health 2022, 22, 252. [Google Scholar] [CrossRef]
- Rawson, T.M.; Moore, L.; Castro-Sanchez, E.; Charani, E.; Davies, F.; Satta, G.; Ellington, M.J.; Holmes, A.H. COVID-19 and the potential long-term impact on antimicrobial resistance. J. Antimicrob. Chemother. 2020, 75, 1681–1684. [Google Scholar] [CrossRef]
- Rawson, T.M.; Ming, D.; Ahmad, R.; Moore, L.S.P.; Holmes, A.H. Antimicrobial use, drug-resistant infections and COVID-19. Nat. Rev. Microbiol. 2020, 18, 409–410. [Google Scholar] [CrossRef]
- Rodríguez-Baño, J.; Rossolini, G.M.; Schultsz, C.; Tacconelli, E.; Murthy, S.; Ohmagari, N.; Holmes, A.; Bachmann, T.; Goossens, H.; Canton, R.; et al. Key considerations on the potential impacts of the COVID-19 pandemic on antimicrobial resistance research and surveillance. Trans. R. Soc. Trop. Med. Hyg. 2021, 115, 1122–1129. [Google Scholar] [CrossRef]
- Chambers, A.; Chen, C.; Brown, K.A.; Daneman, N.; Langford, B.; Leung, V.; Adomako, K.; Schwartz, K.L.; Moore, J.E.; Quirk, J.; et al. Virtual learning collaboratives to improve urine culturing and antibiotic prescribing in long-term care: Controlled before-and-after study. BMJ Qual. Saf. 2022, 31, 94–104. [Google Scholar] [CrossRef]
- Saatchi, A.; Morris, A.M.; Patrick, D.M.; Mccormack, J.; Reyes, R.C.; Morehouse, P.; Reid, J.; Shariff, S.; Povitz, M.; Silverman, M.; et al. Outpatient antibiotic use in British Columbia, Canada: Reviewing major trends since 2000. JAC-Antimicrob. Resist. 2021, 3, dlab116. [Google Scholar] [CrossRef]
- Baumen, T.R.V.D.; Crosby, M.; Tadrous, M.; Schwartz, K.L.; Gomes, T. Measuring the impacts of the Using Antibiotics Wisely campaign on Canadian community utilization of oral antibiotics for respiratory tract infections: A time-series analysis from 2015 to 2019. J. Antimicrob. Chemother. 2021, 76, 2472–2478. [Google Scholar] [CrossRef]
- Daneman, N.; Lee, S.M.; Bai, H.; Bell, C.M.; Bronskill, S.E.; Campitelli, M.A.; Dobell, G.; Fu, L.; Garber, G.; Ivers, N.; et al. Population-Wide Peer Comparison Audit and Feedback to Reduce Antibiotic Initiation and Duration in Long-Term Care Facilities with Embedded Randomized Controlled Trial. Clin. Infect. Dis. 2021, 73, e1296–e1304. [Google Scholar] [CrossRef] [PubMed]
- Canadian Institute for Health Information. Long-Term Care Homes in Canada: How Many and Who Owns Them? Available online: https://www.cihi.ca/en/long-term-care-homes-in-canada-how-many-and-who-owns-them (accessed on 16 July 2022).
- Alberta Health. Health Data for Research. Available online: https://www.alberta.ca/health-research.aspx (accessed on 27 June 2022).
- Levy, A.R.; O’Brien, B.J.; Sellors, C.; Grootendorst, P.; Willison, D. Coding accuracy of administrative drug claims in the Ontario Drug Benefit database. Can. J. Clin. Pharmacol. 2003, 10, 67–71. [Google Scholar] [PubMed]
- ICES. Data Available through Data & Analytic Services. Available online: https://www.ices.on.ca/DAS/Data (accessed on 27 June 2022).
- WHO Collaborating Centre for Drug Statistics Methodology. Guidelines for ATC Classification and DDD Assignment; WHO: Oslo, Norway, 2021.
- Schaffer, A.L.; Dobbins, T.A.; Pearson, S.-A. Interrupted time series analysis using autoregressive integrated moving average (ARIMA) models: A guide for evaluating large-scale health interventions. BMC Med. Res. Methodol. 2021, 21, 58. [Google Scholar] [CrossRef] [PubMed]
- Box, G.E.; Jenkins, G.M.; Reinsel, G.C.; Ljung, G.M. Time Series Analysis: Forecasting and Control, 5th ed.; Wiley: Hoboken, NJ, USA, 2015. [Google Scholar]


| Alberta | Ontario | ||||||||
|---|---|---|---|---|---|---|---|---|---|
| 2017 | 2018 | 2019 | 2020 | 2017 | 2018 | 2019 | 2020 | ||
| Total Number of Residents | 18,137 | 18,605 | 18,962 | 18,253 | 98,815 | 99,842 | 99,332 | 88,468 | |
| Age [n (%)] | 65–69 | 1039 (5.7%) | 1055 (5.7%) | 1136 (6.0%) | 1131 (6.2%) | 5197 (5.3%) | 5315 (5.3%) | 5350 (5.4%) | 4613 (5.2%) |
| 70–74 | 1416 (7.8%) | 1554 (8.4%) | 1667 (8.8%) | 1652 (9.1%) | 7335 (7.4%) | 7558 (7.6%) | 7872 (7.9%) | 7123 (8.1%) | |
| 75–79 | 2132 (11.8%) | 2270 (12.2%) | 2341 (12.3%) | 2293 (12.6%) | 11,324 (11.5%) | 11,710 (11.7%) | 11,756 (11.8%) | 10,546 (11.9%) | |
| 80–84 | 3342 (18.4%) | 3436 (18.5%) | 3465 (18.3%) | 3228 (17.7%) | 18,432 (18.7%) | 18,535 (18.6%) | 18,258 (18.4%) | 15,796 (17.9%) | |
| 85–89 | 4339 (23.9%) | 4395 (23.6%) | 4348 (22.9%) | 4120 (22.6%) | 25,153 (25.5%) | 24,924 (25.0%) | 24,364 (24.5%) | 21,213 (24.0%) | |
| 90+ | 5869 (32.4%) | 5895 (31.7%) | 6005 (31.7%) | 5829 (31.9%) | 31,374 (31.8%) | 31,800 (31.9%) | 31,732 (31.9%) | 29,177 (33.0%) | |
| Sex [n (%)] | Male | 6593 (36.4%) | 6889 (37.0%) | 7020 (37.0%) | 6805 (37.3%) | 30,996 (31.4%) | 31,417 (31.5%) | 31,641 (31.9%) | 28,128 (31.8%) |
| Female | 11,544 (63.6%) | 11,716 (63.0%) | 11,942 (63.0%) | 11,448 (62.7%) | 67,819 (68.6%) | 68,425 (68.5%) | 67,691 (68.1%) | 60,340 (68.2%) | |
| Total Number of LTCFs | 175 | 180 | 181 | 183 | 626 | 626 | 624 | 624 | |
| LTCF Bed Count [n (%)] * | 0–50 | 80 (45.7%) | 84 (46.7%) | 80 (44.2%) | 80 (43.7%) | 64 (10.2%) | 64(10.2%) | 64 (10.3%) | 64 (10.3%) |
| 51–100 | 43 (24.6%) | 46 (25.6%) | 49 (27.1%) | 50 (27.3%) | 210 (33.5%) | 210 (33.5%) | 209 (33.5%) | 209 (33.5%) | |
| 101–150 | 25 (14.3%) | 23 (12.8%) | 23 (12.7%) | 24 (13.1%) | 155 (24.8%) | 155 (24.8%) | 155 (24.8%) | 155 (24.8%) | |
| 151–200 | 10 (5.7%) | 10 (5.6%) | 12 (6.6%) | 12 (6.6%) | 124 (19.8%) | 124 (19.8%) | 124 (19.9%) | 124 (19.9%) | |
| >200 | 17 (9.7%) | 17 (9.4%) | 17 (9.4%) | 17 (9.3%) | 73 (11.7%) | 73 (11.7%) | 72 (11.5%) | 72 (11.5%) | |
| Total Number of Antibiotic Prescriptions | 11,510 | 11,920 | 12,828 | 12,337 | 125,567 | 123,841 | 116,542 | 102,116 | |
| Percent of Residents with at Least One Antibiotic Prescription | 30.0% | 29.9% | 30.9% | 31.3% | 53.6% | 52.9% | 50.9% | 49.8% | |
| Antibiotic Prescriptions by Age [n (%)] | 65–69 | 626 (5.4%) | 630 (5.3%) | 693 (5.4%) | 784 (6.4%) | 5871 (4.7%) | 6454 (5.2%) | 6218 (5.3%) | 5703 (5.6%) |
| 70–74 | 917 (8.0%) | 991 (8.3%) | 1097 (8.6%) | 1185 (9.6%) | 9244 (7.4%) | 9123 (7.4%) | 9059 (7.8%) | 8314 (8.1%) | |
| 75–79 | 1249 (10.9%) | 1472 (12.3%) | 1588 (12.4%) | 1468 (11.9%) | 13,869 (11.0%) | 13,817 (11.2%) | 13,138 (11.3%) | 11,699 (11.5%) | |
| 80–84 | 2044 (17.8%) | 2140 (18.0%) | 2367 (18.5%) | 2145 (17.4%) | 22,917 (18.3%) | 22,697 (18.3%) | 21,001 (18.0%) | 17,977 (17.6%) | |
| 85–89 | 2833 (24.6%) | 2816 (23.6%) | 3010 (23.5%) | 2680 (21.7%) | 32,464 (25.9%) | 31,697 (25.6%) | 29,048 (24.9%) | 24,624 (24.1%) | |
| 90+ | 3841 (33.4%) | 3871 (32.5%) | 4073 (31.8%) | 4075 (33.0%) | 41,202 (32.8%) | 40,053 (32.3%) | 38,078 (32.7%) | 33,799 (33.1%) | |
| Antibiotic Prescriptions by Sex [n (%)] | Male | 4165 (36.2%) | 4198 (35.2%) | 4612 (36.0%) | 4498 (36.5%) | 38,514 (30.7%) | 38,233 (30.9%) | 37,125 (31.9%) | 32,655 (32.0%) |
| Female | 7345 (63.8%) | 7722 (64.8%) | 8216 (64.0%) | 7839 (63.5%) | 87,053 (69.3%) | 85,608 (69.1%) | 79,417 (68.1%) | 69,461 (68.0%) | |
| Antibiotic Prescriptions by ATC [n (%)] # | J01A—Tetracyclines | 682 (5.9%) | 714 (6.0%) | 862 (6.7%) | 849 (6.9%) | 821 (0.7%) | 1885 (1.5%) | 2531 (2.2%) | 2208 (2.2%) |
| J01C—Beta-lactams | 2731 (23.7%) | 2919 (24.5%) | 3144 (24.5%) | 2735 (22.2%) | 26,857 (21.4%) | 26,676 (21.5%) | 26,277 (22.5%) | 21,937 (21.5%) | |
| J01D—Other beta-lactams | 2693 (23.4%) | 3011 (25.3%) | 3246 (25.3%) | 3255 (26.4%) | 24,841 (19.8%) | 24,897 (20.1%) | 23,257 (20.0%) | 20,664 (20.2%) | |
| J01E—Sulfonamides and trimethoprim | 1355 (11.8%) | 1289 (10.8%) | 1395 (10.9%) | 1413 (11.5%) | 12,486 (9.9%) | 11,784 (9.5%) | 10,027 (8.6%) | 9222 (9.0%) | |
| J01F—Macrolides, lincosamides and streptogramins | 783 (6.8%) | 717 (6.0%) | 783 (6.1%) | 775 (6.3%) | 10,694 (8.5%) | 9889 (8.0%) | 9357 (8.0%) | 6895 (6.8%) | |
| J01M—Quinolones | 2296 (19.9%) | 2303 (19.3%) | 2272 (17.7%) | 2042 (16.6%) | 31,217 (24.9%) | 30,260 (24.4%) | 26,426 (22.7%) | 21,404 (21.0%) | |
| J01X—Other antibacterials | 970 (8.4%) | 967 (8.1%) | 1126 (8.8%) | 1268 (10.3%) | 18,651 (14.9%) | 18,450 (14.9%) | 18,667 (16.0%) | 19,786 (19.4%) | |
| Average Weekly Antibiotic Prescription Rate per 1000 LTCF Residents | Relative Change 2020 vs. 2019 | Relative Change Mar–Dec 2020 vs. Mar–Dec 2019 | ||||
|---|---|---|---|---|---|---|
| 2017 | 2018 | 2019 | 2020 | |||
| Alberta | 17.5 | 18.0 | 18.8 | 18.1 | −3.9% | −7.6% |
| Ontario | 33.5 | 33.1 | 31.0 | 28.7 | −7.6% | −8.5% |
| Alberta | Ontario | ||||||||||||||
|---|---|---|---|---|---|---|---|---|---|---|---|---|---|---|---|
| Prescription Rate Category | Model Para-Meters * | Step Change | 95% CI | p-Value | Slope Change | 95% CI | p-Value | Model Para-Meters * | Step Change | 95% CI | p-Value | Slope Change | 95% CI | p-Value | |
| Overall | (0,1,2) (1,0,0)[52] | −3.9461 | −6.9209–−0.9714 | 0.009 | 0.0246 | −0.1046–0.1539 | 0.709 | (0,1,1) (0,1,1)[52] | −1.4665 | −3.9554–1.0223 | 0.248 | 0.0210 | −0.0966–0.1386 | 0.726 | |
| Sex | Females | (1,1,1) (0,0,1)[52] | −3.8337 | −7.0746–−0.5929 | 0.020 | 0.0133 | −0.0949–0.1215 | 0.809 | (0,1,1) (0,1,1)[52] | −1.7110 | −4.4635–1.0416 | 0.223 | 0.0282 | −0.1033–0.1597 | 0.674 |
| Males | (1,0,1) (1,0,0)[52] | −2.4288 | −5.5929–0.7354 | 0.132 | 0.0483 | −0.0643–0.1609 | 0.401 | (0,1,1) (0,1,1)[52] | −1.3071 | −3.8369–1.2227 | 0.311 | 0.0138 | −0.0787–0.1064 | 0.770 | |
| Age | 65−69 | ARIMA (0,0,0) | −0.0336 | −3.0056–2.9385 | 0.982 | 0.0487 | −0.0603–0.1579 | 0.381 | (1,0,2) (1,0,0)[52] | 0.8050 | −3.2837–4.8938 | 0.700 | −0.1122 | −0.2575–0.0331 | 0.130 |
| 70−74 | ARIMA (0,0,5) | −2.4935 | −5.8617–0.8747 | 0.147 | 0.0937 | −0.0293–0.2166 | 0.135 | (0,1,1) (1,0,0)[52] | −2.0866 | −4.8668–0.6935 | 0.141 | −0.0021 | −0.1056–0.1014 | 0.968 | |
| 75−79 | ARIMA (0,1,1) | −2.0757 | −5.3594–1.2080 | 0.215 | −0.0872 | −0.2022–0.0279 | 0.138 | (0,1,2) (1,0,0)[52] | −3.7163 | −6.6276–−0.8049 | 0.012 | 0.0152 | −0.0916–0.1220 | 0.780 | |
| 80−84 | (0,1,1) (1,0,0)[52] | −3.3379 | −6.9202–0.2444 | 0.068 | −0.0221 | −0.1545–0.1104 | 0.744 | (0,1,1) (0,1,1)[52] | −2.1184 | −4.5632–0.3263 | 0.089 | −0.0093 | −0.1024–0.0837 | 0.844 | |
| 85−89 | ARIMA (1,0,1) | −3.1022 | −6.6355–0.4310 | 0.085 | 0.0492 | −0.0783–0.1767 | 0.450 | (0,1,1) (1,0,0)[52] | −1.2703 | −5.3305–2.7899 | 0.540 | 0.0141 | −0.2026–0.2308 | 0.898 | |
| 90+ | (1,0,1) (1,0,0)[52] | −2.0731 | −6.0552–1.9090 | 0.308 | 0.0432 | −0.0950–0.1814 | 0.540 | (0,1,1) (0,1,1)[52] | −1.0053 | −4.0054–1.9948 | 0.511 | 0.0294 | −0.1075–0.1663 | 0.674 | |
| ATC Class | J01A—Tetracyclines | ARIMA (1,0,1) | −0.0080 | −0.6181–0.6021 | 0.979 | −0.0011 | −0.0230–0.0208 | 0.921 | (0,1,2) (1,0,0)[52] | −0.2091 | −0.3789–−0.0393 | 0.016 | −0.0062 | −0.0131–0.0007 | 0.078 |
| J01C—Beta-lactams | (1,1,2) (0,0,1)[52] | −1.3452 | −2.2672–−0.4233 | 0.004 | 0.0120 | −0.0178–0.0418 | 0.432 | (0,1,1) (0,1,1)[52] | −1.1940 | −1.8611–−0.5269 | <0.001 | 0.0091 | −0.0164–0.0345 | 0.486 | |
| J01D—Other beta-lactams | ARIMA (0,1,1) | −0.8461 | −1.5165–−0.1756 | 0.013 | 0.0161 | −0.0066–0.0387 | 0.165 | (0,1,3) (1,0,0)[52] | −0.7622 | −1.2316–−0.2927 | 0.001 | 0.0074 | −0.0149–0.0297 | 0.514 | |
| J01E—Sulfonamides and trimethoprim | ARIMA (0,0,0) | 0.2489 | −0.0894–0.5873 | 0.149 | −0.0121 | −0.0246–0.0003 | 0.055 | (0,1,1) (0,0,1)[52] | 0.2798 | −0.0140–0.5737 | 0.062 | 0.0026 | −0.0073–0.0124 | 0.607 | |
| J01F—Macrolides, lincosamides and streptogramins | (1,0,1) (0,0,1)[52] | −0.2021 | −0.5412–0.1369 | 0.243 | 0.0040 | −0.0082–0.0161 | 0.520 | (0,1,1) (1,0,0)[52] | 0.4652 | −0.2320–1.1623 | 0.191 | −0.0196 | −0.0622–0.0230 | 0.368 | |
| J01M—Quinolones | (1,0,1) (0,0,1)[52] | −0.6517 | −1.3175–0.0140 | 0.055 | 0.0038 | −0.0201–0.0277 | 0.756 | (0,1,1) (1,1,0)[52] | 0.5290 | −0.6442–1.7023 | 0.377 | 0.0032 | −0.0605–0.0669 | 0.922 | |
| J01X—Other antibacterials | ARIMA (0,0,2) | 0.2889 | −0.0695–0.6472 | 0.114 | 0.0005 | −0.0125–0.0136 | 0.935 | (1,0,1) (1,0,0)[52] | 0.3660 | −0.1521–0.8841 | 0.166 | 0.0107 | −0.0061–0.0275 | 0.213 | |
| Individual antibiotics | Amoxicillin | (1,1,2) (0,0,1)[52] | −0.6484 | −1.1083–−0.1886 | 0.006 | 0.0044 | −0.0110–0.0198 | 0.577 | (0,1,1) (1,0,0)[52] | −0.8057 | −1.0684–−0.5430 | <0.001 | 0.0126 | 0.0025–0.0228 | 0.015 |
| Amoxicillin/clavulanic acid | ARIMA (1,0,1) | −0.4003 | −1.0344–0.2339 | 0.216 | 0.0045 | −0.0184–0.0273 | 0.701 | (0,1,1) (1,1,0)[52] | −0.0954 | −0.7418–0.5511 | 0.773 | −0.0142 | −0.0442–0.0158 | 0.353 | |
| Azithromycin | (1,0,1) (0,0,1)[52] | −0.2120 | −0.5598–0.1358 | 0.232 | 0.0061 | −0.0064–0.0186 | 0.340 | (0,1,1) (0,1,1)[52] | 0.7035 | 0.1592–1.2477 | 0.011 | −0.0186 | −0.0493–0.0121 | 0.234 | |
| Cephalexin | ARIMA (0,1,1) | −0.6039 | −1.1319–−0.0760 | 0.025 | 0.0107 | −0.0067–0.0281 | 0.227 | (2,0,2) (1,0,0)[52] | −0.3743 | −0.7163–−0.0322 | 0.032 | 0.0115 | −0.0005–0.0234 | 0.060 | |
| Clarithromycin # | (0,1,1) (1,0,0)[52] | −0.0225 | −0.1376–0.0925 | 0.701 | −0.0023 | −0.0081–0.0035 | 0.433 | ||||||||
| Doxycycline | ARIMA (1,1,1) | −0.2571 | −0.9410–0.4268 | 0.461 | −0.0001 | −0.0305–0.0302 | 0.993 | (1,1,1) (0,0,1)[52] | −0.2131 | −0.3612–−0.0649 | 0.005 | −0.0066 | −0.0122–−0.0010 | 0.020 | |
| Fosfomycin # | (0,1,1) (1,0,0)[52] | 0.0545 | −0.2018–0.3109 | 0.677 | −0.0063 | −0.0162–0.0035 | 0.209 | ||||||||
| Nitrofurantoin | ARIMA (2,0,2) | 0.3159 | −0.0001–0.6319 | 0.050 | −0.0039 | −0.0155–0.0076 | 0.506 | (0,1,1) (1,0,0)[52] | −0.1981 | −0.6301–0.2339 | 0.369 | 0.0099 | −0.0088–0.0285 | 0.300 | |
| Penicillin # | ARIMA (0,1,1) | −0.0355 | −0.0639–−0.0071 | 0.014 | 0.0009 | −0.00009–0.0019 | 0.074 | ||||||||
Publisher’s Note: MDPI stays neutral with regard to jurisdictional claims in published maps and institutional affiliations. |
© 2022 by the authors. Licensee MDPI, Basel, Switzerland. This article is an open access article distributed under the terms and conditions of the Creative Commons Attribution (CC BY) license (https://creativecommons.org/licenses/by/4.0/).
Share and Cite
Haverkate, M.R.; Macfadden, D.R.; Daneman, N.; Leal, J.; Otterstatter, M.; Mahdavi, R.; D’Souza, A.G.; Rennert-May, E.; Silverman, M.; Schwartz, K.L.; et al. A Time Series Analysis Evaluating Antibiotic Prescription Rates in Long-Term Care during the COVID-19 Pandemic in Alberta and Ontario, Canada. Antibiotics 2022, 11, 1001. https://doi.org/10.3390/antibiotics11081001
Haverkate MR, Macfadden DR, Daneman N, Leal J, Otterstatter M, Mahdavi R, D’Souza AG, Rennert-May E, Silverman M, Schwartz KL, et al. A Time Series Analysis Evaluating Antibiotic Prescription Rates in Long-Term Care during the COVID-19 Pandemic in Alberta and Ontario, Canada. Antibiotics. 2022; 11(8):1001. https://doi.org/10.3390/antibiotics11081001
Chicago/Turabian StyleHaverkate, Manon R., Derek R. Macfadden, Nick Daneman, Jenine Leal, Michael Otterstatter, Roshanak Mahdavi, Adam G. D’Souza, Elissa Rennert-May, Michael Silverman, Kevin L. Schwartz, and et al. 2022. "A Time Series Analysis Evaluating Antibiotic Prescription Rates in Long-Term Care during the COVID-19 Pandemic in Alberta and Ontario, Canada" Antibiotics 11, no. 8: 1001. https://doi.org/10.3390/antibiotics11081001
APA StyleHaverkate, M. R., Macfadden, D. R., Daneman, N., Leal, J., Otterstatter, M., Mahdavi, R., D’Souza, A. G., Rennert-May, E., Silverman, M., Schwartz, K. L., Morris, A. M., Saatchi, A., Patrick, D. M., & Marra, F. (2022). A Time Series Analysis Evaluating Antibiotic Prescription Rates in Long-Term Care during the COVID-19 Pandemic in Alberta and Ontario, Canada. Antibiotics, 11(8), 1001. https://doi.org/10.3390/antibiotics11081001