
Detection of Antibiotic Residues in Blossom Honeys from Different Regions in Turkey by LC-MS/MS Method


Abstract
:1. Introduction
2. Results
3. Discussion
4. Materials and Methods
4.1. Samples Collection
4.2. Sample Preparation
4.3. LC–MS/MS Analysis
4.4. Determination of pH, Moisture, and Electric Conductivity
4.5. Statistics
5. Conclusions
Author Contributions
Funding
Institutional Review Board Statement
Informed Consent Statement
Data Availability Statement
Conflicts of Interest
References
- Turkish Standard. TS 3036, ICS 65.140; Honey. Türk Standardları Enstitüsü: Ankara, Turkey, 2010. (In Turkish)
- Samarghandian, S.; Farkhondeh, T.; Samini, F. Honey and health: A review of recent clinical research. Pharmacogn. Res. 2017, 9, 121. [Google Scholar]
- Khan, S.U.; Anjum, S.I.; Rahman, K.; Ansari, M.J.; Khan, W.U.; Kamal, S.; Khattak, B.; Muhammad, A.; Khan, H.U. Honey: Single food stuff comprises many drugs. Saudi J. Biol. Sci. 2018, 25, 320–325. [Google Scholar] [CrossRef] [PubMed]
- Nicewicz, A.W.; Nicewicz, Ł.; Pawłowska, P. Antioxidant capacity of honey from the urban apiary: A comparison with honey from the rural apiary. Sci. Rep. 2021, 11, 9695. [Google Scholar] [CrossRef] [PubMed]
- Aljadi, A.; Kamaruddin, M. Evaluation of the phenolic contents and antioxidant capacities of two Malaysian floral honeys. Food Chem. 2004, 85, 513–518. [Google Scholar] [CrossRef]
- Dashora, N.; Sodde, V.; Bhagat, J.; Prabhu, K.S.; Lobo, R. Antitumor activity of dendrophthoe falcata against ehrlich ascites carcinoma in Swiss albino mice. Pharm. Crops. 2011, 2, 1–7. [Google Scholar] [CrossRef]
- Hilary, S.; Habib, H.; Souka, U.; Ibrahim, W.; Platat, C. Bioactivity of arid region honey: An in vitro study. BMC Complement. Altern. Med. 2017, 17, 177. [Google Scholar] [CrossRef] [Green Version]
- Al-Waili, N.; Salom, K.; Al-Ghamdi, A.; Ansari, M.J. Antibiotic, pesticide, and microbial contaminants of honey: Human health hazards. Sci. World J. 2012, 2012, 930849. [Google Scholar] [CrossRef] [Green Version]
- Orso, D.; Floriano, L.; Ribeiro, L.C.; Bandeira, N.M.; Prestes, O.D.; Zanella, R. Simultaneous determination of multiclass pesticides and antibiotics in honey samples based on ultra-high performance liquid chromatography-tandem mass spectrometry. Food Anal. Methods 2016, 9, 1638–1653. [Google Scholar] [CrossRef]
- Tang, Y.Y.; Lu, H.F.; Lin, H.Y.; Shin, Y.C.; Hwang, D.F. Development of a quantitative multi-class method for 18 antibiotics in chicken, pig, and fish muscleusing UPLC-MS/MS. Food Anal. Methods 2012, 5, 1459. [Google Scholar] [CrossRef]
- Samandoulougou, S.; Ilboudo, A.J.; Bagre, T.S.; Tapsoba, F.W.; Savadogo, A.; Scippo, M.; Traore, A.S. Screening of antibiotic residues in beef consumed in Ouagadougou, Burkina Faso. Afr. J. Food Sci. 2015, 9, 367–371. [Google Scholar]
- Barreca, S.; Forni, C.; Colzani, L.; Clerici, L.; Daverio, D.; Dellavedova, P. Study on the stability of antibiotics, pesticides and drugs in water by using a straightforward procedure applying HPLC-Mass spectrometric determination for analytical purposes. Separations 2021, 8, 179. [Google Scholar] [CrossRef]
- Amorello, D.; Barreca, S.; Gulli, E.; Orecchio, S. Platinum and rhodium in wine samples by using voltammetric techniques. Microchem. J. 2017, 130, 229–235. [Google Scholar] [CrossRef]
- Phillips, I.; Casewell, M.; Cox, T.; Groot, B.D.; Friis, C.; Jones, R.; Nightingale, C.; Preston, R.; Waddell, J. Does the use of antibiotics in food animals pose a risk to human health? A critical review of published data. J. Antimicrob. Chemother. 2004, 53, 28–52. [Google Scholar] [CrossRef]
- Aalipour, F.; Mirlohi, M.; Jalali, M. Prevalence of antibiotic residues in commercial milk and its variation by season and thermal processing methods. Int. J. Environ. Health Eng. 2013, 2, 41. [Google Scholar]
- Heshmati, A.; Kamkar, A.; Salaramoli, J.; Hassan, J.; Jahed, G.H. Effect of deep-frying processing on tylosin residue in meat. Iran. J. Nutr. Sci. Food Technol. 2015, 12, 61–71. [Google Scholar]
- Khanal, B.K.S.; Sadiq, M.B.; Singh, M.; Anal, A.K. Screening of antibiotic residues in fresh milk of Kathmandu Valley, Nepal. J. Environ. Sci. Health B 2018, 53, 57–86. [Google Scholar] [CrossRef]
- Er, B.; Onurdağ, F.K.; Demirhan, B.; Özgacar, S.Ö.; Öktem, A.B.; Abbasoğlu, U. Screening of quinolone antibiotic residues in chicken meat and beef sold in the markets of Ankara, Turkey. Poult. Sci. 2013, 92, 2212–2215. [Google Scholar] [CrossRef]
- Kumar, A.; Gill, J.P.S.; Bedi, J.S.; Chhuneja, P.K.; Kumar, A. Determination of antibiotic residues in Indian honeys and assessment of potential risks to consumers. J. Apic. Res. 2020, 59, 25–34. [Google Scholar] [CrossRef]
- Reybroeck, W. Residues of antibiotics and chemotherapeutics in honey. J. Apic. Res. 2018, 57, 97–112. [Google Scholar] [CrossRef]
- Terrab, A.; González, A.G.; Díez, M.J.; Heredia, F.J. Characterisation of moroccan unifloral honeys using multivariate analysis. Eur. Food Res. Technol. 2003, 218, 88–95. [Google Scholar] [CrossRef]
- Živkov-Baloš, M.; Popov, N.; Vidaković, S.; Ljubojević-Pelić, D.; Pelić, M.; Mihaljev, Ž.; Jakšić, S. Electrical conductivity and acidity of honey. Arch. Vet. Med. 2018, 11, 91–101. [Google Scholar] [CrossRef]
- Singh, I.; Singh, S. Honey moisture reduction and its quality. J. Food Sci. Technol. 2018, 55, 3861–3871. [Google Scholar] [CrossRef]
- Mutlu, C.; Erbaş, M.; Tontul, S.A. Bal ve diğer arı ürünlerinin bazı özellikleri ve insan sağlığı üzerine etkileri. Akademik Gıda 2017, 15, 75–83. (In Turkish) [Google Scholar] [CrossRef] [Green Version]
- Turkish Food Codex. Türk Gıda Kodeksi Bal Tebliği (Tebliğ No: 2020/7). 2020, Resmî Gazete Tarihi: 22.04.2020 Resmî Gazete Sayısı: 31107. Available online: https://www.mevzuat.gov.tr/mevzuat?MevzuatNo=34459&MevzuatTur=9&MevzuatTertip=5 (accessed on 29 December 2021). (In Turkish)
- Sunay, A.E. Balda antibiyotik kalıntısı sorunu. Uludağ Arıcılık Derg. 2006, 6, 143–148. (In Turkish) [Google Scholar]
- Turkish Food Codex. Türk Gıda Kodeksi Hayvansal Gıdalarda Bulunabilecek Farmakolojik Aktif Maddelerin Sınıflandırılması ve Maksimum Kalıntı Limitleri Yönetmeliği. 2017, Resmî Gazete Tarihi: 07.03.2017 Resmî Gazete Sayısı: 30000. Available online: https://www.mevzuat.gov.tr/mevzuat?MevzuatNo=23388&MevzuatTur=7&MevzuatTertip=5 (accessed on 29 December 2021). (In Turkish)
- Yang, Y.; Lin, G.; Liu, L.; Lin, T. Rapid determination of multi-antibiotic residues in honey based on modified QuEChERS method coupled with UPLC–MS/MS. Food Chem. 2022, 374, 131733. [Google Scholar] [CrossRef]
- Bonerba, E.; Panseri, S.; Arioli, F.; Nobile, M.; Terio, V.; Di Cesare, F.; Tantillo, G.; Chiesa, L.M. Determination of antibiotic residues in honey in relation to different potential sources and relevance for food inspection. Food Chem. 2021, 334, 127575. [Google Scholar] [CrossRef]
- Savarino, A.E.; Terio, V.; Barrasso, R.; Ceci, E.; Panseri, S.; Chiesa, L.M.; Bonerba, E. Occurrence of antibiotic residues in Apulian honey: Potential risk of environmental pollution by antibiotics. Ital. J. Food Saf. 2020, 9, 8678. [Google Scholar] [CrossRef] [PubMed] [Green Version]
- Mahmoudi, R.; Norian, R.; Pajohi-Alamoti, M. Antibiotic residues in Iranian honey by ELISA. Int. J. Food Prop. 2014, 17, 2367–2373. [Google Scholar] [CrossRef]
- Tamba-Berehoiu, R.; Visovan, D.; Popa, C.N. Study on the presence of antibiotic residues in honey intended for public consumption. Sci. Pap. 2013, 13, 305. [Google Scholar]
- Vidal, J.L.M.; Aguilera-Luiz, M.D.M.; Romero-Gonzalez, R.; Frenich, A.G. Multiclass analysis of antibiotic residues in honey by ultraperformance liquid chromatography− tandem mass spectrometry. J. Agric. Food Chem. 2009, 57, 1760–1767. [Google Scholar] [CrossRef] [PubMed]
- Reybroeck, W. Residues of antibiotics and sulphonamides in honey on the Belgian market. Apiacta 2003, 38, 23–30. [Google Scholar]
- Ağaoğlu, S.; Alemdar, S.; Ercan, N. Antibiotic residues in filtered honeys. TURJAF 2020, 8, 2408–2415. [Google Scholar] [CrossRef]
- Çakar, E.; Gürel, F. Süzme ve petekli balların pestisit, naftalin ve antibiyotik kalıntıları bakımından karşılaştırılması. Mediterr. Agric. Sci. 2019, 32, 453–459. (In Turkish) [Google Scholar] [CrossRef]
- Kutlu, M.A.; Abdurrahman, G.; Özdemir, F.A.; Kiliç, Ö. Bitlis ili Hizan ilçesinde üretilen ballarda antibiyotik kalıntılarının belirlenmesi. Türk Tarım Doğa Bilim. Derg. 2017, 4, 523–527. (In Turkish) [Google Scholar]
- Özkan, O.; Eşsiz, D.; Yazıcı, K.; Erdağ, D. Ardahan ilinde üretilen ballarda antibiyotik kalıntı düzeylerinin araştırılması. Ataturk Univ. Vet. Bilim. Derg. 2015, 10, 88–92. (In Turkish) [Google Scholar]
- Turkish Food Codex. Türk Gıda Kodeksi Arıcılık Yönetmeliği. 2011, Resmî Gazete Tarihi: 30.11.2011 Resmî Gazete Sayısı: 28128. Available online: https://www.mevzuat.gov.tr/mevzuat?MevzuatNo=15529&MevzuatTur=7&MevzuatTertip=5 (accessed on 29 December 2021). (In Turkish)
- Jasem Kit. Food Safety & Quality. 2021. Available online: https://jasem.com.tr/en/products/multi-antibotics/ (accessed on 10 October 2021).
- Turkish Standard. TS 13365, ICS 67.180.10; Determination of Water Content of Honey-Refractometric Method. Türk Standardları Enstitüsü: Ankara, Turkey, 2008. (In Turkish)
- Turkish Standard. TS 13366, ICS 67.180.10; Honey—Determining the Electrical Conductivity. Türk Standardları Enstitüsü: Ankara, Turkey, 2008. (In Turkish)
- Daniel, N.W. Bioistatistic: A Foundation for Analysis in the Health Sciences; Wiley: New York, NY, USA, 1991; p. 5. [Google Scholar]

| Antibiotics | % RSD | % Rec | LOD (µg/kg) | LOQ (µg/kg) | R2 |
|---|---|---|---|---|---|
| Albendazole | 0.23 | 81.52 | 0.68 | 2.27 | 0.998 |
| Chloramphenicol | 0.90 | 55.11 | 2.69 | 8.97 | 0.998 |
| Chlortetracycline | 0.44 | 88.63 | 1.31 | 4.37 | 0.998 |
| Ciprofloxacin | 0.17 | 83.89 | 0.51 | 1.72 | 0.998 |
| Dihydrostreptomycin | 0.12 | 81.26 | 0.37 | 1.22 | 0.999 |
| Doxycycline | 0.48 | 77.36 | 1.45 | 4.83 | 0.993 |
| Enrofloxacin | 0.48 | 92.25 | 1.44 | 4.78 | 0.996 |
| Erythromycin | 0.56 | 79.45 | 1.68 | 5.61 | 0.992 |
| Fenbendazole | 0.23 | 95.12 | 0.70 | 2.32 | 0.994 |
| Flubendazole | 0.17 | 90.42 | 0.52 | 1.72 | 0.998 |
| Furazolidon | 0.16 | 80.45 | 0.47 | 1.56 | 0.999 |
| Levamisole | 0.09 | 88.49 | 0.27 | 0.89 | 0.998 |
| Marbofloxacin | 0.08 | 90.03 | 0.25 | 0.85 | 0.995 |
| Mebendazole | 0.18 | 90.27 | 0.54 | 1.80 | 0.995 |
| Oxolinic acid | 0.30 | 77.02 | 0.89 | 2.96 | 0.997 |
| Oxytetracycline | 0.31 | 82.08 | 0.93 | 3.10 | 0.996 |
| Streptomycin | 0.32 | 88.93 | 0.95 | 3.15 | 0.999 |
| Sulfachloropyridazine | 0.48 | 98.98 | 1.44 | 4.81 | 0.997 |
| Sulfadiazine (Silvadene) | 0.51 | 111.60 | 1.53 | 5.10 | 0.994 |
| Sulfadimethoxine | 0.42 | 107.86 | 1.27 | 4.24 | 0.998 |
| Sulfadimidine (Sulfamethazine) | 0.36 | 120.91 | 1.07 | 3.57 | 0.999 |
| Sulfadoxine | 0.30 | 98.86 | 0.89 | 2.95 | 0.998 |
| Sulfamerazine | 0.17 | 62.00 | 0.52 | 1.72 | 0.998 |
| Sulfamethoxazole | 0.44 | 89.50 | 1.33 | 4.42 | 0.996 |
| Sulfapyridine | 0.44 | 106.28 | 1.32 | 4.41 | 0.999 |
| Sulfaquinoxaline | 0.45 | 108.88 | 1.35 | 4.50 | 0.994 |
| Sulfathiazole | 0.49 | 111.93 | 1.47 | 4.91 | 0.993 |
| Tetracycline | 0.28 | 89.97 | 0.83 | 2.78 | 0.999 |
| Thiabendazole | 0.12 | 84.63 | 0.36 | 1.21 | 0.998 |
| Tylosin | 0.23 | 80.10 | 0.70 | 2.33 | 0.999 |
| 5-Hydroxy-Thiabendazole | 0.23 | 99.97 | 0.70 | 2.34 | 0.999 |
| Cefquinome | 0.53 | 84.20 | 1.59 | 5.32 | 0.992 |
| Ceftiofur | 0.46 | 78.52 | 1.39 | 4.65 | 0.998 |
| Cephapirin | 0.21 | 80.00 | 0.64 | 2.12 | 0.997 |
| Emamectin B1a | 0.44 | 73.00 | 1.31 | 4.37 | 0.999 |
| Brands | Dihydrostreptomycin (μg/kg) | Streptomycin (μg/kg) | Sulfadimidine (Sulfamethazine) (μg/kg) | Erythromycin (μg/kg) |
|---|---|---|---|---|
| A | 8.22 ± 4.67 | nd | nd | nd |
| B | 76.66 ± 32.59 | 1.22 ± 0.02 | 6.62 ± 1.41 a | nd |
| C | 50.75 ± 20.28 | 4.02 ± 1.54 | nd | nd |
| D | 8.82 ± 3.43 | nd | 19.64 | nd |
| E | 6.89 ± 1.35 | 2.35 ± 1.09 | 1.36 ± 0.12 b | nd |
| F | 31.11 ± 8.47 | 2.15 ± 0.74 | nd | 59.62 ± 18.73 b |
| G | 22.15 ±13.92 | 6.20 ± 2.96 | nd | 78.32 ± 36.12 b |
| H | 4.40 ± 0.95 | 6.18 | nd | 358.11 ± 6.37 a |
| Brands | pH | Moisture (%) | Electrical Conductivity (mS/cm) |
|---|---|---|---|
| A | 3.98 ± 0.02 c | 17.48 ± 0.25 | 0.38 ± 0.02 bcd |
| B | 5.41 ± 0.05 a | 18.03 ± 0.08 | 0.47 ± 0.01 a |
| C | 3.82 ± 0.01 d | 17.70 ± 0.08 | 0.32 ± 0.002 d |
| D | 4.21 ± 0.03 b | 17.85 ± 0.13 | 0.37 ± 0.01 bc |
| E | 3.78 ± 0.02 d | 17.78 ± 0.08 | 0.35 ± 0.02 cd |
| F | 3.99 ± 0.04 c | 17.88 ± 0.13 | 0.25 ± 0.01 e |
| G | 3.85 ± 0.01 d | 17.90 ± 0.16 | 0.32 ± 0.01 d |
| H | 4.04 ± 0.04 c | 17.78 ± 0.22 | 0.46 ± 0.03 ab |
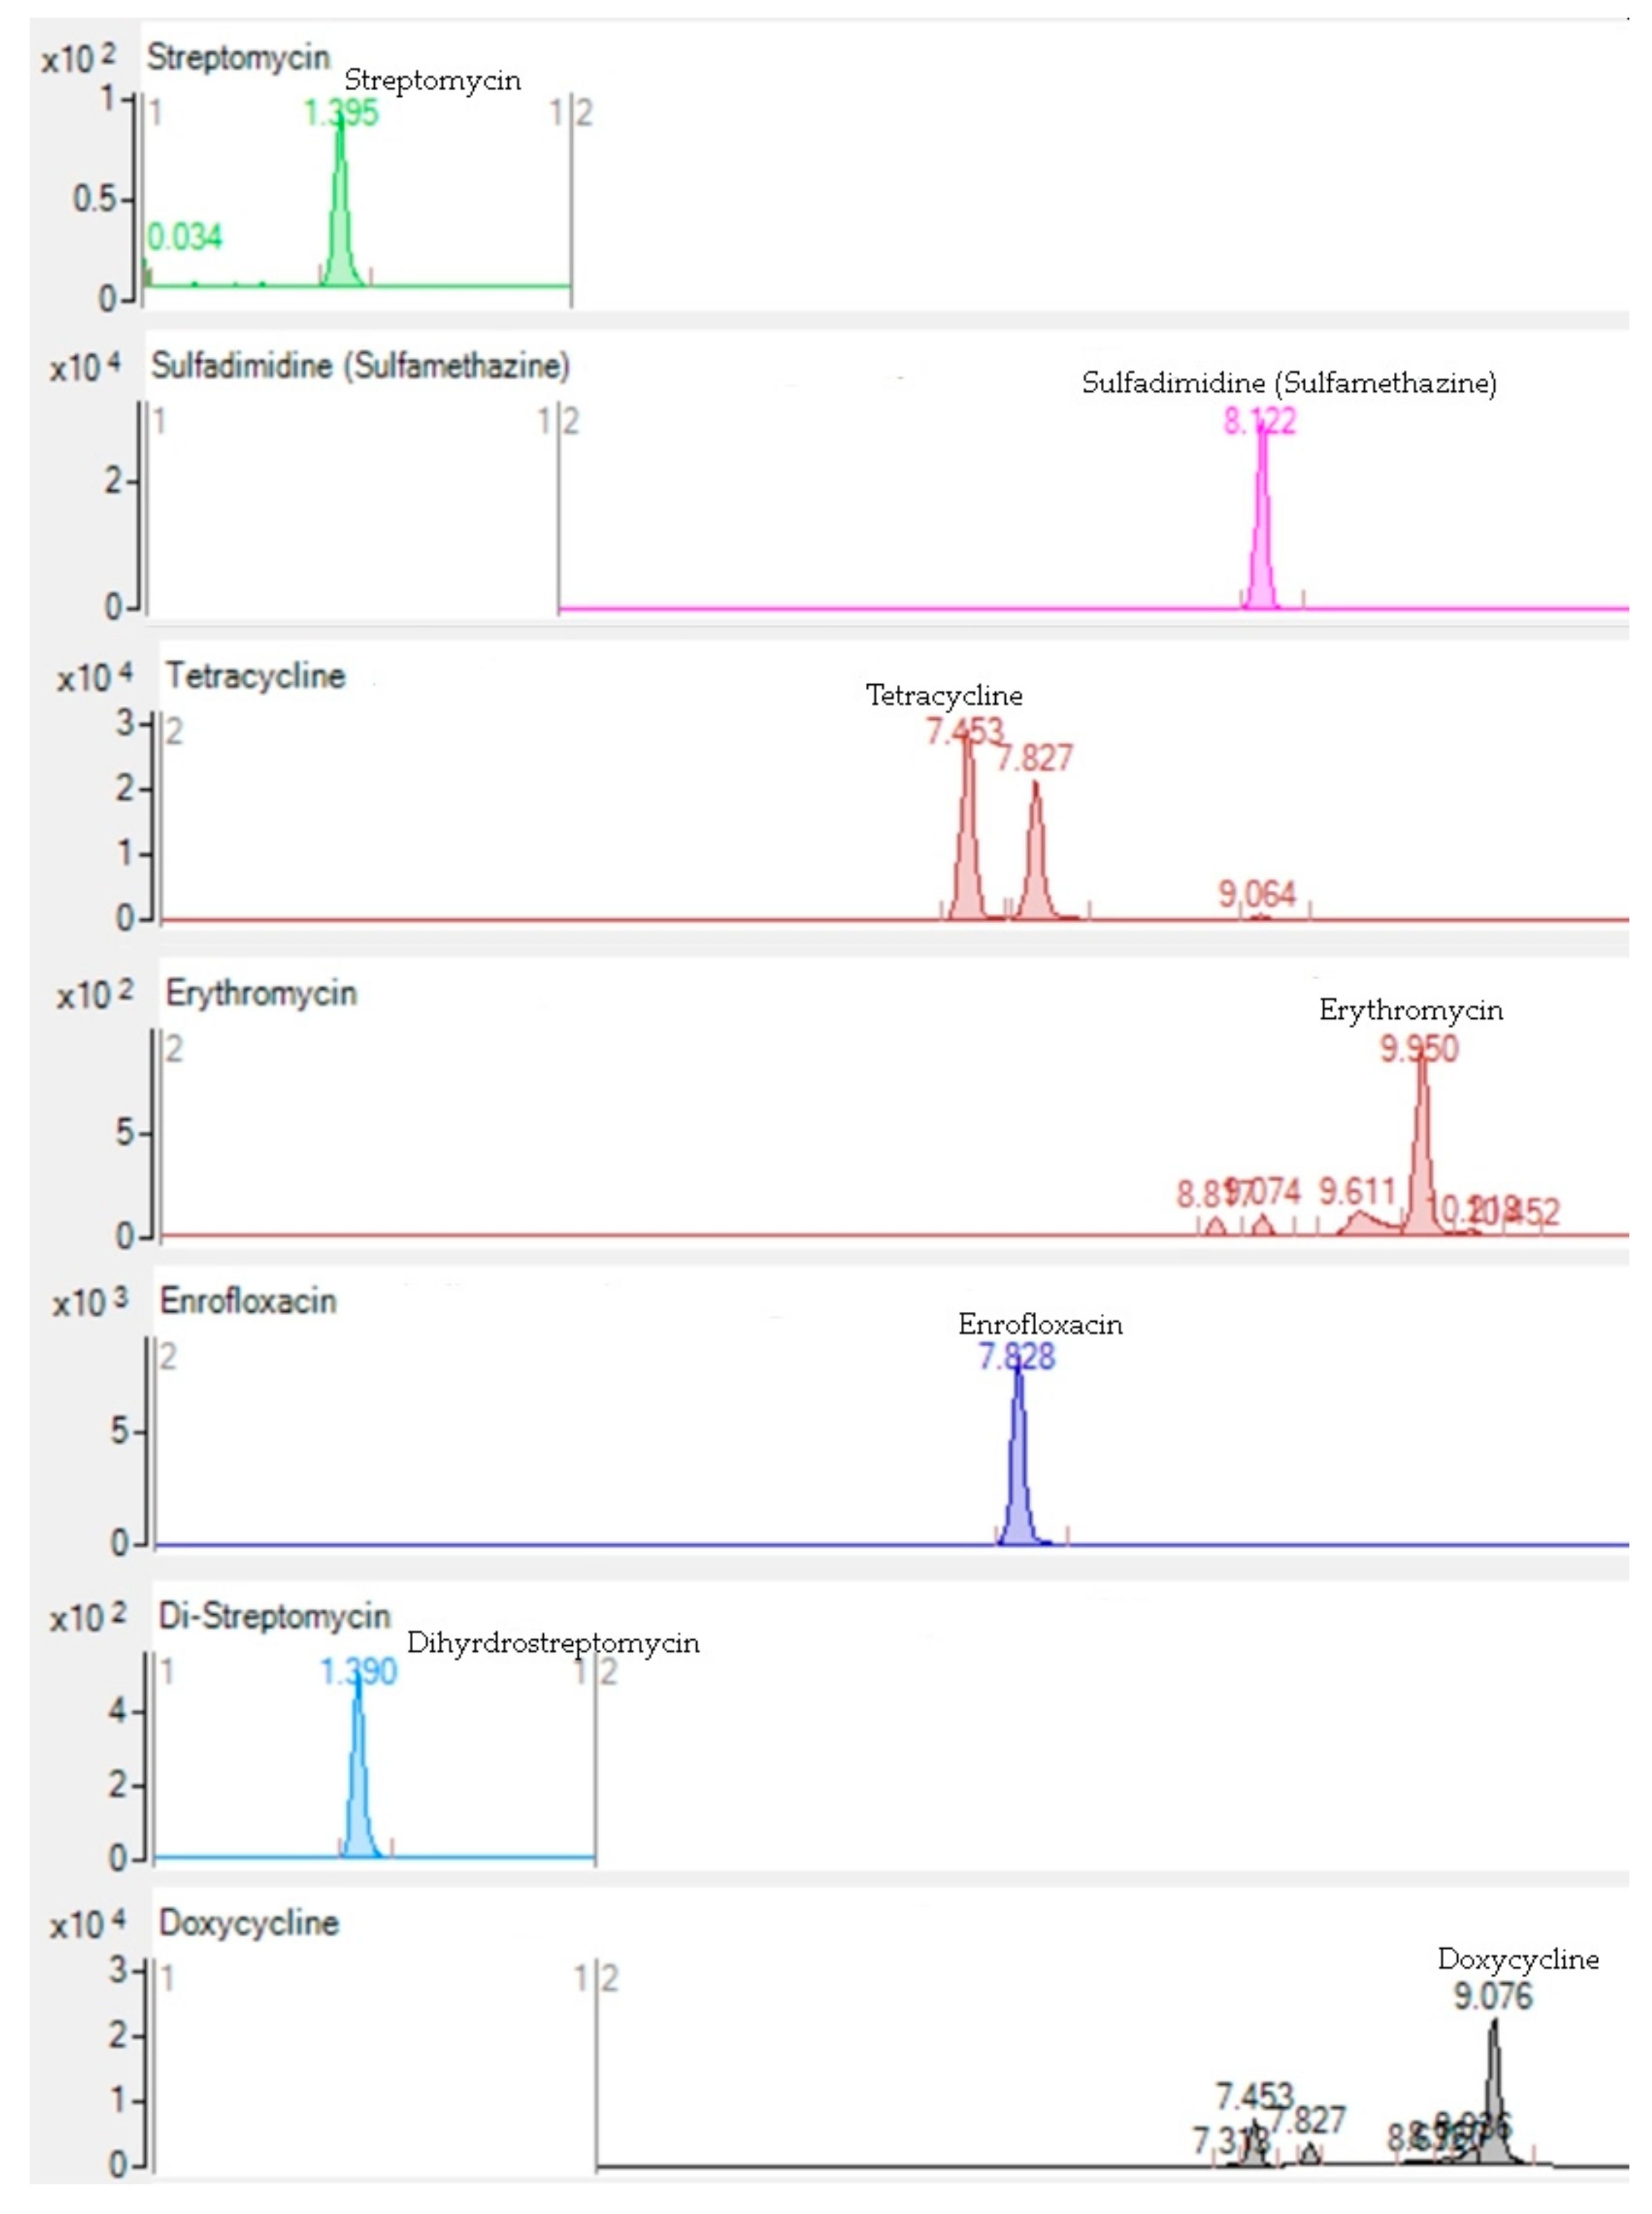
| Antibiotics | RT | Parent ion (m/z) | Fragment Ions | Concentration Range (µg/L) | Ion Mode | Fragmentor Voltage (V) | CE (V) | ||||
|---|---|---|---|---|---|---|---|---|---|---|---|
| Q1 | Q2 | Q3 | Q4 | ||||||||
| Albendazole | 10.58 ± 0.01 | 266.1 | 234 | 191 | - | 1–100 | Positive | 155 | 16 | 32 | - |
| Chloramphenicol | 9.85 ± 0.01 | 321 | 257 | 152 | - | 1–100 | Negative | 113 | 0 | 4 | - |
| Chlortetracycline | 8.37 ± 0.03 | 479.1 | 462 | 260 | 444 | 1–100 | Positive | 120 | 6 | 68 | 22 |
| Ciprofloxacin | 7.52 ± 0.02 | 332 | 314 | 231 | - | 1–100 | Positive | 130 | 20 | 35 | - |
| Dihydrostreptomycin | 1.39 ± 0.05 | 584.5 | 263 | 246 | - | 1–100 | Positive | 190 | 32 | 42 | - |
| Streptomycin | 1.39 ± 0.05 | 582.2 | 263 | 246 | 221 | 1–100 | Positive | 170 | 36 | 44 | 46 |
| Doxycycline | 9.07 ± 0.01 | 445.2 | 428 | 154 | - | 1–100 | Positive | 110 | 2 | 18 | - |
| Enrofloxacin | 7.82 ± 0.01 | 360 | 342 | 316 | 342 | 1–100 | Positive | 120 | 20 | 16 | 20 |
| Erythromycin | 9.95 ± 0.01 | 734.5 | 576 | 158 | - | 1–100 | Positive | 150 | 16 | 32 | - |
| Fenbendazole | 10.52 ± 0.02 | 300.1 | 268 | 159 | - | 1–100 | Positive | 156 | 20 | 36 | - |
| Flubendazole | 10.93 ± 0.01 | 314.1 | 282 | 123 | - | 1–100 | Positive | 146 | 20 | 36 | - |
| Furazolidon | 8.81 ± 0.01 | 226 | 122 | 67 | - | 1–100 | Positive | 150 | 20 | 40 | - |
| Levamisole | 6.83 ± 0.04 | 205.1 | 178 | 91.1 | - | 1–100 | Positive | 141 | 20 | 44 | - |
| Marbofloxacin | 7.29 ± 0.01 | 363 | 345 | 320 | - | 1–100 | Positive | 120 | 17 | 9 | - |
| Mebendazole | 10.63 ± 0.11 | 296.1 | 264 | 77 | - | 1–100 | Positive | 151 | 20 | 48 | - |
| Oxolinic acid | 9.90 ± 0.01 | 262.1 | 244 | 216 | - | 1–100 | Positive | 114 | 12 | 28 | - |
| Oxytetracycline | 7.39 ± 0.01 | 461.2 | 443 | 426 | - | 1–100 | Positive | 90 | 10 | 16 | - |
| Sulfachloropyridazine | 9.05 ± 0.09 | 285 | 156 | 92.1 | - | 1–100 | Positive | 108 | 12 | 24 | - |
| Sulfadiazine (Silvadene) | 6.83 ± 0.01 | 251.1 | 156 | 92.1 | - | 1–100 | Positive | 96 | 8 | 28 | - |
| Sulfadimethoxine | 10.32 ± 0.01 | 311.1 | 156 | 108 | - | 1–100 | Positive | 128 | 16 | 28 | - |
| Sulfadimidine (Sulfamethazine) | 8.12 ± 0.01 | 279.1 | 186 | 124 | 156 | 1–100 | Positive | 80 | 16 | 32 | 18 |
| Sulfadoxine | 9.32 ± 0.09 | 311.1 | 156 | 92.1 | - | 1–100 | Positive | 126 | 16 | 32 | - |
| Sulfamerazine | 7.58 ± 0.02 | 265.1 | 156 | - | - | 1–100 | Positive | 114 | 12 | - | - |
| Sulfamethoxazole | 9.43 ± 0.01 | 254.1 | 156 | 92.1 | - | 1–100 | Positive | 108 | 12 | 24 | - |
| Sulfapyridine | 7.31 ± 0.01 | 250.1 | 108 | 92 | - | 1–100 | Positive | 150 | 20 | 20 | - |
| Sulfaquinoxaline | 10.32 ± 0.04 | 301.1 | 156 | 92 | - | 1–100 | Positive | 118 | 16 | 32 | - |
| Sulfathiazole | 7.18 ± 0.03 | 256 | 156 | 92.1 | - | 1–100 | Positive | 102 | 12 | 28 | - |
| Tetracycline | 7.45 ± 0.01 | 445.2 | 154 | 427 | 410 | 1–100 | Positive | 100 | 28 | 8 | 16 |
| Thiabendazole | 7.03 ± 0.05 | 202 | 175 | 131 | - | 1–100 | Positive | 130 | 24 | 36 | - |
| Tylosin | 10.19 ± 0.09 | 916.5 | 101 | 174 | 772 | 1–100 | Positive | 230 | 56 | 44 | 32 |
| 5-Hydroxy-Thiabendazole | 6.53 ± 0.10 | 218 | 147 | 234 | - | 1–100 | Positive | 120 | 40 | 40 | - |
| Cefquinome | 6.89 ± 0.11 | 529.1 | 396 | 134 | - | 1–100 | Positive | 110 | 8 | 12 | - |
| Ceftiofur | 9.47 ± 0.12 | 524 | 241 | 127 | 126 | 1–100 | Positive | 141 | 16 | 48 | 40 |
| Emamectin B1a | 12.10 ± 0.13 | 886.5 | 158 | 82.1 | - | 1–100 | Positive | 190 | 40 | 60 | - |
Publisher’s Note: MDPI stays neutral with regard to jurisdictional claims in published maps and institutional affiliations. |
© 2022 by the authors. Licensee MDPI, Basel, Switzerland. This article is an open access article distributed under the terms and conditions of the Creative Commons Attribution (CC BY) license (https://creativecommons.org/licenses/by/4.0/).
Share and Cite
Er Demirhan, B.; Demirhan, B. Detection of Antibiotic Residues in Blossom Honeys from Different Regions in Turkey by LC-MS/MS Method. Antibiotics 2022, 11, 357. https://doi.org/10.3390/antibiotics11030357
Er Demirhan B, Demirhan B. Detection of Antibiotic Residues in Blossom Honeys from Different Regions in Turkey by LC-MS/MS Method. Antibiotics. 2022; 11(3):357. https://doi.org/10.3390/antibiotics11030357
Chicago/Turabian StyleEr Demirhan, Buket, and Burak Demirhan. 2022. "Detection of Antibiotic Residues in Blossom Honeys from Different Regions in Turkey by LC-MS/MS Method" Antibiotics 11, no. 3: 357. https://doi.org/10.3390/antibiotics11030357
APA StyleEr Demirhan, B., & Demirhan, B. (2022). Detection of Antibiotic Residues in Blossom Honeys from Different Regions in Turkey by LC-MS/MS Method. Antibiotics, 11(3), 357. https://doi.org/10.3390/antibiotics11030357