Article

Abundance and Dynamic Distribution of Antibiotic Resistance Genes in the Environment Surrounding a Veterinary Antibiotic Manufacturing Site

Key Laboratory of Environment and Human Health of Hebei Province, School of Public Health, Hebei Medical University, Shijiazhuang 050017, China
*
Author to whom correspondence should be addressed.
Two authors contributed equally to this work.
Antibiotics 2021, 10(11), 1361; https://doi.org/10.3390/antibiotics10111361
Submission received: 28 September 2021 / Revised: 28 October 2021 / Accepted: 4 November 2021 / Published: 8 November 2021

Abstract

:
Background: Antibiotics releasing from the manufacturing sites to the surrounding environment has been identified as a risk factor for the development of antibiotic resistance of bacterial pathogens. However, the knowledge of the abundance and distribution of antibiotic resistance genes (ARGs) influenced by antibiotic pollution is still limited. Methods: In this work, the contamination by resistance genes of the environmental media including an urban river and soil along the river located near the sewage outlet of a veterinary antibiotic manufacturing site in Shijiazhuang, China, was assessed. The abundance and dynamic distribution of ARGs in different sampling points and during different seasons were analyzed using fluorescent quantitative PCR method (qPCR). Results: A total of 11 resistance genes, one integron and one transposon were detected in water and soils around the pharmaceutical factory, and among which, the sulfonamide resistance genes sul1 and β-lactam resistance genes blaSHV were the most abundant genes. The relative abundance of ARGs in both river water and soil samples collected at the downstream of the sewage outlet was higher than that of samples collected at the upstream, non-polluted areas (p < 0.05). The mobile genetic elements (MGEs) integron in river was significantly correlated (p < 0.05) with the relative abundance of ARGs. Conclusions: The results indicate that the discharge of waste from antibiotic manufacturing site may pose a risk of horizontal transfer of ARGs.

1. Introduction

Antibiotics are widely used to prevent and treat bacterial infectious diseases, and to promote the growth and increase the feed efficiency in animal [1]. Most veterinary antibiotics are not completely absorbed in the animal intestines, but are excreted into the environment through feces and urine in the form of prototypes [2]. In recent years, the overuse, abuse, and unmonitored discharge of antibiotics have promoted the occurrence and spread of antibiotic resistance genes (ARGs) and antibiotic-resistant bacteria [3,4,5]. ARGs could advance bacteria “along the path to becoming superbugs”. As emerging pollutants, the spread and diffusion of resistance genes in the environment pose a serious threat to public health. Infections caused by antibiotic-resistant bacteria in the European Community/EU region have been very significant since 2007, and more than thirty thousand people have died each year due to infections caused by different resistant bacteria [6]. According to the US Centers for disease control, at least two million Americans are infected with bacteria that cannot be treated with antibiotics every year, and at least 23,000 of them have died. World Health Organization (WHO) predicted that the spread of antibiotic resistance would kill 300 million people in 2050. In addition, according to the latest research results, drug-resistant strains not only exist in patients, but also in healthy people who may carry drug-resistant genes, which is a public health problem that is easy to be ignored to deal with drug-resistant bacteria [7,8]. WHO released the “Draft global action plan on antimicrobial resistance” in 2014, and pointed out that drug resistance is one of the most urgent public health problems in the world. China also issued the national action plan to curb bacterial drug resistance in 2016, which aims to strengthen the scientific management of antibiotics, curb the development and spread of bacterial drug resistance, and maintain the health of the people. ARGs have become a widespread public health and concern [9,10,11].
A large number of bulk antibiotic drugs and their preparations are produced every year. Sewage discharged from an antibiotic production process is treated before being discharged into the environment. Studies have shown that the current wastewater treatment process cannot completely eliminate antibiotics and antibiotic resistance genes, causing some residues amounts to still be discharged into the environment [12,13,14,15]. Antibiotic residues in the environment exert selective pressure on bacteria even at low concentrations, and possibly induce the generation of ARGs, promoting their horizontal transfer, and accelerating their dissemination [16,17]. Residual antibiotics and ARGs can enter into drinking water systems, which in turn increase the possibility of antibiotic resistance dissemination among the population [18]. In addition, antibiotics and ARGs will be transferred to soils through crop irrigation [19], composting of animal feces [20] etc., thus entering the food chain, posing threats to human health [21,22,23].
China is a major producer and consumer of antibiotics. It produces nearly 300,000 tons of antibiotic raw materials every year, of which more than 80,000 tons are used in animal husbandry and aquaculture [18,24]. In recent years, industrial discharges from antibiotic manufacturing have been recognized as a risk factor fostering ARGs development and dissemination [25]. ARGs have been detected in various environmental media. Liu et al. [26] have investigated the relative abundance of sulfonamide resistance genes in waters in Beijing area, and found to be as high as 7.11 × 10⁻² to 1.18 × 10⁻¹. The follow-up study by Chen et al. [27] also showed that most of the 27 resistance genes found in Chaobai River sediments were abundant and positively correlated with integrons. The pollution of resistance genes in groundwater environment has been studied by Szekeres et al. [28]. In their results, at different locations of an urban area, the relative abundances of 11 resistance genes has been found to range from 6.61 × 10⁻⁷ to 2.30 × 10⁻¹, and the diversity of species in the contaminated groundwater has also been found to increase significantly. Xie et al. and Gaviria-Figueroa et al. [29,30] have detected a variety of ARGs in air around a sewage treatment factory, and confirmed that the bioaerosol in the air could promote the diffusion and spread of bacteria and drug-resistant genes. Many studies have shown that horizontal gene transfer (HGT) is the main mechanism for the widespread distribution of bacterial drug resistance [31,32]. The combination of ARGs and mobile genetic elements (MGEs) can lead to horizontal transfer in the environment, thereby can accelerate the dissemination of ARGs and increase the possibility of drug-resistant contamination of bacteria [33].
Shijiazhuang is close to the capital Beijing. It is an antibiotic production base of China. Antibiotics are the main products of some pharmaceutical groups, such as the North China Pharmaceutical group and the Shijiazhuang Pharmaceutical Group. A large number of antibiotic drugs are produced and distributed at Shijiazhuang. The total output of antibiotic raw materials from the North China Pharmaceutical Group accounts for about 15% of the country’s total output, and its production of penicillin, semi-synthetic penicillin, and other intermediates rank first in Asia. A veterinary drug manufacturer located in the urban area has been producing a variety of veterinary antibiotics, including sulfonamide, tetracycline, and beta-lactam antibiotics, for more than 20 years. It has also been discharging its effluent into the nearby Min-xin river. The long-term effect of low-dose residue in water discharged from antibiotic manufacturing sites on the surrounding environment has been identified as a risk factor for the development of antibiotic resistance of bacterial pathogens [25,34]. The aims of the present study are: (i) To detect the types of resistance genes in the water of Min-xin river and soil from different sampling points around this veterinary drug production site; (ii) to analyze the abundance and dynamic distribution of ARGs during different seasons; and (iii) to evaluate the pollution of ARGs caused by antibiotic-manufacturing discharge in the surrounding environmental media.

2. Results

2.1. Detection of Resistance Genes by qPCR Assay

A total of 11 resistance genes (tetC, tetO, sul1, sul2, sul3, ermA, ermB, blaOXA-10, blaSHV, blaCTX-M, ampC), class 1 integrons intI, and one transposon tnpA-IS4 were detected in the collected water and soil samples by q-PCR technique, as shown in Figure 1.
As can be seen from Figure 1, the frequency of detection of these genes varied greatly. For samples collected in October, the sulfonamide resistance genes sul1, the β-lactam resistance genes blaOXA-10 and ampC, and transposon tnpA-IS4 had the highest detection rates in water samples, and β-lactam resistance genes blaSHV, blaOXA-10 and transposon tnpA-IS4 had the highest detection rates in soil samples. The detection rate of sulfonamides resistance gene sul1 was highest in both water and soil samples collected in December. For samples collected in March, the detection rate of sulfonamides-resistant gene sul1, β-lactam-resistant gene blaOXA-10 and transposon tnpA-IS4 was highest in water samples, and that of resistance gene sul1 was also highest in soil samples. Although the macrolide resistance gene ermA was also detected, its detection rate was the lowest.

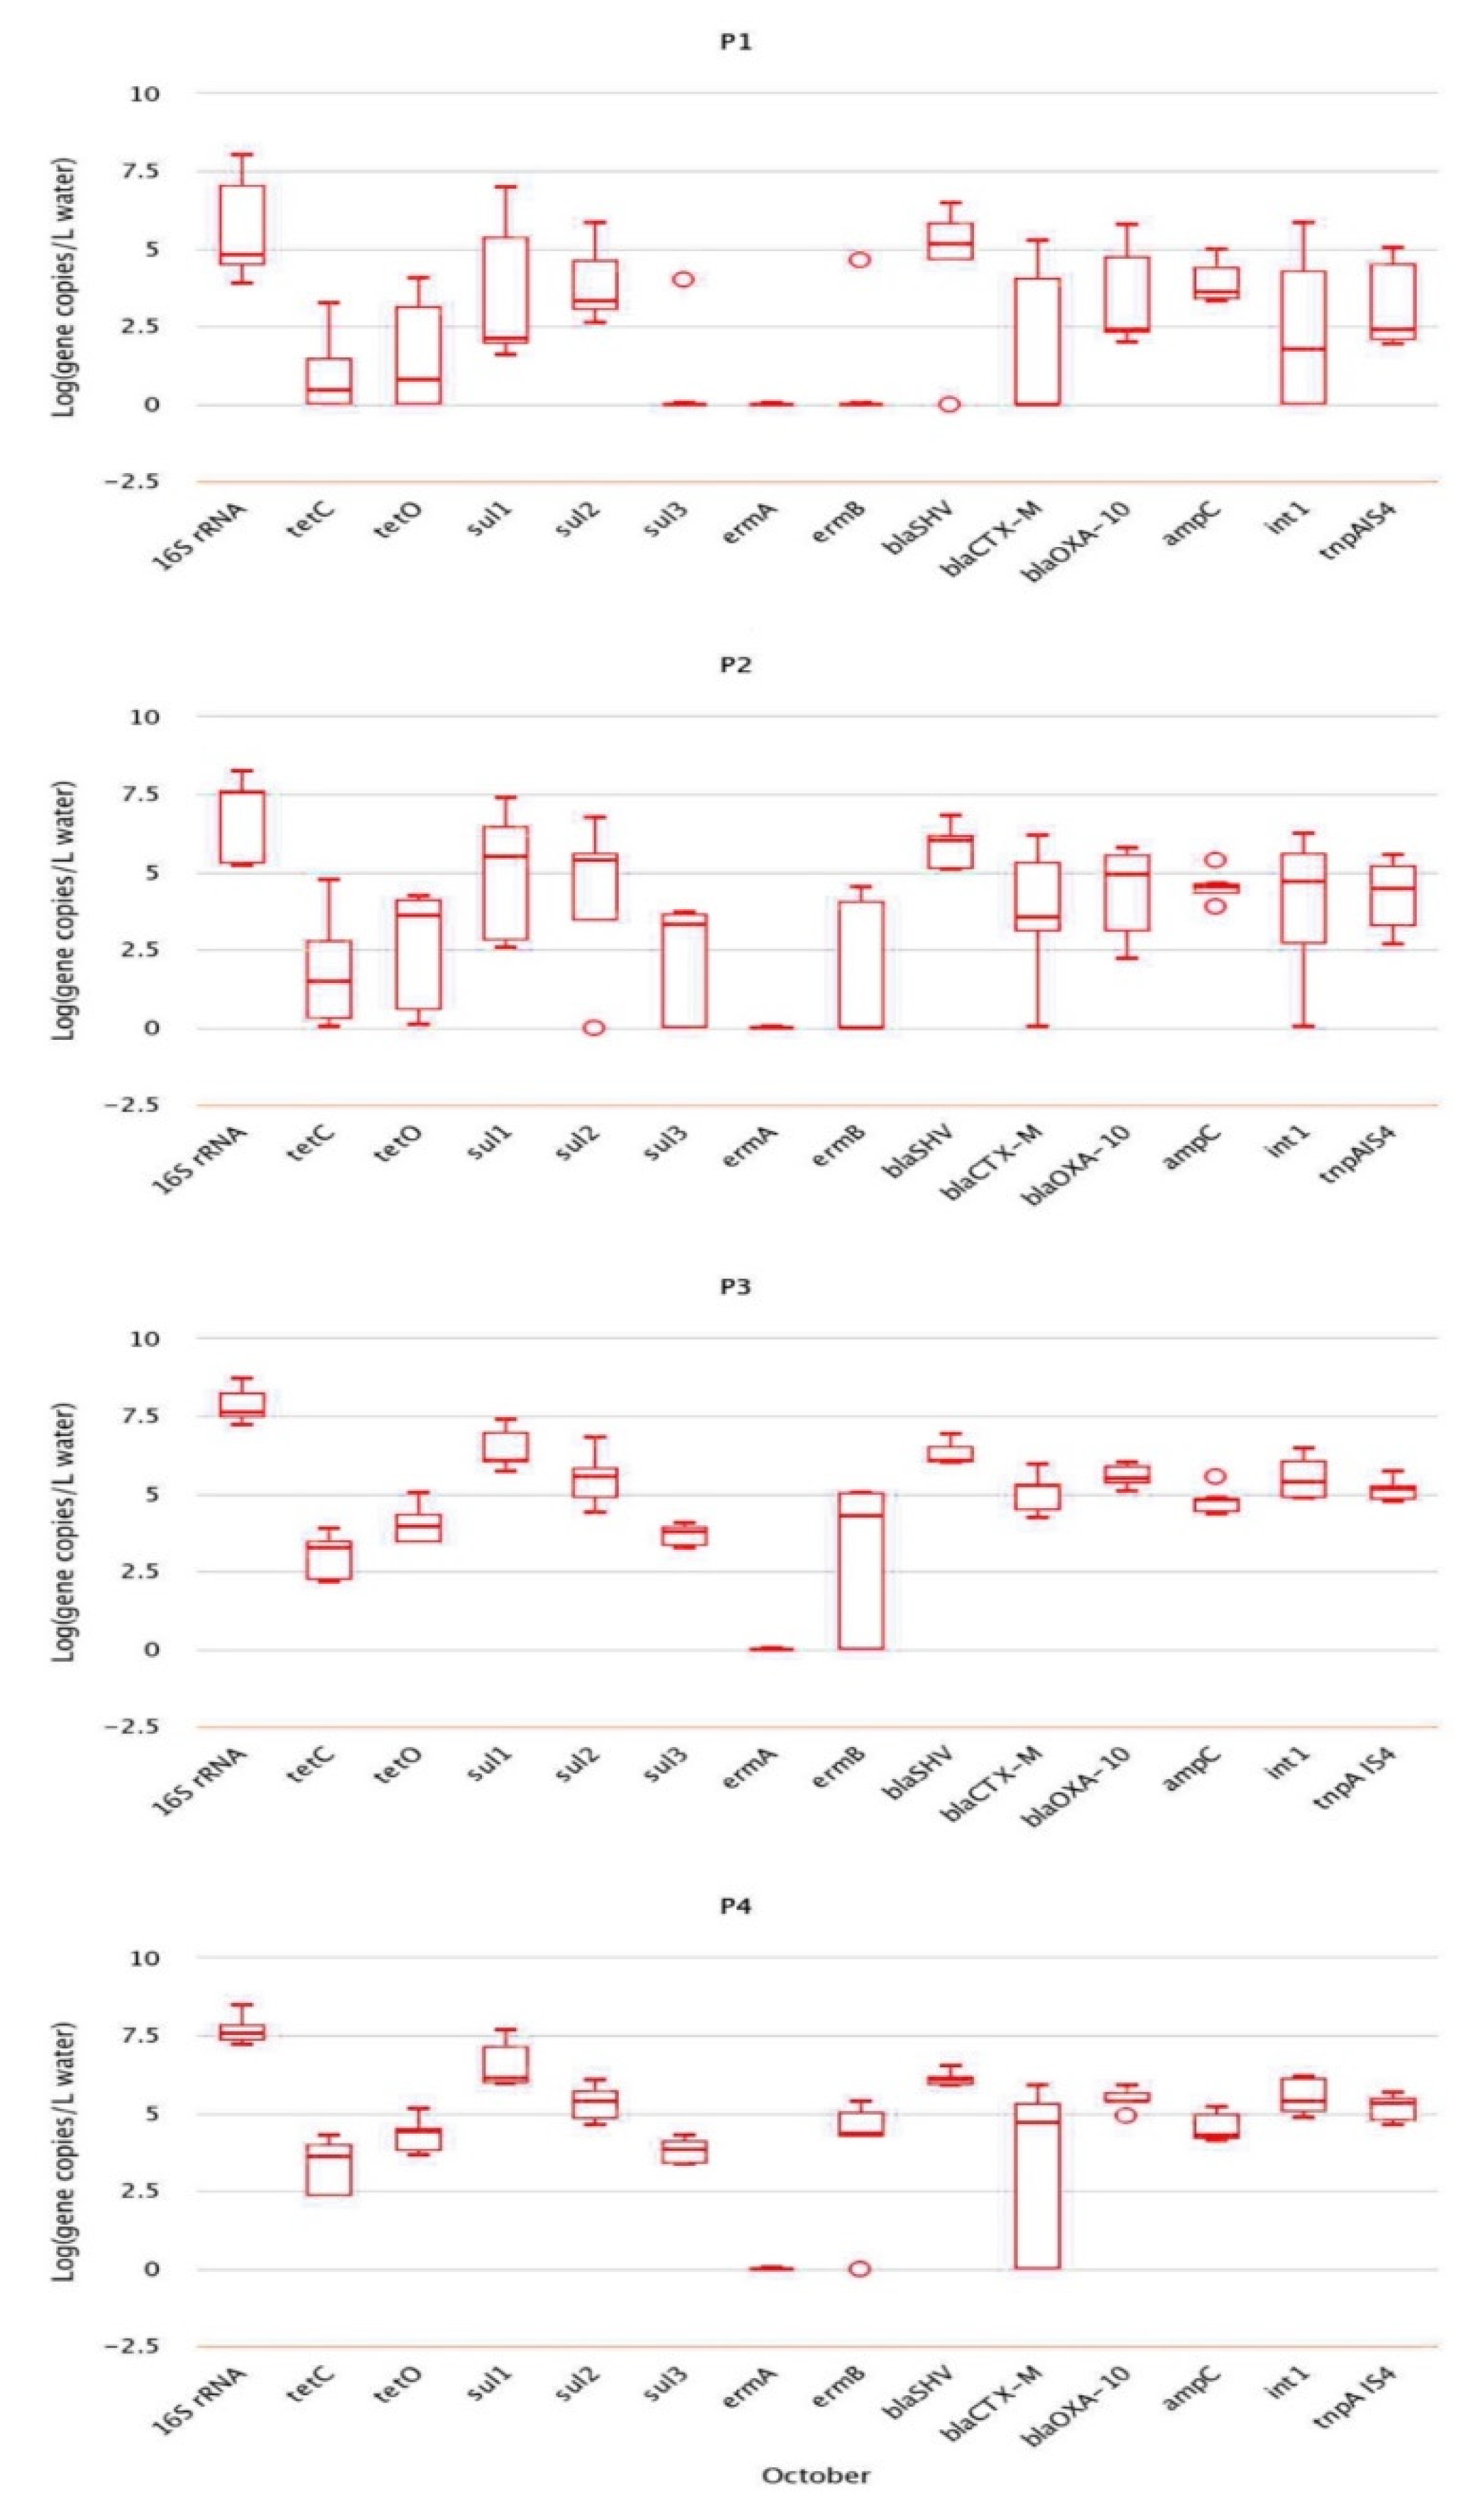
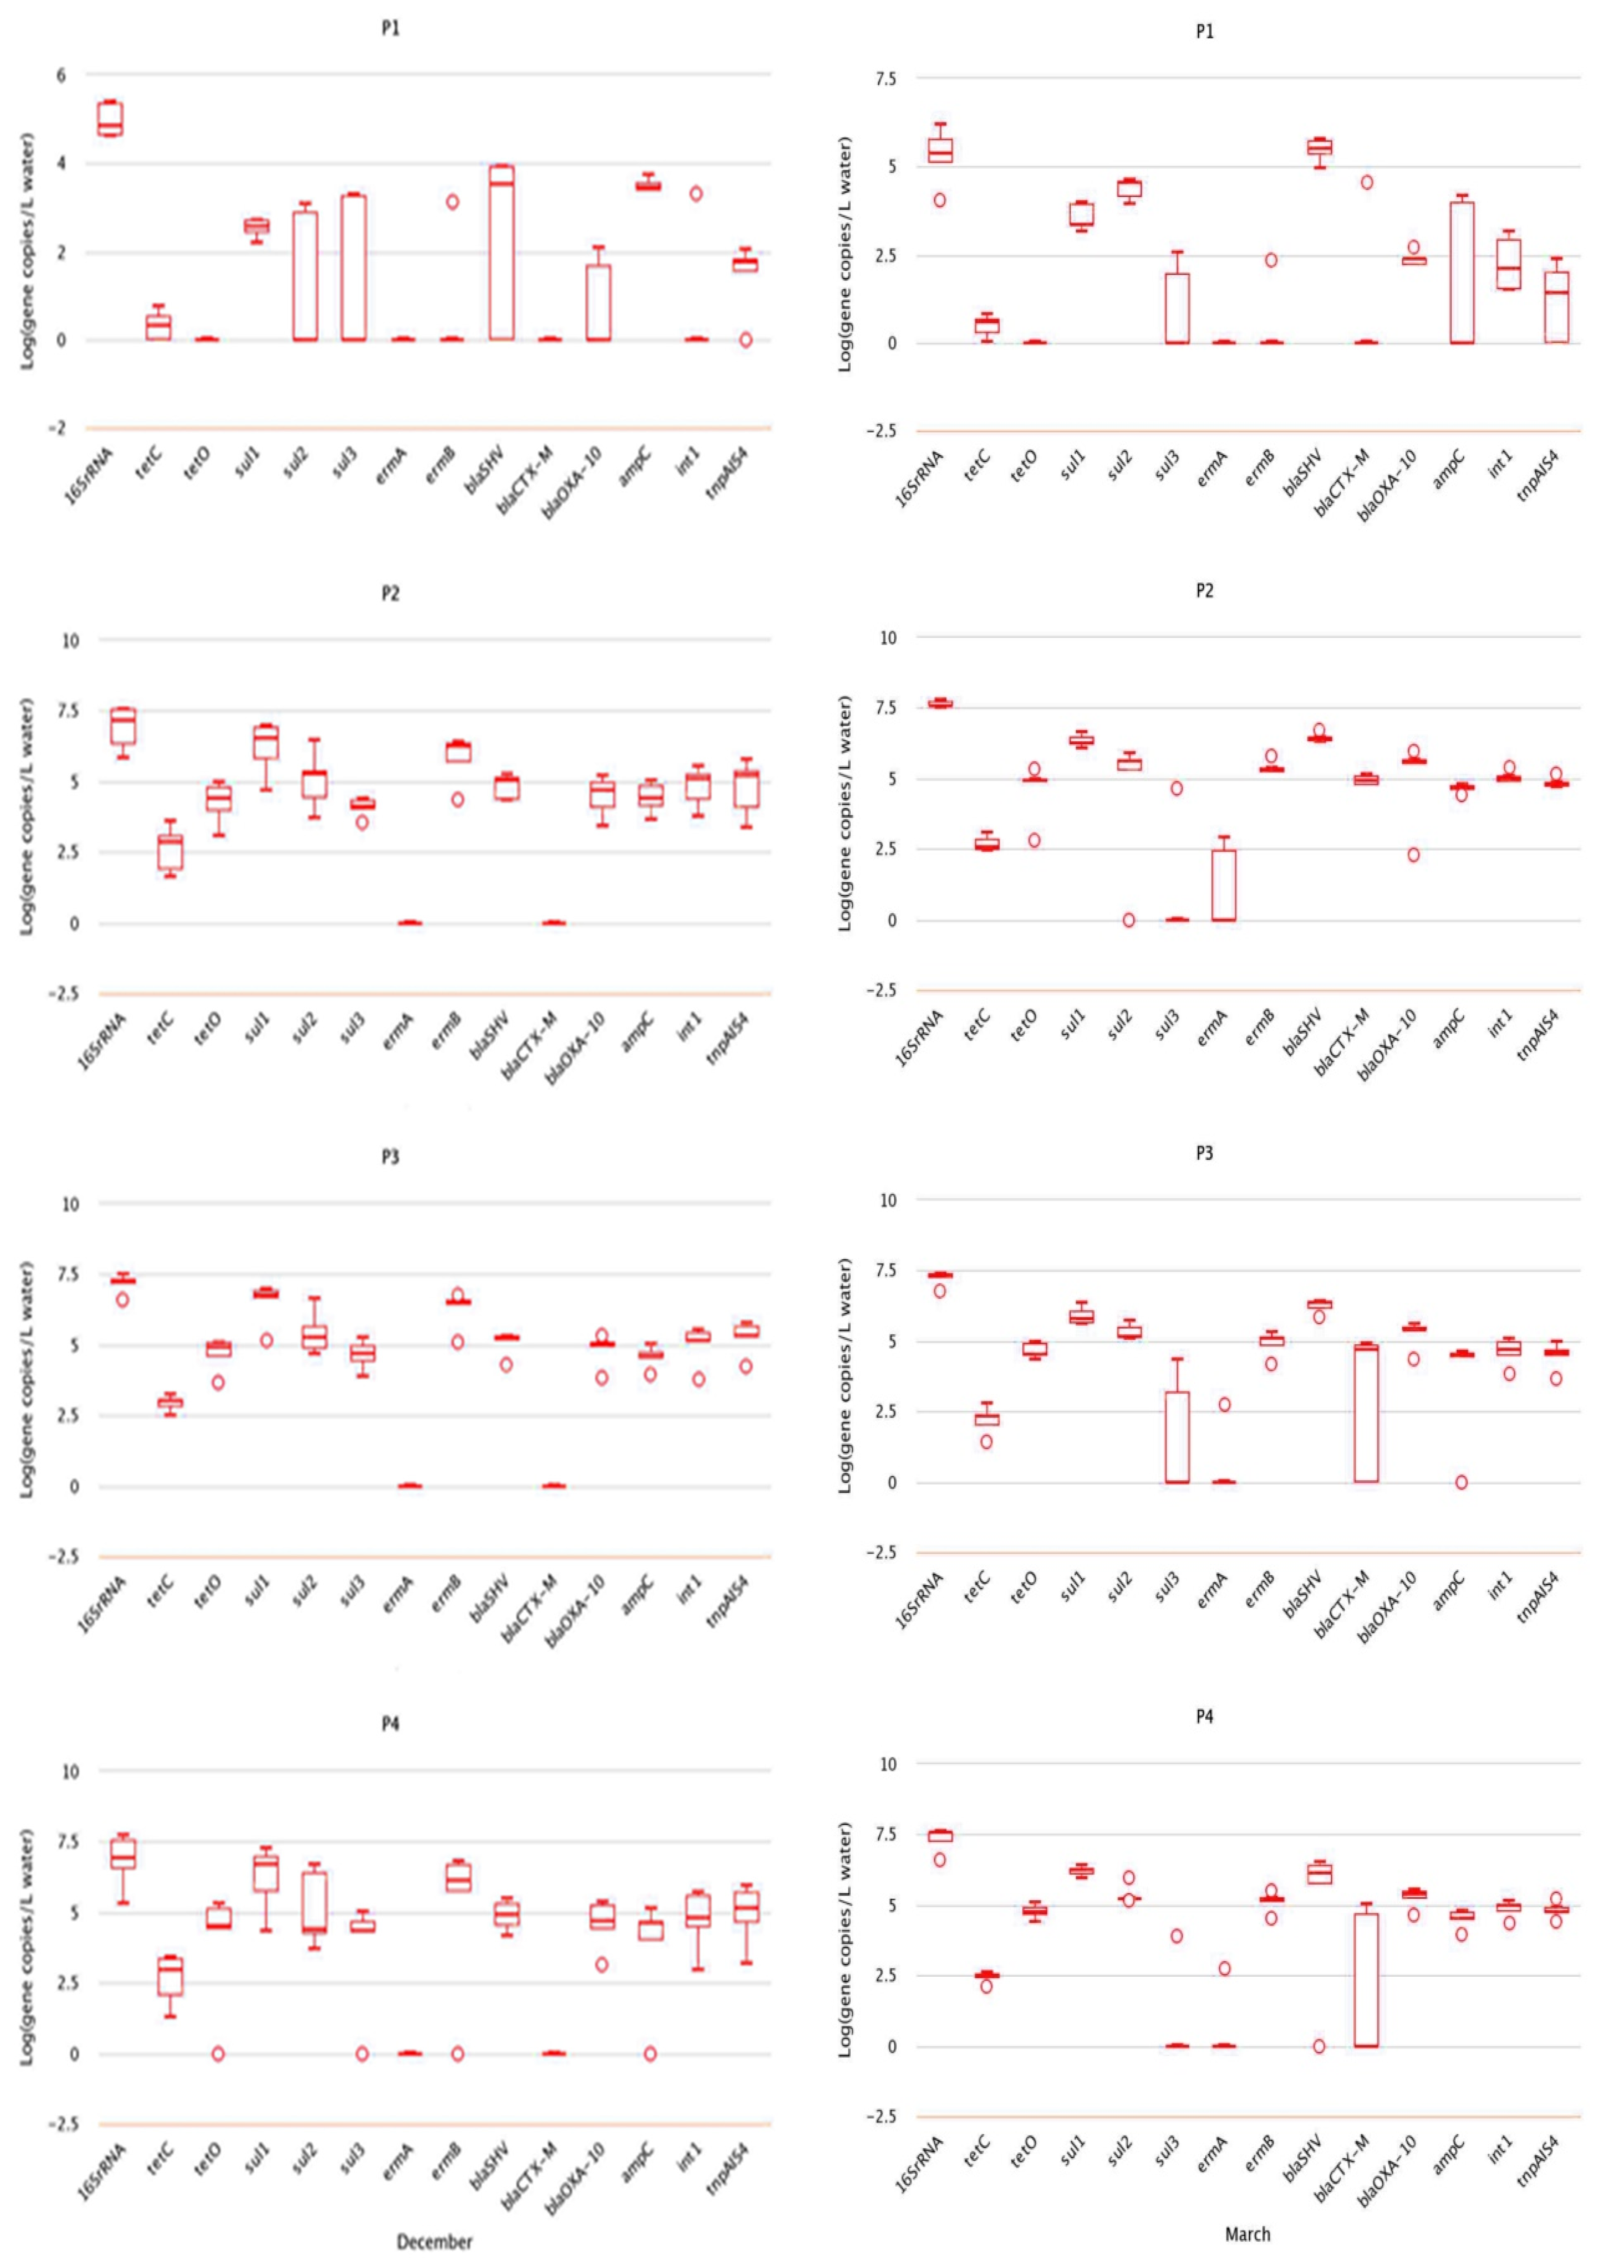
2.2. Analysis of Absolute Abundance of ARGs by qPCR

The absolute abundance of genes is the actual concentration obtained by converting the copy number of target genes in the samples obtained by qPCR according to the dilution multiple. Unit of absolute abundance is copies/g (dry mass of soil) or copies/L (water sample). Resistance genes with the highest absolute abundance in water and soil samples collected in October included sulfonamide resistance gene sul1 (4.39 × 10⁷ copies/L), followed by β-lactam resistance gene blaSHV (2.73 × 10⁶ copies/g) (Figure 2). The resistance of genes in water samples from different sampling points was not significantly different. However, the absolute abundance of sulfonamide resistance gene sul1, β-lactam resistance gene blaOXA-10, and transposon tnpA-IS4 were significantly different (p < 0.05), and the absolute abundance at P3 and P4 was significantly higher than that at P1. In soil samples, the absolute abundance of resistance genes at points A and B was not obviously different except for that of transposon tnpA-IS4 (p < 0.05). Additionally, the absolute abundance of tnpA-IS4 at point B was higher than that at point A.
In the water and soil samples collected in December, resistance genes with the highest absolute abundance in water was sulfonamide resistance gene sul1 (1.79 × 10⁷ copies/L), while that in soils was sul2 gene (2.53 × 10⁸ copies/g) (Figure 3). The absolute abundance of resistance genes tetC, sul1, sul2, sul3, blaOXA-10, blaSHV, ampC, and tnpA-IS4 in water from different sampling points were significantly different (p < 0.05), and the absolute abundance in points P2, P3, and P4 was obviously higher than in point P1.
The absolute abundance of β-lactam resistance gene blaSHV was highest both in water samples (5.12 × 10⁶ copies/L) and soil samples (4.17 × 10⁶ copies/g) collected in March. The absolute abundance of tetC, sul1, sul2, blaSHV, blaOXA-10, intI and tnpA-IS4 in water samples from different sites was significantly different (p < 0.05), and the absolute abundance in points P2, P3, and P4 was also obviously higher than that in point P1, as shown in Figure 3.

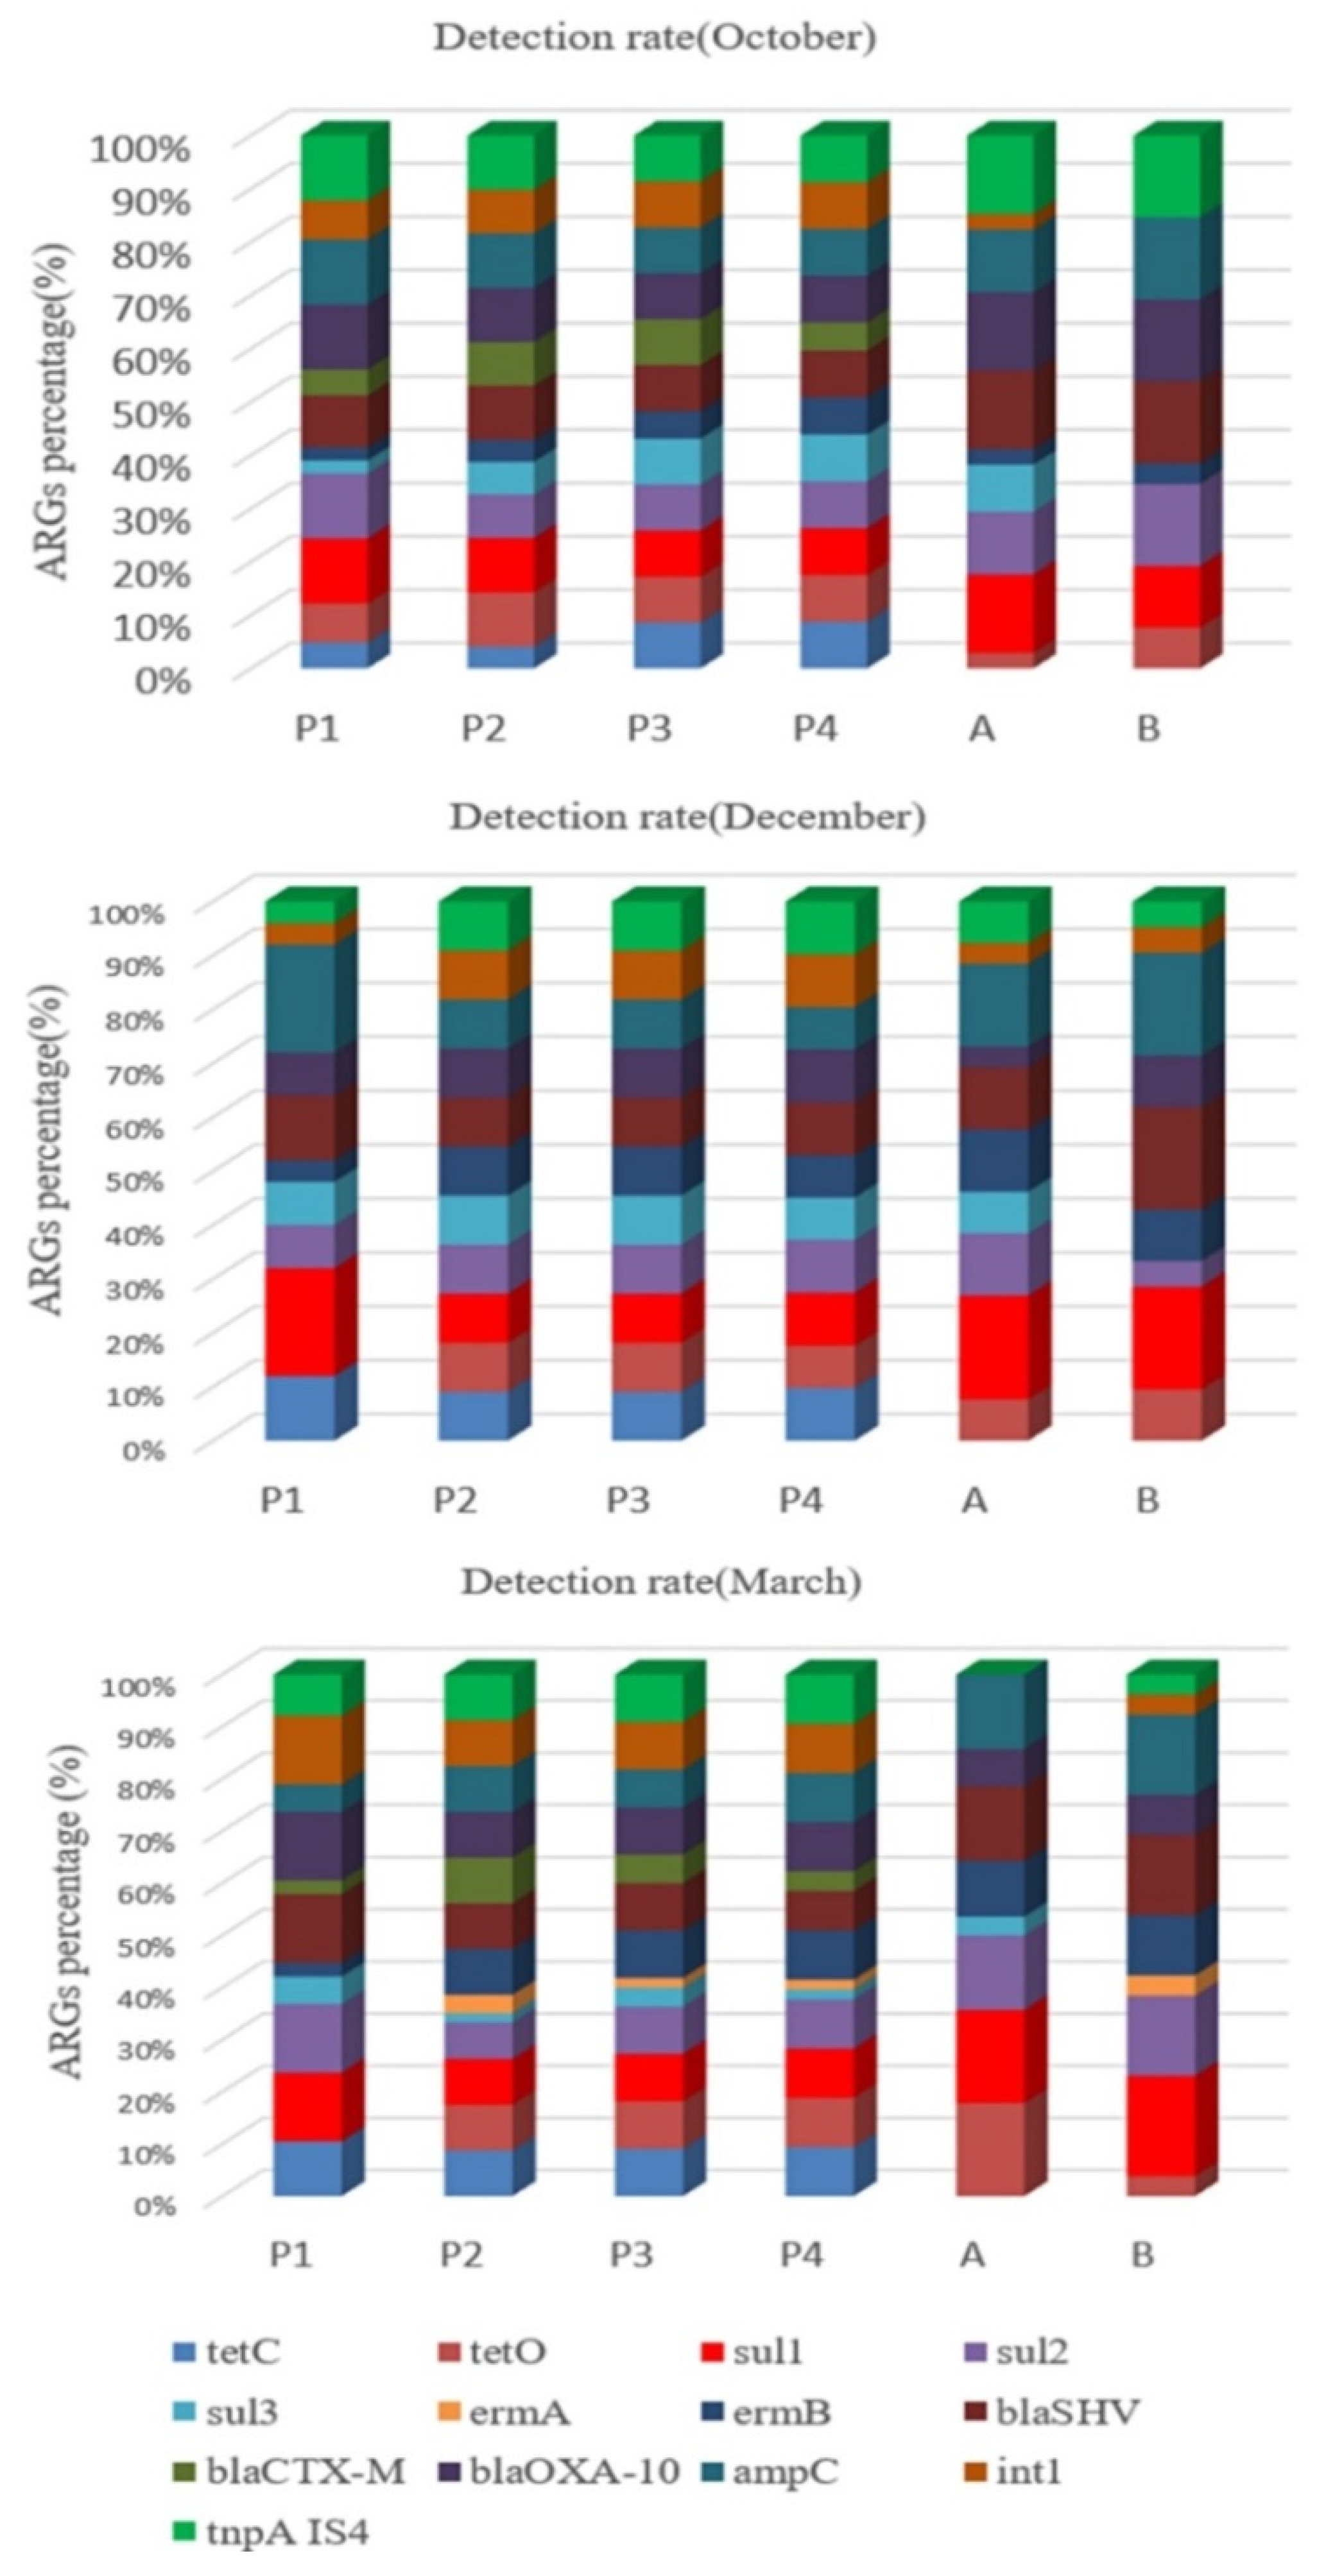
2.3. Relative Abundance of ARGs

The total amounts of microorganisms in water and soil samples were different, as a result, the total amount of resistance genes was different. Therefore, the concentration of ARGs in the tested sample was normalized to that of the internal reference gene 16S rRNA to obtain the relative abundance of ARGs, which is equal to the absolute abundance of target genes/the absolute abundance of 16S rRNA genes. The calculation of relative abundance means that the influence of microorganisms in the environment is excluded. Table 1 lists the results from analysis of variance between resistance genes in sampling points at different times. Among all genes, only sul2 and blaSHV genes in water samples collected in March had the relative abundance greater than 0. In the abovementioned results in Section 2.2, the absolute abundance of blaSHV in both water and soil samples collected in March was the highest. The results of relative abundance were consistent with those of the absolute abundance. One-way analysis of variance showed that the relative abundance of most resistance genes detected in samples collected from different sampling points was significantly different. The relative abundance of β-lactam resistance gene ampC in water samples collected in October at different sampling points was significantly different (p < 0.05), and its relative abundance at P3 and P4 was significantly higher than that at P1.
The relative abundance of resistance genes sul1, blaOXA-10, and ampC in water samples collected in December at different sampling points was also significantly different (p < 0.05), and the relative abundance at points P2, P3, and P4 was significantly higher than at point P1. The relative abundance of transposon tnpA-IS4 in samples collected from different sampling points was significantly different, and the relative abundance at points P2, P3, and P4 was also significantly higher than that at point P1. In the water samples collected in March, the relative abundance of sul2, blaSHV, and ampC resistance genes was significantly different (p < 0.05), and that at points P2, P3, and P4 was significantly higher than that at P1. The relative abundance of type I integron intI at different sampling points was also significantly different (p < 0.05), and its relative abundance at point P4 was obviously higher than that at point P1. All of the analysis results are listed in Table 1.

2.4. Correlation Analysis of ARGs with Integron intI and Transposon tnpA-IS4

The distribution and diffusion of resistance genes in the environment are usually affected by antibiotic selection pressure. The same selection pressure may simultaneously induce multiple resistance genes. Therefore, analysis of the correlation between ARGs can help understand their synergistic relationship. The diffusion of ARGs in the environment is mainly through horizontal transfer, in which mobile genetic elements (MGEs) play a very important role [35]. The Pearson correlation analysis of the data showed that there was significant correlation between ARGs and the mobile genetic elements of intI and tnpA-IS4 (see Table 2). For water samples collected in October, there was significant correlation between tetC, tetO, sul1 resistance genes and integron intI. The correlation between ermB, blaOXA-10, and ampC resistance genes and transposon tnpA-IS4 was significant.
For water samples collected in December, tetO, ermB, and blaOXA-10 resistance genes were significantly correlated with integron intI. Sul1, ermB, blaOXA-10 resistance genes were significantly correlated with transposon tnpA-IS4.
For water samples collected in March, there was significant correlation between sul1 and ermB resistance genes and the integron intI, as well as between sul1, ampC, and transposon tnpA-IS4.

2.5. Soil Moisture Content

In this experiment, the water content in soil samples collected at two sampling points A and B was determined. The results showed that in three out of five samples, the soil moisture content at point B was higher than that at point A. Soil moisture content data were listed in Table 3.

3. Discussion

The detection of antibiotic resistance gene in the Min-xin river water and soil near a veterinary antibiotics production site showed that sulfonamides antibiotic resistance gene sul1 had the highest detection rate, indicating that this gene may be the dominant gene in this area. This is likely due to that sulfa antibiotics are more commonly used in this area, or it is possible that there is long-term exposure of sulfa drug residues. Similarly, Gao et al. [36] have shown that the prevalence, concentration, and detection rate of sulfa drug resistance genes in aquaculture environments were also the highest, and the most likely reason is that sulfa drugs are more commonly used. The results also showed that most ARGs detected in water samples collected from four points showed an increasing trend from P1 to P4. The detection rate of ARGs at point P1 was generally low, indicating that the pollution situation in this point is relatively low. In the water samples downstream of the sewage outlet, the detection rate was the highest, which is a proof that the sewage outlet, to a certain degree, is the source of pollution detected in the downstream river. Although the detection rate of ARGs in soil samples at point A and B was not high, it could still be seen that the detection rate of ARGs at point B was higher than that at point A. This is consistent with a study previously reported by Jahnavi et al. [37], which describes that the increase of detection rate of ARGs in river sediments, as compared with that in uncontaminated sediments, is influenced by the discharges.
The results from absolute abundance analysis results showed that most resistance genes detected at different sampling points were different, and the different months in which the samples were collected also had an impact on their abundance and changes of ARGs. The absolute abundance of ARGs at point P4 located downstream of the sewage outlet was higher than that at points P2 and P1 located at the upstream. This indicates that the sewage discharged from the sewage outlet has a certain promoting effect on the accumulation of ARGs in water in the river. Similar to this finding, a study by Kristiansson et al. [38] has demonstrated that a large amount of antibiotics that is discharged into the rivers can help in the enrichment of ARGs and intl, thereby can promote their spread. The diversity and composition of microbial communities in the environmental media can also be affected by temperature and change of seasons [39].
According to literatures, temperature is the main reason for the difference between results observed at different times. The temperature also changes with the change of seasons. Accordingly, the types and quantities of microorganisms in the water and soil change, and this can affect the horizontal transfer of ARGs [40]. Zheng et al. [41] have showed that the absolute abundance of ARGs in rivers around the city is highest in summer, and the change trend of the abundance is correlated with the local temperature.
A heat map of the relative abundance of resistance genes detected for all samples was prepared (Figure 4). As can be seen, the relative abundance of ARGs detected at different times was different. The results in all the three different months showed that sulfa sul1 and β-lactam blaSHV were the main resistance genes. The relative abundance of tetracycline tetC was the lowest, and ermA was not detected the most times. The trend of relative abundance of ARGs in water samples was similar, and in most samples, the relative abundance at point P4 was significantly higher than that at point P1. That is, the relative abundance of ARGs downstream of the sewage outlet was higher than that of the non-polluted upstream area. This shows that the sewage discharged from the sewage outlet has an impact on the relative abundance of ARGs in the river, causing the relative abundance of integrons and transposons to increase correspondingly.
In this study, the detection rate of transposons in water and soil samples was relatively high, and a variety of ARGs showed significant correlation with integrons and transposons. Su et al. [42] have described that bacteria can share genetic information through the horizontal transfer of MGEs in the environment, and demonstrated that there is a transfer of ARGs between soil and rivers. Sewage discharge could significantly increase the transfer frequency of ARGs to Escherichia coli receptors. Chen et al. [43] have also reported significant correlation between sul1, sul2, and int1. Li et al. [44] and Yang et al. [45] have shown that there is significant correlation between tetC and int1. Zheng et al. [41] have shown that MGEs are the key factors driving the change of ARGs in rivers around cities. This indicates that the possibility for the horizontal transfer of ARGs is high, and mobile genetic elements intI and tnpA-IS4 may promote the spread of antibiotic resistance genes.
Our previous studies [46,47] have shown that sulfonamides and β-lactams antibiotic residues were not detected in Min-xin river water and soil along the river [48]. This is likely due to that antibiotic drugs can be degraded in the environment. With the influence of temperature and pH of the environmental media, natural photosensitizers, etc., antibiotic drugs are prone to hydrolysis or photolysis [49]. One probable reason why antibiotic residues were not detected in the environmental media is that they had been degraded under the influence of environmental factors in the sampling sites. In addition, there is an influence from antibiotic selection pressure.

4. Materials and Methods

4.1. Reagents and Instrumentation

Reagents used in this study included genomic DNA extraction kit (Omega Bio-Tek, Norcross, CA, USA), SYBR green fluorescent dye (Quanshijin Technology Co., Ltd. Beijing, China) and primers, and plasmids (Shenggong Bioengineering Co., Ltd. Shanghai, China). Instrument used in the study included an electronic balance (Precision Scientific Instrument Co., Ltd. Shanghai, China), a Heal Force ultrapure water system (Likang Biomedical Technology Holding Group, Hong Kong, China), and a real-time fluorescent quantitative PCR machine (Bio-Rad CFX96, Hercules, CA, USA).

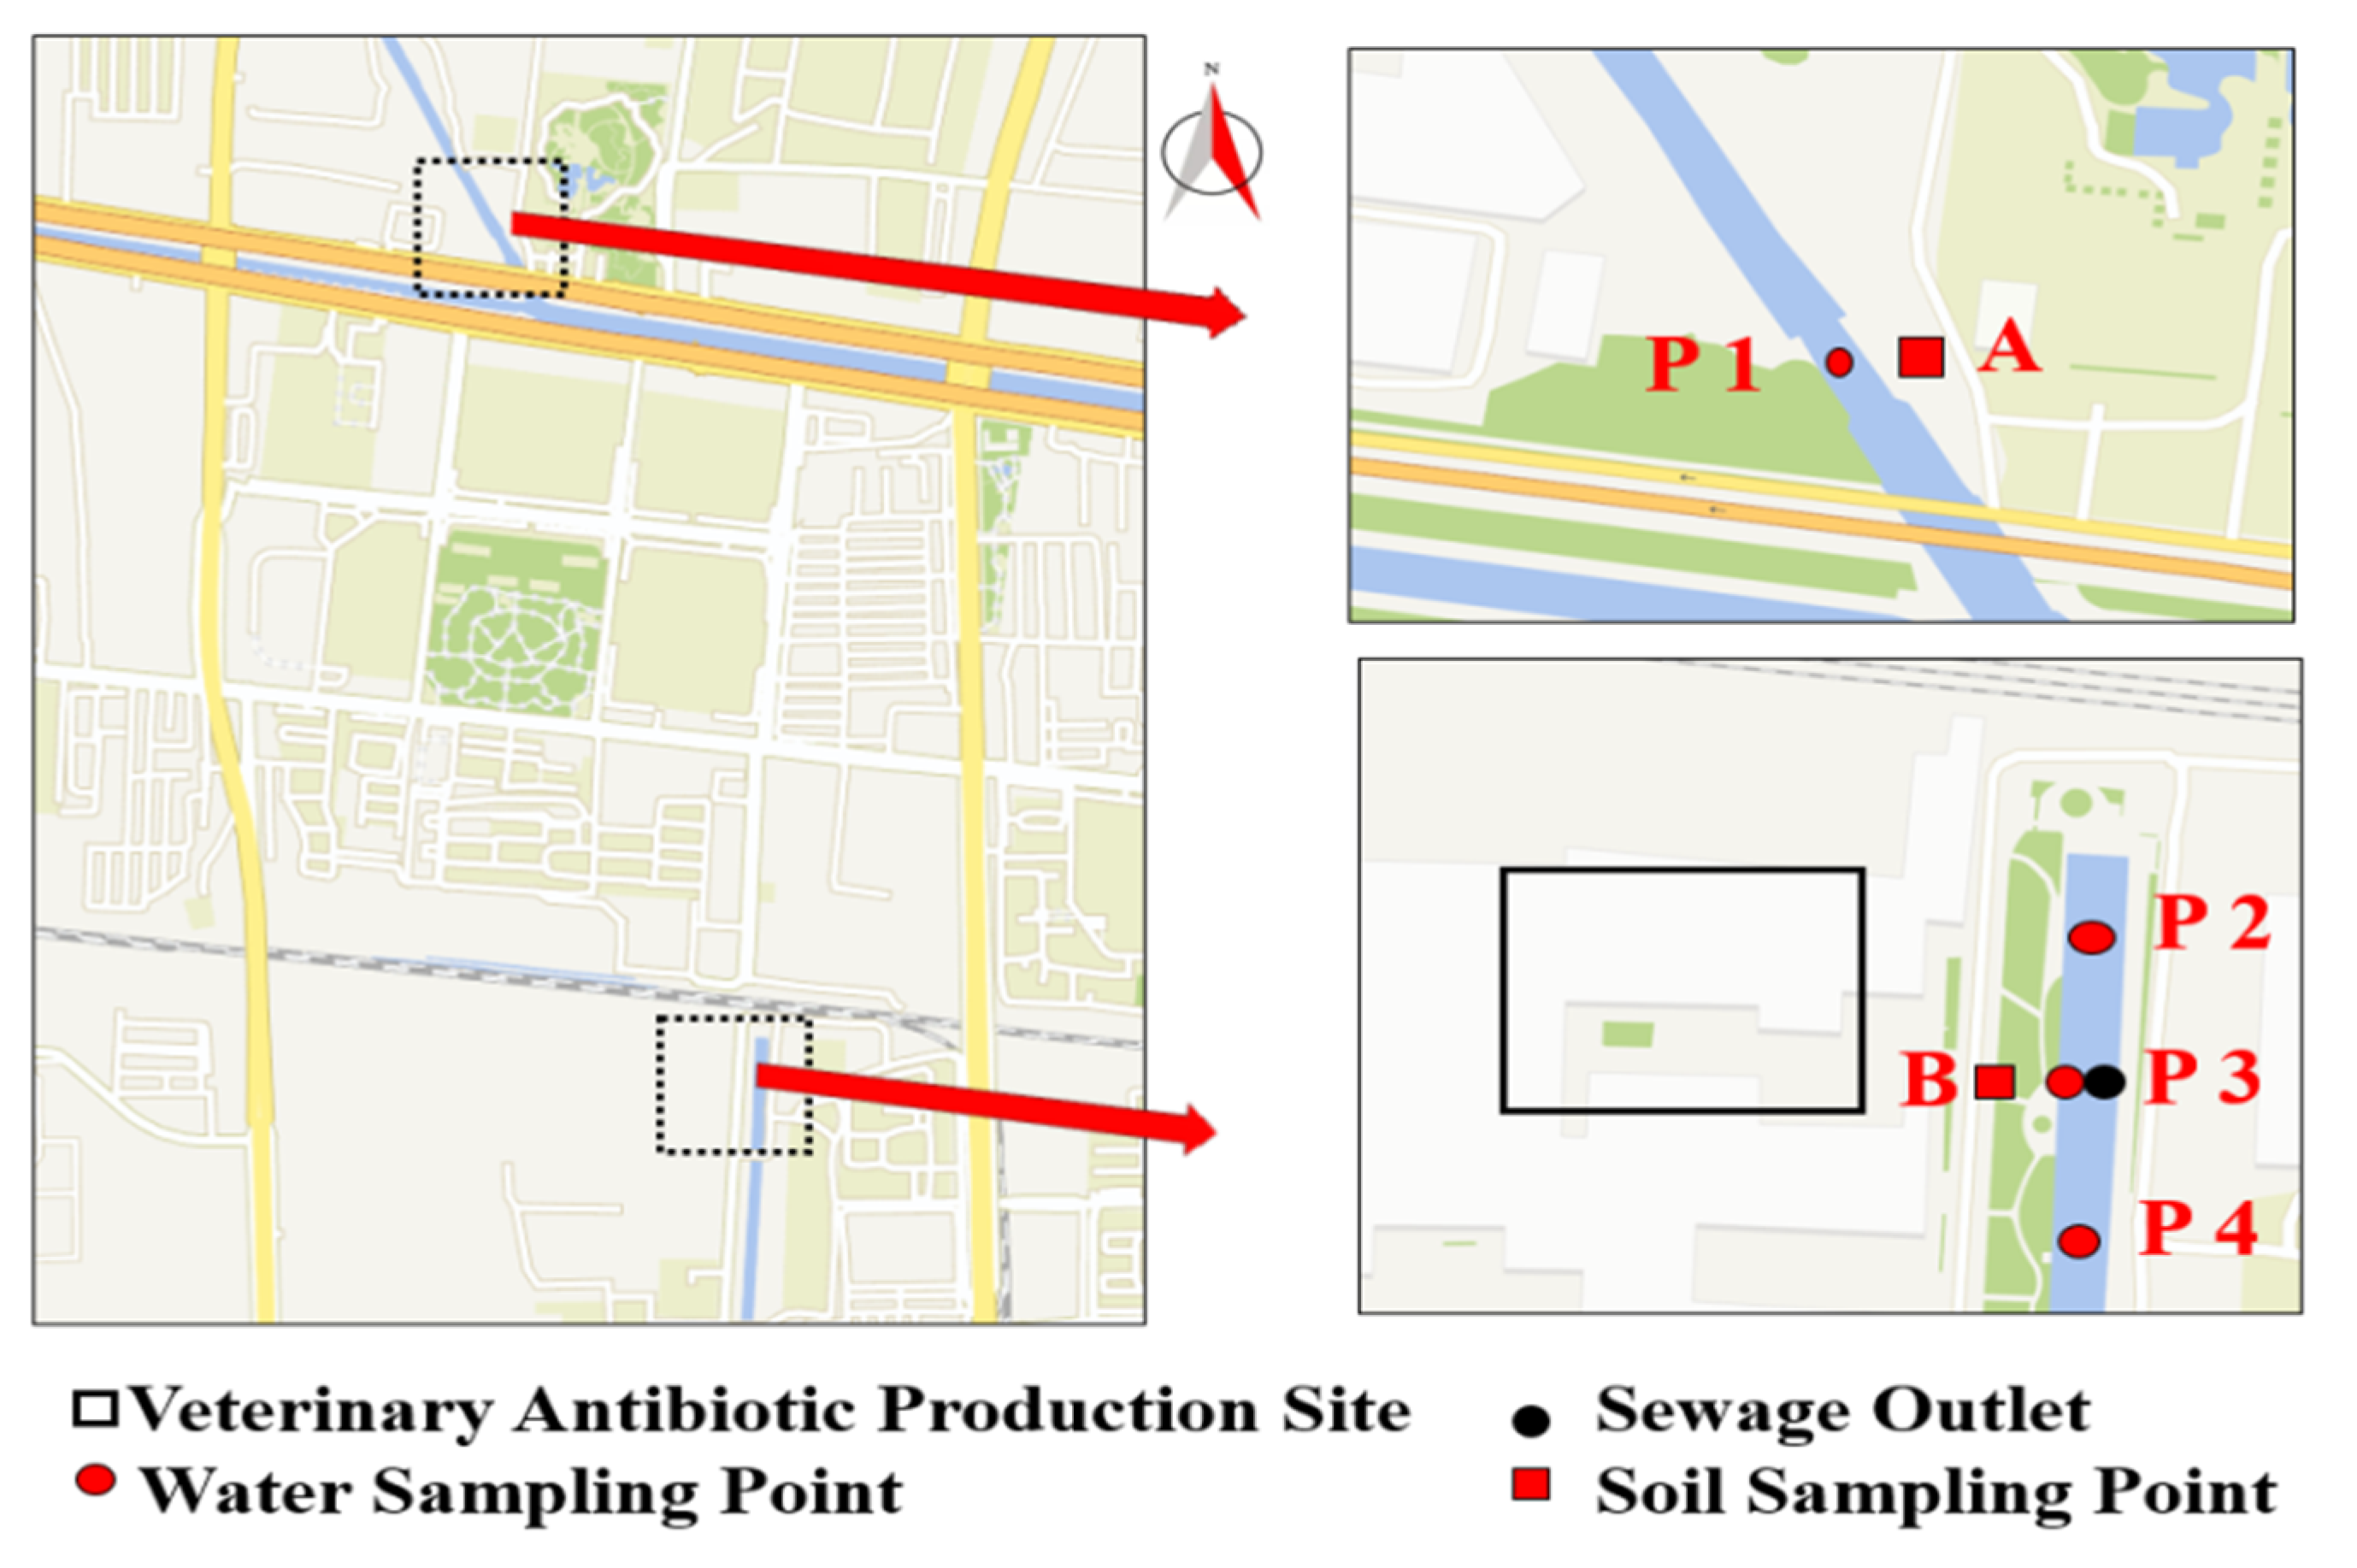
4.2. Sample Collection and Processing

River water and soil samples were sampled according to HJ/T 91-2002 and GB/T 36179-2018 of China National Standard, respectively. The sewage from the veterinary drug production factory was discharged to Min-xin River (Shijiazhuang, China). Water samples at the upstream and downstream of the sewage port were collected in October, December, and March of 2019, respectively. Soil samples were collected at various sampling points along the river at the same points where water samples were collected. Two soil sampling points (point A, point B) were set up to observe the impact of the wastewater generated by the veterinary antibiotics factory on the surrounding environment. Point B is located near the drug production site, and point A is located at the control point. Water samples were collected from four sampling points. As shown in Figure 5, point P1 is located at the upstream of the river, whereas point P2 is located at the midstream of the river, near the effluents of the pharmaceutical company. In addition, point P3 was the wastewater outlet of the pharmaceutical factory, while point P4 was at the downstream.
Water sample from each sampling point was continuously collected for 5 days at different times, and a total of 1 L of water (at 0.5 m below the water surface) was collected in light-tight glass bottles. Using stainless steel sampling shovel, soil samples (at 10 cm below the soil surface) were collected and placed in a sterile collection bags. Water and soil samples after collection were all stored in a car refrigerator and then transported back by driving to the laboratory within two hours. Water sample was filtered through 0.22-μm polyethersulfone (PES) filters. The filter membrane was placed in a 50-mL centrifuge tube, and then stored at −20 °C. Soil samples were stored at −20 °C before processing. After measuring its moisture content, the collected soil was weighed to about 50 g and then transferred into a 50-mL centrifuge tube. The centrifuge tube was placed in a vacuum drying oven, in which the sample was dried to a constant weight.

4.3. Selection of 11 Resistance Genes

Eleven genes including tetC, tetO, sul1, sul2, sul3, ermA, ermB, blaOXA-10, blaSHV, blaCTX-M, ampC, class 1 integrons intI and one transposon tnpA-IS4 were finally selected for detection in this work. First, we investigated the annual output and types of antibiotics produced by antibiotic manufacturers in this region, and then the possible pollution of antibiotic resistance genes in the environmental media in this area was analyzed. Then pre experiments were carried out to detect macrolides ErmA/B/C, quinolones qnra, aminoglycosides (aacC2, aadD), quinolones (flor, oqxA), glycopeptides (vancomycin) vanA, tetracyclines (tetC, tetO), sulfonamides (Sul1,Sul2, Sul3), β- Lactams (blaOXA-10, blaSHV, blaCTX-M, ampC), efflux pump qacE Δ 1, Integron int1 and transposon (tnpA-IS4, tnpA-IS6) and other antibiotic resistance genes. Considering the content and detection rate in the sample, we selected the above 11 antibiotic resistance genes with higher concentration for detection and analysis in this experiment.

4.4. Antibiotic Residue Analysis

Residues of sulfa antibiotic (sulfathiazole, sulfadiazine, sulfamethazine, sulfadimethoxine, sulfamethoxazole, and sulfisoxazole) in Min-xin river water were determined by field-amplified sample injection–CZE (FASI–CZE) coupled with a diode array detector, as previously reported [46]. The conditions for capillary electrophoresis analysis were as follows: the background electrolyte solution consisted of 70.0 mmol·L−1 borax and 60.0 mmol·L−1 boric acid (including 10% methanol, pH 9.1); the plug was 2.5 mmol·L−1 borax, which was injected into the capillary at a pressure of 0.5 psi for 5 s; then the sample was injected into the capillary at an injection voltage of −10 kV for 20 s; the electrophoretic separation was carried out under a voltage of +19 kV. The capillary temperature was maintained at 20 °C throughout the analysis, and six sulfonamides were completely separated within 35 min.
β-lactams residues (oxacillin, cloxacillin, dicloxacillin, and flucloxacillin) were extracted using polypyrrole-coated magnetic nanoparticles and subsequently analyzed by micellar electrokinetic capillary chromatography coupled with magnetic solid-phase extraction, as previously described [47]. In this experiment, Fe3O4 nanoparticles were prepared by chemical coprecipitation method. Polypyrrole was synthesized by polymerization of pyrrole monomer under the oxidation of ferric chloride and modified on Fe3O4 nanoparticles to obtain PPy/Fe3O4 nanoparticles. Then PPy/Fe3O4 was used for the extraction of sulfa antibiotic residues in water sample.
Residues of 13 antibiotics from four categories of six sulphonamides, five β-lactams, one glycopeptides and chloramphenicol in soil along Min-xin river were determined by high performance capillary electrophoresis (HPCE) coupled with solid phase extraction (SPE) [48]. The data of these antibiotic residues were used as reference.

4.5. DNA Extraction

The frozen filter membrane was carefully removed from the centrifuge tube and then subjected to DNA extraction by an E.Z.N.A.TM Water DNA Kit. The extracted DNA was placed in a 1.5 mL EP tube and stored at −20 °C. After mixing, the soil sample (1.0 g) was placed in a 15-mL centrifuge tube, subjected to DNA extraction using an E.Z.N.A.TM soil DNA Kit, and then frozen stored in a 1.5-mL EP tube.

4.6. Fluorescence Quantitative PCR

In this experiment, tetracycline resistance genes tetC and tetO, sulfonamide resistance genes sul1, sul2, and sul3, macrolide resistance genes ermA and ermB, β-lactams resistance genes (blaOXA-10, blaSHV, blaCTX-M, ampC), class 1 integron-integrase gene intI1, transposon tnpA-IS4, and 16S rRNA internal reference gene were selected. Class 1 integrons are found widely in different environments and are the most studied integrons. The primers used for amplification and lengths of the targeted genes are listed in Table 4.
PCR assay was performed on a CFX96 real-time (RT) PCR detection system. In the fluorescence quantitative PCR detection, SYBR green dye was adopted. The total reaction volume was 25 μL. The reaction consisted of 12.5 μL of 2 × SYBR mix, 2 μL of upstream primer (10 μM), 2 μL of downstream primer (10 μM), 2 μL of template DNA, and 8.5 μL of ddH2O. The program is set as follows: pre-denaturation at 94 °C for 3 min, denaturation at 94 °C for 5 s, annealing at 57 °C for 15 s, and extension at 72 °C for 30 s, each for a total of 40 cycles. The concentration of the constructed plasmid containing the target gene fragment was serially diluted 10-fold. Then, the working curve of the sample was prepared using the Ct value measured by q-PCR. The temperature range of the melting curve was from 72 °C to 95 °C. The fluorescence signal was collected at each 0.5 °C increment and used for drawing the melting curve.
The sample and a known concentration of plasmid standard containing the same gene were simultaneously detected by qPCR, and the corresponding Ct value was obtained respectively. Then a gradient dilution of the plasmid concentration was performed to obtain a standard curve for quantification. Different resistance genes have different plasmid standards. Each ARG corresponds to a plasmid standard curve containing the same gene. After qPCR detection, the Ct value of ARG and plasmid standard series with known concentration was obtained, so as to quantify ARG.
Only the Ct value is obtained in the qPCR results. Through the standard curve of Ct value of the corresponding known plasmid concentration, the concentration multiple of the kit, the filtration volume of river water and the dry weight of soil, the absolute concentrations of various ARGs are finally obtained. Unit of absolute abundance is copies/g (dry mass of soil) or copies L (water sample), respectively.

4.7. Data Processing

Bio-Rad CFX Manager 3.1 software and EXCEL 2013 were used for data processing. One-way analysis of variance was used to analyze the differences between ARGs in water samples from different locations. Paired t-test was conducted to analyze the difference of ARGs in soil samples from two locations. Heatmap was utilized to visually compare the relative abundance of ARGs in different environmental samples. Pearson correlation was employed to analyze the correlation between ARGs and integrons and transposons.

5. Conclusions

In summary, real-time fluorescent quantitative PCR technique was used to detect antibiotic resistance genes in an urban river and soil near a veterinary antibiotic factory in Shijiazhuang, China. The results provided evidence that the relative abundance of ARGs in water and soil near the wastewater discharge outlet of the pharmaceutical factory was significantly higher compared to that in non-polluted areas, which is a proof that the sewage outlet discharged wastewater by an antibiotic manufacturing company, to a certain degree, is the source of pollution detected in the local environment. The most abundant ARGs detected in the study area environment were sulfa sul1 and β-lactam blaSHV. Months of the year were also found to influence the variety of ARGs. Specifically, significant correlation between antibiotic resistance genes and mobile genetic elements was observed, and this was the likely factor that promoted the horizontal transfer of ARGs, allowing them to further spread. The possible resistance gene pollution to the local environment and the impact on microbial community and biodiversity caused by antibiotic production and their wastewater and waste gas emission in this region need to be further studied.

Author Contributions

Methodology, J.M. and Z.Y.; validation, Y.Y. and Y.L.; formal analysis, X.X.; writing—original draft preparation, J.M.; writing—review and editing, H.S. All authors have read and agreed to the published version of the manuscript.

Funding

The financial support provided by the National Natural Science Foundation of China (No. 81773481) and the Key Research and Development Project of Hebei Province (Nos. 21377727D, 19977719D).

Institutional Review Board Statement

Not applicable.

Informed Consent Statement

Not applicable.

Data Availability Statement

Not applicable.

Conflicts of Interest

The authors declare no conflict of interest.

References

  1. Lu, L.; Wu, J.; Zhang, C.; Zhang, Y.; Lin, Y.; Luo, Y. Occurrence, distribution, and ecological-health risks of selected antibiotics in coastal waters along the coastline of China. Sci. Total Environ. 2018, 644, 1469–1476. [Google Scholar] [CrossRef] [PubMed]
  2. Luo, Y.; Mao, D.Q.; Michal, R.; Rysz, M.; Zhou, Q.; Zhang, H.; Xu, L.; Alvarez, P.J.J. Trends in Antibiotic Resistance Genes Occurrence in the Haihe River, China. Environ. Sci. Technol. 2010, 19, 7220–7225. [Google Scholar] [CrossRef] [PubMed]
  3. Luo, Y.; Zhou, Q.X. Antibiotic resistance genes (ARGs) as emerging pollutants. Acta Sci. Circumstantiae 2008, 28, 1499–1505. [Google Scholar]
  4. Martinez, J.L. Environmental pollution by antibiotics and by antibiotic resistance determinants. Environ. Pollut. 2009, 157, 2893–2902. [Google Scholar] [CrossRef] [PubMed]
  5. Pruden, A. Balancing water sustainability and public health goals in the face of growing concerns about antibiotic resistance. Environ. Sci. Technol. 2014, 48, 5–14. [Google Scholar] [CrossRef] [PubMed]
  6. Cassini, A.; Högberg, L.D.; Plachouras, D.; Quattrocchi, A.; Hoxha, A.; Simonsen, G.S.; Colomb-Cotinat, M.; Kretzschmar, M.E.; Devleesschauwer, B.; Cecchini, M.; et al. Attributable deaths and disability-adjusted life-years caused by infections with antibiotic-resistant bacteria in the EU and the European Economic Area in 2015: A population-level modelling analysis. Lancet Infect. Dis. 2019, 19, 56–66. [Google Scholar] [CrossRef] [Green Version]
  7. Lu, X.; Hu, Y.F.; Luo, M.; Zhou, H.J.; Wang, X.X.; Du, Y.; Li, Z.P.; Xu, J.L.; Zhu, B.L.; Xu, X.B.; et al. MCR-1.6, a New MCR Variant Carried by an IncP Plasmid in a Colistin-Resistant Salmonella enterica Serovar Typhimurium Isolate from a Healthy Individual. Antimicrob. Agents Chemother. 2017, 61, e02632-16. [Google Scholar] [CrossRef] [PubMed] [Green Version]
  8. Ruppé, E.; Ghozlane, A.; Ehrlich, S.D. Prediction of the intestinal resistome by a three-dimensional structure-based method. Nat. Microbiol. 2019, 4, 112–123. [Google Scholar] [CrossRef] [PubMed]
  9. Pruden, A.; Pei, R.; Storteboom, H.; Carlson, K.H. Antibiotic resistance genes as emerging contaminants: Studies in northern Colorado. Environ. Sci. Technol. 2006, 40, 7445–7450. [Google Scholar] [CrossRef] [PubMed]
  10. Dang, B.J.; Mao, D.Q.; Xu, Y.; Luo, Y. Conjugative multi-resistant plasmids in Haihe River and their impacts on the abundance and spatial distribution of antibiotic resistance genes. Water Res. 2017, 111, 81–91. [Google Scholar] [CrossRef]
  11. Mendes, R.E.; Deshpande, L.; Rodriguez-Noriega, E.; Ross, J.E.; Jones, R.N.; Morfin-Otero, R. First report of Staphylococcal clinical isolates in Mexico with linezolid resistance caused by cfr: Evidence of in vivo cfr mobilization. J. Clin. Microbiol. 2010, 48, 3041–3043. [Google Scholar] [CrossRef] [Green Version]
  12. Nõlvak, H.; Truu, M.; Tiirik, K.; Oopkaup, K.; Sildvee, T.; Kaasik, A.; Mander, Ü.; Truu, J. Dynamics of antibiotic resistance genes and their relationships with system treatment efficiency in a horizontal subsurface flow constructed wetland. Sci. Total Environ. 2013, 461–462, 636–644. [Google Scholar] [CrossRef]
  13. LaPara, T.M.; Burch, T.R.; McNamara, P.J.; Tan, D.T.; Yan, M.; Eichmille, J.J. Tertiary-Treated Municipal Wastewater is a Significant Point Source of Antibiotic Resistance Genes into Duluth-Superior Harbor. Environ. Sci. Technol. 2011, 45, 9543–9549. [Google Scholar] [CrossRef] [Green Version]
  14. Czekalski1, N.; Berthold, T.; Caucci, S.; Egli, A.; Bürgmann, H. Increased levels of multiresistant bacteria and resistance genes after wastewater treatment and their dissemination into Lake Geneva, Switzerland. Front. Microbiol. 2012, 3, 106. [Google Scholar] [CrossRef] [Green Version]
  15. Fiorentino, A.; Cesare, A.D.; Eckert, E.M.; Rizzo, L.; Fontaneto, D.; Yang, Y.; Corno, G. Impact of industrial wastewater on the dynamics of antibiotic resistance genes in a full-scale urban wastewater treatment plant. Sci. Total Environ. 2019, 646, 1204–1210. [Google Scholar] [CrossRef]
  16. Zhang, W.H.; Suyamud, B.; Lohwacharin, J.; Yang, Y.Y. Large-scale pattern of resistance genes and bacterial community in the tap water along the middle and low reaches of the Yangtze River. Ecotoxicol. Environ. Saf. 2021, 208, 111517. [Google Scholar] [CrossRef] [PubMed]
  17. Kim, S.; Yun, Z.; Ha, U.H.; Lee, S.; Park, H.; Kwon, E.E.; Cho, Y.; Choung, S.; Oh, J.; Medriano, C.A.; et al. Transfer of antibiotic resistance plasmids in pure and activated sludge cultures in the presence of environmentally representative micro-contaminant concentrations. Sci. Total Environ. 2014, 468–469, 813–820. [Google Scholar] [CrossRef] [PubMed]
  18. Zhang, Q.Q.; Yin, G.G.; Pan, C.G.; Liu, Y.S.; Zhao, J.L. Comprehensive Evaluation of Antibiotics Emission and Fate in the River Basins of China: Source Analysis, Multimedia Modeling, and Linkage to Bacterial Resistance. Environ. Sci. Technol. 2015, 49, 6772–6782. [Google Scholar] [CrossRef] [PubMed]
  19. Zhu, D.; Chen, Q.L.; Ding, J.; Wang, Y.F.; Cui, H.L.; Zhu, Y.G. Resistance genes in soil ecosystems and planetary health: Progress and prospects. Sci. China Life Sci. 2019, 49, 1652–1663. [Google Scholar] [CrossRef]
  20. Zammit, I.; Marano, R.B.M.; Vaiano, V.; Cytryn, E.; Rizzo, L. Changes in Antibiotic Resistance Gene Levels in Soil after Irrigation with Treated Wastewater: A Comparison between Heterogeneous Photocatalysis and Chlorination. Environ. Sci. Technol. 2020, 54, 7677–7686. [Google Scholar] [CrossRef]
  21. Knapp, C.W.; Dolfing, J.; Ehlert, P.A.; Graham, D.W. Evidence of Increasing Antibiotic Resistance Gene Abundances in Archived Soils since 1940. Environ. Sci. Technol. 2010, 44, 580–587. [Google Scholar] [CrossRef]
  22. Zhu, D.; Xiang, Q.; Yang, X.R.; Ke, X.; O’Connor, P.; Zhu, Y.G. Trophic Transfer of Antibiotic Resistance Genes in a Soil Detritus Food Chain. Environ. Sci. Technol. 2019, 53, 7770–7781. [Google Scholar] [CrossRef]
  23. Xu, H.; Chen, Z.Y.; Huang, R.Y.; Cui, Y.X.; Li, Q.; Zhao, Y.H.; Wang, X.L.; Mao, D.Q.; Luo, Y.; Ren, H.Q. Antibiotic Resistance Gene-Carrying Plasmid Spreads into the Plant Endophytic Bacteria using Soil Bacteria as Carriers. Environ. Sci. Technol. 2021, 55, 10462–10470. [Google Scholar] [CrossRef] [PubMed]
  24. Ying, G.G.; He, L.Y.; Ying, A.J.; Zhang, Q.Q.; Liu, Y.S.; Zhao, J.L. China Must Reduce Its Antibiotic Use. Environ. Sci. Technol. 2017, 51, 1072–1073. [Google Scholar] [CrossRef] [PubMed] [Green Version]
  25. Joakim Larsson, D.G. Antibiotics in the environment. Upsala J. Med. Sci. 2014, 119, 108–112. [Google Scholar] [CrossRef]
  26. Liu, X.H.; Zhang, G.D.; Liu, Y.; Lu, S.Y.; Qin, P.; Guo, X.C.; Bi, B.; Wang, L.; Xi, B.D.; Wu, F.C.; et al. Occurrence and fate of antibiotics and antibiotic resistance genes in typical urban water of Beijing, China. Environ. Pollut. 2019, 246, 163–173. [Google Scholar] [CrossRef] [PubMed]
  27. Chen, H.Y.; Bai, X.M.; Li, Y.Z.; Jing, L.J.; Chen, R.H.; Teng, Y.G. Characterization and source-tracking of antibiotic resistomes in the sediments of a peri-urban river. Sci. Total Environ. 2019, 679, 88–96. [Google Scholar] [CrossRef]
  28. Szekeres, E.; Chiriac, C.M.; Baricz, A.; Szőke-Nagy, T.; Lung, I.; Soran, M.L.; Rudi, K.; Dragos, N.; Coman, C. Investigating antibiotics, antibiotic resistance genes, and microbial contaminants in groundwater in relation to the proximity of urban areas. Environ. Pollut. 2018, 236, 734–744. [Google Scholar] [CrossRef]
  29. Xie, J.W.; Jin, L.; He, T.T.; Chen, B.W.; Luo, X.S.; Feng, B.H.; Huang, W.; Li, J.; Fu, P.Q.; Li, X.D. Bacteria and antibiotic resistance genes (ARGs) in PM2.5 from China: Implications for human exposure. Environ. Sci. Technol. 2019, 53, 963–972. [Google Scholar] [CrossRef]
  30. Gaviria-Figueroa, A.; Preisner, E.C.; Hoque, S.; Feigley, C.E.; Norman, R.S. Emission and dispersal of antibiotic resistance genes through bioaerosols generated during the treatment of municipal sewage. Sci. Total Environ. 2019, 686, 402–412. [Google Scholar] [CrossRef]
  31. Zhou, R.J.; Zeng, S.Z.; Hou, D.W.; Liu, J.; Weng, S.P.; He, J.G.; Huang, Z.J. Occurrence of human pathogenic bacteria carrying antibiotic resistance genes revealed by metagenomic approach: A case study from an aquatic environment. J. Environ. Sci. 2019, 80, 248–256. [Google Scholar] [CrossRef]
  32. Chen, Y.H.; Li, P.; Huang, Y.S.; Yu, K.F.; Chen, H.J.; Cui, K.P.; Huang, Q.L.; Zhang, J.Y.; Gin, K.Y.H.; He, Y.L. Environmental media exert a bottleneck in driving the dynamics of antibiotic resistance genes in modern aquatic environment. Water Res. 2019, 162, 127–138. [Google Scholar] [CrossRef] [PubMed]
  33. Zhu, L.J.; Zhao, Y.; Yang, K.J.; Chen, J.; Zhou, H.X.; Chen, X.M.; Liu, Q.; Wei, Z.M. Host bacterial community of MGEs determines the risk of horizontal gene transfer during composting of different animal manures. Environ. Pollut. 2019, 250, 166–174. [Google Scholar] [CrossRef] [PubMed]
  34. González-Plaza, J.J.; Blau, K.; Milaković, M.; Jurina, T.; Smalla, K.; Udiković-Kolić, N. Antibiotic-manufacturing sites are hot-spots for the release and spread of antibiotic resistance genes and mobile genetic elements in receiving aquatic environments. Environ. Int. 2019, 130, 104735. [Google Scholar] [CrossRef]
  35. Hegstad, K.; Mikalsen, T.; Coque, T.M.; Werner, G.; Sundsfjord, A. Mobile genetic elements and their contribution to the emergence of antimicrobial resistant Enterococcus faecalis and Enterococcus faecium. Clin. Microbiol. Infect. 2010, 16, 468–469. [Google Scholar] [CrossRef] [PubMed]
  36. Gao, P.; Mao, D.; Luo, Y.; Wang, L.; Xu, B.; Xu, L. Occurrence of sulfonamide and tetracycline-resistant bacteria and resistance genes in aquaculture environment. Water Res. 2012, 46, 2355–2364. [Google Scholar] [CrossRef]
  37. Jahnavi, K.; Pooja, S.; Prabhat, K.M. Presence of fluoroquinolone resistance with persistent occurrence of gyrA gene mutations in a municipal wastewater treatment plant in india. Chemosphere 2018, 211, 817–825. [Google Scholar]
  38. Kristiansson, E.; Fick, J.; Janzon, A.; Grabic, R.; Rutgersson, C.; Weijdegård, B.; Söderström, H.; Larsson, D.J. Pyrosequencing of antibiotic-contaminated river sediments reveals high levels of resistance and gene transfer elements. PLoS ONE 2011, 6, e17038. [Google Scholar] [CrossRef]
  39. Jérôme, C.; Mercè, B.; Ina, S.; Jürg, B.L.; Eva, S.L. Contribution of different bacterial dispersal sources to lakes: Population and community effects in different seasons. Environ. Microbiol. 2017, 19, 2391–2404. [Google Scholar]
  40. Son, D.I.; Aleta, P.; Park, M.; Yoon, H.; Cho, K.H.; Kim, Y.M.; Kim, S. Seasonal Changes in Antibiotic Resistance Genes in Rivers and Reservoirs in South Korea. J. Environ. Qual. 2018, 47, 1079–1085. [Google Scholar] [CrossRef] [PubMed] [Green Version]
  41. Zheng, J.; Zhou, Z.; Wei, Y.; Chen, T.; Feng, W.; Chen, H. High-throughput profiling of seasonal variations of antibiotic resistance gene transport in a peri-urban river. Environ. Int. 2018, 114, 87–94. [Google Scholar] [CrossRef]
  42. Su, J.Q.; Wei, B.; Xu, C.Y.; Qiao, M.; Zhu, Y.G. Functional metagenomic characterization of antibiotic resistance genes in agricultural soils from China. Environ. Int. 2014, 65, 9–15. [Google Scholar] [CrossRef]
  43. Chen, J.; Su, Z.; Dai, T.; Huang, B.; Mu, Q.; Zhang, Y.; Wen, D. Occurrence and distribution of antibiotic resistance genes in the sediments of the East China Sea bays. J. Environ. Sci. 2019, 81, 156–167. [Google Scholar] [CrossRef] [PubMed]
  44. Li, L.; Dechesne, A.; He, Z.; Madsen, J.S.; Nesme, J.; Sørensen, S.J.; Smets, B.F. Estimating the transfer range of plasmids encoding antimicrobial resistance in a wastewater treatment plant microbial community. Environ. Sci. Tech. Let. 2018, 5, 260–265. [Google Scholar] [CrossRef] [Green Version]
  45. Yang, Y.; Liu, W.; Xu, C.; Wei, B.; Wang, J. Antibiotic resistance genes in lakes from middle and lower reaches of the Yangtze River, China: Effect of land use and sediment characteristics. Chemosphere 2017, 178, 19–25. [Google Scholar] [CrossRef] [PubMed]
  46. Li, X.H.; Yang, Y.Q.; Miao, J.J.; Yin, Z.D.; Zhai, Y.J.; Shi, H.M.; Li, Z.N. Determination of sulfa antibiotic residues in river and particulate matter by field-amplified sample injection-capillary zone electrophoresis. Electrophoresis 2020, 41, 1584–1591. [Google Scholar] [CrossRef] [PubMed]
  47. Li, X.H.; Yin, Z.D.; Zhai, Y.J.; Kang, W.J.; Shi, H.M.; Li, Z.N. Magnetic solid-phase extraction of four β-lactams using polypyrrole-coated magnetic nanoparticles from water samples by micellar electrokinetic capillary chromatography analysis. J. Chromatogr. A 2020, 1610, 460541. [Google Scholar] [CrossRef]
  48. Li, X.H.; Miao, J.J.; Kang, K.; Wang, W.; Shi, H.M. Simultaneous Detection of Thirteen Antibiotics in Solid and Water by solid phase extraction combined with High Performance Capillary Electrophoresis. Ptca Part B Chem. Anal. 2019, 55, 769–777. [Google Scholar]
  49. Baran, W.; Adamek, E.; Ziemiańska, J.; Sobczak, A. Effects of the presence of sulfonamides in the environment and their influence on human health. J. Hazard. Mater. 2011, 196, 1–15. [Google Scholar] [CrossRef]
  50. Zhang, Y.; Li, A.L.; Dai, T.J.; Li, F.F.; Xie, H.; Chen, L.J.; Wen, D.H. Cell-free DNA: A neglected source for antibiotic resistance genes spreading from WWTPs. Environ. Sci. Technol. 2018, 52, 248–257. [Google Scholar] [CrossRef] [PubMed]
  51. Mu, Q.H.; Li, J.; Sun, Y.X.; Mao, D.Q.; Wang, Q.; Luo, Y. Occurrence of sulfonamide-, tetracycline-, plasmid-mediated quinolone- and macrolide-resistance genes in livestock feedlots in Northern China. Environ. Sci. Pollut. Res. 2015, 22, 6932–6940. [Google Scholar] [CrossRef]
  52. Lin, H.; Chapman, S.J.; Freitag, T.E.; Kyle, C.; Ma, J.; Yang, Y.; Zhang, Z. Fate of tetracycline and sulfonamide resistance genes in a grassland soil amended with different organic fertilizers. Ecotox. Environ. Saf. 2019, 170, 39–46. [Google Scholar] [CrossRef]
  53. Pei, R.T.; Kim, S.C.; Carlson, K.H.; Pruden, A. Effect of River Landscape on the sediment concentrations of antibiotics and corresponding antibiotic resistance genes (ARG). Water Res. 2006, 40, 2427–2435. [Google Scholar] [CrossRef]
  54. Zhu, Y.G.; Johnson, T.A.; Su, J.Q.; Guo, G.X.; Stedtfeld, R.D.; Hashsham, S.A.; Tiedje, J.M. Diverse and abundant antibiotic resistance genes in Chinese swine farms. Proc. Natl. Acad. Sci. USA 2013, 9, 3435–3440. [Google Scholar] [CrossRef] [PubMed] [Green Version]
  55. Pu, C.; Yu, Y.; Diao, J.; Gong, X.; Li, J.; Sun, Y. Exploring the persistence and spreading of antibiotic resistance from manure to biocompost, soils and vegetables. Sci. Total. Environ. 2019, 688, 262–269. [Google Scholar] [CrossRef] [PubMed]
  56. Chen, J.; Yu, Z.T.; Michel, F.C.; Wittum, T.; Mark, M. Development and application of real-time PCR assays for quantification of erm genes conferring resistance to macrolides-lincosamides-streptogramin B in livestock manure and manure management systems. Appl. Environ. Microb. 2007, 73, 4407–4416. [Google Scholar] [CrossRef] [Green Version]
  57. Jiang, L.; Hu, X.; Xu, T.; Zhang, H.; Sheng, D.; Yin, D. Prevalence of antibiotic resistance genes and their relationship with antibiotics in the Huangpu River and the drinking water sources, Shanghai, China. Sci. Total Environ. 2013, 458, 267–272. [Google Scholar] [CrossRef] [PubMed]
  58. Tatusova, T.; DiCuccio, M.; Badretdin, A.; Chetvernin, V.; Nawrocki, E.P.; Zaslavsky, L.; Lomsadze, A.; Pruitt, K.D.; Borodovsky, M.; Ostell, J. NCBI prokaryotic genome annotation pipeline. Nucleic Acids Res. 2016, 44, 6614–6624. [Google Scholar] [CrossRef]
  59. Ma, L.; Li, B.; Jiang, X.T.; Wang, Y.L.; Xia, Y.; Li, A.T.; Zhang, T. Catalogue of antibiotic resistome and host-tracking in drinking water deciphered by a large scale survey. Microbiome 2017, 5, 154. [Google Scholar] [CrossRef] [Green Version]
Figure 1. Detection rate of resistance genes in samples collected in different months.
Antibiotics 10 01361 g001
Figure 2. Abundance of resistance genes in samples collected in October.
Antibiotics 10 01361 g002
Figure 3. Abundance of resistance genes in samples collected in December and March.
Antibiotics 10 01361 g003
Figure 4. Heatmap showing relative abundance of ARGs in all samples.
Antibiotics 10 01361 g004
Figure 5. Geographical map of water and soil sampling sites.
Antibiotics 10 01361 g005
Table 1. ANOVA analysis of ARGs at different sampling points at different times.
Relative AbundanceOctoberDecemberMarch
F *p *FpFp
RtetC0.2640.8501.9830.1630.3040.822
RtetO3.2700.0531.5330.2590.9780.404
Rsul12.8430.07134.3290.0001.9220.167
Rsul20.9540.4400.1250.9446.9190.004
Rsul30.7470.5481.7270.2152.9850.261
RermA----0.2040.843
RermB3.9200.0736.5950.0080.5080.683
RblaSHV2.8370.0733.0110.06626.1190.000
RblaCTX-M3.4830.058--37.2960.000
RblaOXA-100.7010.56525.3050.0001.4020.278
RampC3.8540.03013.5690.00014.9810.000
Rint10.3140.8153.5120.0494.7200.015
RtnpA IS40.5500.65626.0400.0002.6370.090
Notes *: F: F value of ANOVA; p: The correlation compared with 0.05.
Table 2. The value of Pearson correlation between ARGs and int1 and tnpA IS4 at different times.
Relative AbundanceOctoberDecemberMarch
Rint1RtnpA IS4Rint1RtnpA IS4Rint1RtnpA IS4
RtetC0.74 *0.37−0.56 *0.140.180.27
RtetO0.56 *−0.230.57 *0.470.350.22
Rsul10.59 *−0.33−0.210.95 *0.74 *0.68
Rsul20.010.210.060.14−0.37−0.12
Rsul30.020.230.32−0.3−0.010.26
RermA----−0.94−0.73
RermB0.350.710.59 *0.87 *0.56 *0.42
RampC−0.190.62 *0.47−0.84 *−0.450.59 *
RblaSHV−0.30.51 *−0.04−0.65 *−0.50 *−0.18
RblaCTX-M0.240.37--−0.50.62
RblaOXA-100.440.57 *0.6 0 *0.83 *0.440.25
Notes: * Correlation is significant at the 0.05 level (2-tailed).
Table 3. Soil moisture content (%).
SampleOctoberDecemberMarch
Point APoint BPoint APoint BPoint APoint B
13.33%-1.67%10.33%2.38%4.41%
23.38%4.65%4.00%13.91%1.67%5.00%
31.67%6.00%4.20%15.09%2.98%3.31%
42.00%5.33%14.92%14.69%1.33%11.33%
54.00%10.67%4.33%-1.99%1.99%
Table 4. PCR primers used for amplification of ARGs, class 1 integron, and transposon.
TypesARGsPrimer SequenceAmplicon Size (bp)Reference
TetracyclinestetCCATATCGCAATACATGCGAAAAA
AAAGCCGCGGTAAATAGCAA
78[50]
tetOACGGAGAGTTTATTGTATACC
TGGCGTATCTATAATGTTGAC
171[50]
SulfonamidesSul1CGCACCGGAAACATCGCTGCAC
TGAAGTTCCGCCGCAAGGCTCG
162[51]
Sul2TCCGGTGGAGGCCGGTATCTGG
CGGGAATGCCATCTGCCTTGAG
190[52]
Sul3TCCGTTCAGCGAATTGGTGCAG
TTCGTTCACGCTTTACACCAGC
127[52]
MacrolidesermAGAAATCGGATCAGGAAAAGG
AACAGCAAACCCAAAGCTC
332[53]
ermBGATACCGTTTACGAAATTGG
GAATCGAGACTTGAGTGTGC
364[53]
β-lactamsblaOXA-10CGCAATTATCGGCCTAGAAACT
TTGGCTTTCCGTCCCATTT
71[54]
blaSHVGCGAAAGCCAGCTGTCGGGC
ATTGGCGGCGCTGTTATCGC
302[55]
blaCTX-MGGAGGCGTGACGGCTTTT
TTCAGTGCGATCCAGACGAA
63[56]
ampCCAGCCGCTGATGAAAAAATATG
CAGCGAGCCCACTTCGA
147[57]
IntegronintITCGTGCGTCGCCATCACA
GCTTGTTCTACGGCACGTTTGA
67[58]
TransposontnpA-IS4GGGCGGGTCGATTGAAA
GTGGGCGGGATCTGCTT
108[54]
16S rRNAV4GTGCCAGCAGCCGCGGTAA
GGACTACAAGGGTATCTAAT
292[59]
Publisher’s Note: MDPI stays neutral with regard to jurisdictional claims in published maps and institutional affiliations.

