Article

Longitudinal Surveillance and Risk Assessment of Resistance in Escherichia coli to Enrofloxacin from A Large-Scale Chicken Farm in Hebei, China

1
The Cooperative Innovation Center for Sustainable Pig Production, College of Veterinary Medicine, Huazhong Agricultural University, Wuhan 430070, China
2
MOA Key Laboratory of Food Safety Evaluation/National Reference Laboratory of Veterinary Drug Residue (HZAU), Huazhong Agricultural University, Wuhan 430070, China
*
Author to whom correspondence should be addressed.
Antibiotics 2021, 10(10), 1222; https://doi.org/10.3390/antibiotics10101222
Submission received: 7 September 2021 / Revised: 29 September 2021 / Accepted: 1 October 2021 / Published: 8 October 2021
(This article belongs to the Special Issue Antimicrobial Use and Antimicrobial Resistance in Food Animals)

Abstract

:
The purpose of this study was to investigate the changes of resistance phenotype and plasmid-mediated quinolone resistance genes (PMQRs) in Escherichia coli (E. coli) during enrofloxacin (ENR) administration in different breeding cycles. In 2020, 983 strains of E. coli were isolated from different samples in different cycles at the broiler farm with the largest single batch of slaughter capacity in Hebei Province, China. All samples were from chicken, environmental, and human sources. The sensitivity of the isolates to various antibiotics was determined by broth microdilution method. The findings of this study include: (1) the total isolation rate of E. coli in the four cycles was 63.83% (983/1540); (2) the average resistance rate of E. coli from 1-day-old chickens to enrofloxacin was as high as 75% in each cycle, and with the use of enrofloxacin, the resistance rate of E. coli from chickens gradually increased to 100%; (3) 107 strains of E. coli randomly selected from different cycles and sources demonstrated the multi-drug resistance phenotypes. The highest resistance rate was doxycycline (100%), and the lowest was erythromycin (54.21%); (4) the detection rate of PMQRs of E. coli from chickens in different cycles were always higher than that from environmental and human. In particular, the PMQRs pollution rate of chicken seedlings in each cycle were generally higher than that of other sources; (5) We used SPSS software to analyze the Kendall rank correlation of the experimental data. The resistance of E. coli isolated from this farm to ciprofloxacin (CIP) may increase along with the increase of resistance to enrofloxacin (Kendall’s tau-b = 0.190, p = 0.021). All these data highlight the serious problem of bacterial resistance in this farm. Therefore, it is urgent to provide guidance for the prevention and control of colibacillosis and drug resistance in this farm.

1. Introduction

As the pathogen of zoonotic diseases, animal-derived bacteria have always been one of the burdens affecting human health in the world. The development of antibiotic resistance and the lack of effective antibacterial drugs to prevent and treat bacterial diseases are the main challenges facing animal health [1]. Among them, E. coli, as a commensal bacterium in the intestinal tract of humans and warm-blooded animals, can enter the environment through feeding, excretion and other means [2]. According to statistics, E. coli has about 1020 populations and kills more than 2 million people every year through on-site or extra-intestinal diseases [3]. In developing countries, the prevalence of enterotoxigenic E. coli, enteroinvasive E. coli, enteropathogenic E. coli and enteroaggregative E. coli is an important reason that causes diarrhea in children and affects the development of animal husbandry. The most common enteropathogenic E. coli strain in developed countries is Shiga toxin-producing E. coli/enterohemorrhagic E. coli [4]. Large-scale population genetic studies have shown that the diversity and complexity of E. coli in different environments are affected by many environmental factors [5].
As an important indicator of contamination in animal and human life, the number of drug-resistant strains of E. coli has been increasing in recent years. Its drug resistance spectrum is complex and multi-drug resistance is serious [6,7]. This situation poses a serious threat to human and public health. Most outbreaks of human colibacillosis are related to food contamination. As chicken meat is the second meat consumable after pork in China, pollution mainly occurs in the links of breeding, slaughter, and product processing. China is a big country in breeding livestock and poultry in the world. Hebei Province, as one of the main producing areas of broilers in China, has a large scale of breeding, high density of breeding, and is also seriously affected by pathogenic E. coli. The study by Duan et al. reported that E. coli can survive widely in the chicken coop and its surrounding environment [8]. Therefore, this study selected a broiler breeding demonstration base in Hebei Province for E. coli resistance monitoring. There are at least four breeding cycles in the farm every year, and the medication mode of each cycle is basically the same. The farm had a long-term background of the use of fluoroquinolones. To prevent chickens from intestinal diseases, the farm mixed enrofloxacin with water to drink when the chickens were 9–12 days old. Therefore, this study focused on monitoring the resistance of chicken, environmental, and human E. coli to enrofloxacin during the four breeding cycles of the farm. The surveillance results can provide guidance for the prevention and control of E. coli disease and drug resistance in this farm, to reduce the mortality rate of chickens in this farm and improve the use rate of feed. This study will transmit correct and accurate breeding concepts for the farm, provide scientific and reasonable broiler raising methods, and contribute to the further improvement of the economic benefits of the farm.

2. Results

2.1. The Isolation Rate of E. coli in Four Breeding Cycles

Among the total of 1540 samples, the average separation rate of E. coli in the third breeding cycle (275/400, 68.75%) is highest (Table 1). The average isolation rate of E. coli from chicken in the four cycles was as high as 74.72% (538/720) (Table 1). The average isolation rate of E. coli in four breeding cycles of environmental source samples was the lowest (Table 1). The average separation rate of E. coli was highest in feed (65%) (Table 2). In the feed of the third cycle, the isolation rate of E. coli was as high as 90.00% (Table 2). In this study, the average separation rates of E. coli in feces and fecal water during the four cycles were 48.34% and 63.33%, respectively (Table 2). Our investigation shows that the average separation rate of E. coli in each cycle of biological media samples was 53.33% (Table 2). In addition, human beings are important spreaders of bacteria. In this study, the average isolation rate of E. coli from broiler breeders in the four cycles was 77.50% (Table 1). In the fourth cycle, the isolation rate of E. coli from human was even as high as 100% (Table 2). This is closely related to the personal hygiene of the breeders.

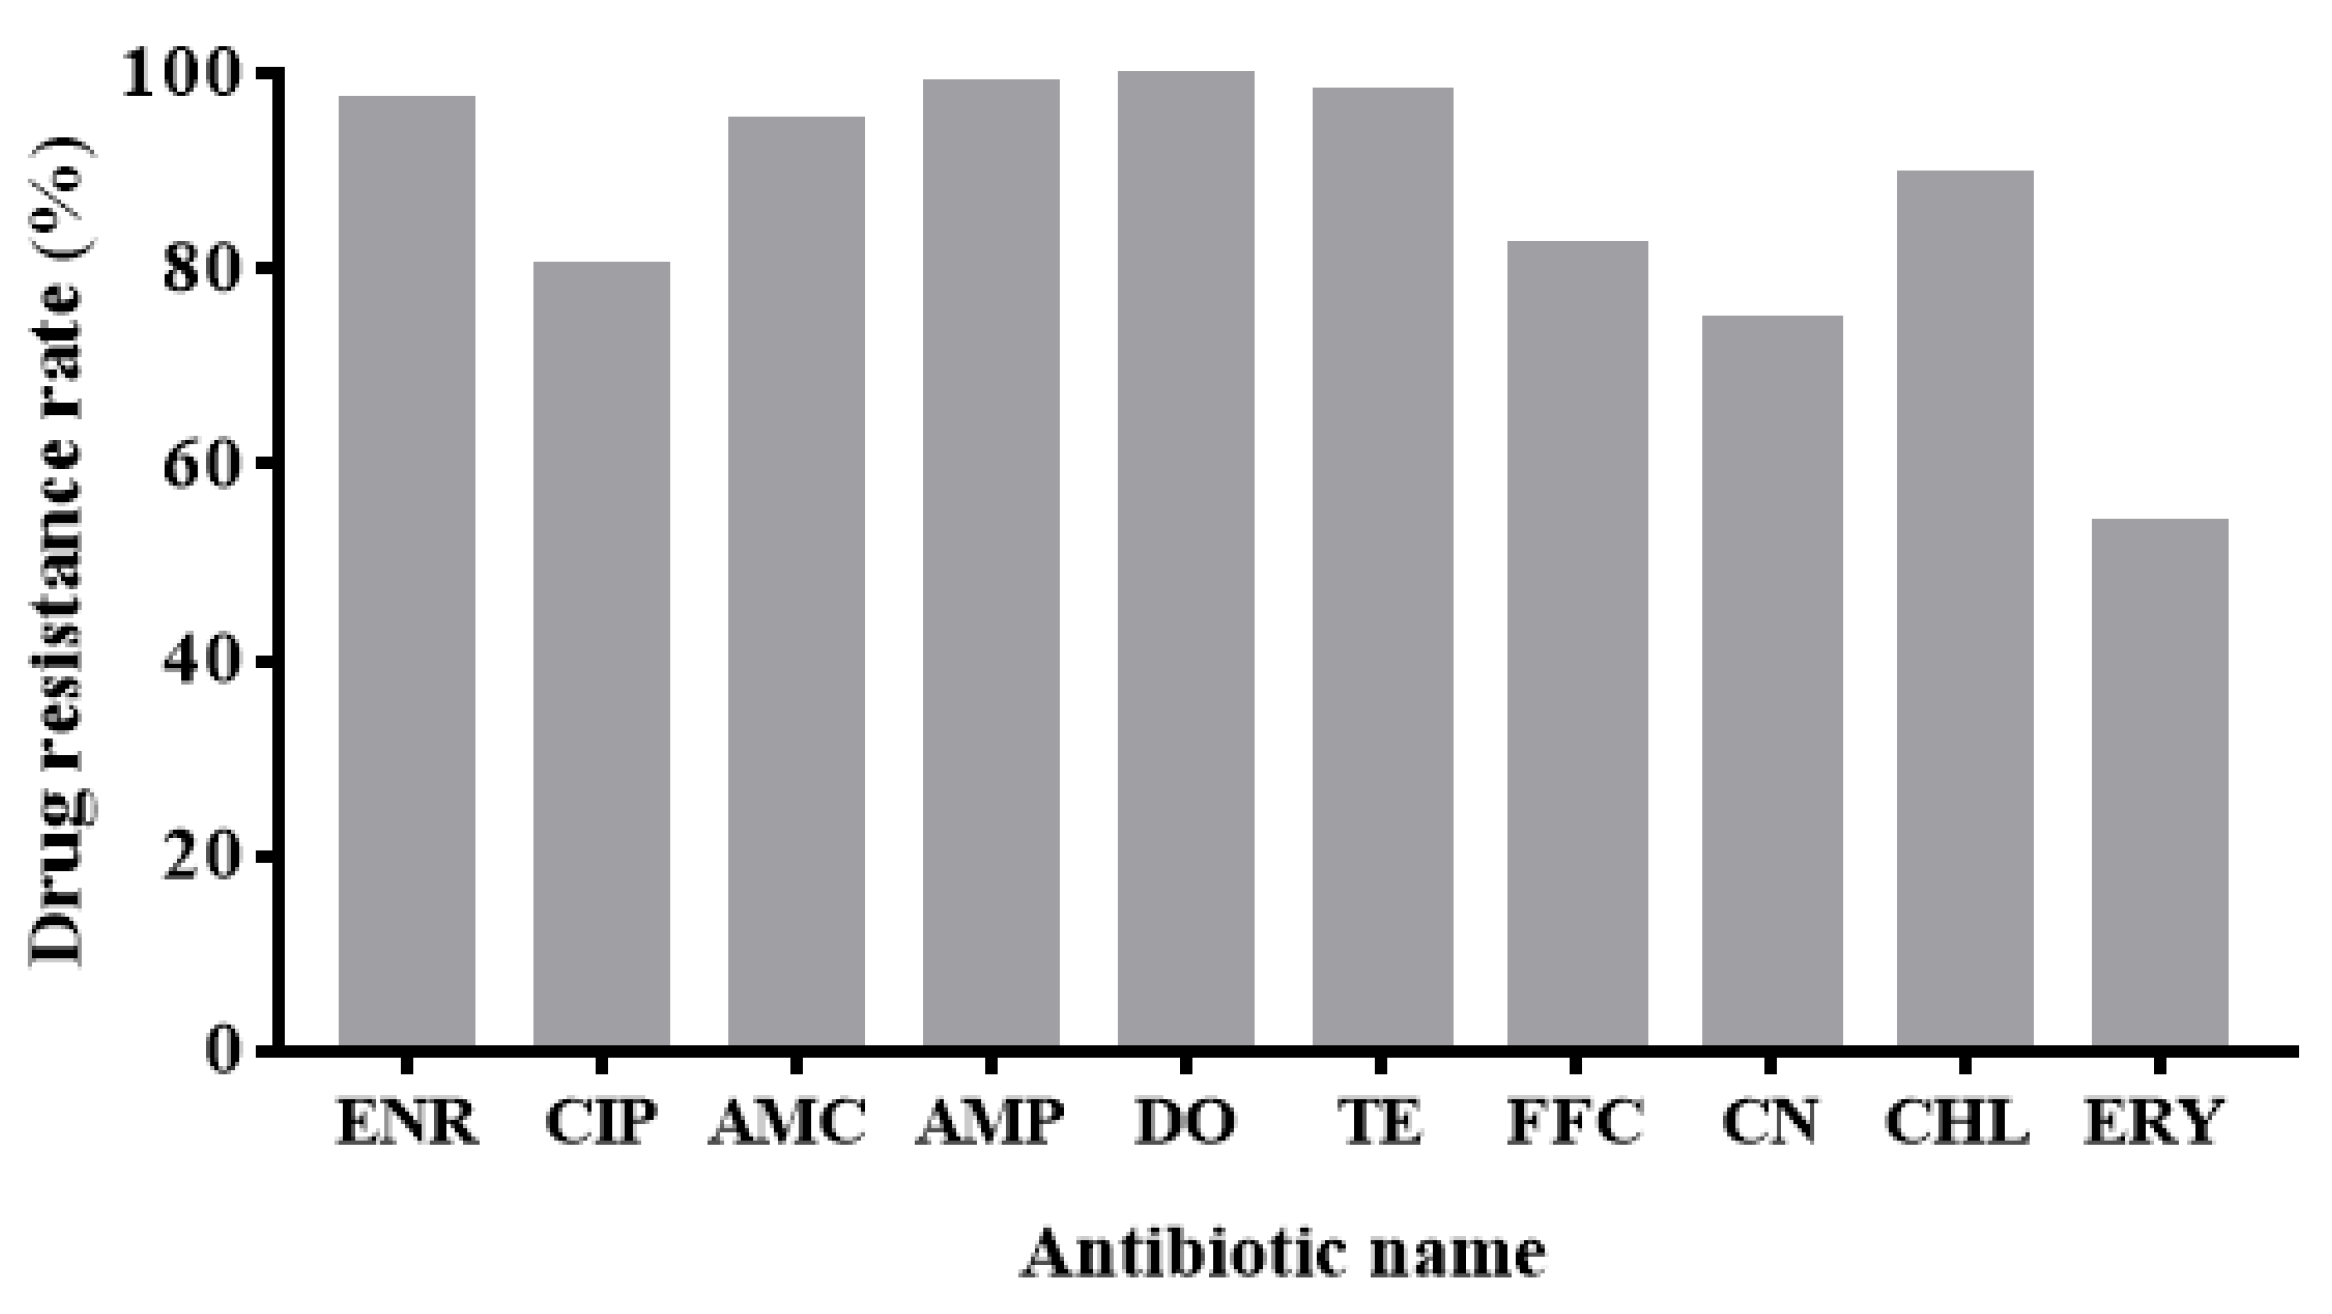
2.2. The Sensitivity of E. coli to Enrofloxacin and Other Antibiotics

The resistance rate of 983 test strains to ENR was as high as 97.25% (956/983). The MIC value of most E. coli is between 32–128 μg/mL, accounting for 75.38% (741/983). Only 10 strains of E. coli are sensitive to ENR (MIC ≤ 1 μg/mL) (Figure 1). The average resistance rates of E. coli isolated in each breeding cycle to enrofloxacin were 95.20%, 98.44%, 98.90% and 95.20%, respectively (Table 3). The resistance rate of E. coli isolated from 1-day-old chicken seedlings in each breeding cycle to ENR was more than 75% (Table 3). In addition, with the use of ENR in chickens between 9–12 days of age, the resistance rate of E. coli from chickens to ENR would gradually increase to 100.00% (Table 3). The average resistance rate of E. coli from environmental sources in each breeding cycle to ENR was as high as 95% (Table 3). There was no significant difference in the resistance rate of E. coli to enrofloxacin between different breeding cycles, and all showed high levels of resistance. However, it should be noted that because the total number of E. coli strains tested in each link is small, small changes will cause differences in the statistics of drug resistance rates. In cycle 2, only one strain of E. coli is sensitive to enrofloxacin, which leads to a decrease in resistance level one day after medication in comparison to other cycles. However, only one strain of E. coli is not representative and does not explain the problem. In general, these E. coli strains maintained a high resistance rate to enrofloxacin.
The non-repetitive 107 strains randomly selected from 983 E. coli strains had a serious problem of multi-drug resistance to the 10 antibiotics tested. Specifically, 107 strains of E. coli had a positive effect on enrofloxacin, ciprofloxacin, amoxicillin/clavulanic acid (AMC), ampicillin (AMP), doxycycline (DO), tetracycline (TE), florfenicol (FFC), gentamicin (CN), chloramphenicol (CHL) and erythromycin (ERY) resistance rates were 98.13% (105/107), 80.37% (86/107), 92.70% (99/107), 99.07% (106/107), 100.00% (107/107), 98.13% (105/107), 82.24% (88/107), 74.77% (80/107), 89.72% (96/107) and 54.21% (58/107), respectively (Figure 2). In terms of cycle, the resistance of strains in the first cycle is relatively mild. The resistance of the third cycle strains is more serious (Figure 3). According to the source of strains, the multi-drug resistance of E. coli from chicken is the most serious. Its resistance to 8 or more antibiotics accounted for as high as 87.49% (Figure 4).

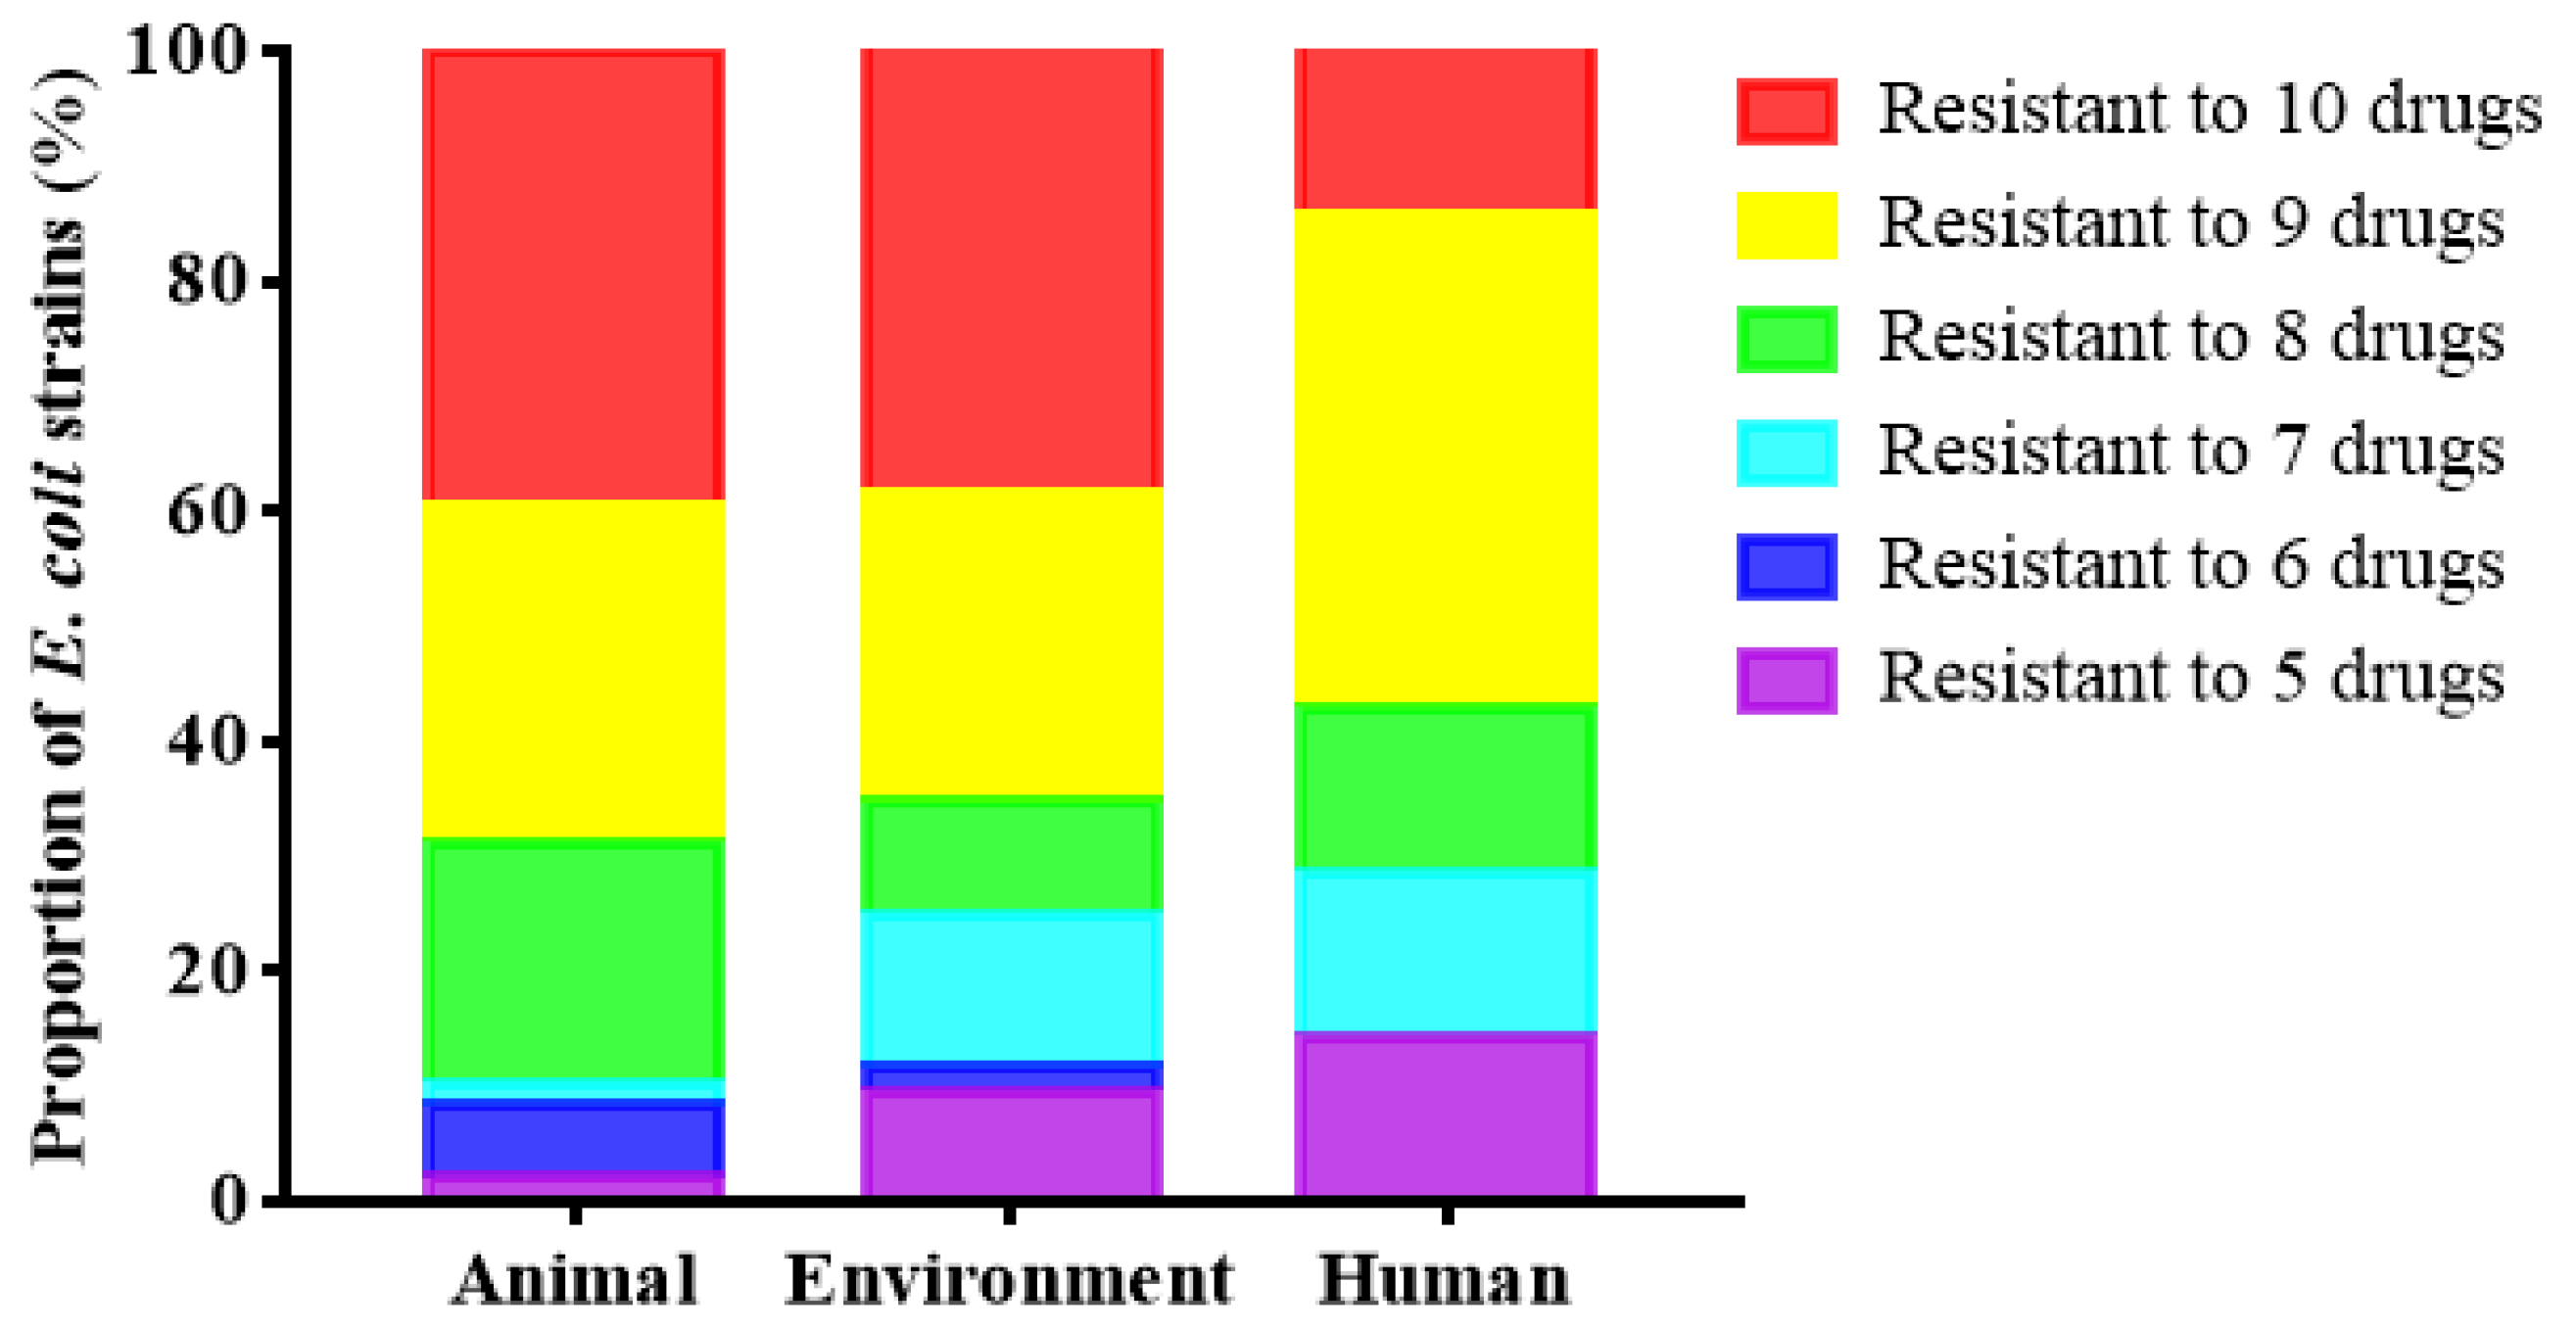
2.3. Correlation Analysis among Multiple Antibiotic Resistance

This study found that the E. coli isolated from the broiler farm had a significant positive correlation to ENR and CIP resistance (Table 4). Even the farm has never used CIP as a medicine for clinical prevention and treatment of chicken diseases in each breeding cycle. However, the resistance rate of 107 E. coli strains isolated from the site to CIP was as high as 80.37%. The resistance of E. coli to CIP may increase with the increase of its resistance to ENR. Similar results include DO and TE, both of which belong to the tetracycline class, and FFC and CHL, which belong to the same class of chloramphenicol (Table 4). The difference was that ERY, which belongs to macrolides, and CN, which belongs to aminoglycosides, showed a strong positive correlation with drug resistance (Table 4). It should be noted that this result can only represent the correlation between the ten antibiotics tested, and there may also be a stronger correlation between an untested antibiotic and a certain drug tested in this study.

2.4. Detection of Plasmid-Mediated Fluoroquinolone Resistance Genes in E. coli

Six plasmid-mediated fluoroquinolone resistance genes were detected among 246 strains of E. coli in the first cycle. The detection rate of qnrS was the highest, which was 71.54% (176/246). Eight PMQRs were detected among 192 strains of E. coli in the second cycle. The detection rate of aac(6)-lb-cr was the highest, which was 84.38% (162/192). Six PMQRs were detected among 275 strains of E. coli in the third cycle. The detection rate of qnrS was the highest, which was 82.91% (228/275). Six PMQRs were detected among 272 strains of E. coli in the fourth cycle. The detection rate of oqxA was the highest, which was 68.15% (84/270) (Table 5) (p < 0.05). It is noteworthy that in different cycles, the detection rate of resistance genes of chicken E. coli was always dominant compared with environmental and human sources (Figure 5). The detection rate of E. coli resistance genes in feed, fecal water, and feces accounted for a higher level in the overall environmental samples. (Figure 6). Specific analysis of strains from chicken seedlings, feed, feces, and fecal water show that qnrS, oqxA, oqxB, and aac(6)-lb-cr could be detected in the strains from different sources in different cycles. They are relatively dominant genes (Figure 7). These resistance genes have a high detection rate in chicken-derived strains, especially chicken seedlings strains. In addition, qnrA only appeared in chicken-derived strains in the second breeding cycle. In addition, qnrA can also be detected in some chick seedlings. Maybe qnrA was brought into the farm by chicken seedlings (Figure 7). QepA gene appears in strains of the third and fourth cycles. The detection rate of chicken seedling strains in the third cycle was 34.88%. The detection rate of feces and fecal water strains did not exceed 5%, and it was not detected in other links. However, the detection rate of this gene in the fourth cycle chicken seedlings was 9.76%. The detection rate in feed, feces and fecal water all exceeded 15%. It is possible that qepA was brought into the farm by the chicken seedlings of the third cycle, and horizontal transmission occurred in the farm (Figure 7). QnrB is not present in the chick strains of the first cycle. It is only detected in feed and dust strains, but the detection rate is extremely low. However, qnrB can be detected in every link of the second cycle. It is possible that the feed of the first cycle was the source of qnrB transmission, and then horizontal transmission occurred in the field (Figure 7). QnrD does not exist in the first cycle chicken seedlings and environmental strains. It is only detected in chicken-derived strains in the process of medication, and can be detected in all phases of the subsequent cycles. It is possible that qnrD was induced during the first cycle of medication and then spread (Figure 7).

3. Discussion

3.1. The Prevalence of E. coli in Broiler Farms

In all breeding cycles, the isolation rate of E. coli in the third cycle is higher. Because the sampling time of this cycle is in July, which are hot and rainy. In the summer in northern China, the overall temperature of the chicken house is relatively high and difficult to control, and the environment is relatively humid. Studies have shown that in the season of high temperature, the carrying rate of pathogenic bacteria in animals is higher [9]. Comparing different sources, chicken-derived E. coli has the highest isolation rate. It was possibly because the chicken seedlings have already carried pathogenic bacteria during the hatching stage of the breeder farm. Many studies have also found this phenomenon. For example, Zhao et al. investigated the chicken seedlings in the hatchery and found that some chicken seedlings carried typical avian pathogenic E. coli. They also found that the same strains in the same hatchery may come from the vertical transmission of parent groups [10]. In addition, studies had shown that E.coli strains isolated from the intestine of healthy chickens and from their environment are phylogenetically similar to pathogenic E. coli (APEC) strains that have been isolated from coliseptisemic chickens [11]. Therefore, we must strictly control the quality of chicken seedlings to reduce the introduction of bacterial pathogens. When selecting chicken seedlings, they should be purchased from the regular farms with breeding livestock, poultry certificate, and animal epidemic prevention condition certificate. Farms should choose healthy, energetic, lively, fluffy, and bright chicken seedlings. The healthy chickens should be vaccinated in time. After the chicken seedlings produces the corresponding antibodies, the occurrence and prevalence of infectious diseases in chickens will be reduced.
The high separation rate of feed source E. coli in environmental samples further illustrates the importance of feed in the broiler feeding process. The study by Davis et al. showed that the pulsed field gel electrophoresis (PFGE) spectrum of E. coli O157:H7 isolated from a farm feed sample is very similar to the spectrum of the later isolated from the farm’s feces. This provides evidence for the role of feed in the spread of E. coli O157:H7 [12]. In addition, feces, water, soil, flies, and mice are all common vectors of E. coli. Since the farm has done a good job in the purification of chicken drinking water and the disinfection of the ground and air in the chicken house, the isolation rate of E. coli in water and dust samples is relatively low. Experiments by Chuppava et al. proved that the feces of broiler chickens carry drug-resistant E. coli with multiple drug-resistant genes and spread in the environment around the chicken house [13]. Colomer-Lluch and Selvam’s research also confirmed this view [14,15]. When untreated animal manure is used as fertilizer in farmland or discharged into rivers with sewage, it will cause irreversible harm to the natural environment [16]. High separation rate of E. coli in feces and fecal water samples reminds that the farm should clear the manure on the conveyor belt in the house in time, and treat the manure water accumulated after cleaning in a timely manner. Flies are often an easily neglected pathogen transmission vector. In chicken houses, a large number of flies often attach to chicken body, excrement, breeding tools, and feed surface, which is often conducive to the colonization and transmission of E. coli [17]. High separation rate of E. coli in biological vector samples also reminds the farm that it should strengthen the control and killing of flies and mosquitoes in the house to eliminate potential threats that may be caused by biological vectors.
In addition, human beings are important spreaders of bacteria. The results of this experiment suggest that the maintenance of personal hygiene of our farmers is very important. Adenipekun et al. confirmed that drug-resistant E. coli can spread to humans through the food chain, and most of these people are engaged in poultry breeding or sales [18]. Therefore, the farm should strengthen the hygiene and health management of the breeders and maintain good hygiene habits to block the spread of pathogenic bacteria.

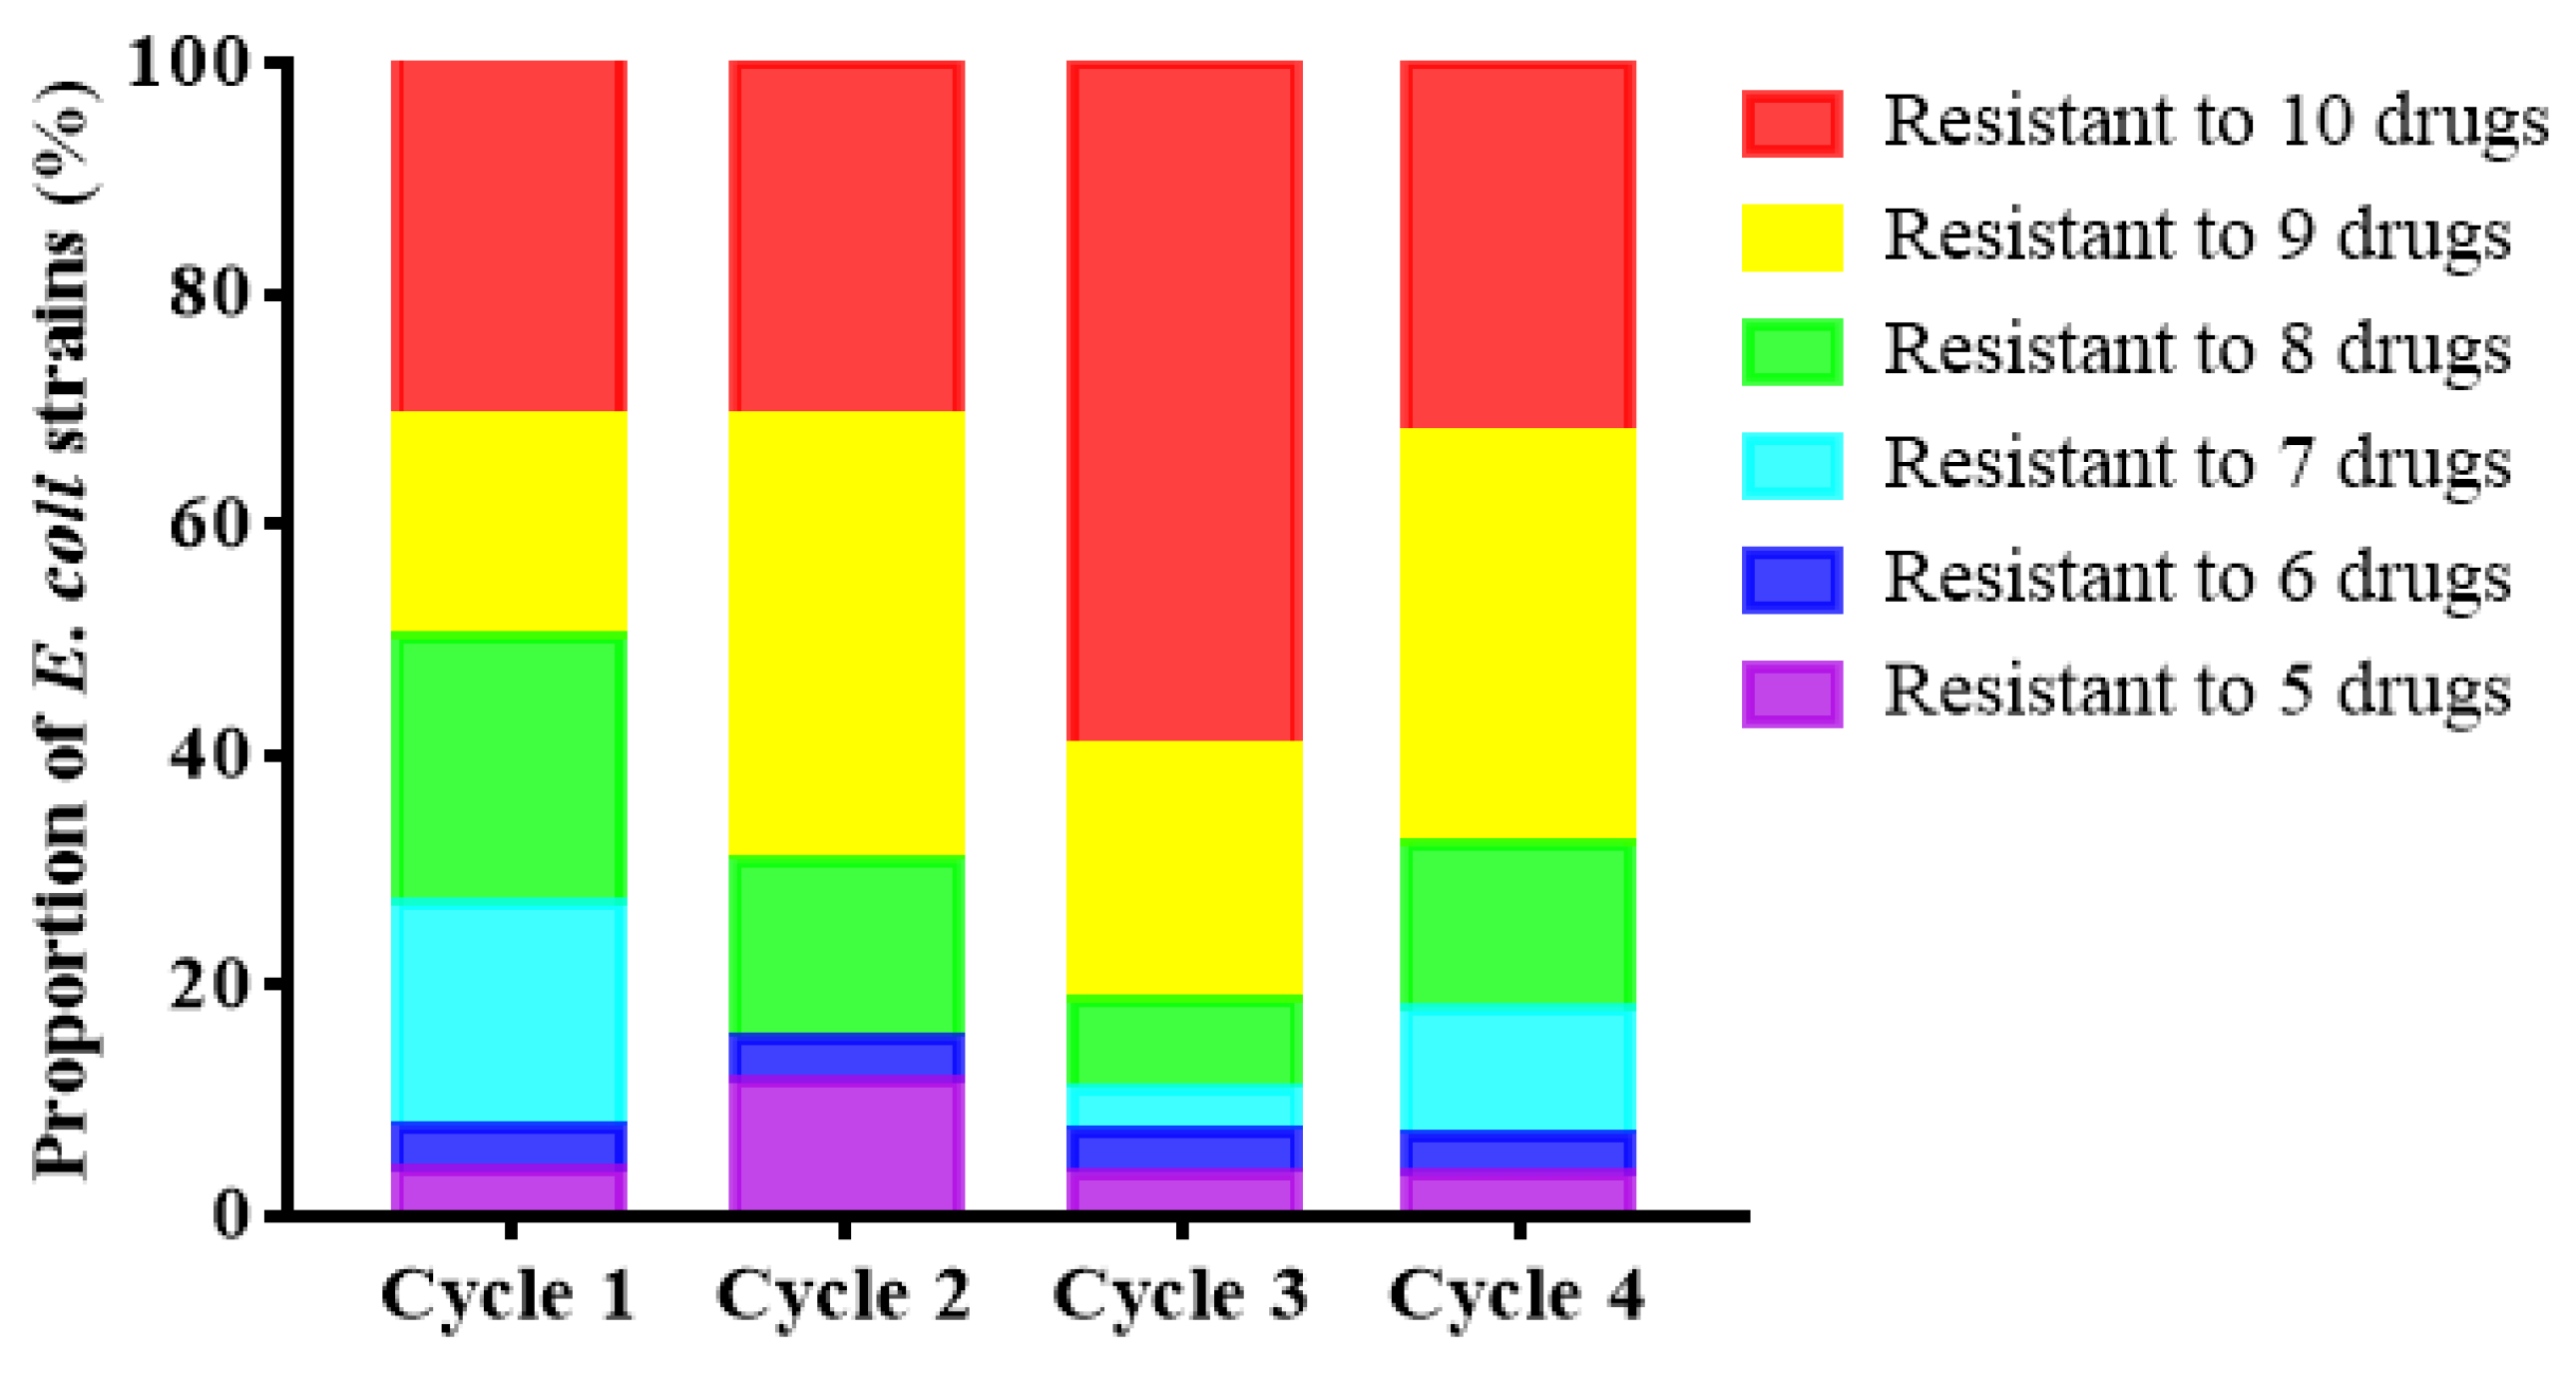
3.2. Epidemic Characteristics of E. coli Resistance and Multi-Drug Resistance in Broiler Farms

This study found that the resistance of E. coli is serious in the farm, especially the resistance of E. coli isolated from chicken seedlings. It is speculated that the high resistance rate of E. coli from chicken-derived to ENR at the stage of chicken seedlings entering the farm may be caused by the vertical transmission of the parents [10]. Nishikawa et al. proved that E. coli carrying the PMQR gene can cause resistance to similar drugs under the selective pressure of fluoroquinolones [19]. Therefore, the high resistance rate of E. coli isolated in the later period to ENR may be related to the frequent use of ENR for prevention and control by the farm for a long time and the changes in the chicken house environment over time. In this case, the farm should actively change the way of medication in each breeding cycle. Farms should take reasonable preventive measures, or use interval and shuttle medication methods under necessary conditions to reduce the frequency of drug resistance.
The result of the high multi-drug resistance may be caused by the unreasonable use of various antibiotics in the farm in each breeding cycle. According to the investigation, the farm used a large amount of AMC, FFC, DO, and ERY in each breeding cycle. This also caused the isolated E. coli to have a high resistance rate to these and their similar drugs. The investigation by Han T et al. also proved that drug-resistant bacteria in animals and the environment continued to increase with the use of drugs during the feeding cycle [20]. This had also led to the widespread distribution of resistance genes and the increase in overall bacterial resistance. The farm should look for alternative therapies for clinical treatment of chicken diseases. We consider that vaccines and Chinese medicine can be used to prevent and treat various diseases. For example, Koutsianos D et al. found that birds that have been vaccinated with commercial live and inactivated vaccines can be better protected from pathogenic bacteria [21]. Moreover, the multi-drug resistance of environmental and human E. coli is also quite serious. Under the selective pressure of heavy metals and fungicides in the environment, the spread of arthropods, the long-term contact with animals or environment carrying drug-resistant strains and the normal physiological function of the human body is seriously disrupted, bacteria will produce different degrees of drug resistance [22,23]. Van Boeckel et al. reported that drug-resistant bacteria from animals can not only spread widely in the environment through feces, but also easily spread to humans through the food chain [24]. More investigations have also proved that multi-drug-resistant E. coli isolated from environmental sources and human sources are mostly caused by the horizontal transmission of resistant strains between the animals, environment, food and people [25]. Therefore, more attention should be paid to improve the environmental sanitation of the farm and the personal health of the breeder. The breeding farm should conduct regular physical examinations on the breeders. The farm must ensure that the living area and the chicken coop are clean and tidy to prevent the generation and spread of pathogens. In addition, the cultivation of biosafety awareness of farmers is also particularly important.

3.3. Risk Assessment of Drug Resistance in Broiler Farms Based on SPSS Nonparametric Correlation Analysis

Fluoroquinolones, tetracyclines, and other antibiotics have been frequently used in large-scale farms in China for a long time, which not only reduce the occurrence and spread of population diseases, but also lead to the thorny problem of drug resistance or multi-drug resistance. Significant positive correlation results between ENR and CIP possibly because they belong to the fluoroquinolone antibiotics, and CIP is the main active metabolite when ENR works. After E. coli was resistant to ENR, it developed cross-resistance to CIPs with similar structures and properties [26,27]. Moreover, the metabolism of ENR and CIP in animals is relatively slow, and drug residues are easy to occur, resulting in the increase of drug resistance of pathogens in organisms. This fully explains the phenomenon that the resistance rate of E. coli isolated from this farm to ENR gradually increases with the age of broilers. Similar results include DO and TE, FFC and CHL both showed strong positive correlation in correlation analysis [28,29]. We speculate that there are similar mechanisms of action and drug resistance among several drugs belonging to a certain class of antibiotics. Thus, the resistance of pathogenic microorganisms to these antibacterial drugs is positively correlated. However, this phenomenon needs further research to prove it. The ERY and CN, which belongs to different antibiotics, showed a strong positive correlation with drug resistance. This phenomenon may be because the strains carrying the CN resistance gene can combine and transfer with the strains carrying the ERY resistance gene. So that pathogens carry two kinds of resistance genes at the same time [30]. Studies have also shown that a plasmid with high homology to blaCTX-M carries a variety of antibiotic resistance genes at the same time [31]. It can be seen that different kinds of antibiotics have a positive correlation with drug resistance, which may be caused by the horizontal transfer of drug resistance genes between the tested strains or the tested strains carrying resistance genes to multiple drugs at the same time. It should be noted that this result can only represent the correlation between the ten antibiotics tested, and there may also be a stronger correlation between an untested antibiotic and a certain drug tested in this study. Therefore, if the previous drug strategy is maintained, the bacteria isolated from the farm will only become more resistant to various antibiotics. This will not only threaten the growth of chickens, but also cause irreversible harm to the environment and people. In the end, it may cause serious consequences that no medicine is available.

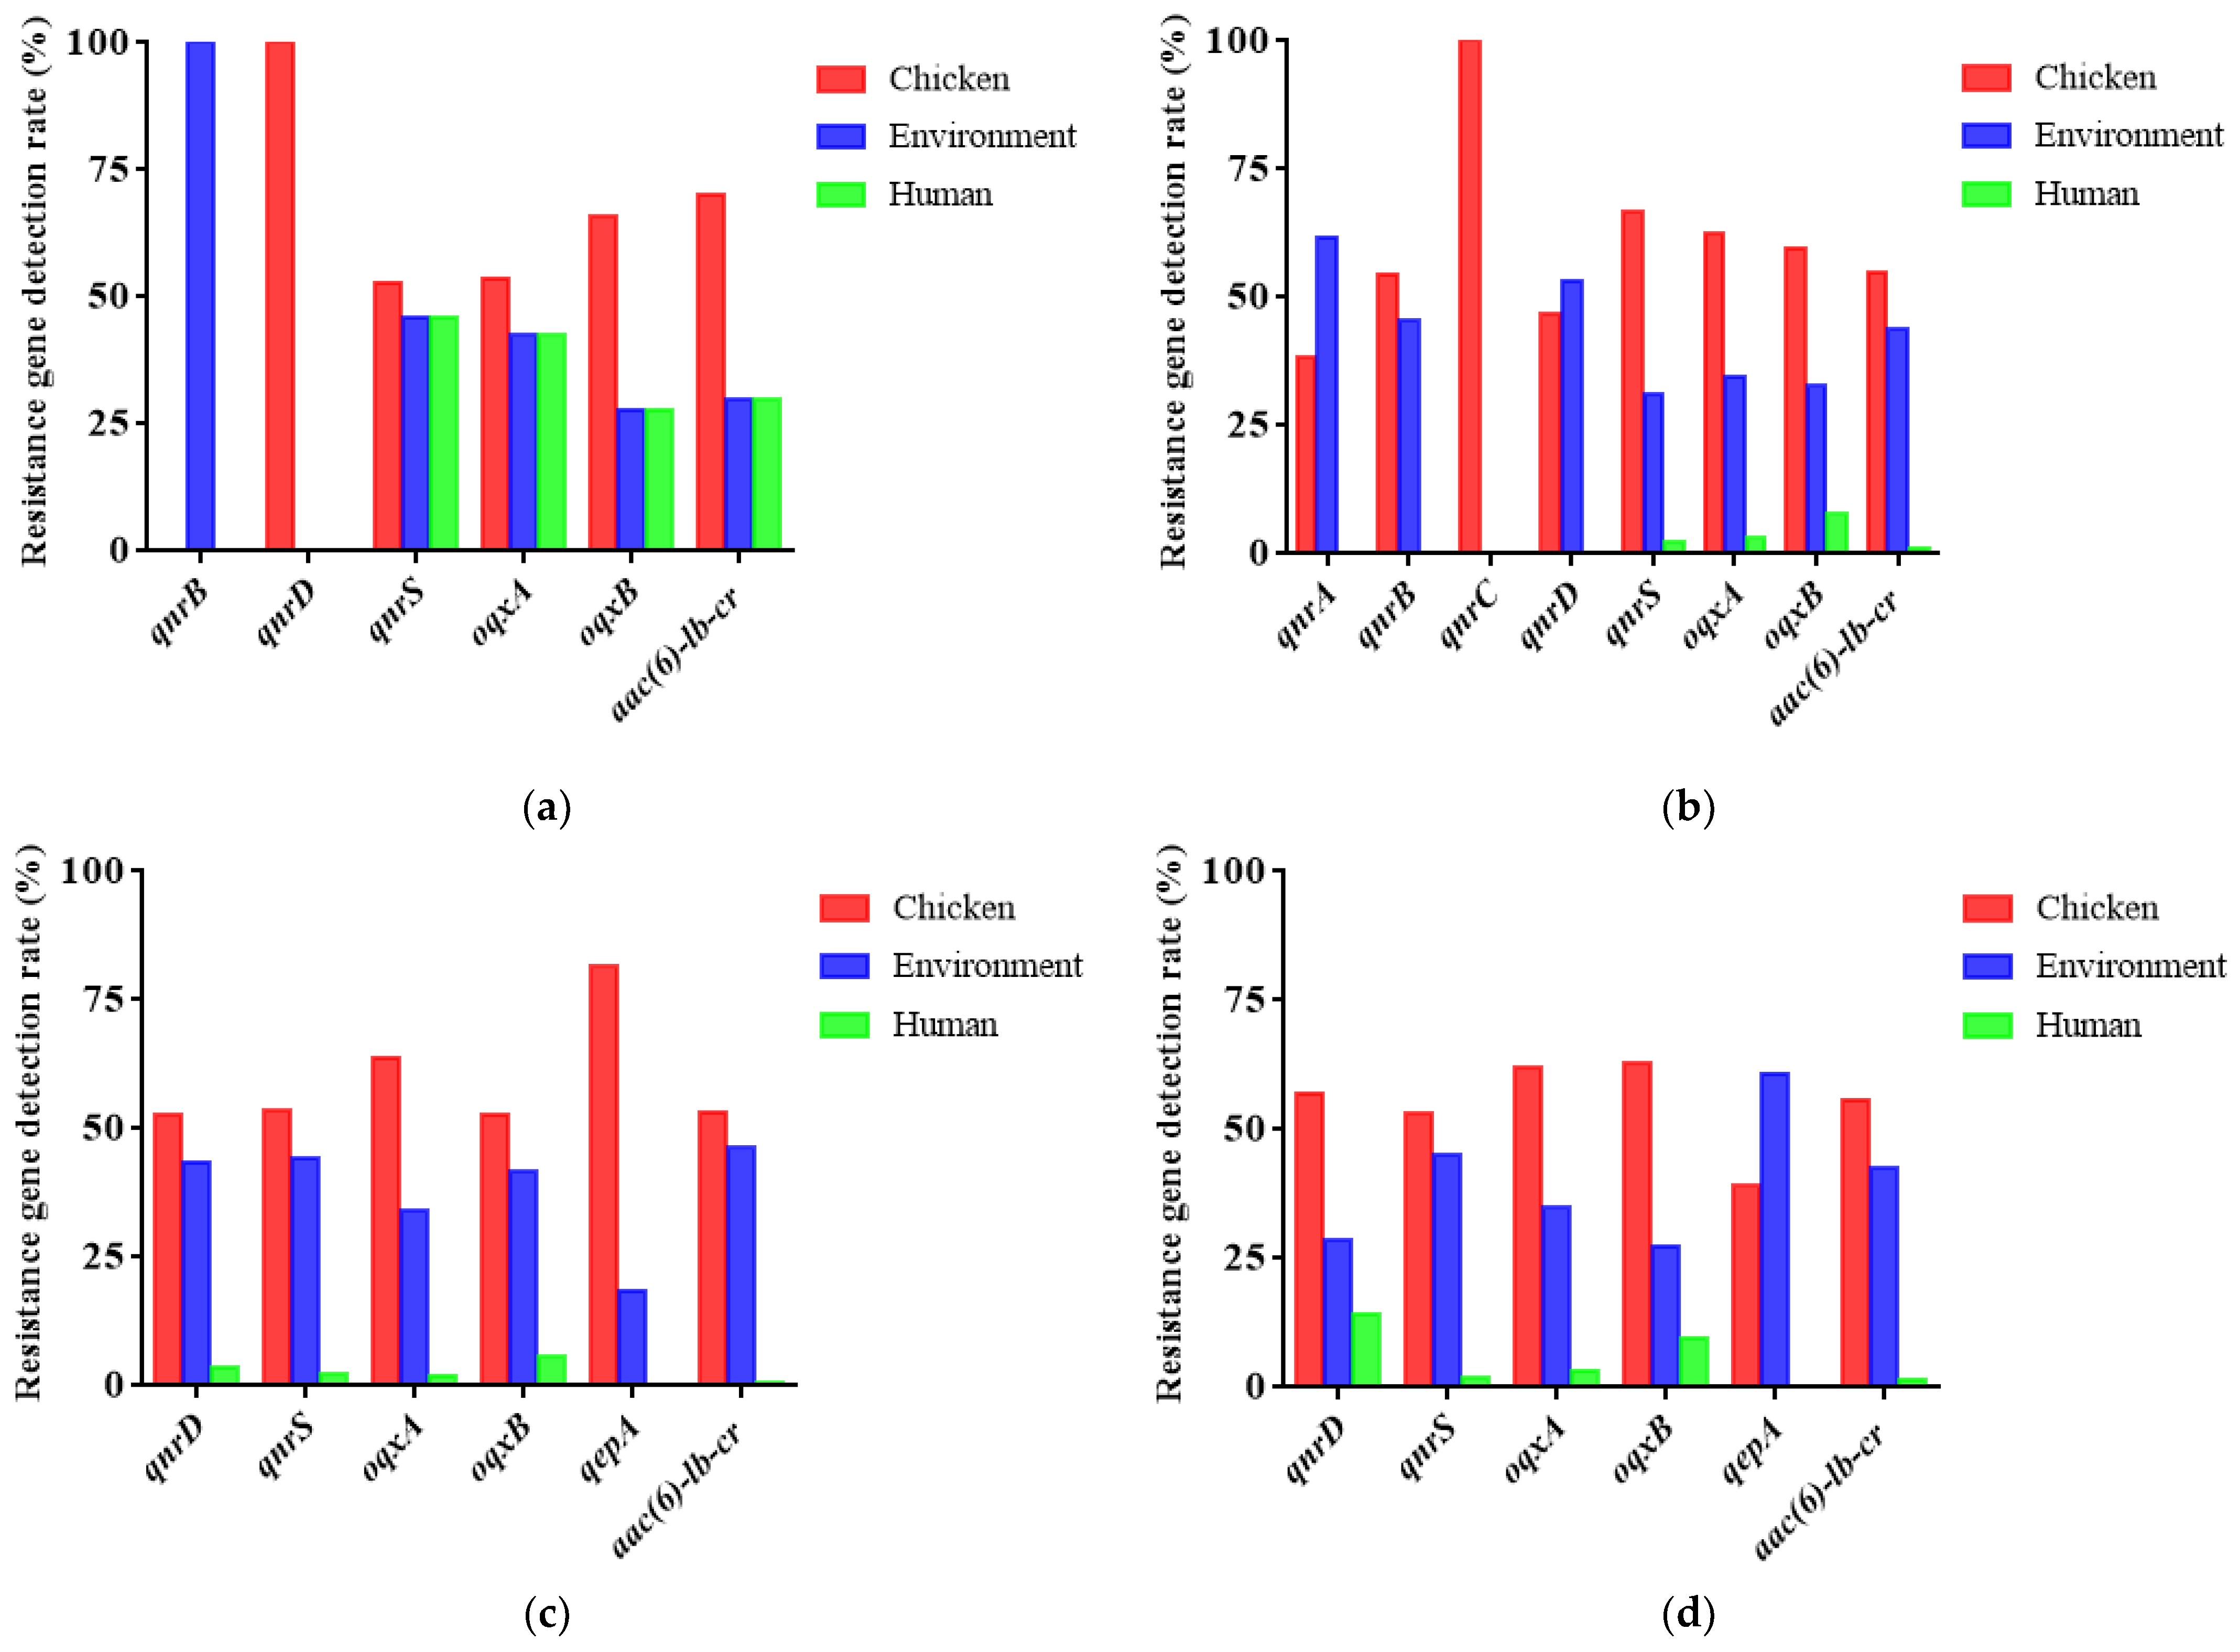
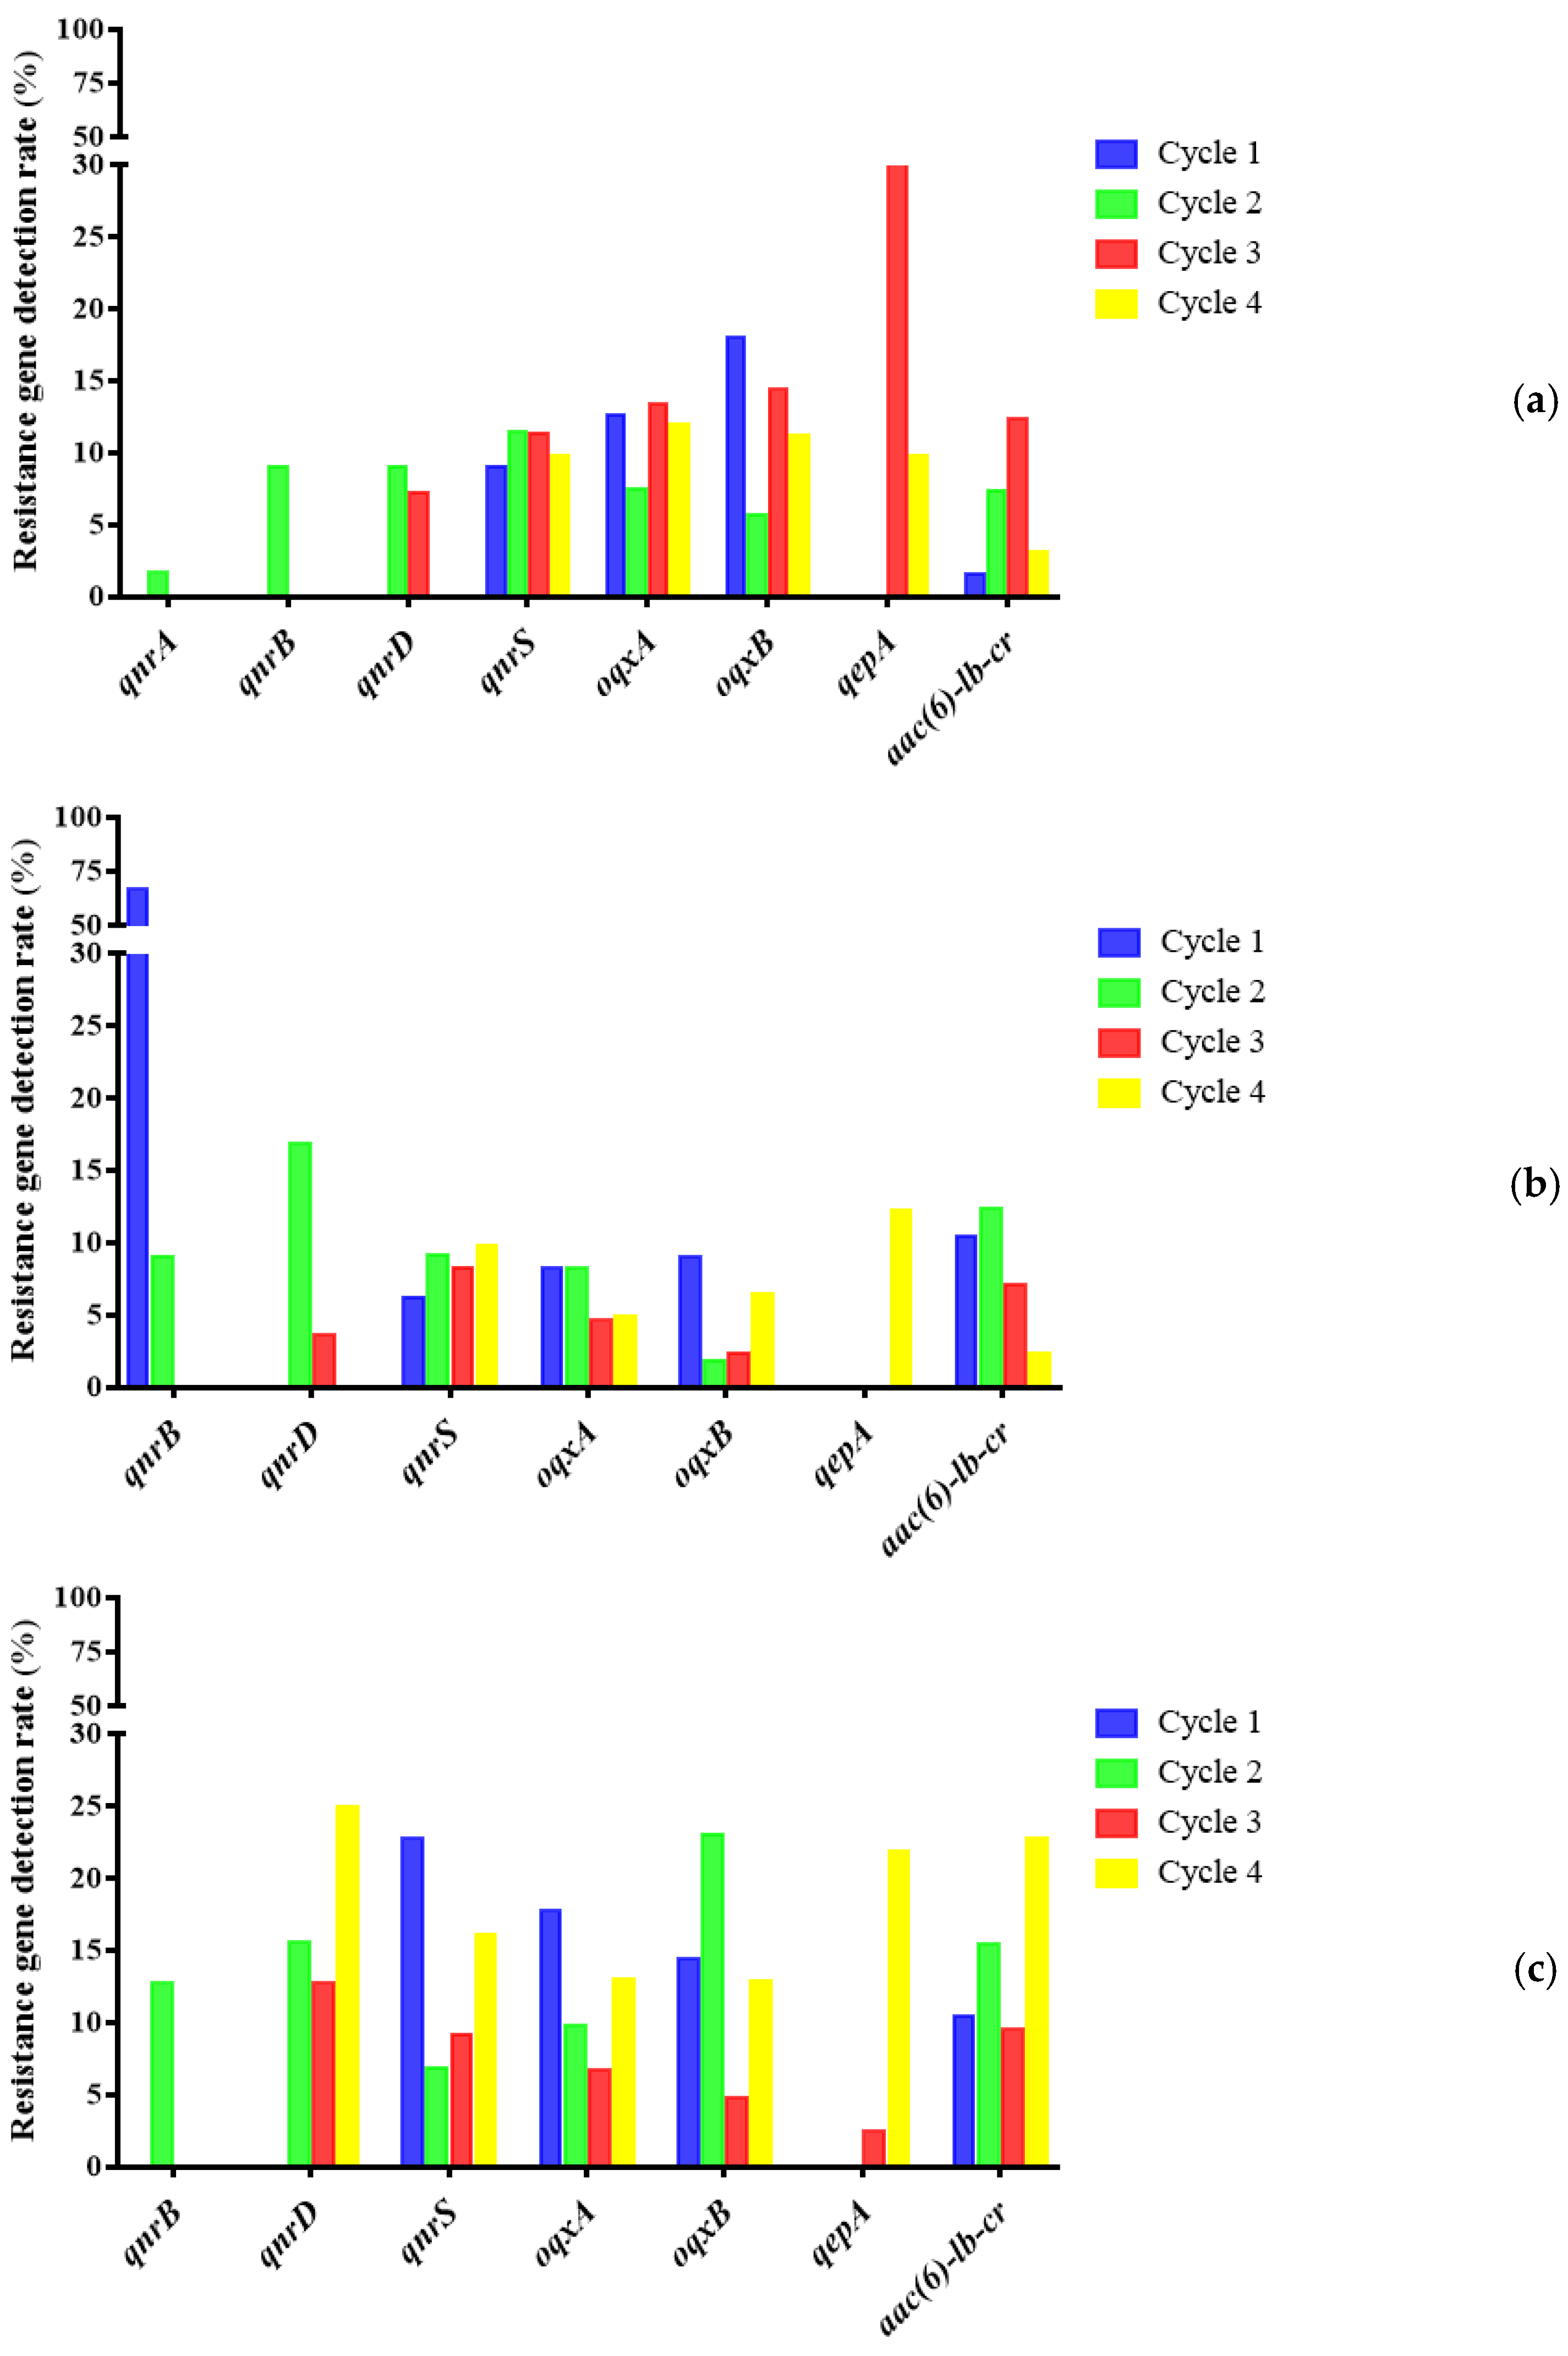
3.4. Epidemic Characteristics of Plasmid-Mediated Fluoroquinolone Resistance Genes in Broiler Farms

The results showed that the pollution rate of PMQRs in every cycle of chicken seedlings in this farm is extremely high. Moreover, the long-term medication pressure of ENR may lead to an increase in the detection rate of some PMQRs. At the same time, PMQRs in the environment are most likely caused by the horizontal spread of PMQRs-carrying strains in chicken sources. Many studies have proved that chicken seedlings may carry PMQRs during the hatching stage of the breeder farm, and spread horizontally or vertically after entering the farm [32,33]. When in an environment with drug selection pressure, it is conducive to select PMQRs and spread. In addition, after genes such as oqxA and oqxB are specifically expressed in E. coli, the MIC of quinolones against E. coli can be increased by more than 8 times. This explains well the reason the resistance rate of E. coli increased during the administration of enrofloxacin in this study, and eventually reached 100.00%. In broiler production, other ways, such as transmission by flies or horizontal gene transfer of other bacteria, may be more important than vertical transmission [34]. However, no matter what kind of transmission method, it may promote the bacterial resistance rate or the detection rate of drug resistance genes to gradually increase with the increase of the age of broilers.

4. Materials and Methods

4.1. Collection of Chicken, Environmental, and Human Samples

In 2020, we collected a total of 1540 samples of chicken, environmental, and human sources from a large-scale broiler farm in Handan City, Hebei Province during four breeding cycles. The farm has at least four breeding cycles each year, and the respective cycles are roughly in January to March, April to June, July to September, and October to December. Each breeding cycle is about 42 days, and the medication mode of each cycle is basically the same. The farm has a long-term background of using fluoroquinolones. Generally, broilers drink ENR mixed with water at the age of 9–12 days. The purpose is to prevent intestinal diseases, such as colibacillosis. In addition, amoxicillin, florfenicol, erythromycin, doxycycline and other kinds of antibiotics were also used in broilers at different ages. Among the 1540 samples, 720 chicken samples came from cloaca of healthy chickens. A total of 780 environmental source samples were collected from feed, drinking water, feces, dust, fecal water, breeding tools, and biological media in the chicken house. A total of 40 human samples came from the feces of breeding workers. All the samples were collected with disposable sterile swabs and transported to the laboratory through cold chain transportation in time for the next experiment.

4.2. Isolation and Identification of E. coli

After the collected samples were enriched, the bacterial solution was inoculated on LB agar plates for overnight culture. The white and round colonies were inoculated on LB agar for proliferation, and then purified on MacConkey agar medium. Subsequently, the pink, round raised, smooth, moist, and neatly edged colonies on MacConkey’s medium were inoculated on the eosin-methylene blue agar medium for re-identification. Finally, the colonies of suspected E. coli were picked (the colony is black and slightly convex, the edges are neat, the surface is smooth, moist, and has a metallic luster) for PCR identification. We used bacterial lysate as a template for PCR amplification. The specific primers were 16S rDNA (5′-GAAGCTTGCTTCTTTGCT-3′and 5′-GAGCCCGGGGATTTCACAT-3′) [35] to confirm that the tested bacteria is E. coli. The technological process was under the following amplification conditions: 95 °C for 3 min; followed by 34 cycles of 95 °C for 15 s, 55 °C for 15 s, and 72 °C for 1 min; and extension at 72 °C for 5 min. The amplified products were sent to Wuhan Qingke Biological Technology Limited Company for sequencing to confirm the PCR results. The sequencing results of the strains were compared on the National Center for Biotechnology Information website to ensure that the homology between these strains and E. coli was above 97%.

4.3. Antimicrobial Susceptibility Testing

The microbroth dilution method was used to determine the MIC of 983 strains of E. coli to ENR, and their drug resistance was described according to the Clinical Laboratory Standards Institute Guidelines (CLSI) [36]. The MICs of 107 strains of E. coli randomly selected from different cycles and sources to 10 kinds of antibiotics were determined by the same method, including enrofloxacin, ciprofloxacin, amoxicillin/clavulanic acid, ampicillin, florfenicol, doxycycline, gentamicin, tetracycline, chloramphenicol, and erythromycin. E. coli ATCC 25922 was served as a quality control strain for susceptibility tests.

4.4. Correlation Data Analysis of Multiple Antibiotic Resistance Levels

SPSS 17.0 software was used to analyze the Kendall rank correlation on all MIC results of 107 strains of E. coli. Kendall correlation belongs to nonparametric test, which is a quantity that reflects the degree of correlation between ordinal variables [37]. When using this correlation analysis method, the total distribution of variables is not required to be normal, and the sample size is not required to be greater than 30 [38]. * p ≤ 0.05 means significant correlation, * p ≤ 0.01 means highly significant correlation. According to the results, we analyzed the drug resistance correlation of E. coli under the fixed medication mode, and judged whether the long-term use of enrofloxacin affected the drug resistance level of E. coli to different drugs.

4.5. Plasmid-Mediated Fluoroquinolone Resistance Gene Detection

After isolates were confirmed to be E. coli, all of them were tested using the primer pairs (5′ to 3′) for qnrA (TCAGCAAGAGGATTTCTCA/GGCAGCACTATTACTCCCA), qnrB (GATCGTGAAAGCCAGAAAGG/ACGATGCCTGGTAGTTGTCC), qnrC (GGGTTGTACATTTATTGAATC/TCCACTTTACGAGGTTCT), qnrD (CGAGATCAATTTACGGGGAATA/AACAAGCTGAAGCGCCTG), qnrS (ACGACATTCGTCAACTGCAA/TAAATTGGCACCCTGTAGGC), oqxA (CTCGGCGCGATGATGCT/CCACTCTTCACGGGAGACGA), oqxB (TTCTCCCCCGGCGGGAAGTAC/CTCGGCCATTTTGGCGCGTA), qepA (GCAGGTCCAGCAGCGGGTAG/CTTCCTGCCCGAGTATCGTG) and aac(6)-lb-cr (TTGCGATGCTCTATGAGTGGCTA/CTCGAATGCCTGGCGTGTTT) by PCR [39,40]. The above genes were measured to monitor and analyze the prevalence of plasmid-mediated fluoroquinolone resistance genes in the farm.

5. Conclusions

In short, this research warns us that although changing the way of using antibiotics or improving the breeding environment will have a certain inhibitory effect on the development of drug resistance, the top priority thing is to control the quality and source of chicken seedlings. Only by controlling the source of drug resistance can the benign development of the broiler-related industry chain and the health and safety of human food public health be more effectively guaranteed. All in all, solving the problem of antibiotic resistance is not a matter of overnight. It requires the joint efforts of all personnel.

Author Contributions

Conceived and designed the experiments: M.D., K.G. Performed the experiments: K.G., Y.Z., L.C. Analyzed the data: K.G. Contributed reagents/materials/analysis tools: K.G., Z.C., F.Z., J.F., T.H. Contributed to the writing of the manuscript: K.G., M.D., X.W., Z.P. All authors have read and agreed to the published version of the manuscript.

Funding

This work was supported by the National Key R&D Program of China [grant number 2017YFC1600100]; Walmart Foundation (Project # 61626817) supported by Walmart Food Safety Collaboration Center; the Earmarked Fund for China Agriculture Research System [grant number CARS-35 to X.W.].

Institutional Review Board Statement

Not applicable.

Informed Consent Statement

Informed consent was obtained from all subjects involved in the study.

Data Availability Statement

Data are contained within the article.

Acknowledgments

The authors thank the National Key R&D Program of China, Walmart Food Safety Collaboration Center and the Earmarked Fund for China Agriculture Research System for funding this study.

Conflicts of Interest

The authors declare no conflict of interest. The funders had no role in the design of the study; in the collection, analyses, or interpretation of data; in the writing of the manuscript, or in the decision to publish the results.

References

  1. Holmes, A.H.; Moore, L.; Sundsfjord, A.; Steinbakk, M.; Regmi, S.; Karkey, A.; Guerin, P.; Piddock, L. Understanding the mechanisms and drivers of antimicrobial resistance. Lancet 2016, 387, 176–187. [Google Scholar] [CrossRef]
  2. Zucker, B.A.; Trojan, S.; Muller, W. Airborne gram-negative bacterial flora in animal houses. J. Vet. Med. B Infect. Dis. Vet. Public Health 2000, 47, 37–46. [Google Scholar] [CrossRef]
  3. Tenaillon, O.; Skurnik, D.; Picard, B.; Denamur, E. The population genetics of commensal Escherichia coli. Nat. Rev. Microbiol. 2010, 8, 207–217. [Google Scholar] [CrossRef]
  4. Riley, L.W. Pandemic lineages of extraintestinal pathogenic Escherichia coli. Clin. Microbiol. Infect. 2014, 20, 380–390. [Google Scholar] [CrossRef] [Green Version]
  5. Jang, J.; Hur, H.-G.; Sadowsky, M.; Byappanahalli, M.; Yan, T.; Ishii, S. Environmental Escherichia coli: Ecology and public health implications-a review. J. Appl. Microbiol. 2017, 123, 570–581. [Google Scholar] [CrossRef] [Green Version]
  6. Beutin, L.; Steinrück, H.; Krause, G.; Steege, K.; Haby, S.; Hultsch, G.; Appel, B. Comparative evaluation of the Ridascreen® Verotoxin enzyme immunoassay for detection of Shiga-toxin producing strains of Escherichia coli (STEC) from food and other sources. J. Appl. Microbiol. 2007, 102, 630–639. [Google Scholar] [CrossRef]
  7. Somarelli, J.; Makarewicz, J.; Sia, R.; Simon, R. Wildlife identified as major source of Escherichia coli in agriculturally dominated watersheds by BOX A1R-derived genetic fingerprints. J. Environ. Manag. 2007, 82, 60–65. [Google Scholar] [CrossRef]
  8. Duan, H.; Chai, T.; Müller, W.; Zucker, B.-A. Concentration of airborne endotoxins and airborne bacteria in Chinese rabbit houses. Berlin Munchener Tierarztliche Wochenschr. 2006, 119, 40–44. [Google Scholar]
  9. Rice, E.; Johnson, C.; Wild, D.; Reasoner, D. Survival of Escherichia coli O157: H7 in drinking water associated with a waterborne disease outbreak of hemorrhagic colitis. Lett. Appl. Microbiol. 1992, 15, 38–40. [Google Scholar] [CrossRef]
  10. Zhao, S.; Wang, C.-L.; Chang, S.-K.; Tsai, Y.-L.; Chou, C.-H. Characterization of Escherichia coli Isolated from Day-old Chicken Fluff in Taiwanese Hatcheries. Avian Dis. 2018, 63, 9–16. [Google Scholar] [CrossRef]
  11. Koutsianos, D.; Athanasiou, L.; Mossialos, D.; Koutoulis, K.C. Colibacillosis in poultry: A disease overview and the new perspectives for its control and prevention. J. Hell. Vet. Med. Soc. 2021, 71, 2425–2436. [Google Scholar] [CrossRef]
  12. Davis, M.A.; Hancock, D.D.; Rice, D.H.; Call, D.R.; DiGiacomo, R.; Samadpour, M.; Besser, T.E. Feedstuffs as a vehicle of cattle exposure to Escherichia coli O157:H7 and Salmonella enterica. Vet. Microbiol. 2003, 95, 199–210. [Google Scholar] [CrossRef]
  13. Chuppava, B.; Keller, B.; El-Wahab, A.A.; Sürie, C.; Visscher, C. Resistance Reservoirs and Multi-Drug Resistance of Commensal Escherichia coli From Excreta and Manure Isolated in Broiler Houses with Different Flooring Designs. Front. Microbiol. 2019, 10, 2633. [Google Scholar] [CrossRef] [Green Version]
  14. Selvam, A.; Xu, D.; Zhao, Z.; Wong, J.W. Fate of tetracycline, sulfonamide and fluoroquinolone resistance genes and the changes in bacterial diversity during composting of swine manure. Bioresour. Technol. 2012, 126, 383–390. [Google Scholar] [CrossRef]
  15. Colomer-Lluch, M.; Imamovic, L.; Jofre, J.; Muniesa, M. Bacteriophages Carrying Antibiotic Resistance Genes in Fecal Waste from Cattle, Pigs, and Poultry. Antimicrob. Agents Chemother. 2011, 55, 4908–4911. [Google Scholar] [CrossRef] [PubMed] [Green Version]
  16. Hamscher, G.; Sczesny, S.; Höper, H.; Nau, H. Determination of Persistent Tetracycline Residues in Soil Fertilized with Liquid Manure by High-Performance Liquid Chromatography with Electrospray Ionization Tandem Mass Spectrometry. Anal. Chem. 2002, 74, 1509–1518. [Google Scholar] [CrossRef] [PubMed]
  17. Poudel, A.; Hathcock, T.; Butaye, P.; Kang, Y.; Price, S.; Macklin, K.; Walz, P.; Cattley, R.; Kalalah, A.; Adekanmbi, F.; et al. Multidrug-Resistant Escherichia coli, Klebsiella pneumoniae and Staphylococcus spp. in Houseflies and Blowflies from Farms and Their Environmental Settings. Int. J. Environ. Res. Public Health 2019, 16, 3583. [Google Scholar] [CrossRef] [Green Version]
  18. Adenipekun, E.O.; Jackson, C.R.; Oluwadun, A.; Iwalokun, B.; Frye, J.; Barrett, J.B.; Hiott, L.M.; Woodley, T.A. Prevalence and Antimicrobial Resistance inEscherichia colifrom Food Animals in Lagos, Nigeria. Microb. Drug Resist. 2015, 21, 358–365. [Google Scholar] [CrossRef]
  19. Nishikawa, R.; Murase, T.; Ozaki, H. Plasmid-mediated quinolone resistance in Escherichia coli isolates from commercial broiler chickens and selection of fluoroquinolone-resistant mutants. Poult. Sci. 2019, 98, 5900–5907. [Google Scholar] [CrossRef]
  20. Han, T.; Zhang, Q.; Liu, N.; Wang, J.; Li, Y.; Huang, X.; Liu, J.; Wang, J.; Qu, Z.; Qi, K. Changes in antibiotic resistance of Escherichia coli during the broiler feeding cycle. Poult. Sci. 2020, 99, 6983–6989. [Google Scholar] [CrossRef]
  21. Koutsianos, D.; Gantelet, H.; Franzo, G.; Lecoupeur, M.; Thibault, E.; Cecchinato, M.; Koutoulis, K.C. An Assessment of the Level of Protection Against Colibacillosis Conferred by Several Autogenous and/or Commercial Vaccination Programs in Conventional Pullets upon Experimental Challenge. Vet. Sci. 2020, 7, 80. [Google Scholar] [CrossRef]
  22. Ostrolenk, M.; Welch, H. The House Fly as a Vector of Food Poisoning Organisms in Food Producing Establishments. Am. J. Public Health Nations Health 1942, 32, 487–494. [Google Scholar] [CrossRef] [PubMed]
  23. Wales, A.D.; Davies, R.H. Co-Selection of Resistance to Antibiotics, Biocides and Heavy Metals, and Its Relevance to Foodborne Pathogens. Antibiotics 2015, 4, 567–604. [Google Scholar] [CrossRef] [Green Version]
  24. Van Boeckel, T.P.; Brower, C.; Gilbert, M.; Grenfell, B.T.; Levin, S.A.; Robinson, T.P.; Teillant, A.; Laxminarayan, R. Global trends in antimicrobial use in food animals. Proc. Natl. Acad. Sci. USA 2015, 112, 5649–5654. [Google Scholar] [CrossRef] [Green Version]
  25. Graham, J.P.; Eisenberg, J.N.; Trueba, G.; Zhang, L.; Johnson, T. Small-Scale Food Animal Production and Antimicrobial Resistance: Mountain, Molehill, or Something in-between? Environ. Health Perspect. 2017, 125, 104501. [Google Scholar] [CrossRef] [PubMed] [Green Version]
  26. Eshar, D.; Wright, L.T.; McCullough, C.E.; KuKanich, B. Pharmacokinetics of enrofloxacin and its metabolite ciprofloxacin following single-dose subcutaneous injection in black-tailed prairie dogs (Cynomys ludovicianus). Am. J. Vet. Res. 2018, 79, 658–663. [Google Scholar] [CrossRef]
  27. Agius, J.E.; Kimble, B.; Govendir, M.; Rose, K.; Pollard, C.-L.; Phalen, D.N. Pharmacokinetic profile of enrofloxacin and its metabolite ciprofloxacin in Asian house geckos (Hemidactylus frenatus) after single-dose oral administration of enrofloxacin. Vet. Anim. Sci. 2020, 9, 100116. [Google Scholar] [CrossRef] [PubMed]
  28. Schwarz, S.; Kehrenberg, C.; Doublet, B.; Cloeckaert, A. Molecular basis of bacterial resistance to chloramphenicol and florfenicol. FEMS Microbiol. Rev. 2004, 28, 519–542. [Google Scholar] [CrossRef] [Green Version]
  29. Grossman, T.H. Tetracycline Antibiotics and Resistance. Cold Spring Harb. Perspect. Med. 2016, 6, a025387. [Google Scholar] [CrossRef] [Green Version]
  30. Takeuchi, K.; Tomita, H.; Fujimoto, S.; Kudo, M.; Kuwano, H.; Ike, Y. Drug resistance ofEnterococcus faeciumclinical isolates and the conjugative transfer of gentamicin and erythromycin resistance traits. FEMS Microbiol. Lett. 2005, 243, 347–354. [Google Scholar] [CrossRef] [PubMed] [Green Version]
  31. Cantón, R.; Coque, T.M. The CTX-M β-lactamase pandemic. Curr. Opin. Microbiol. 2006, 9, 466–475. [Google Scholar] [CrossRef]
  32. Abdi-Hachesoo, B.; Asasi, K.; Sharifiyazdi, H. Rapid detection of Escherichia coli gyrA and parC mutants in one-day-old broiler chicks in Iran. Vet. Ital. 2013, 49, 291–297. [Google Scholar]
  33. Lee, Y.-J.; Cho, J.-K.; Kim, K.-S.; Tak, R.-B.; Kim, A.-R.; Kim, J.-W.; Im, S.-K.; Kim, B.-H. Fluoroquinolone resistance and gyrA and parC mutations of Escherichia coli isolated from chicken. J. Microbiol. 2005, 43, 391–397. [Google Scholar]
  34. Oikarainen, P.E.; Pohjola, L.K.; Pietola, E.S.; Heikinheimo, A. Direct vertical transmission of ESBL/pAmpC-producing Escherichia coli limited in poultry production pyramid. Vet. Microbiol. 2019, 231, 100–106. [Google Scholar] [CrossRef]
  35. Sabat, G.; Rose, P.; Hickey, W.J.; Harkin, J.M. Selective and Sensitive Method for PCR Amplification of Escherichia coli 16S rRNA Genes in Soil. Appl. Environ. Microbiol. 2000, 66, 844–849. [Google Scholar] [CrossRef] [PubMed] [Green Version]
  36. M100-S11. Performance standards for antimicrobial susceptibility testing. Clin. Microbiol. Newsl. 2001, 23, 49. [Google Scholar] [CrossRef]
  37. Lorenzo-Seva, U.; Ferrando, P.J. POLYMAT-C: A comprehensive SPSS program for computing the polychoric correlation matrix. Behav. Res. Methods 2014, 47, 884–889. [Google Scholar] [CrossRef] [PubMed]
  38. Petroczi, A.; Naughton, D. Mercury, cadmium and lead contamination in seafood: A comparative study to evaluate the usefulness of Target Hazard Quotients. Food Chem. Toxicol. 2009, 47, 298–302. [Google Scholar] [CrossRef]
  39. Park, C.H.; Robicsek, A.; Jacoby, G.A.; Sahm, D.; Hooper, D.C. Prevalence in the United States of aac(6 ′ )—Ib—cr Encoding a Ciprofloxacin-Modifying Enzyme. Antimicrob. Agents Chemother. 2006, 50, 3953–3955. [Google Scholar] [CrossRef] [Green Version]
  40. Ling-Chao, K.; Zhi-Guo, L.; Rui-Hua, Z.; Yu-Xiang, J.; Ming-Jie, M.; Cui-Ping, G.; Yan-Li, Z.; Zhi-Jing, X.; Shi-Jin, J. Detection of Plasmid-Mediated Quinolone Resistance Genes in Avian Escherichia coli Isolates from Shandong Province in 2012−2013. Chin. J. Anim. Infect. Dis. 2014, 22, 56–62. [Google Scholar]
Figure 1. MIC value distribution of 983 strains of E. coli to enrofloxacin in four breeding.
Antibiotics 10 01222 g001
Figure 2. The resistance rates of 107 strains of E. coli to 10 kinds of antibiotics.
Antibiotics 10 01222 g002
Figure 3. Resistance rates of 107 strains of E. coli to different antibiotics in different.
Antibiotics 10 01222 g003
Figure 4. Resistance rates of 107 strains of E. coli from different sources to different antibiotics.
Antibiotics 10 01222 g004
Figure 5. Detection rate of each drug resistance gene in E. coli from different cycles and sources. (ad) respectively represent the first cycle to the fourth cycle.
Antibiotics 10 01222 g005
Figure 6. The proportion of the detection rate of antibiotic-resistant genes in E. coli from environmental sources in different cycles. (ad) respectively represent the first cycle to the fourth cycle. M: Biological media; G: Feed; H: Water source; I: Fecal water; J: Dust; K: Feces; l: Tools.
Antibiotics 10 01222 g006
Figure 7. (a) The proportion of strains with positive drug resistance genes from chicken seedlings in different cycles. (b) Proportion of all positive strains of each drug resistance gene from feed in different cycles. (c) Proportion of all positive strains of each drug resistance gene from fecal water and feces in different cycles.
Antibiotics 10 01222 g007
Table 1. Isolation rate of E. coli in four breeding cycles (unit: %).
Sampling TimeChicken EnvironmentHuman Total
Cycle 1 1.12–1.2672.78(131/180)65.00(117/180)80.00(8/10)66.49(246/370)
Cycle 2 4.02–4.1658.33(105/180)45.56(82/180)50.00(5/10)51.89(192/370)
Cycle 3 7.14–7.2881.67(147/180)57.14(120/210)80.00(8/10)68.75(275/400)
Cycle 4 9.12–9.2686.11(155/180)50.00(105/210)100.00(10/10)67.50(270/400)
Total74.72(538/720)54.36(424/780)77.50(31/40)63.83(983/1540)
Note: The brackets indicate the ratio of the number of resistant bacteria to the total number of strains.
Table 2. Isolation rate of E. coli from different sources in four cycles (unit: %).
CycleChickenEnvironmentHuman
ABCDEFGHIJKLMN
180.0086.6766.6770.0053.3380.0050.0063.3383.3333.3380.0080.00 80.00
240.0066.6773.3376.6743.3350.0066.6723.3356.6746.6736.6743.33 50.00
396.6786.6780.0090.0050.0086.6790.0016.6733.3363.3336.6786.6773.3380.00
493.3360.0096.6793.3386.6786.6753.336.6780.0093.3340.0043.3333.33100.00
Four-cycle
average
77.5075.0079.1782.5058.3375.8465.0027.5063.3359.1748.3463.3353.3377.50
Note: A: Chicken seedlings (1 day old); B: The day before medication (8 days old); C: First day of medication (9 days old); D: Third day of medication (11 days old); E: One day after medication (13 days old); F: Three days after medication (15 days old); G: feed; H: water source; I: Fecal water; J: Dust; K: Feces; L: Tool; M: Biological vector; N: Breeders. The samples of environment and human and chicken seedlings were collected at the same time. Blank data means that no samples had been collected in this link.
Table 3. Resistance rate of E. coli isolated in four breeding cycles to enrofloxacin (unit: %).
CycleChicken SeedlingsThe Day before MedicationFirst Day of MedicationThird Day of MedicationOne Day after MedicationThree Days after MedicationEnvironmentHumanOverall Average
179.1788.46100.00100.00100.00100.0096.21100.0095.20
2100.00100.00100.00100.0092.31100.0097.56100.0098.44
393.1096.15100.00100.00100.00100.00100.00100.0098.90
489.2995.0096.55100.00100.00100.0097.14100.0095.20
Table 4. Nonparametric correlation analysis of antibiotic resistance.
ENRCIPAMCAMPDOTEFFCCNCHLERY
Kendall tau_bENRCorrelation coefficient1.0000.190 *0.172−0.0650.034−0.0100.0270.100−0.0540.015
Sig.(Double tail).0.0210.0710.4980.6930.9130.7620.2350.5500.862
N97979190979197979692
CIPCorrelation coefficient0.190 *1.0000.0790.0080.0340.1040.284 **0.318 **0.174 *0.156
Sig.(Double tail)0.021.0.3660.9300.6630.2240.0010.0000.0360.056
N97107101100107101106106105101
AMCCorrelation coefficient0.1720.0791.000−0.0580.1310.155−0.1260.028−0.1330.034
Sig.(Double tail)0.0710.366.0.5670.1520.1170.1890.7550.1660.721
N9110110195101971001009996
AMPCorrelation coefficient−0.0650.008−0.0581.0000.1380.0640.0060.0320.0790.026
Sig.(Double tail)0.4980.9300.567.0.1360.5230.9550.7240.4160.781
N90100951001009599999896
DOCorrelation coefficient0.0340.0340.1310.1381.0000.349 **0.1590.0440.285 **0.231 **
Sig.(Double tail)0.6930.6630.1520.136.0.0000.0660.5940.0010.007
N97107101100107101106106105101
TECorrelation coefficient−0.0100.1040.1550.0640.349 **1.0000.270 **0.0730.187 *0.197 *
Sig.(Double tail)0.9130.2240.1170.5230.000.0.0040.4100.0470.032
N9110197951011011001009997
FFCCorrelation coefficient0.0270.284 **−0.1260.0060.1590.270 **1.0000.224 **0.352 **0.312 **
Sig.(Double tail)0.7620.0010.1890.9550.0660.004.0.0090.0000.001
N9710610099106100106106104100
CNCorrelation coefficient0.1000.318 **0.0280.0320.0440.0730.224 **1.0000.255 **0.385 **
Sig.(Double tail)0.2350.0000.7550.7240.5940.4100.009.0.0030.000
N9710610099106100106106104100
CHLCorrelation coefficient−0.0540.174 *−0.1330.0790.285 **0.187 *0.352 **0.255 **1.0000.285 **
Sig.(Double tail)0.5500.0360.1660.4160.0010.0470.0000.003.0.001
N96105999810599104104105100
ERYCorrelation coefficient0.0150.1560.0340.0260.231 **0.197 *0.312 **0.385 **0.285 **1.000
Sig.(Double tail)0.8620.0560.7210.7810.0070.0320.0010.0000.001.
N92101969610197100100100101
Note: * At 0.05 level (two tailed), the correlation was significant. ** At 0.01 level (two tailed), the correlation was significant.
Table 5. Detection rate of drug resistance genes in different cycles of E. coli (unit: %).
Gene NameCycle 1Cycle 2Cycle 3Cycle 4
qnrA031.25(60/192)00
qnrB1.21(3/246)57.29(110/192)00
qnrC00.05(1/192)00
qnrD1.63(4/246)40.10(77/192)40.00(110/275)10.37(28/270)
qnrS71.54(176/246)45.31(87/192)82.91(228/275)60.00(162/270)
oqxA64.23(158/246)69.27(133/192)70.55(194/275)68.15(184/270)
oqxB45.12(111/246)27.08(52/192)45.45(125/275)22.96(62/270)
qepA0015.64(43/275)15.19(41/270)
aac(6)-lb-cr50.41(124/246)84.38(162/192)76.36(210/275)47.04(127/270)
Note: The brackets indicate the ratio of the strains carrying the drug resistance gene to the total number of strains.
Publisher’s Note: MDPI stays neutral with regard to jurisdictional claims in published maps and institutional affiliations.

