Design and Detection of Cyanide Raman Tag pH-Responsive SERS Probes


 and
and
Abstract
1. Introduction
2. Materials and Methods
2.1. Materials
2.2. Test Instrumentation
2.3. Synthesis of AuNPs [54]
2.4. Preparation of SERS Substrates
2.5. Preparation of SERS Probe and Measurements
3. Results and Discussion
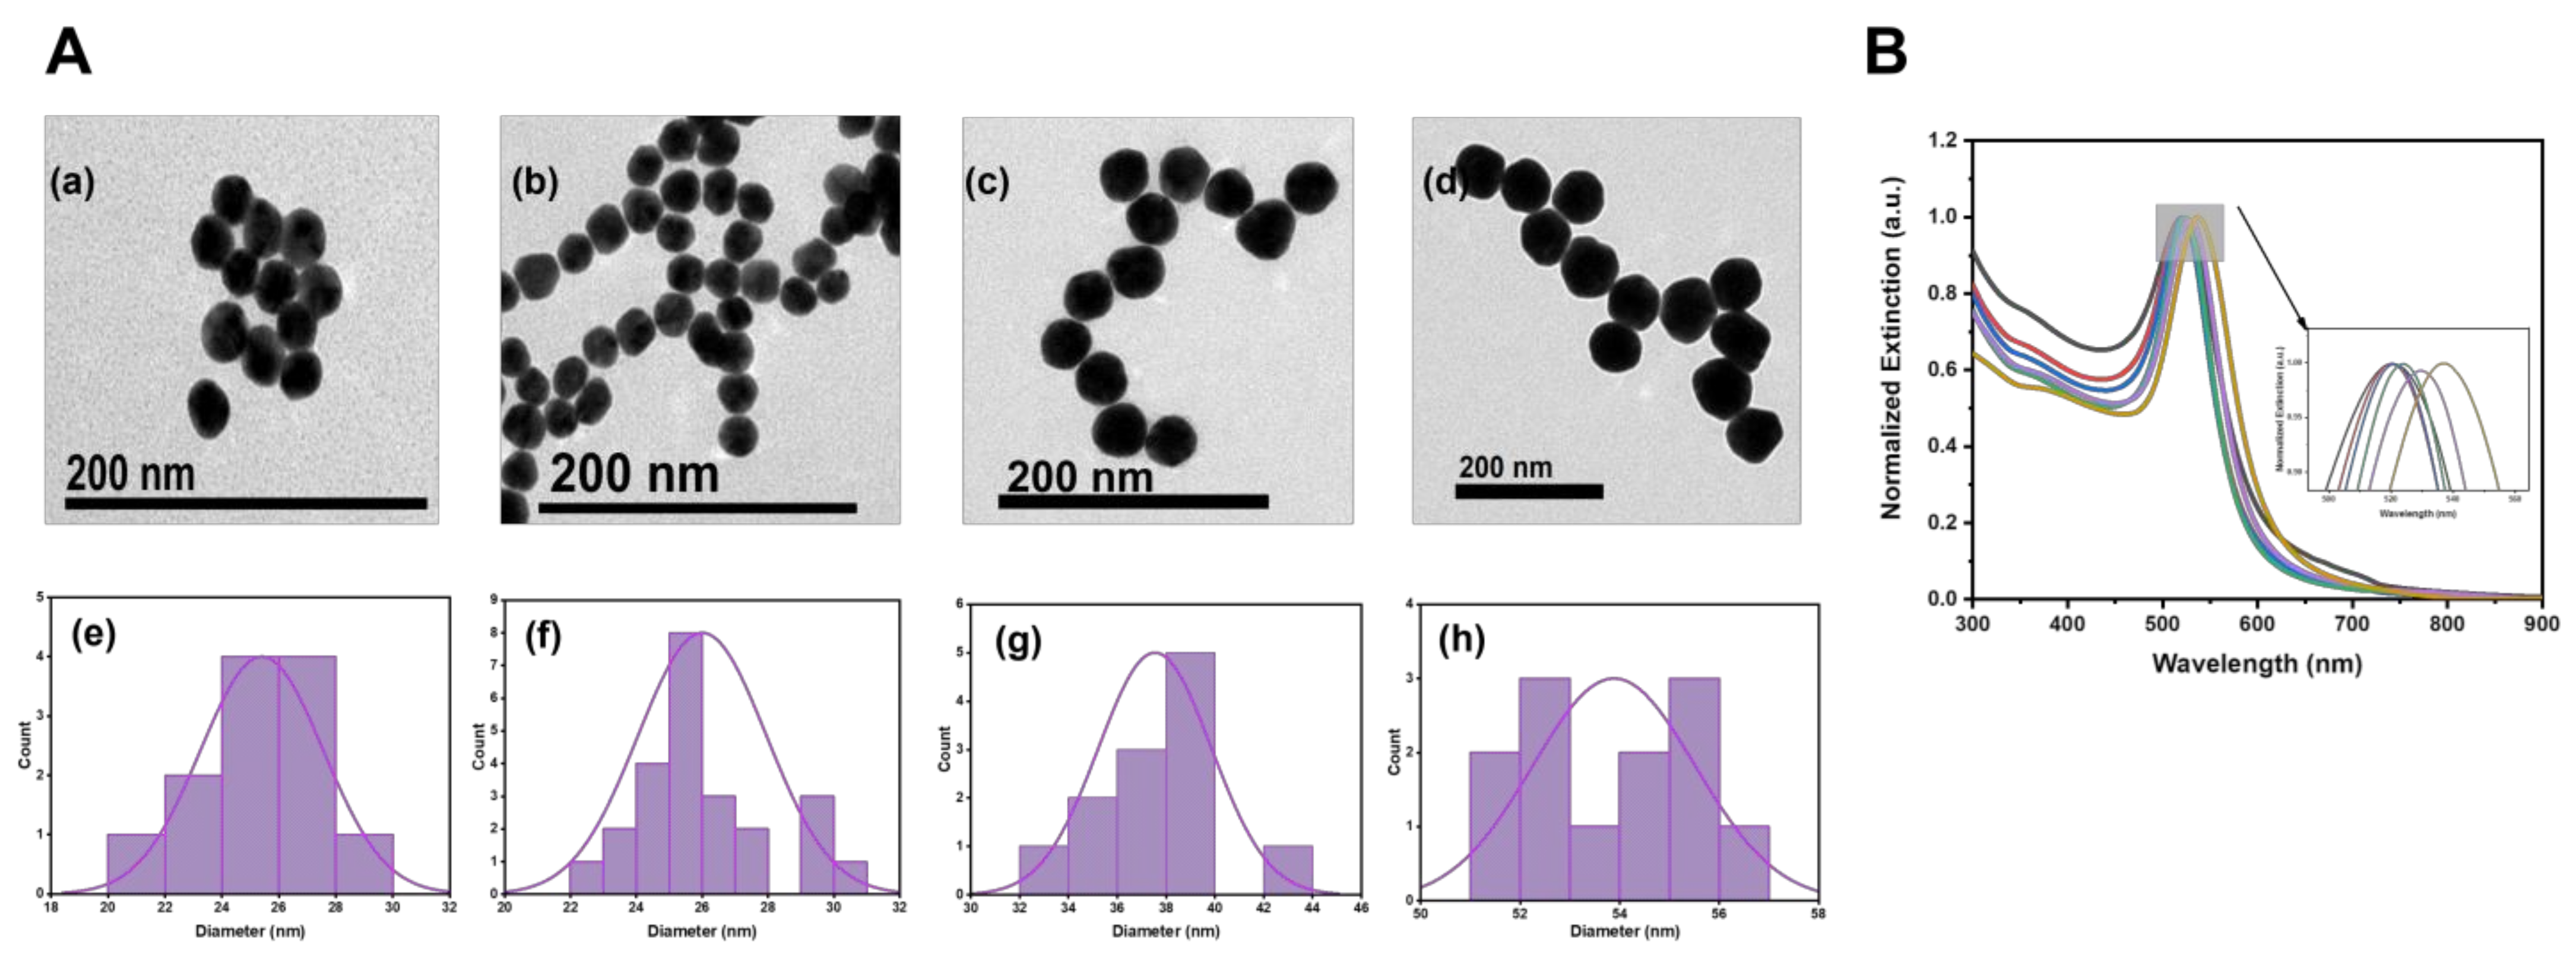
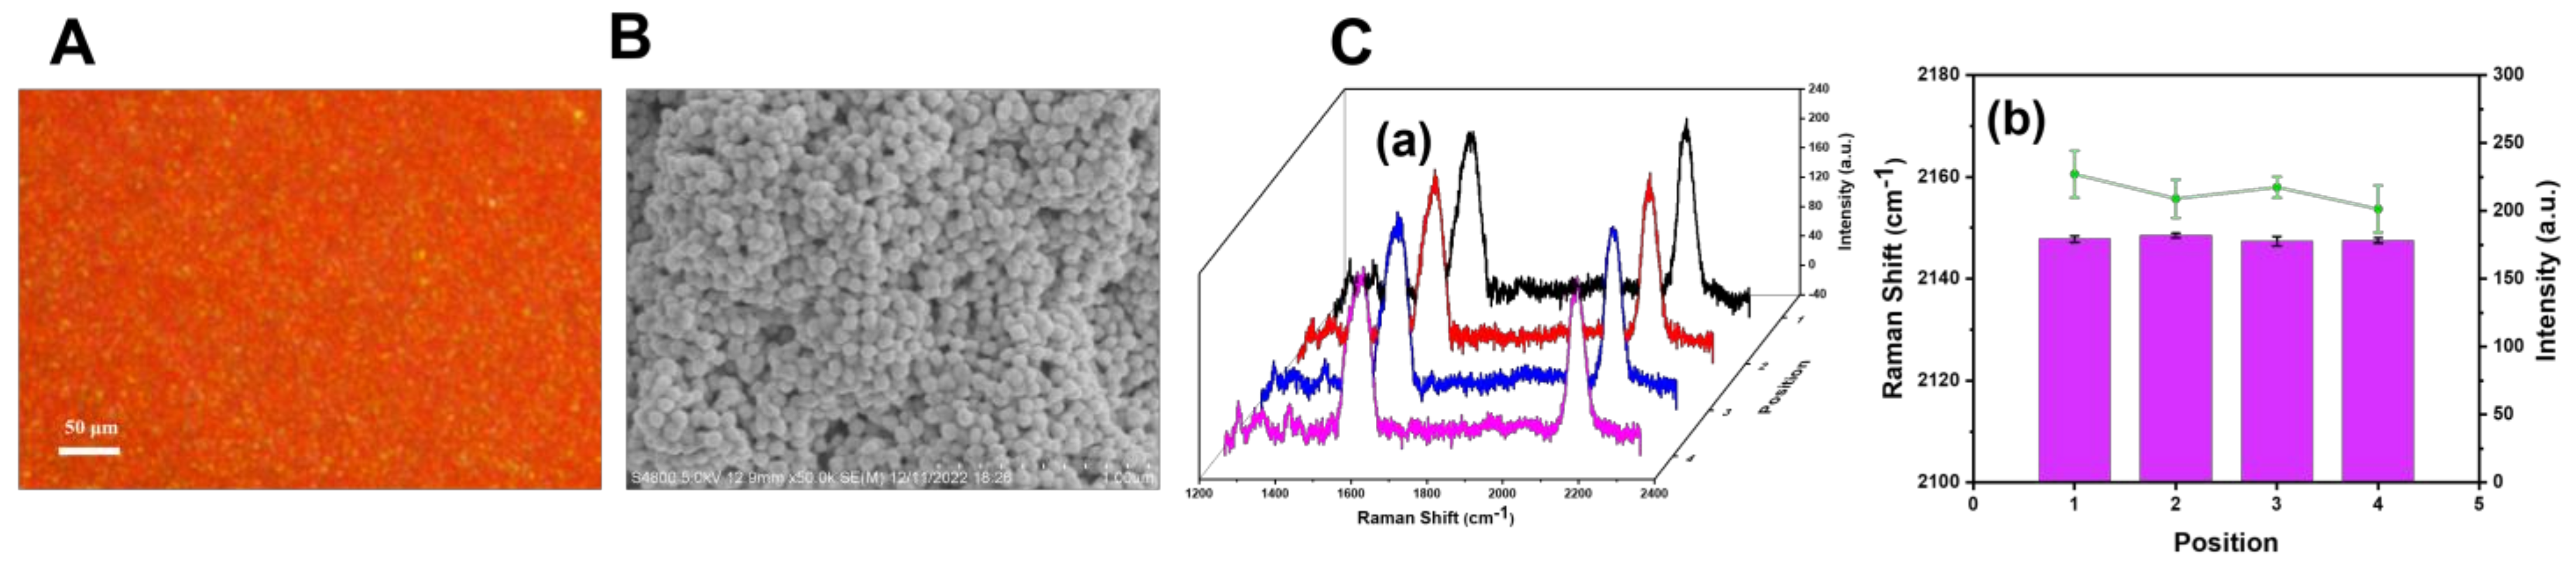
3.1. Characterization of the AuNPs
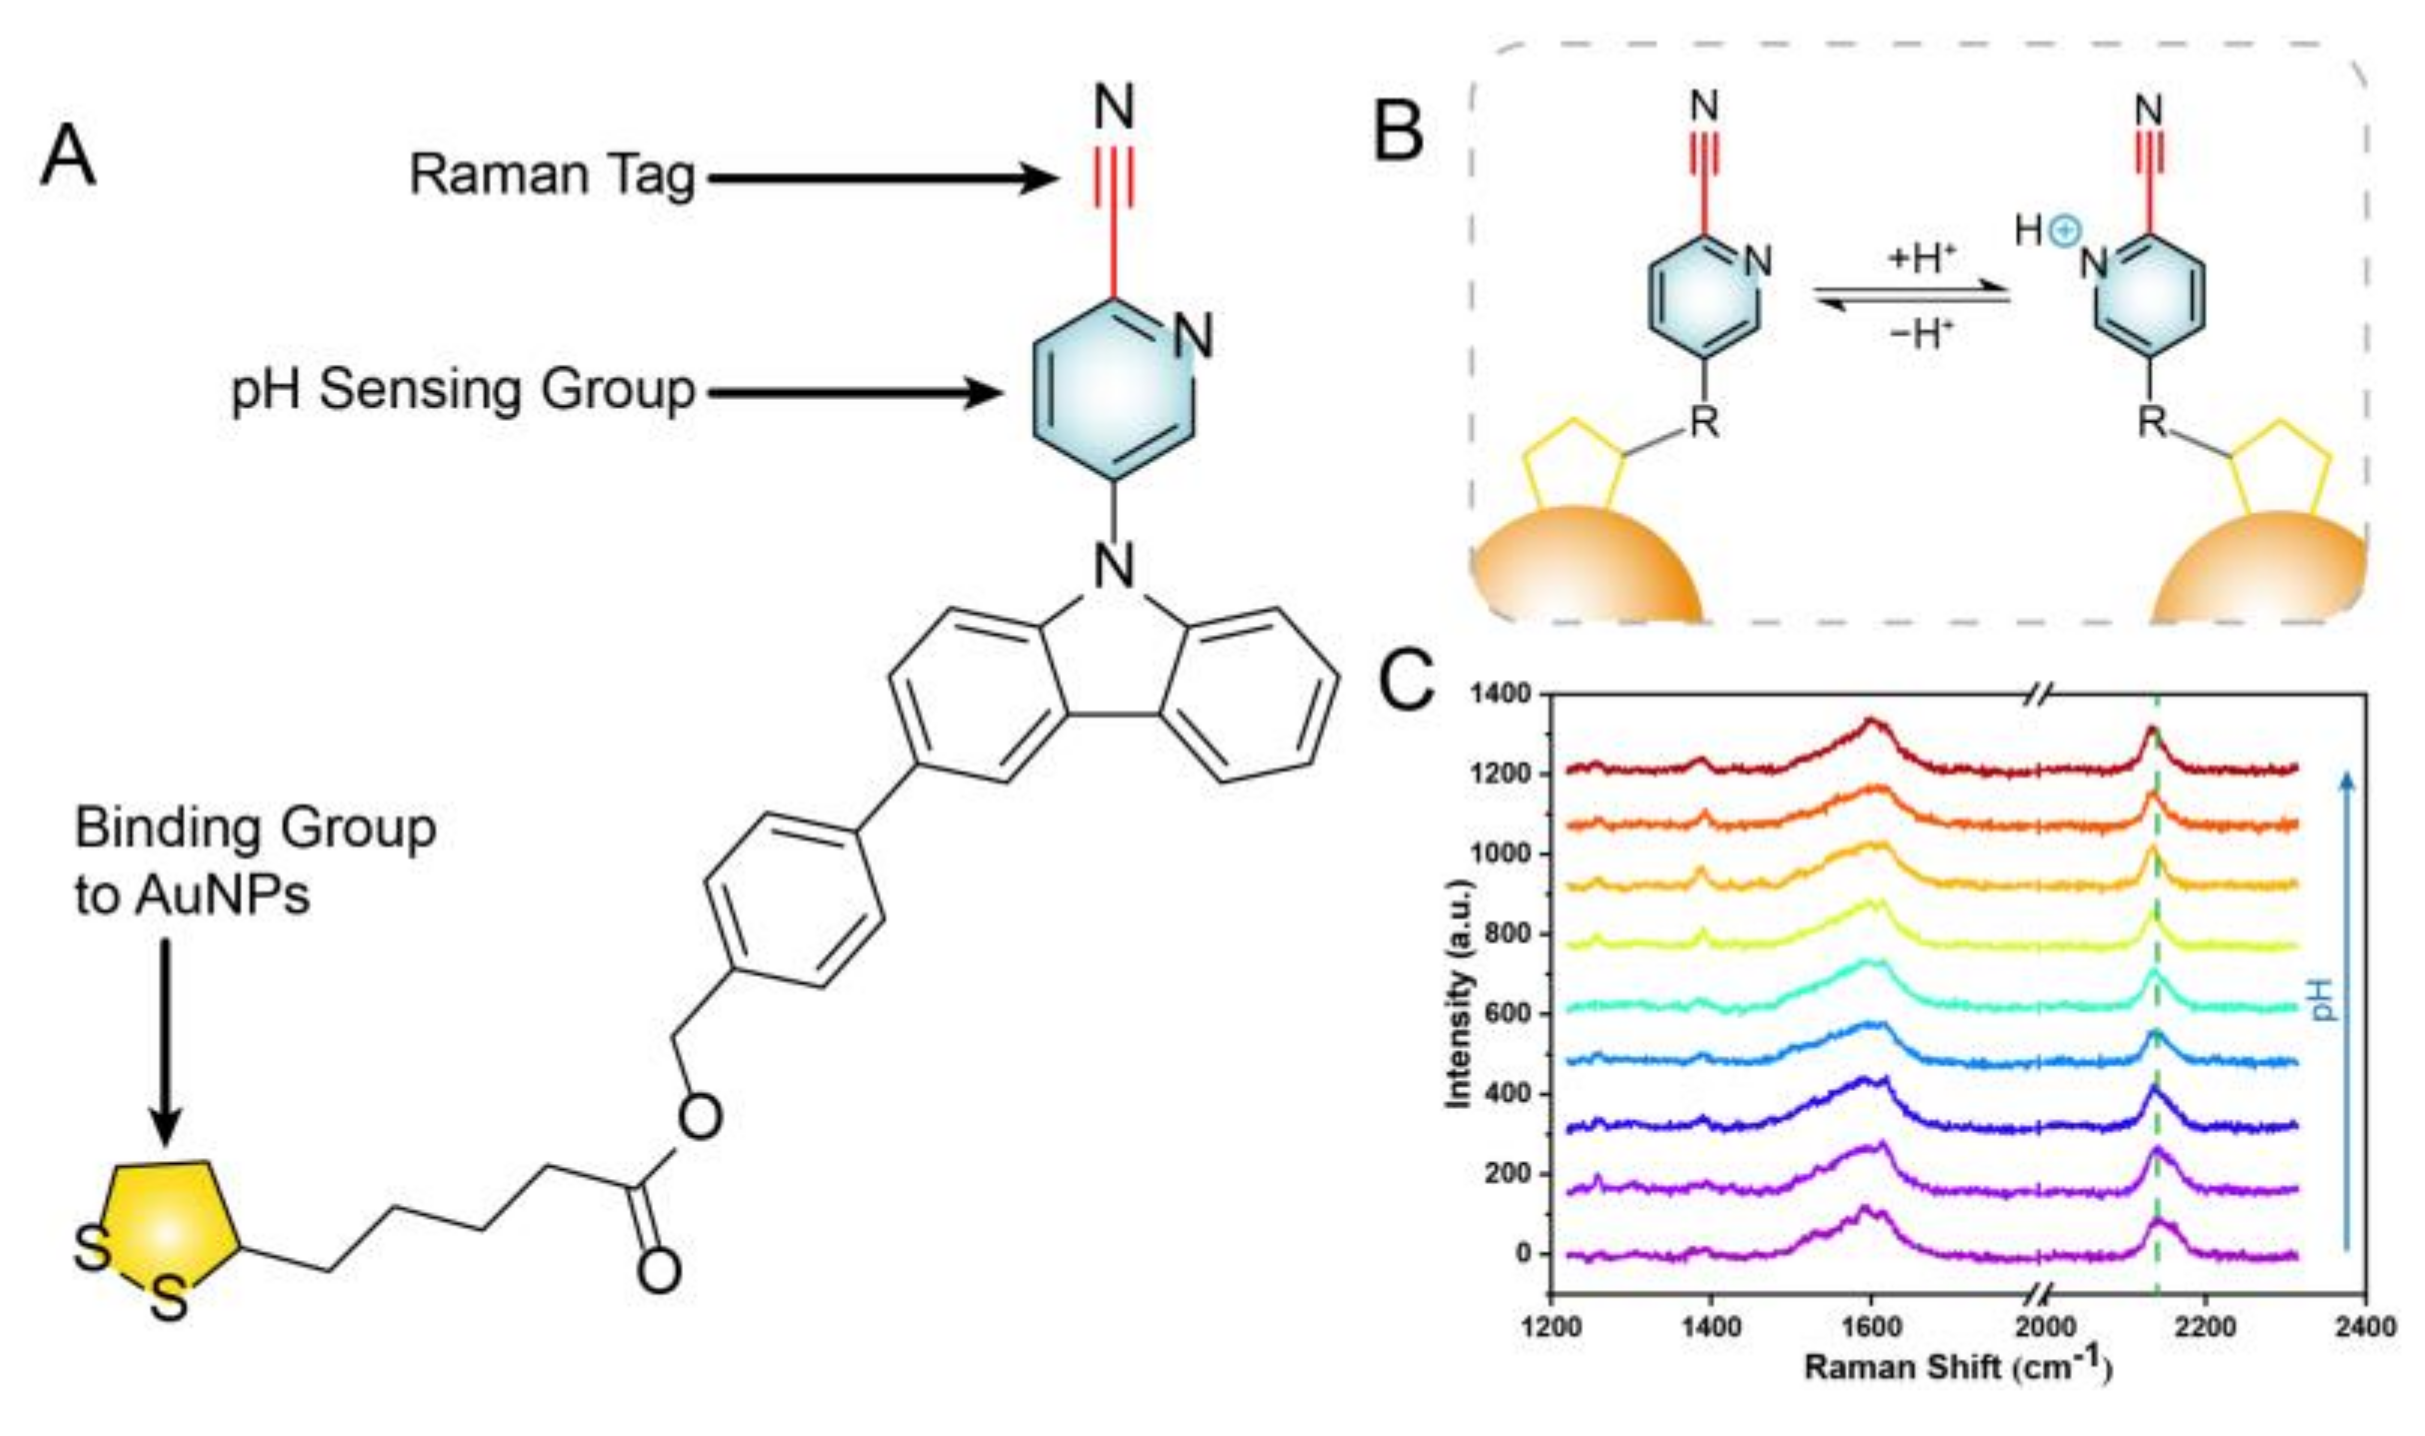
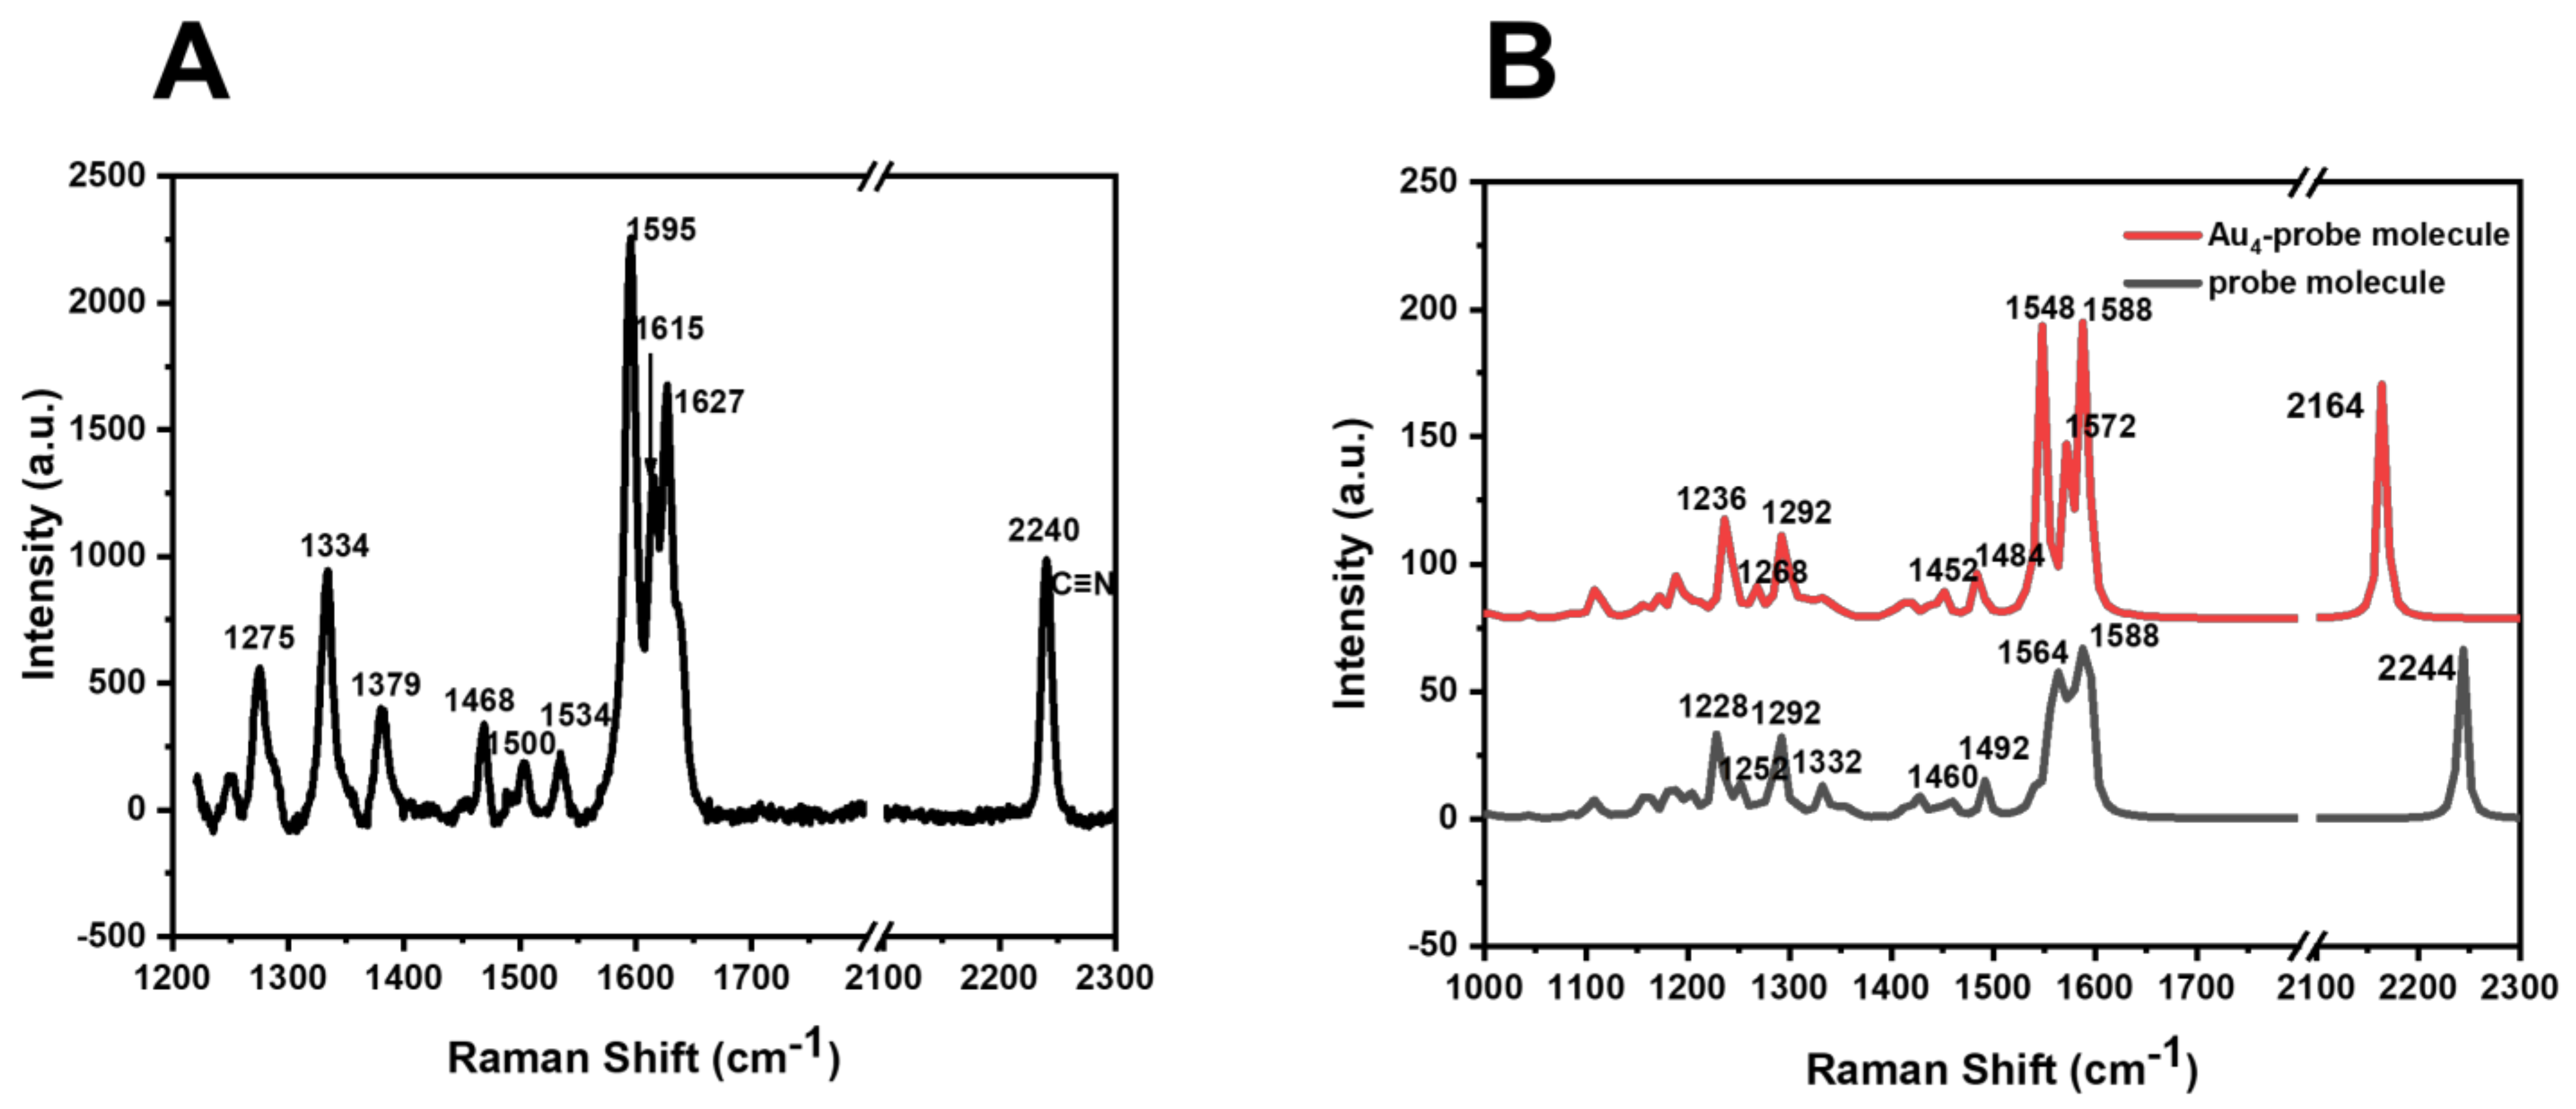
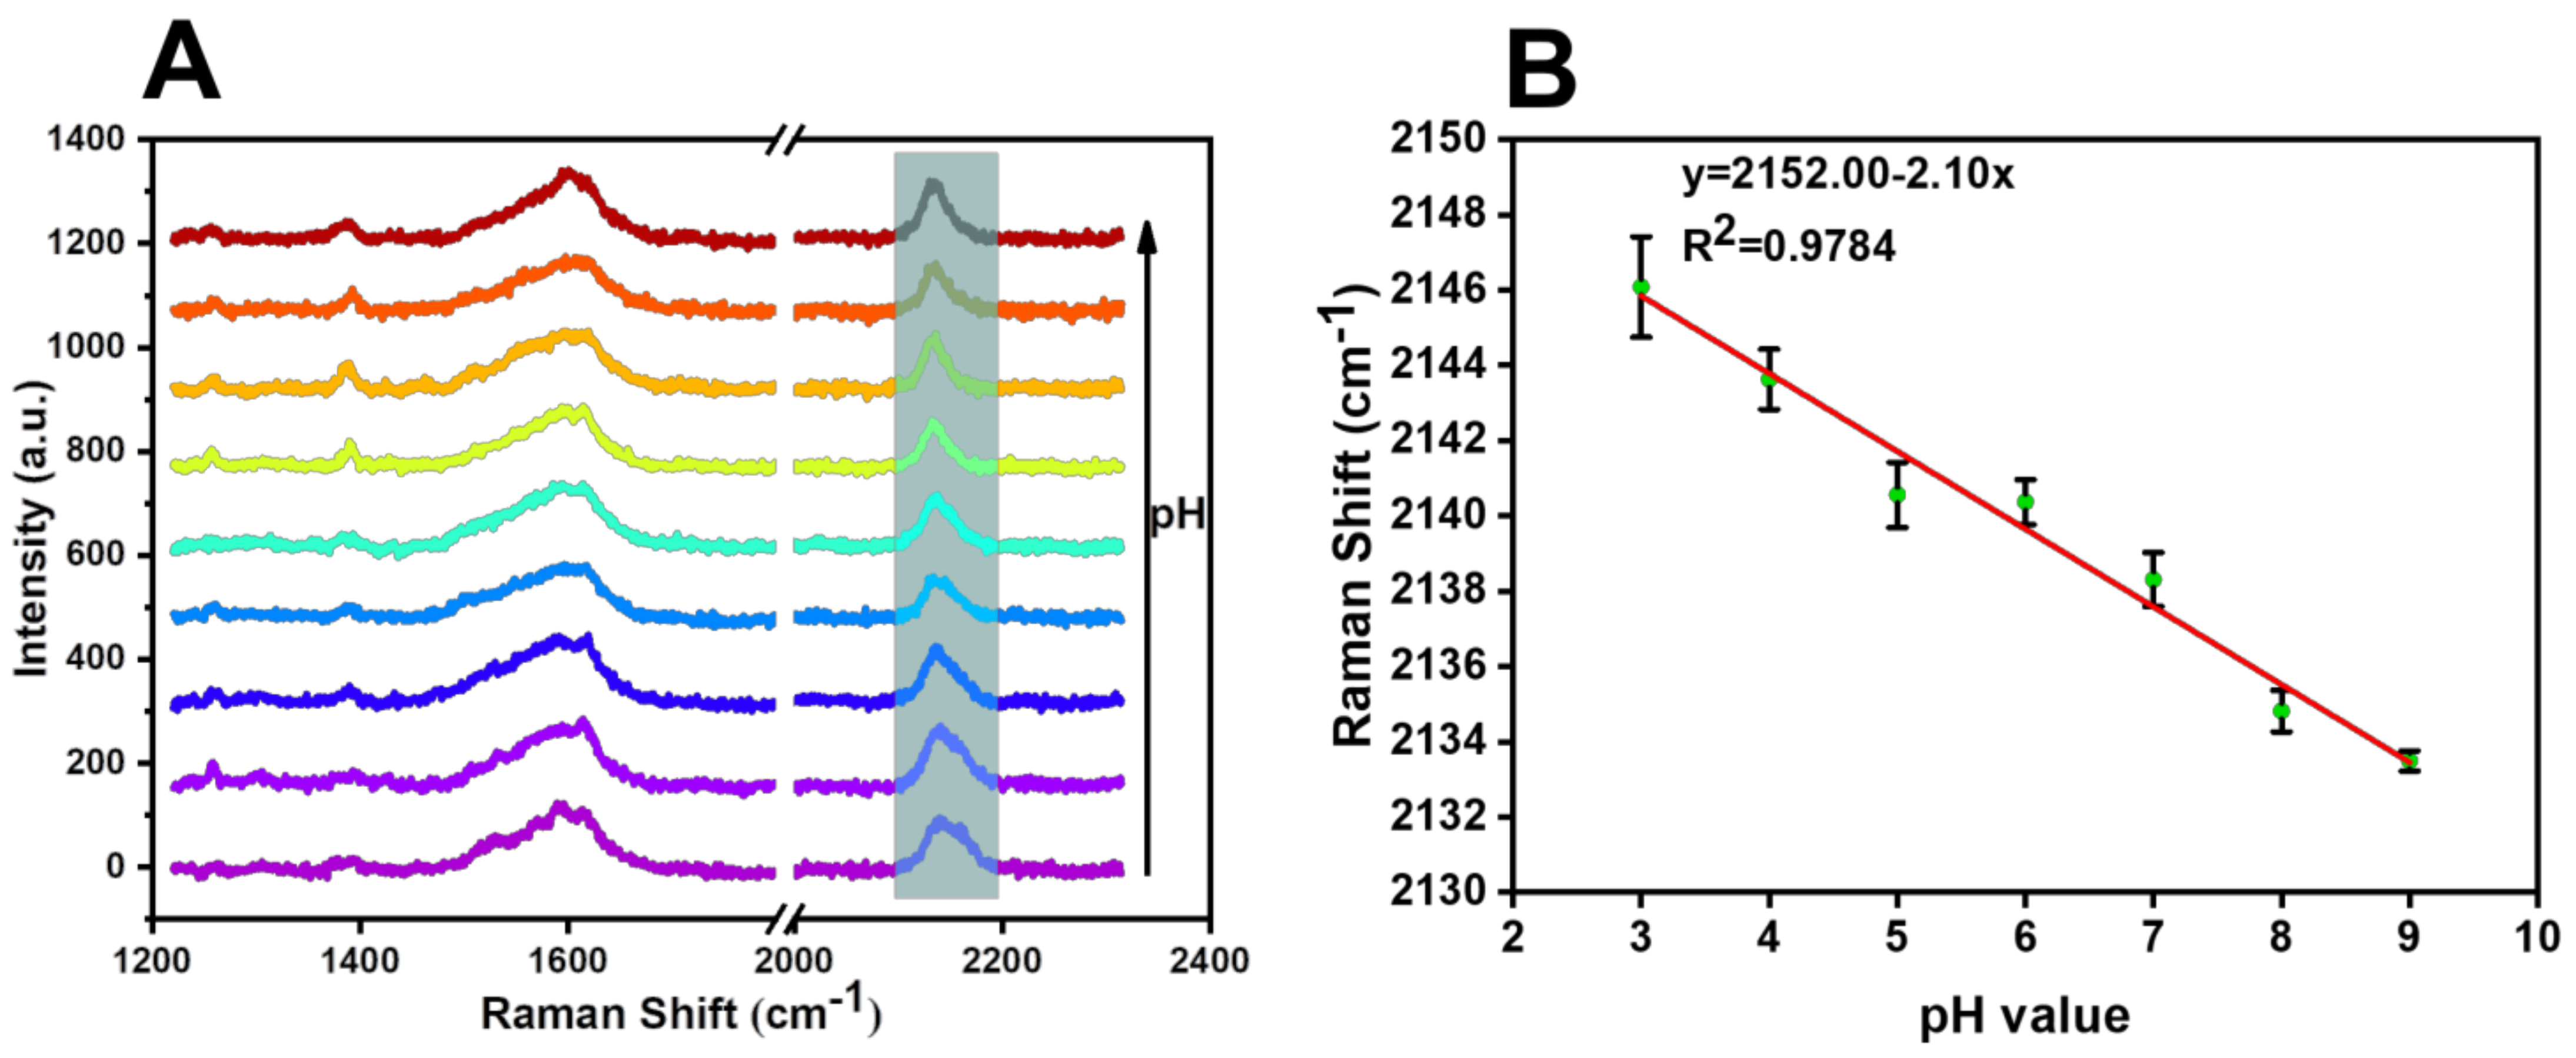
3.2. Characterization of pH Sensitive Molecule
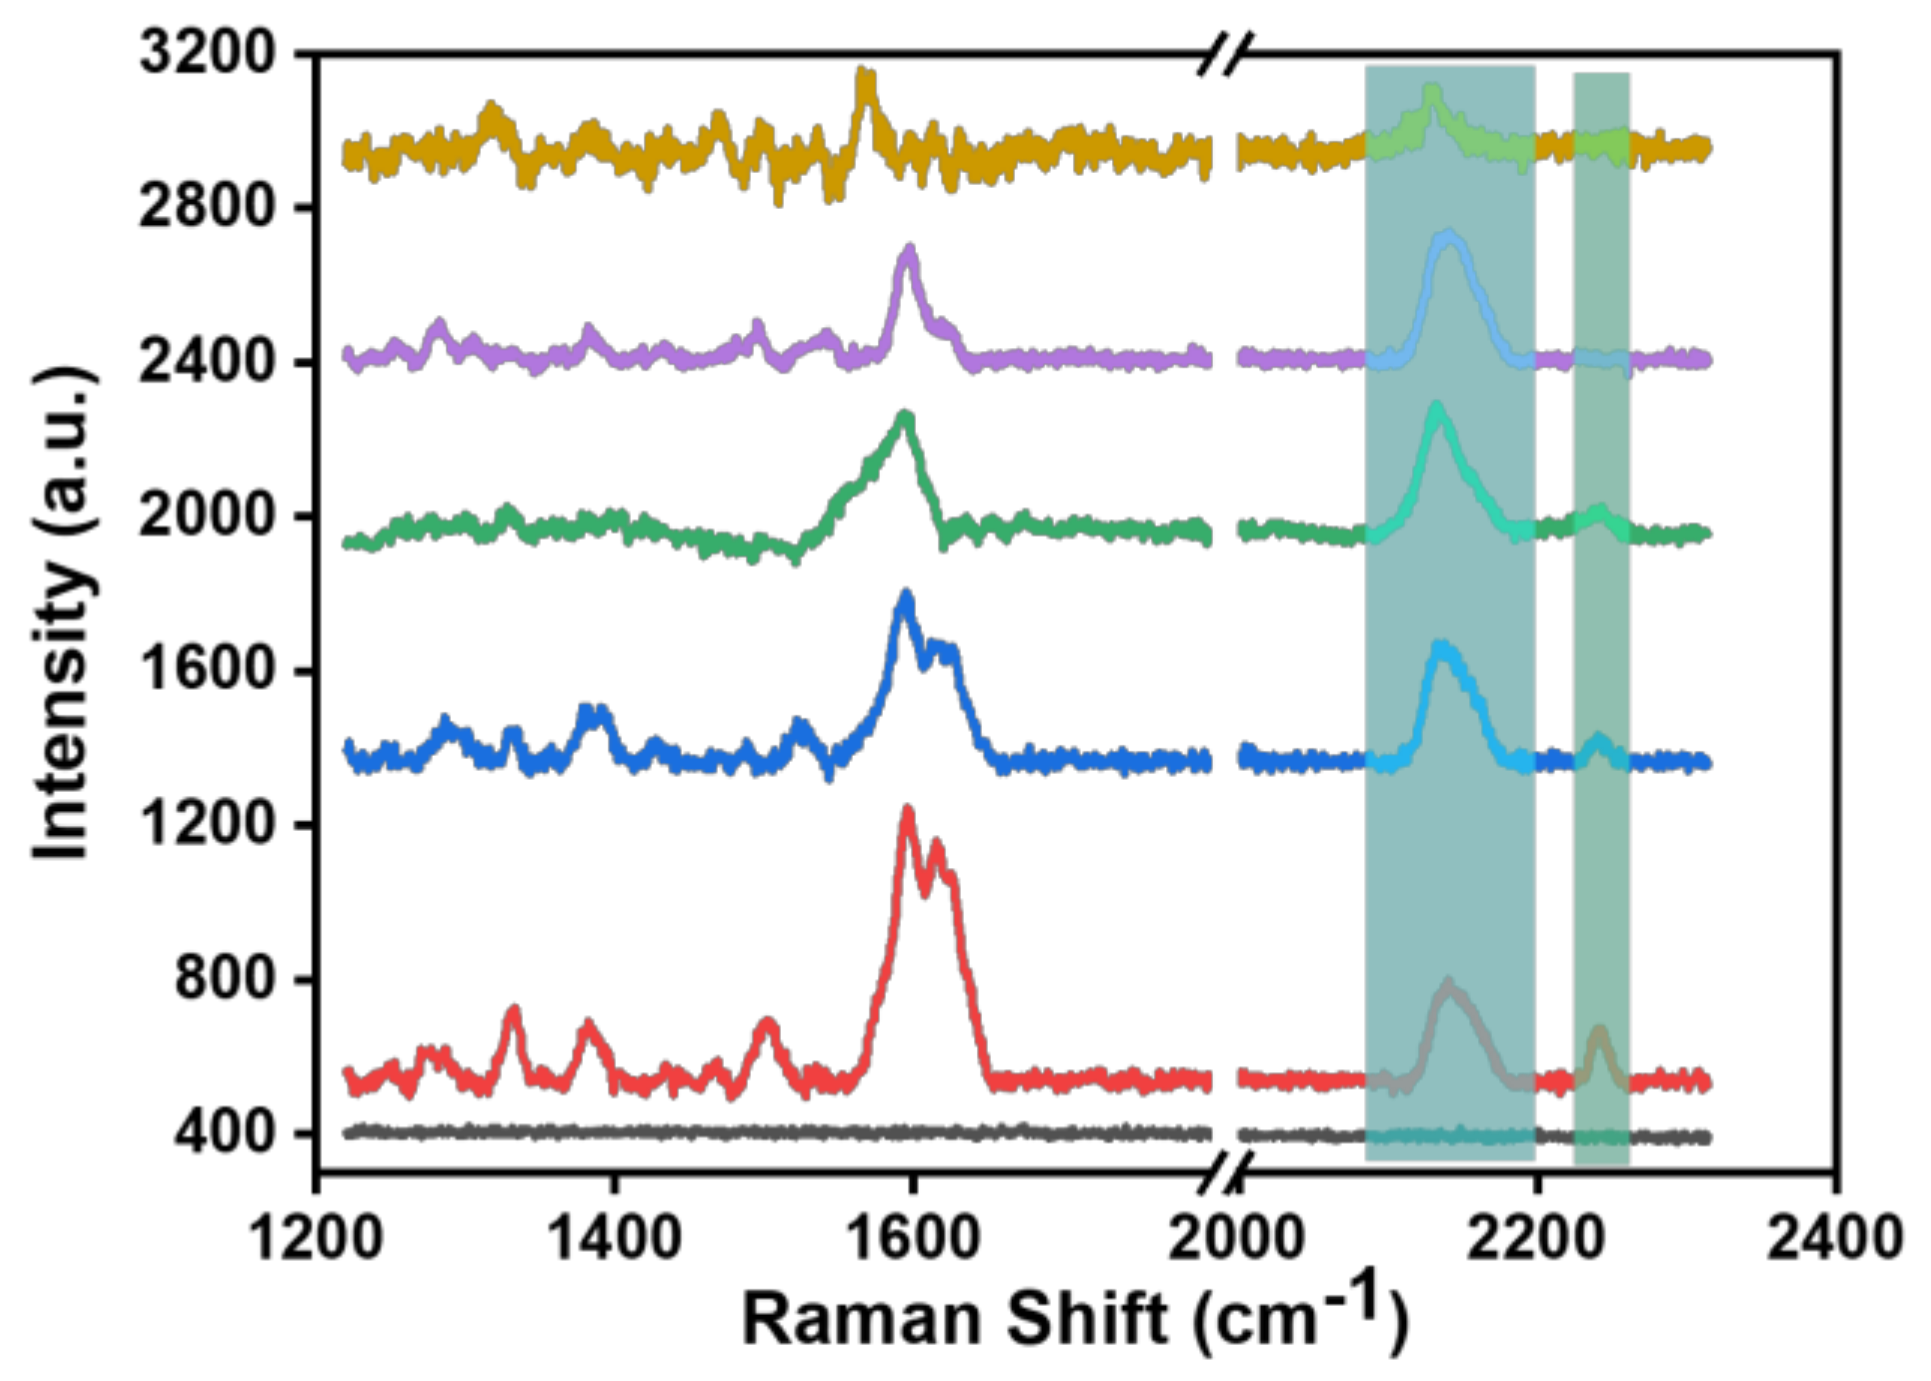
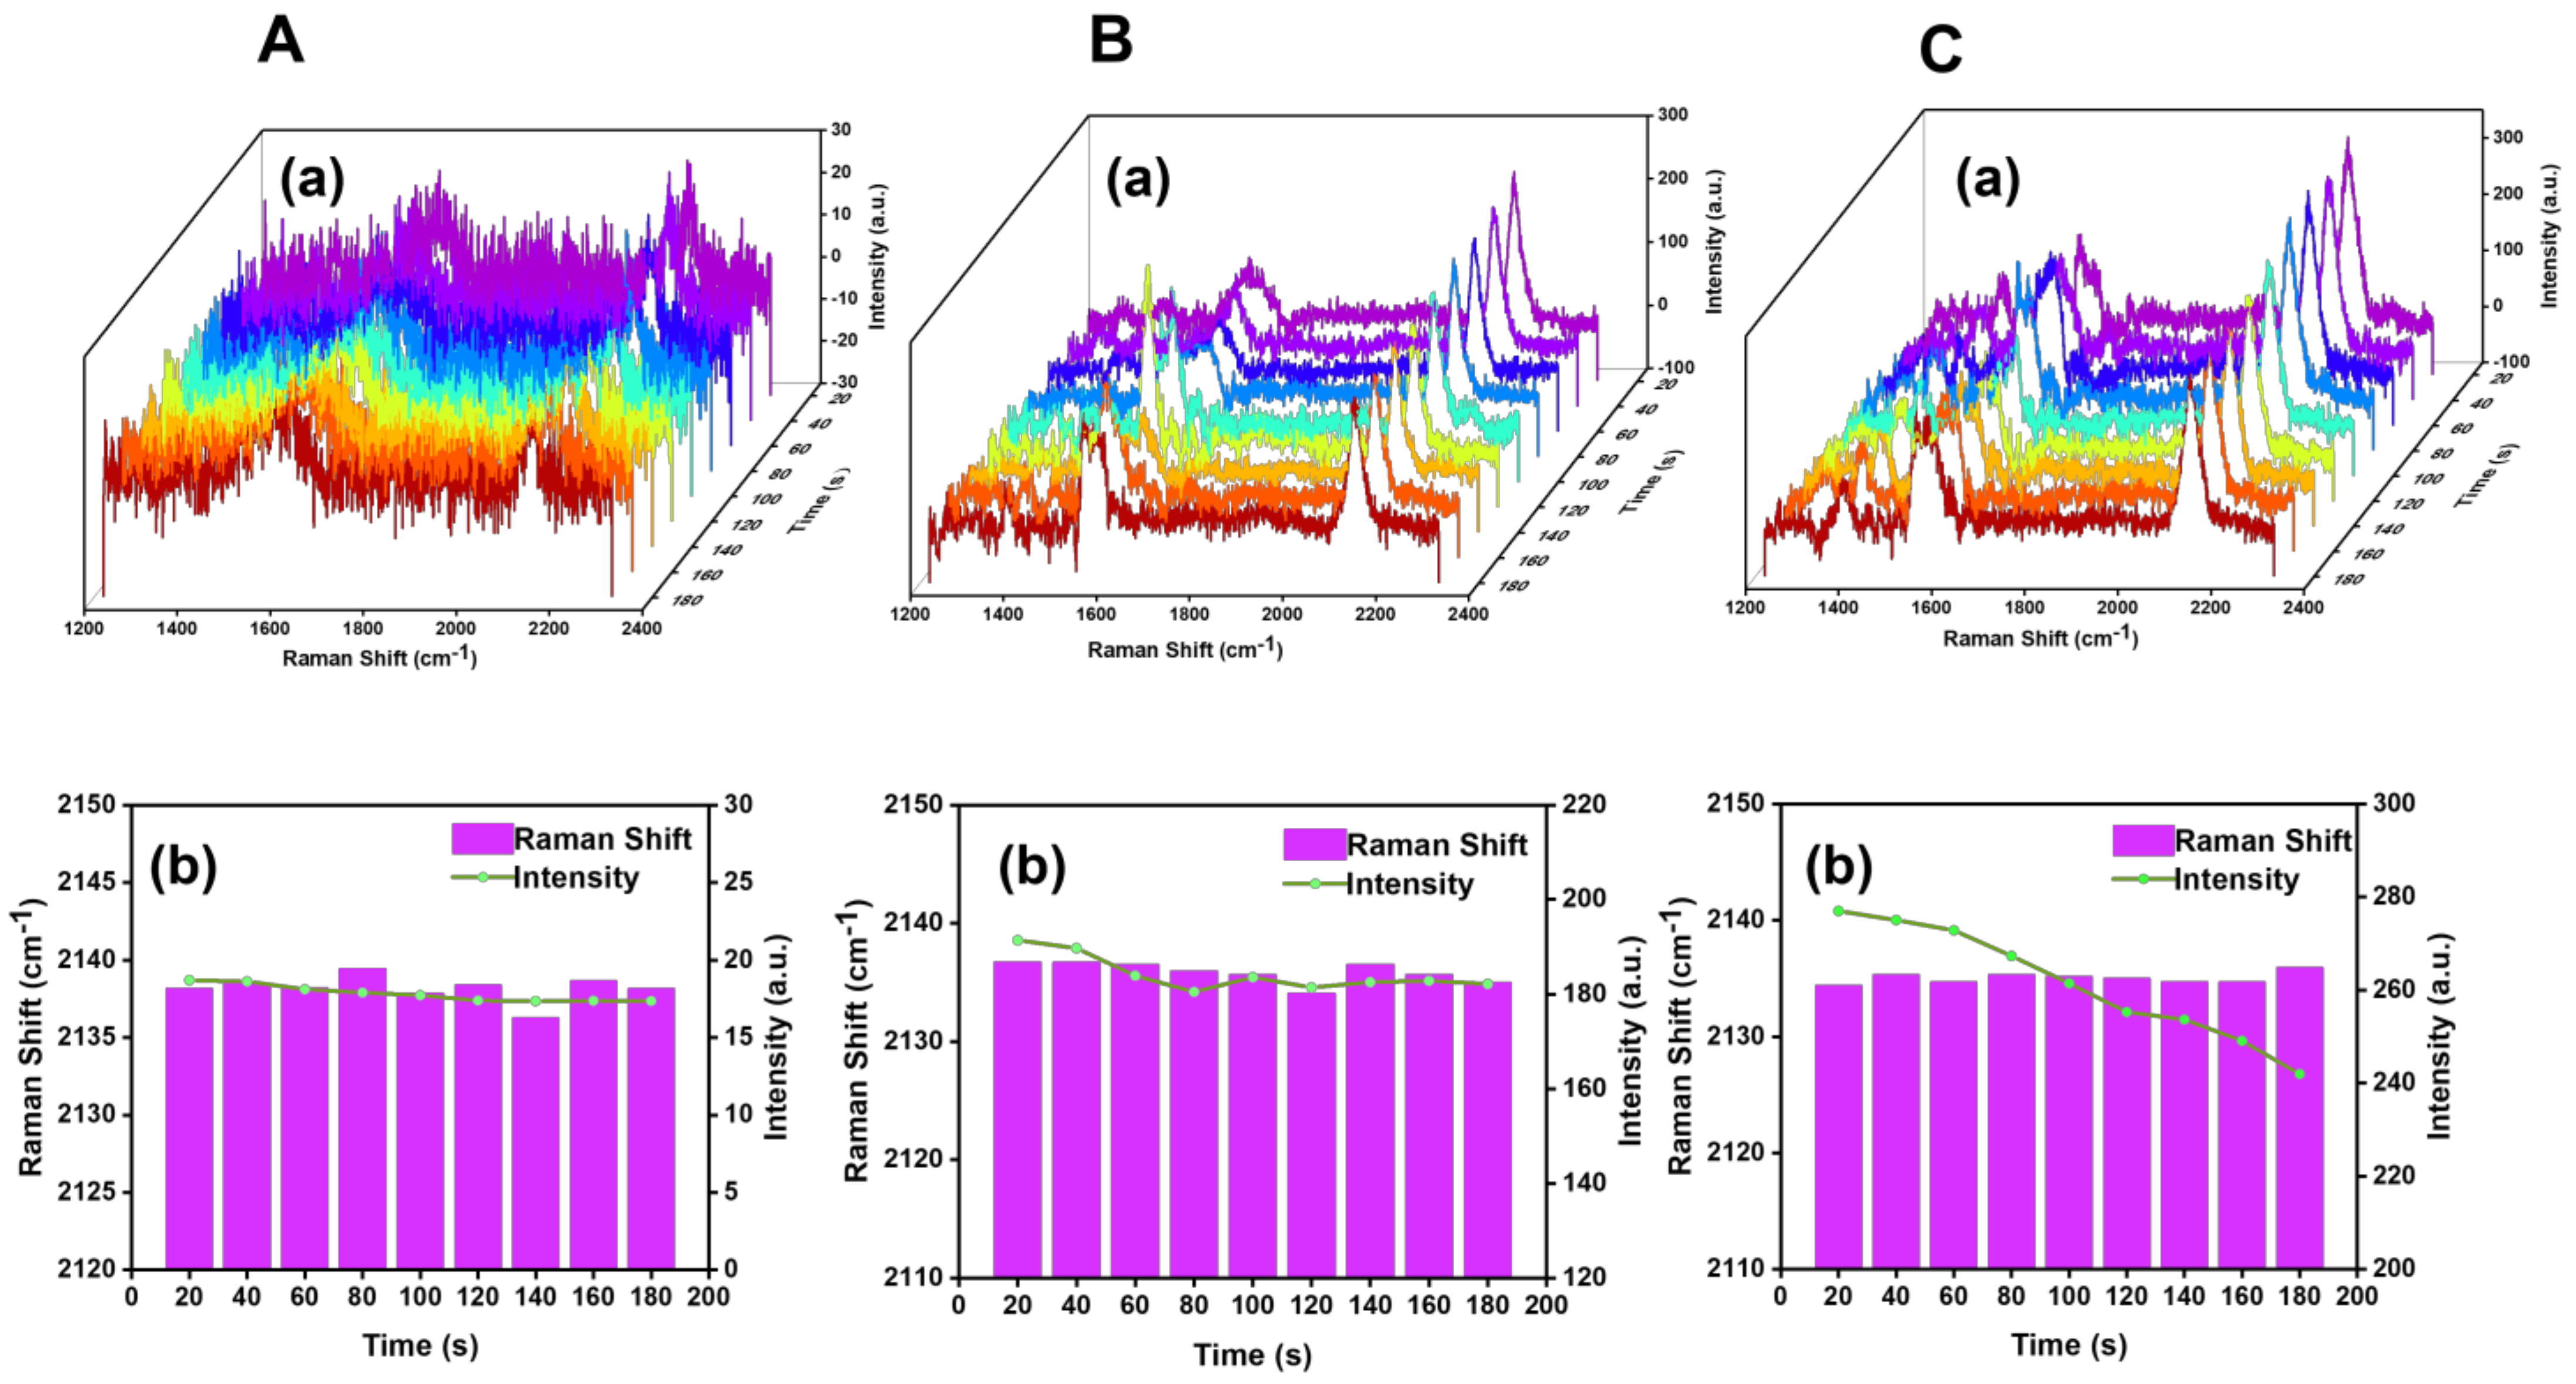
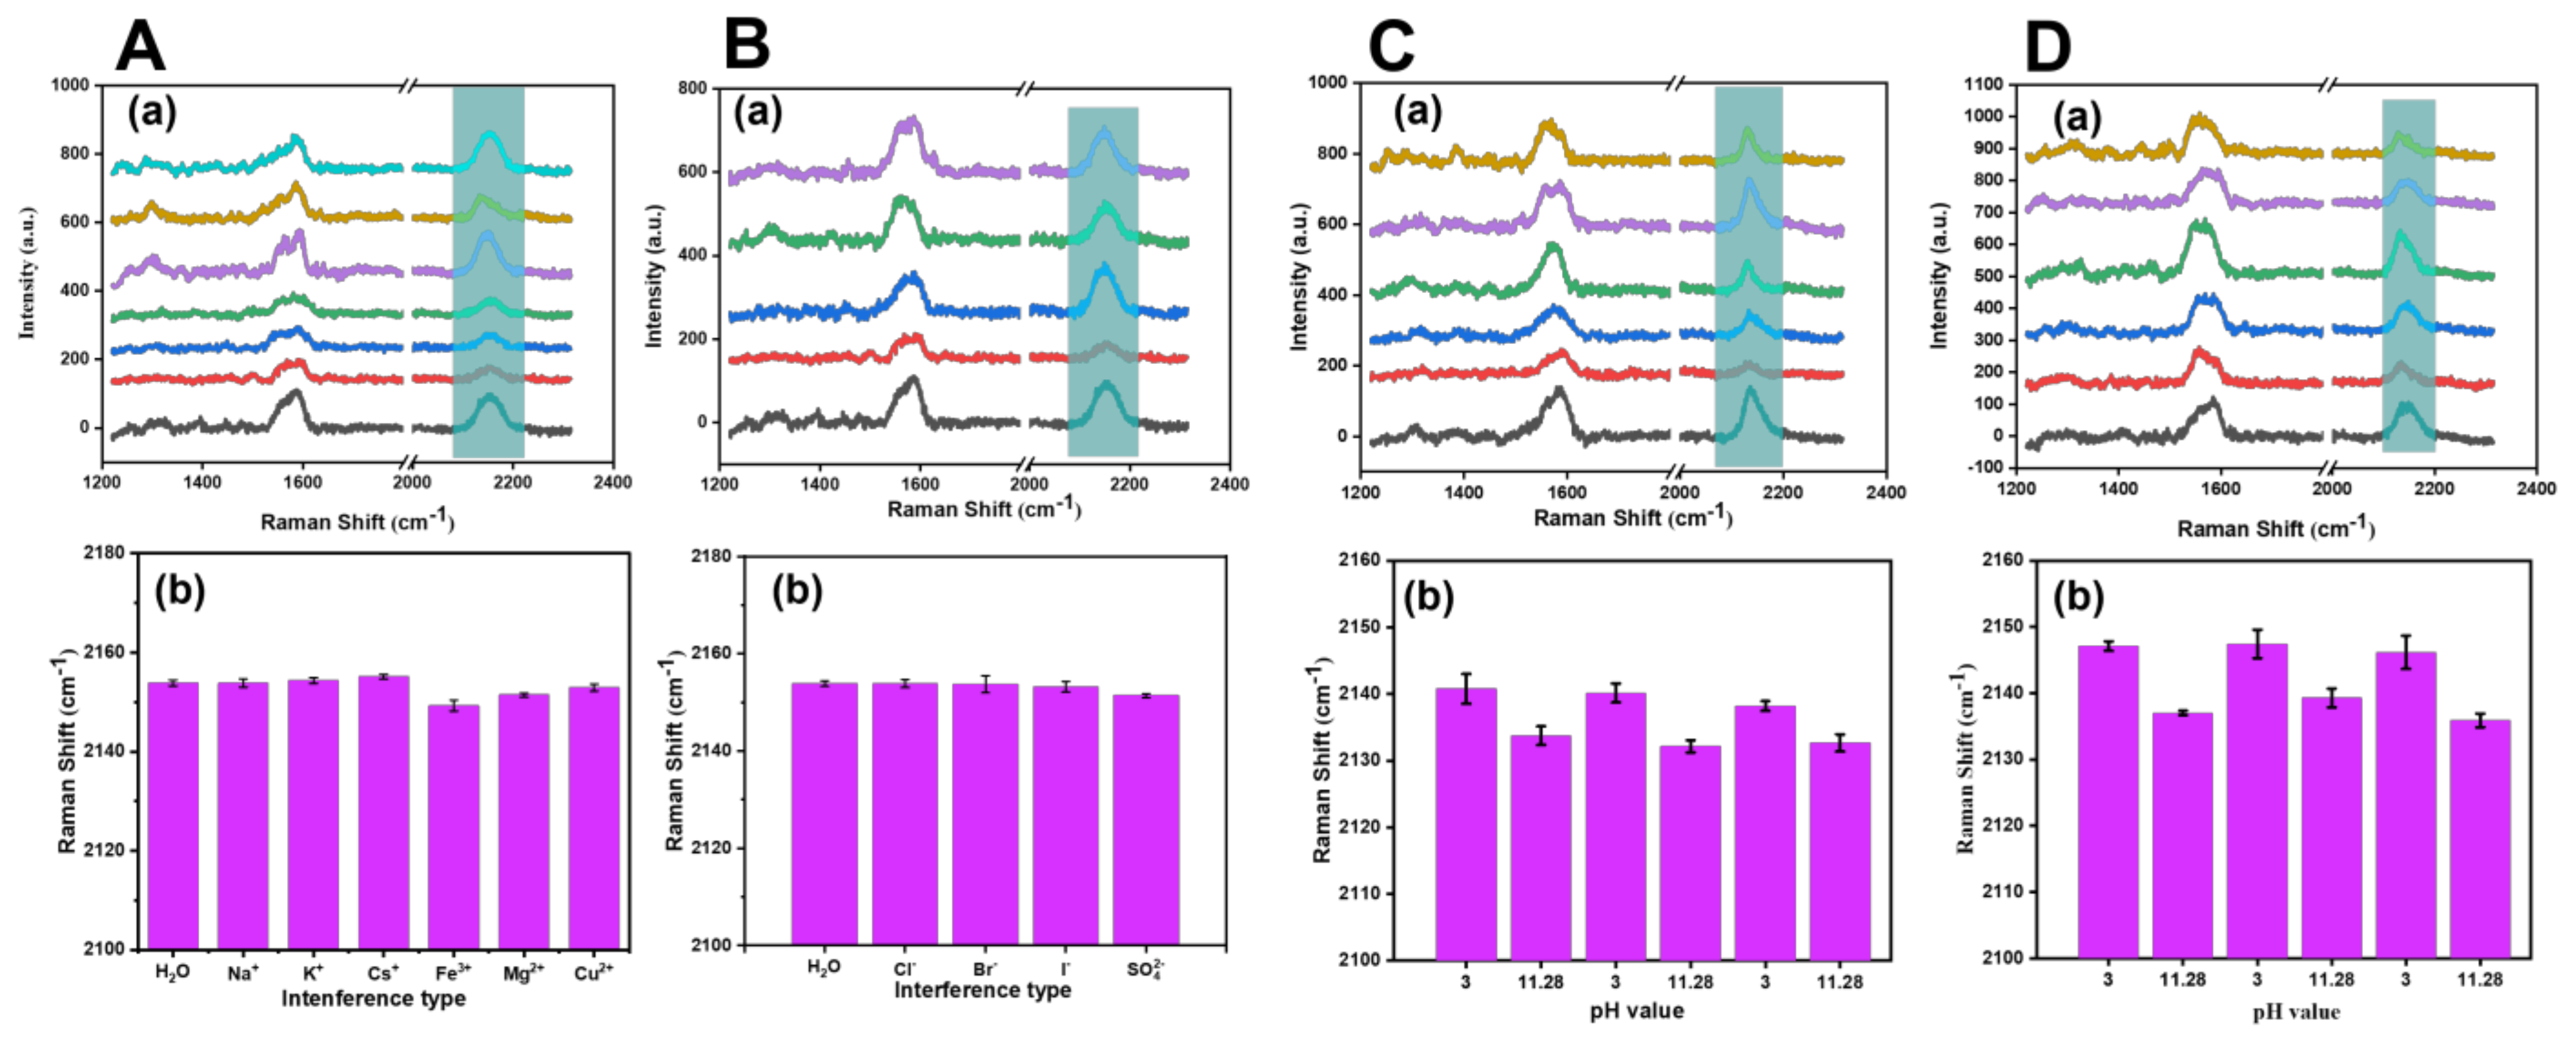
3.3. Characterization of SERS Probe
4. Detection Application of SERS Probe
5. Conclusions
Author Contributions
Funding
Institutional Review Board Statement
Informed Consent Statement
Data Availability Statement
Conflicts of Interest
References
- Skinner, W.H.; Chung, M.; Mitchell, S.; Akidil, A.; Fabre, K.; Goodwin, R.; Stokes, A.A.; Radacsi, N.; Campbell, C.J. A SERS-Active Electrospun Polymer Mesh for Spatially Localized pH Measurements of the Cellular Microenvironment. Anal. Chem. 2021, 93, 13844–13851. [Google Scholar] [CrossRef] [PubMed]
- Yu, K.K.; Li, K.; Qin, H.H.; Zhou, Q.; Qian, C.H.; Liu, Y.H.; Yu, X.Q. Construction of pH-Sensitive “Submarine” Based on Gold Nanoparticles with Double Insurance for Intracellular pH Mapping, Quantifying of Whole Cells and in Vivo Applications. ACS Appl. Mater. Interfaces 2016, 8, 22839–22848. [Google Scholar] [CrossRef] [PubMed]
- Chaudhari, R.; Joshi, A.; Srivastava, R. pH and Urea Estimation in Urine Samples using Single Fluorophore and Ratiometric Fluorescent Biosensors. Sci. Rep. 2017, 7, 5840. [Google Scholar] [CrossRef] [PubMed]
- Yang, T.; Ma, J.; Zhen, S.J.; Huang, C.Z. Electrostatic Assemblies of Well-Dispersed AgNPs on the Surface of Electrospun Nanofibers as Highly Active SERS Substrates for Wide-Range pH Sensing. ACS Appl. Mater. Interfaces 2016, 8, 14802–14811. [Google Scholar] [CrossRef] [PubMed]
- Lu, Q.; Wang, Y.Y.; Chen, H.M.; Wang, Q.H.; Yang, X.Y.; Zou, L.P. A rise in saliva and urine pH in children with SCN1A-related epilepsy: An exploratory prospective controlled study. Front. Neurol. 2022, 13, 982050. [Google Scholar] [CrossRef]
- Tsai, H.H.; Schmidt, W. The enigma of environmental pH sensing in plants. Nat. Plants 2021, 7, 106–115. [Google Scholar] [CrossRef]
- Kleinhappel, T.K.; Burman, O.H.P.; John, E.A.; Wilkinson, A.; Pike, T.W.; Herberstein, M. The impact of water pH on association preferences in fish. Ethology 2019, 125, 195–202. [Google Scholar] [CrossRef]
- Pieri, E.; Ledentu, V.; Huix-Rotllant, M.; Ferre, N. Sampling the protonation states: The pH-dependent UV absorption spectrum of a polypeptide dyad. Phys. Chem. Chem. Phys. 2018, 20, 23252–23261. [Google Scholar] [CrossRef]
- Zhang, Y.; Zhao, Y.; Song, B.; Huang, C. Spectroscopic behavior and intracellular application of a highly sensitive UV-fluorescence double ratio probe based on water-soluble indole for detection acid pH. Dyes Pigments 2021, 188, 109205. [Google Scholar] [CrossRef]
- Miao, X.; Zhu, Z.; Jia, H.; Lu, C.; Liu, X.; Mao, D.; Chen, G. Colorimetric detection of cancer biomarker based on enzyme enrichment and pH sensing. Sens. Actuators B Chem. 2020, 320, 128435. [Google Scholar] [CrossRef]
- Hao, N.; Lu, J.; Zhou, Z.; Hua, R.; Wang, K. A pH-Resolved Colorimetric Biosensor for Simultaneous Multiple Target Detection. ACS Sens. 2018, 3, 2159–2165. [Google Scholar] [CrossRef]
- Yang, S.L.; Liu, W.S.; Li, G.; Bu, R.; Li, P.; Gao, E.Q. A pH-Sensing Fluorescent Metal-Organic Framework: pH-Triggered Fluorescence Transition and Detection of Mycotoxin. Inorg. Chem. 2020, 59, 15421–15429. [Google Scholar] [CrossRef]
- Qin, F.; Zhang, Y.; Zhu, J.; Li, Y.; Cao, W.; Ye, Y. A mitochondrial-targeted fluorescent probe to sense pH and HOCl in living cells. Sens. Actuators B Chem. 2019, 291, 207–215. [Google Scholar] [CrossRef]
- Shaibani, P.M.; Etayash, H.; Naicker, S.; Kaur, K.; Thundat, T. Metabolic Study of Cancer Cells Using a pH Sensitive Hydrogel Nanofiber Light Addressable Potentiometric Sensor. ACS Sens. 2017, 2, 151–156. [Google Scholar] [CrossRef]
- Kraikaew, P.; Jeanneret, S.; Soda, Y.; Cherubini, T.; Bakker, E. Ultrasensitive Seawater pH Measurement by Capacitive Readout of Potentiometric Sensors. ACS Sens. 2020, 5, 650–654. [Google Scholar] [CrossRef]
- Chen, L.; He, L.; Ma, F.; Liu, W.; Wang, Y.; Silver, M.A.; Chen, L.; Zhu, L.; Gui, D.; Diwu, J.; et al. Covalent Organic Framework Functionalized with 8-Hydroxyquinoline as a Dual-Mode Fluorescent and Colorimetric pH Sensor. ACS Appl. Mater. Interfaces 2018, 10, 15364–15368. [Google Scholar] [CrossRef]
- Gong, K.; Jones, R.R.; Li, K.; Xu, G.; Cheng, H.; Feng, Y.; Valev, V.K.; Zhang, L. Sensing pH of individual microdroplet by combining SERS and indicator paper. Sens. Actuators B Chem. 2021, 346, 130521. [Google Scholar] [CrossRef]
- Shen, Y.; Liang, L.; Zhang, S.; Huang, D.; Zhang, J.; Xu, S.; Liang, C.; Xu, W. Organelle-targeting surface-enhanced Raman scattering (SERS) nanosensors for subcellular pH sensing. Nanoscale 2018, 10, 1622–1630. [Google Scholar] [CrossRef]
- Zhou, X.; Hu, Z.; Yang, D.; Xie, S.; Jiang, Z.; Niessner, R.; Haisch, C.; Zhou, H.; Sun, P. Bacteria Detection: From Powerful SERS to Its Advanced Compatible Techniques. Adv. Sci. 2020, 7, 2001739. [Google Scholar] [CrossRef]
- Huang, X.; Sheng, B.; Tian, H.; Chen, Q.; Yang, Y.; Bui, B.; Pi, J.; Cai, H.; Chen, S.; Zhang, J.; et al. Real-time SERS monitoring anticancer drug release along with SERS/MR imaging for pH-sensitive chemo-phototherapy. Acta Pharm. Sin. B 2022. [Google Scholar] [CrossRef]
- Wang, J.; Liang, D.; Jin, Q.; Feng, J.; Tang, X. Bioorthogonal SERS Nanotags as a Precision Theranostic Platform for in Vivo SERS Imaging and Cancer Photothermal Therapy. Bioconjug. Chem. 2020, 31, 182–193. [Google Scholar] [CrossRef] [PubMed]
- Nie, X.; Wang, X.; Tian, Y.; Chen, Z.; Chen, S.; Meng, X.; Fan, M. Thermal-fluid coupling green capture device coupling with Surface-Enhanced Raman Scattering for integrated scheme with rapid separation, enrichment and detection of multi-source formaldehyde in milk. Sustain. Mater. Technol. 2021, 30, e00332. [Google Scholar] [CrossRef]
- Zheng, Y.; Chen, Z.; Zheng, C.; Lee, Y.I.; Hou, X.; Wu, L.; Tian, Y. Derivatization reaction-based surface-enhanced Raman scattering (SERS) for detection of trace acetone. Talanta 2016, 155, 87–93. [Google Scholar] [CrossRef] [PubMed]
- Pozzi, E.A.; Zrimsek, A.B.; Lethiec, C.M.; Schatz, G.C.; Hersam, M.C.; Van Duyne, R.P. Evaluating Single-Molecule Stokes and Anti-Stokes SERS for Nanoscale Thermometry. J. Phys. Chem. C 2015, 119, 21116–21124. [Google Scholar] [CrossRef]
- Lu, Y.; Wu, L.W.; Cao, W.; Huang, Y.F. Finding a Sensitive Surface-Enhanced Raman Spectroscopic Thermometer at the Nanoscale by Examining the Functional Groups. Anal. Chem. 2022, 94, 6011–6016. [Google Scholar] [CrossRef]
- Jin, X.; Khlebtsov, B.N.; Khanadeev, V.A.; Khlebtsov, N.G.; Ye, J. Rational Design of Ultrabright SERS Probes with Embedded Reporters for Bioimaging and Photothermal Therapy. ACS Appl. Mater. Interfaces 2017, 9, 30387–30397. [Google Scholar] [CrossRef]
- Liu, R.; Zhao, J.; Han, G.; Zhao, T.; Zhang, R.; Liu, B.; Liu, Z.; Zhang, C.; Yang, L.; Zhang, Z. Click-Functionalized SERS Nanoprobes with Improved Labeling Efficiency and Capability for Cancer Cell Imaging. ACS Appl. Mater. Interfaces 2017, 9, 38222–38229. [Google Scholar] [CrossRef]
- Zhang, Y.; Jimenez de Aberasturi, D.; Henriksen-Lacey, M.; Langer, J.; Liz-Marzan, L.M. Live-Cell Surface-Enhanced Raman Spectroscopy Imaging of Intracellular pH: From Two Dimensions to Three Dimensions. ACS Sens. 2020, 5, 3194–3206. [Google Scholar] [CrossRef]
- Wei, H.; Willner, M.R.; Marr, L.C.; Vikesland, P.J. Highly stable SERS pH nanoprobes produced by co-solvent controlled AuNP aggregation. Analyst 2016, 141, 5159–5169. [Google Scholar] [CrossRef]
- Zhang, L.; Zhao, Q.; Jiang, Z.; Shen, J.; Wu, W.; Liu, X.; Fan, Q.; Huang, W. Recent Progress of SERS Nanoprobe for pH Detecting and Its Application in Biological Imaging. Biosensors 2021, 11, 282. [Google Scholar] [CrossRef]
- Ma, D.; Zheng, J.; Tang, P.; Xu, W.; Qing, Z.; Yang, S.; Li, J.; Yang, R. Quantitative Monitoring of Hypoxia-Induced Intracellular Acidification in Lung Tumor Cells and Tissues Using Activatable Surface-Enhanced Raman Scattering Nanoprobes. Anal. Chem. 2016, 88, 11852–11859. [Google Scholar] [CrossRef]
- Li, H.; Men, D.; Sun, Y.; Liu, D.; Li, X.; Li, L.; Li, C.; Cai, W.; Li, Y. Surface enhanced Raman scattering properties of dynamically tunable nanogaps between Au nanoparticles self-assembled on hydrogel microspheres controlled by pH. J Colloid Interface Sci 2017, 505, 467–475. [Google Scholar] [CrossRef]
- Gutierrez-Sanz, O.; Forbrig, E.; Batista, A.P.; Pereira, M.M.; Salewski, J.; Mroginski, M.A.; Gotz, R.; De Lacey, A.L.; Kozuch, J.; Zebger, I. Catalytic Activity and Proton Translocation of Reconstituted Respiratory Complex I Monitored by Surface-Enhanced Infrared Absorption Spectroscopy. Langmuir 2018, 34, 5703–5711. [Google Scholar] [CrossRef]
- Wang, Z.; Bonoiu, A.; Samoc, M.; Cui, Y.; Prasad, P.N. Biological pH sensing based on surface enhanced Raman scattering through a 2-aminothiophenol-silver probe. Biosens. Bioelectron. 2008, 23, 886–891. [Google Scholar] [CrossRef]
- Xie, M.; Li, F.; Gu, P.; Wang, F.; Qu, Z.; Li, J.; Wang, L.; Zuo, X.; Zhang, X.; Shen, J. Gold nanoflower-based surface-enhanced Raman probes for pH mapping of tumor cell microenviroment. Cell Prolif. 2019, 52, e12618. [Google Scholar] [CrossRef]
- Chen, H.; Luo, C.; Zhang, S. Intracellular imaging and concurrent pH sensing of cancer-derived exosomes using surface-enhanced Raman scattering. Anal. Bioanal. Chem. 2021, 413, 4091–4101. [Google Scholar] [CrossRef]
- Park, J.E.; Yonet-Tanyeri, N.; Vander Ende, E.; Henry, A.I.; Perez White, B.E.; Mrksich, M.; Van Duyne, R.P. Plasmonic Microneedle Arrays for in Situ Sensing with Surface-Enhanced Raman Spectroscopy (SERS). Nano Lett. 2019, 19, 6862–6868. [Google Scholar] [CrossRef]
- Guo, J.; Rubfiaro, A.S.; Lai, Y.; Moscoso, J.; Chen, F.; Liu, Y.; Wang, X.; He, J. Dynamic single-cell intracellular pH sensing using a SERS-active nanopipette. Analyst 2020, 145, 4852–4859. [Google Scholar] [CrossRef]
- Yang, G.; Zhang, K.; Qu, X.; Xu, W.; Xu, S. Ratiometric pH-responsive SERS strategy for glioma boundary determination. Talanta 2022, 250, 123750. [Google Scholar] [CrossRef]
- Yin, Y.; Li, Q.; Ma, S.; Liu, H.; Dong, B.; Yang, J.; Liu, D. Prussian Blue as a Highly Sensitive and Background-Free Resonant Raman Reporter. Anal. Chem. 2017, 89, 1551–1557. [Google Scholar] [CrossRef]
- Mi, S.; Ji, L.; Yu, H.; Guo, Y.; Cheng, Y.; Yang, F.; Yao, W.; Xie, Y. Zero-Background Surface-Enhanced Raman Scattering Detection of Cymoxanil Based on the Change of the Cyano Group after Ultraviolet Irradiation. J. Agric. Food Chem. 2021, 69, 520–527. [Google Scholar] [CrossRef] [PubMed]
- Hong, S.; Chen, T.; Zhu, Y.; Li, A.; Huang, Y.; Chen, X. Live-cell stimulated Raman scattering imaging of alkyne-tagged biomolecules. Angew. Chem. Int. Ed. 2014, 53, 5827–5831. [Google Scholar] [CrossRef] [PubMed]
- Bakthavatsalam, S.; Dodo, K.; Sodeoka, M. A decade of alkyne-tag Raman imaging (ATRI): Applications in biological systems. RSC Chem. Biol. 2021, 2, 1415–1429. [Google Scholar] [CrossRef] [PubMed]
- Sloan-Dennison, S.; Laing, S.; Graham, D.; Faulds, K. From Raman to SESORRS: Moving deeper into cancer detection and treatment monitoring. Chem. Commun. 2021, 57, 12436–12451. [Google Scholar] [CrossRef] [PubMed]
- Renata, S.; Verma, N.; Tu, Z.; Pan, R.-L.; Hofmann, M.; Lin, C.-H. Development of a Tri-Functional Nanoprobe for Background-Free SERS Detection of Sialic Acid on the Cell Surface. Chemosensors 2021, 9, 92. [Google Scholar] [CrossRef]
- Montali, L.; Calabretta, M.M.; Lopreside, A.; D’Elia, M.; Guardigli, M.; Michelini, E. Multienzyme chemiluminescent foldable biosensor for on-site detection of acetylcholinesterase inhibitors. Biosens. Bioelectron. 2020, 162, 112232. [Google Scholar] [CrossRef]
- Reimers, J.R.; Ford, M.J.; Halder, A.; Ulstrup, J.; Hush, N.S. Gold surfaces and nanoparticles are protected by Au(0)-thiyl species and are destroyed when Au(I)-thiolates form. Proc. Natl. Acad. Sci. USA 2016, 113, E1424–E1433. [Google Scholar] [CrossRef]
- Eling, C.J.; Price, T.W.; Marshall, A.R.L.; Narda Viscomi, F.; Robinson, P.; Firth, G.; Adawi, A.M.; Bouillard, J.G.; Stasiuk, G.J. A Dual-Modal SERS/Fluorescence Gold Nanoparticle Probe for Mitochondrial Imaging. Chempluschem 2017, 82, 674–680. [Google Scholar] [CrossRef]
- Su, Z.; Cheng, Y.; Xu, X.; Wang, H.; Xiao, L.; Tang, D.; Xie, Q.; Qin, X. Preparation of porous thiolated polymer nanocomposite for construction of sensitive and selective phytohormone amperometric immunosensor. Microchem. J. 2020, 153, 104380. [Google Scholar] [CrossRef]
- Sun, J.F.; Mao, Y.Q.; Guo, Z.R.; Zhang, Y.; Gu, N. Time-varied magnetic-field induced monolayer formation and re-aggregation of Au nanoparticles during solvent evaporation. J. Nanosci. Nanotechnol. 2009, 9, 1156–1159. [Google Scholar] [CrossRef]
- Zhang, D.; Fang, J.; Li, T. Sensitive and uniform detection using Surface-Enhanced Raman Scattering: Influence of colloidal-droplets evaporation based on Au-Ag alloy nanourchins. J. Colloid Interf. Sci. 2018, 514, 217–226. [Google Scholar] [CrossRef]
- Saha, S.; Dutta, B.; Ghosh, M.; Chowdhury, J. Adsorption of 4-Mercapto Pyridine with Gold Nanoparticles Embedded in the Langmuir-Blodgett Film Matrix of Stearic Acid: SERS, XPS Studies Aided by Born-Oppenheimer on the Fly Dynamics, Time-Resolved Wavelet Transform Theory, and DFT. ACS Omega 2022, 7, 27818–27830. [Google Scholar] [CrossRef]
- Zhao, L.; Yang, R.; Wei, Y.; Guo, Y.; Zhao, Q.; Zhang, H.; Cai, W. Rapid and sensitive SERS detection of opioids in solutions based on the solid chip Au-coated Si nano-cone array. Spectrochim. Acta A Mol. Biomol. Spectrosc. 2022, 283, 121720. [Google Scholar] [CrossRef]
- Bastus, N.G.; Comenge, J.; Puntes, V. Kinetically controlled seeded growth synthesis of citrate-stabilized gold nanoparticles of up to 200 nm: Size focusing versus Ostwald ripening. Langmuir 2011, 27, 11098–11105. [Google Scholar] [CrossRef]
- Tezcan, T.; Hsu, C.H. High-sensitivity SERS based sensing on the labeling side of glass slides using low branched gold nanoparticles prepared with surfactant-free synthesis. RSC Adv. 2020, 10, 34290–34298. [Google Scholar] [CrossRef]
- Zeng, F.; Xu, D.; Zhan, C.; Liang, C.; Zhao, W.; Zhang, J.; Feng, H.; Ma, X. Surfactant-Free Synthesis of Graphene Oxide Coated Silver Nanoparticles for SERS Biosensing and Intracellular Drug Delivery. ACS Appl. Nano Mater. 2018, 1, 2748–2753. [Google Scholar] [CrossRef]
- Chen, Z.; Lu, S.; Zhang, Z.; Huang, X.; Zhao, H.; Wei, J.; Li, F.; Yuan, K.; Su, L.; Xiong, Y. Green photoreduction synthesis of dispersible gold nanoparticles and their direct in situ assembling in multidimensional substrates for SERS detection. Mikrochim. Acta 2022, 189, 275. [Google Scholar] [CrossRef]
- Ding, S.Y.; You, E.M.; Tian, Z.Q.; Moskovits, M. Electromagnetic theories of surface-enhanced Raman spectroscopy. Chem. Soc. Rev. 2017, 46, 4042–4076. [Google Scholar] [CrossRef]
- Cardinal, M.F.; Vander Ende, E.; Hackler, R.A.; McAnally, M.O.; Stair, P.C.; Schatz, G.C.; Van Duyne, R.P. Expanding applications of SERS through versatile nanomaterials engineering. Chem. Soc. Rev. 2017, 46, 3886–3903. [Google Scholar] [CrossRef]
- Hossain, M.K. Nanoassembly of gold nanoparticles: An active substrate for size-dependent surface-enhanced Raman scattering. Spectrochim. Acta A Mol. Biomol. Spectrosc. 2020, 242, 118759. [Google Scholar] [CrossRef]
- Sun, J.; Zhang, Z.; Liu, C.; Dai, X.; Zhou, W.; Jiang, K.; Zhang, T.; Yin, J.; Gao, J.; Yin, H.; et al. Continuous in situ portable SERS analysis of pollutants in water and air by a highly sensitive gold nanoparticle-decorated PVDF substrate. Anal. Bioanal. Chem. 2021, 413, 5469–5482. [Google Scholar] [CrossRef] [PubMed]
- Damaghi, M.; Wojtkowiak, J.W.; Gillies, R.J. pH sensing and regulation in cancer. Front. Physiol. 2013, 4, 370. [Google Scholar] [CrossRef] [PubMed]


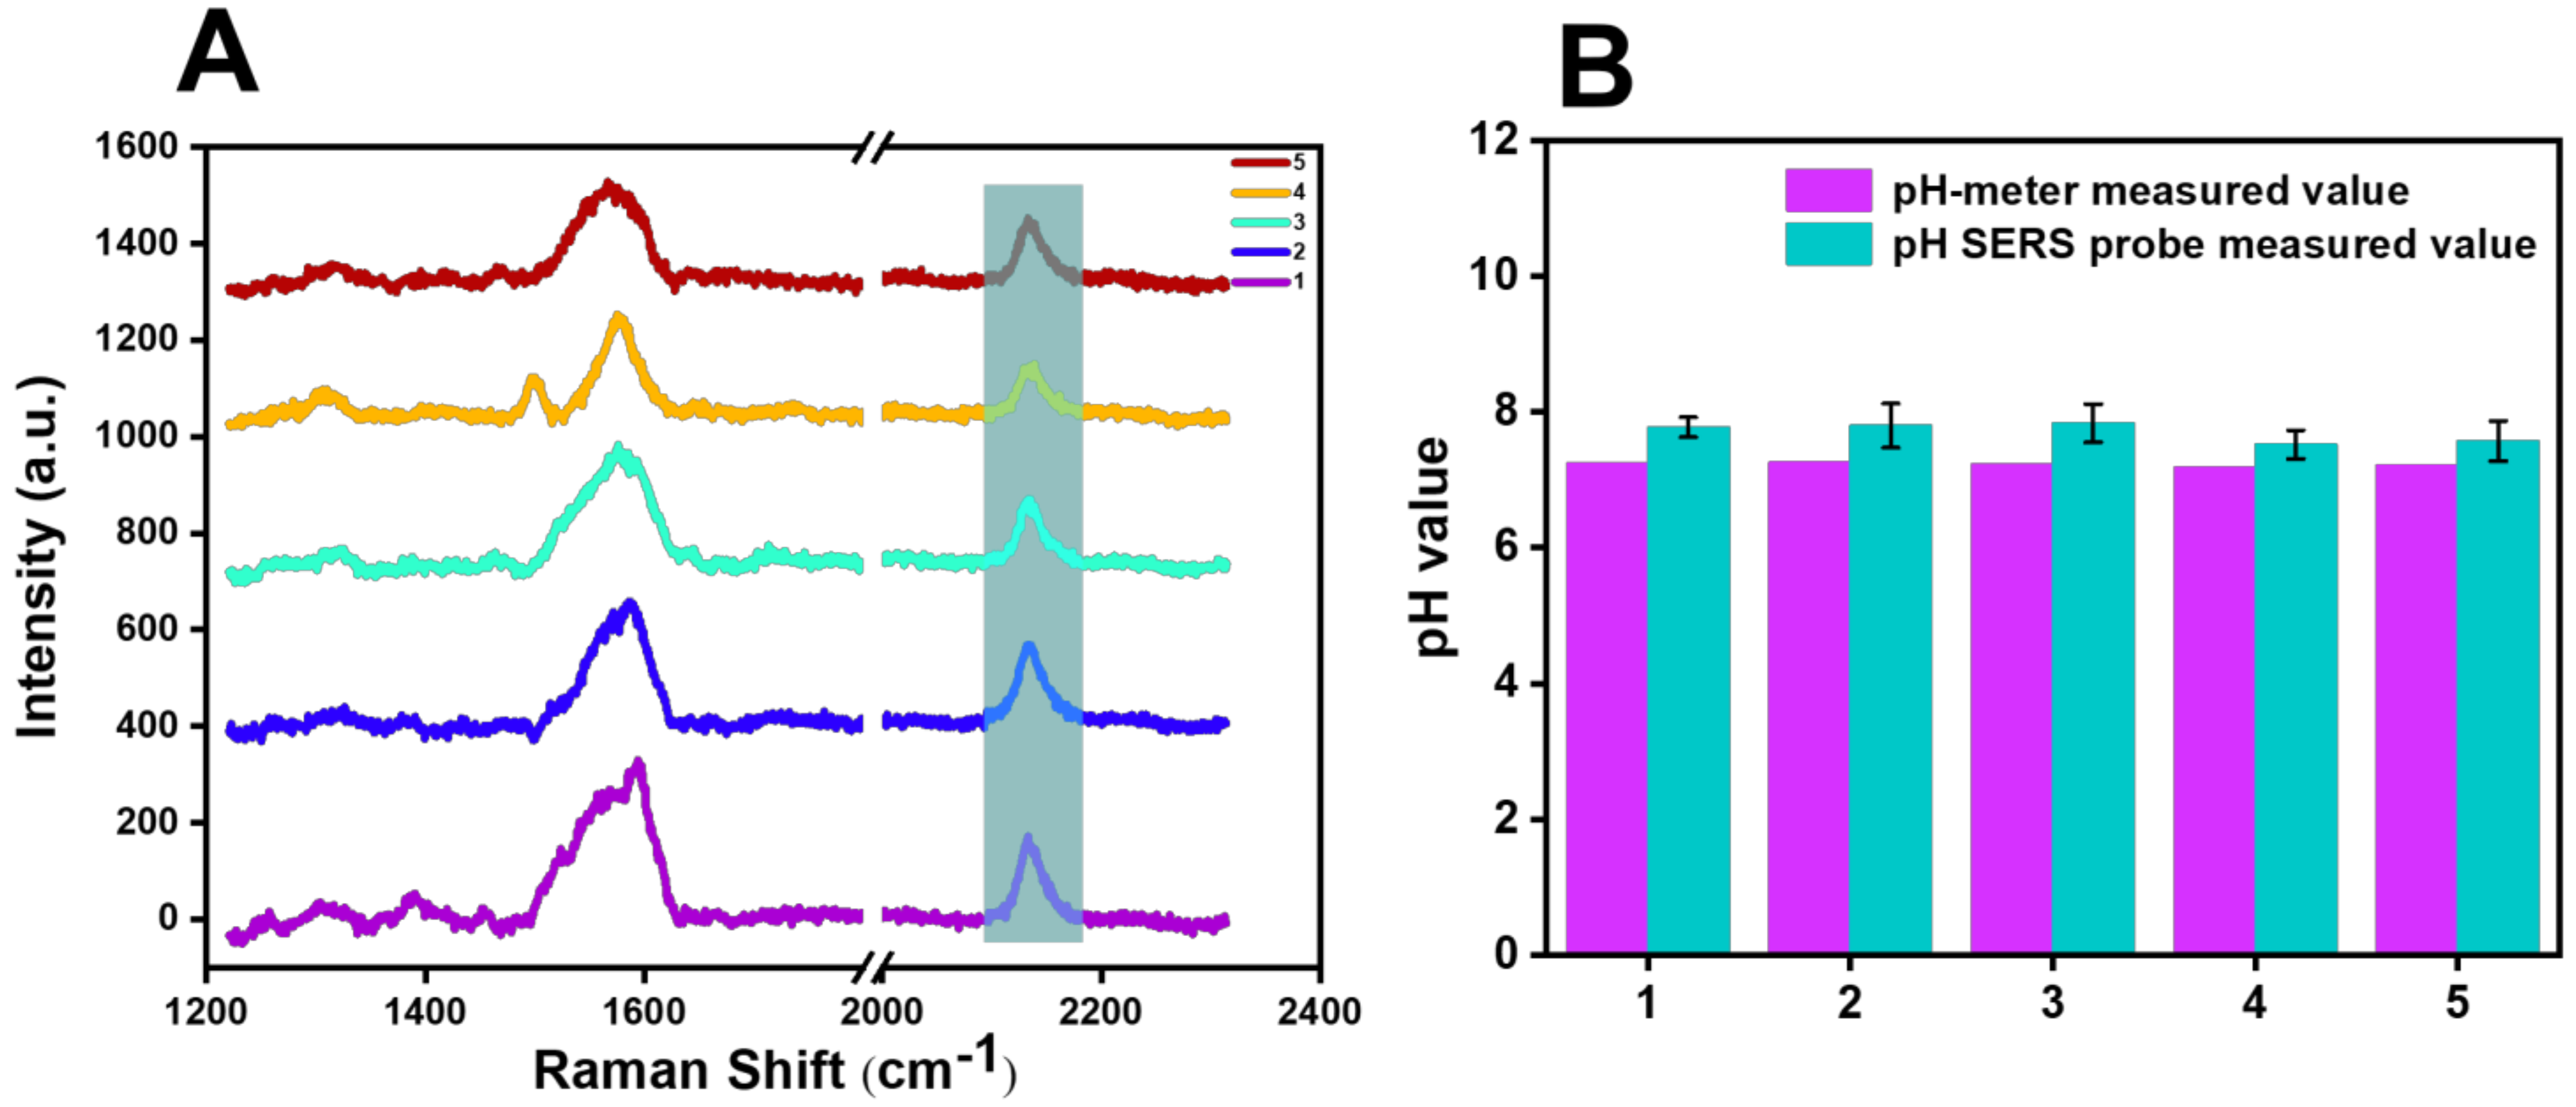
| Number | Raman Shift (cm−1) | pH-Meter Measured Value | pH SERS Probe Measured Value | RSD (100%) |
|---|---|---|---|---|
| 1 2 3 4 5 | 2135.61 2135.61 2135.53 2136.19 2136.09 | 7.24 7.26 7.23 7.19 7.22 | 7.80 7.80 7.84 7.52 7.57 | 7.80% 7.50% 8.47% 4.71% 4.93% |
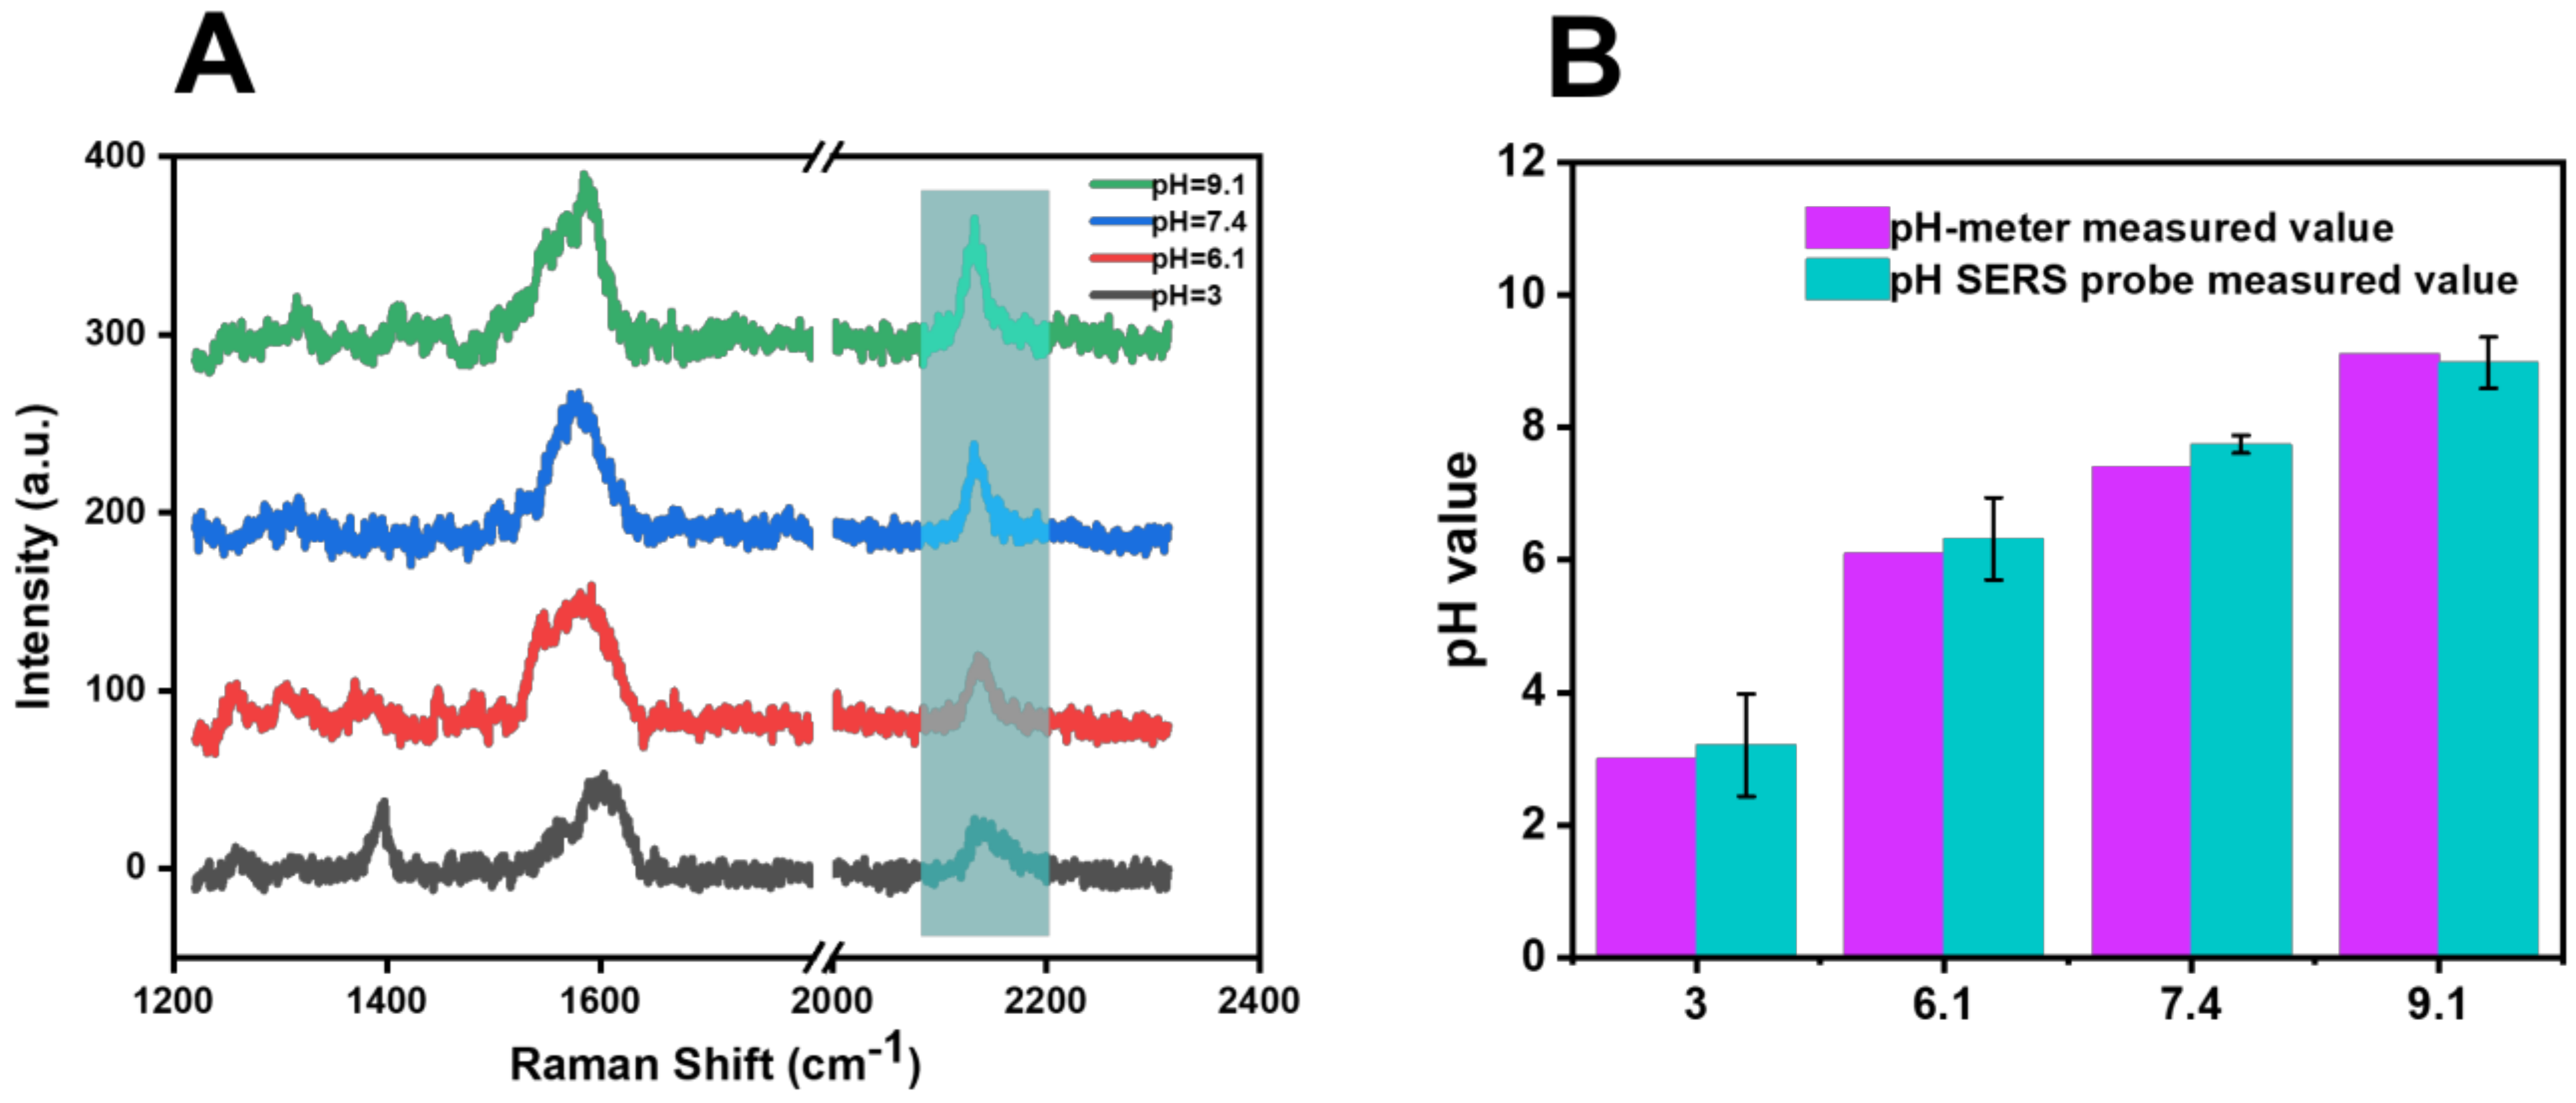
| pH-Meter Measured Value | Cyano Raman Shift (cm−1) | pH SERS Probe Measured Value | RSD (100%) |
|---|---|---|---|
| 3 6.1 7.4 9.1 | 2145.27 2138.72 2135.73 2133.00 | 3.2 6.32 7.74 9.04 | 6.82% 3.67% 4.59% 0.53% |
Disclaimer/Publisher’s Note: The statements, opinions and data contained in all publications are solely those of the individual author(s) and contributor(s) and not of MDPI and/or the editor(s). MDPI and/or the editor(s) disclaim responsibility for any injury to people or property resulting from any ideas, methods, instructions or products referred to in the content. |
© 2022 by the authors. Licensee MDPI, Basel, Switzerland. This article is an open access article distributed under the terms and conditions of the Creative Commons Attribution (CC BY) license (https://creativecommons.org/licenses/by/4.0/).
Share and Cite
Shen, J.; Liu, G.; Zhang, W.; Shi, W.; Zhou, Y.; Yu, Z.; Mei, Q.; Zhang, L.; Huang, W. Design and Detection of Cyanide Raman Tag pH-Responsive SERS Probes. Biosensors 2023, 13, 21. https://doi.org/10.3390/bios13010021
Shen J, Liu G, Zhang W, Shi W, Zhou Y, Yu Z, Mei Q, Zhang L, Huang W. Design and Detection of Cyanide Raman Tag pH-Responsive SERS Probes. Biosensors. 2023; 13(1):21. https://doi.org/10.3390/bios13010021
Chicago/Turabian StyleShen, Jingjing, Guan Liu, Wen Zhang, Wenwen Shi, Yang Zhou, Zejie Yu, Qunbo Mei, Lei Zhang, and Wei Huang. 2023. "Design and Detection of Cyanide Raman Tag pH-Responsive SERS Probes" Biosensors 13, no. 1: 21. https://doi.org/10.3390/bios13010021
APA StyleShen, J., Liu, G., Zhang, W., Shi, W., Zhou, Y., Yu, Z., Mei, Q., Zhang, L., & Huang, W. (2023). Design and Detection of Cyanide Raman Tag pH-Responsive SERS Probes. Biosensors, 13(1), 21. https://doi.org/10.3390/bios13010021