Estimation of Respiratory Rate from Functional Near-Infrared Spectroscopy (fNIRS): A New Perspective on Respiratory Interference

 , , , , ,
  and
and
Abstract
:1. Introduction
2. Methods
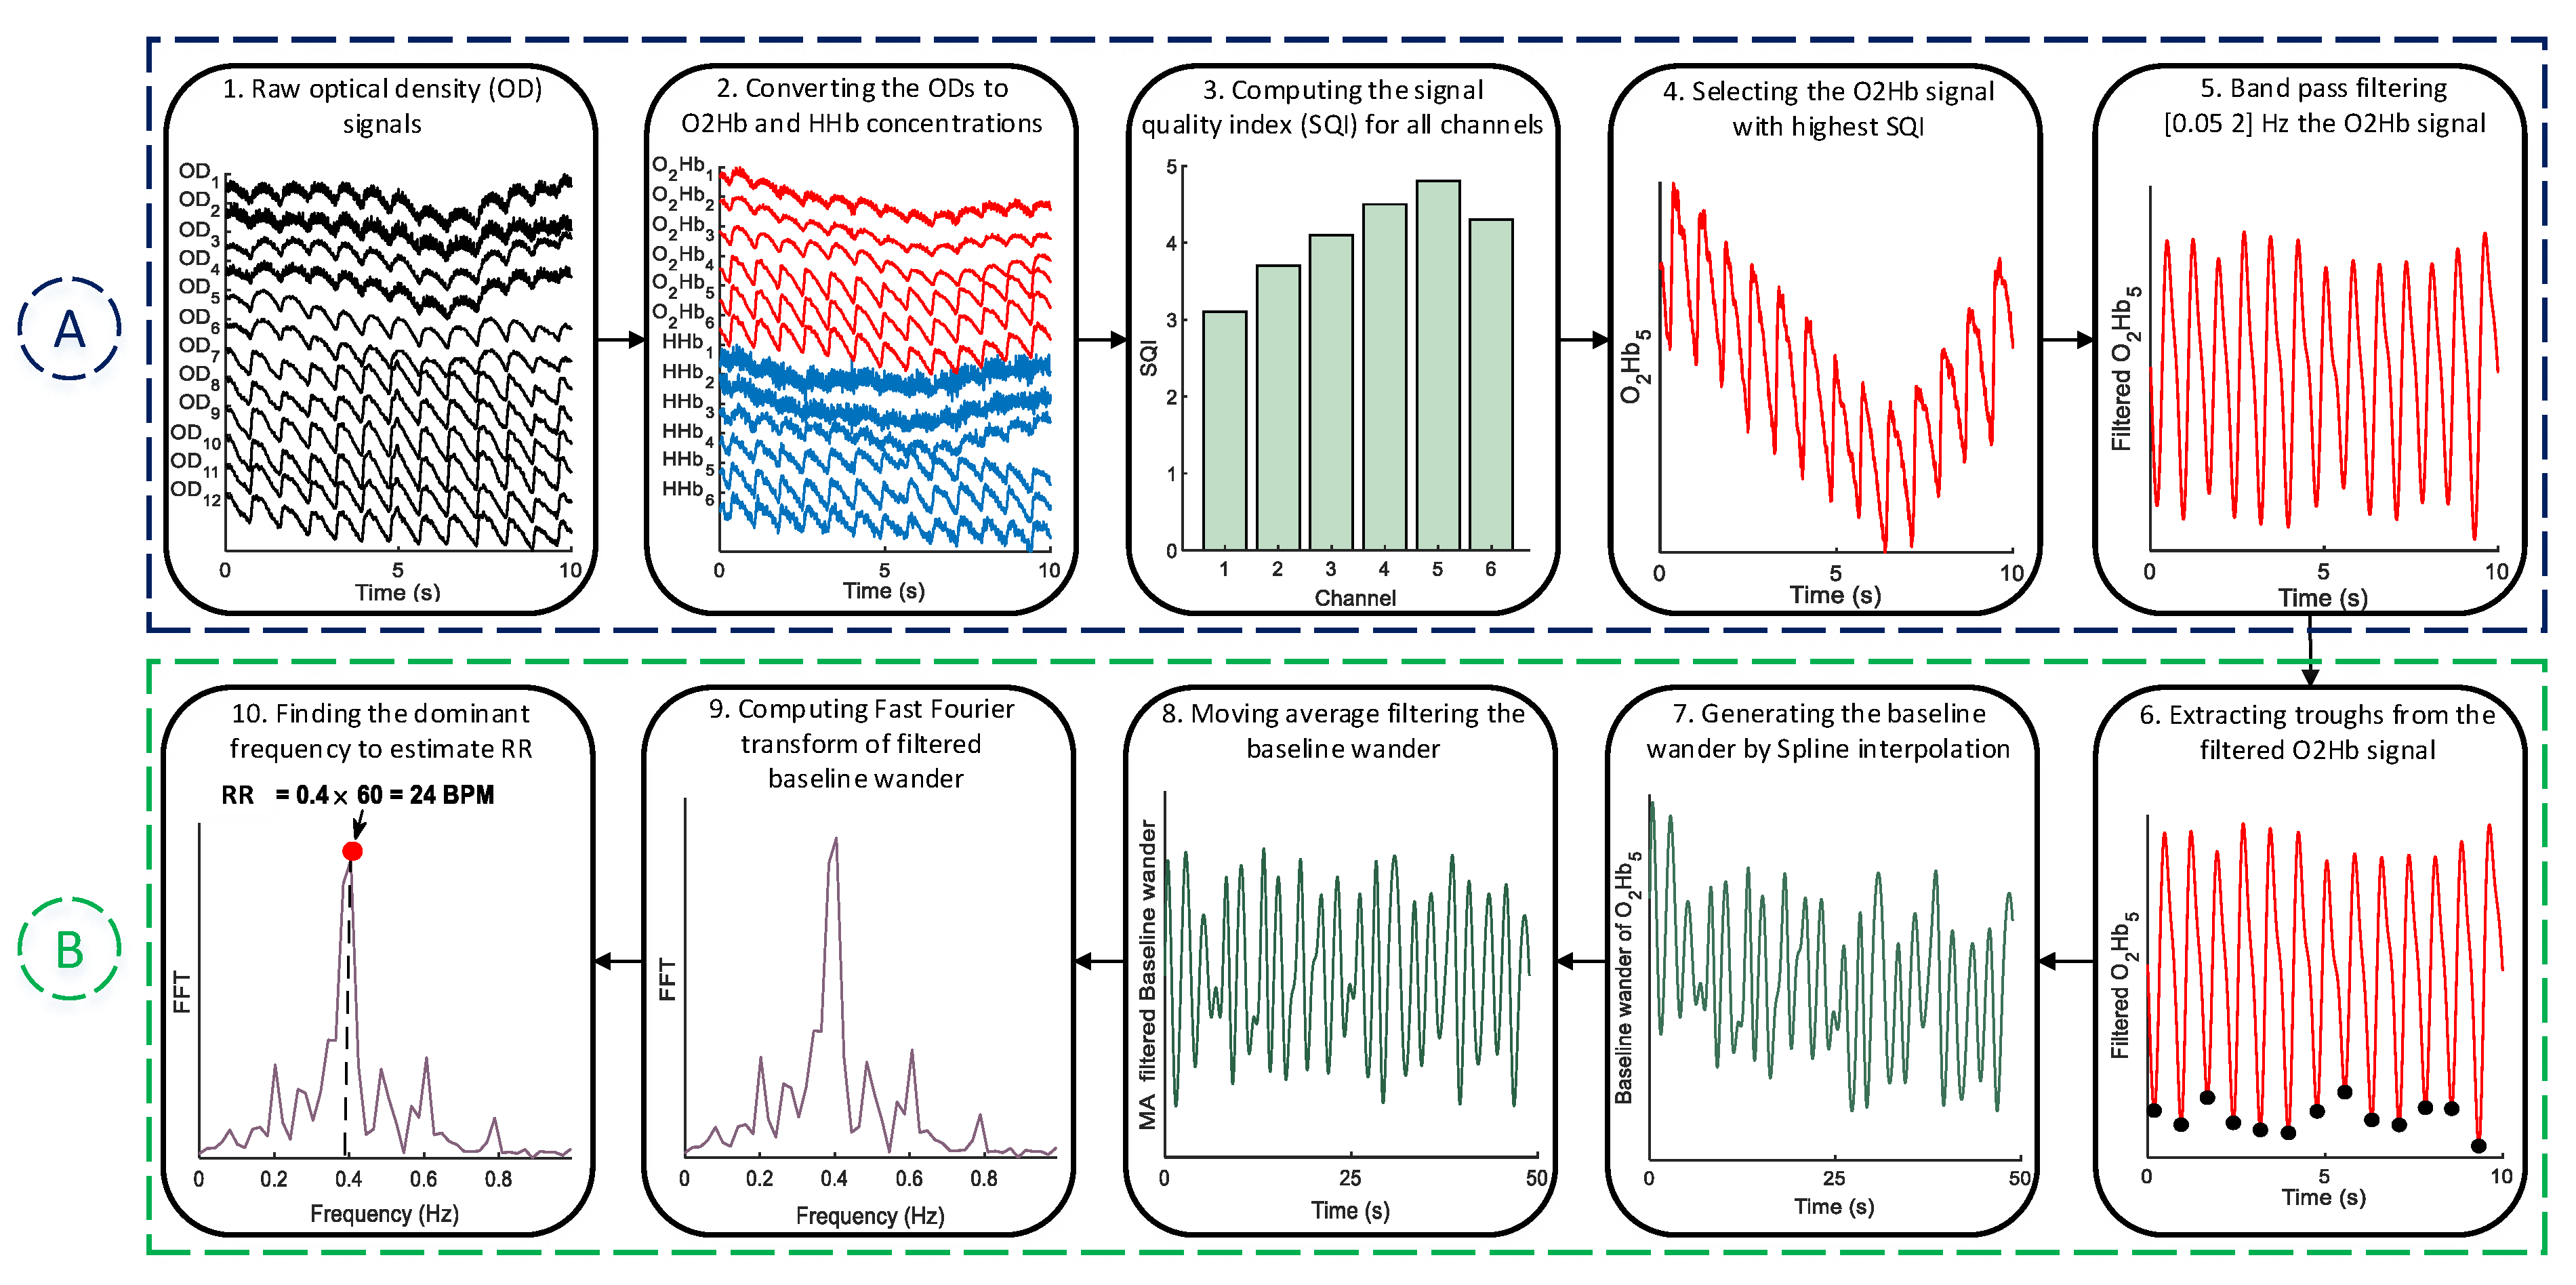
2.1. Pre-Processing
2.2. RR Estimation
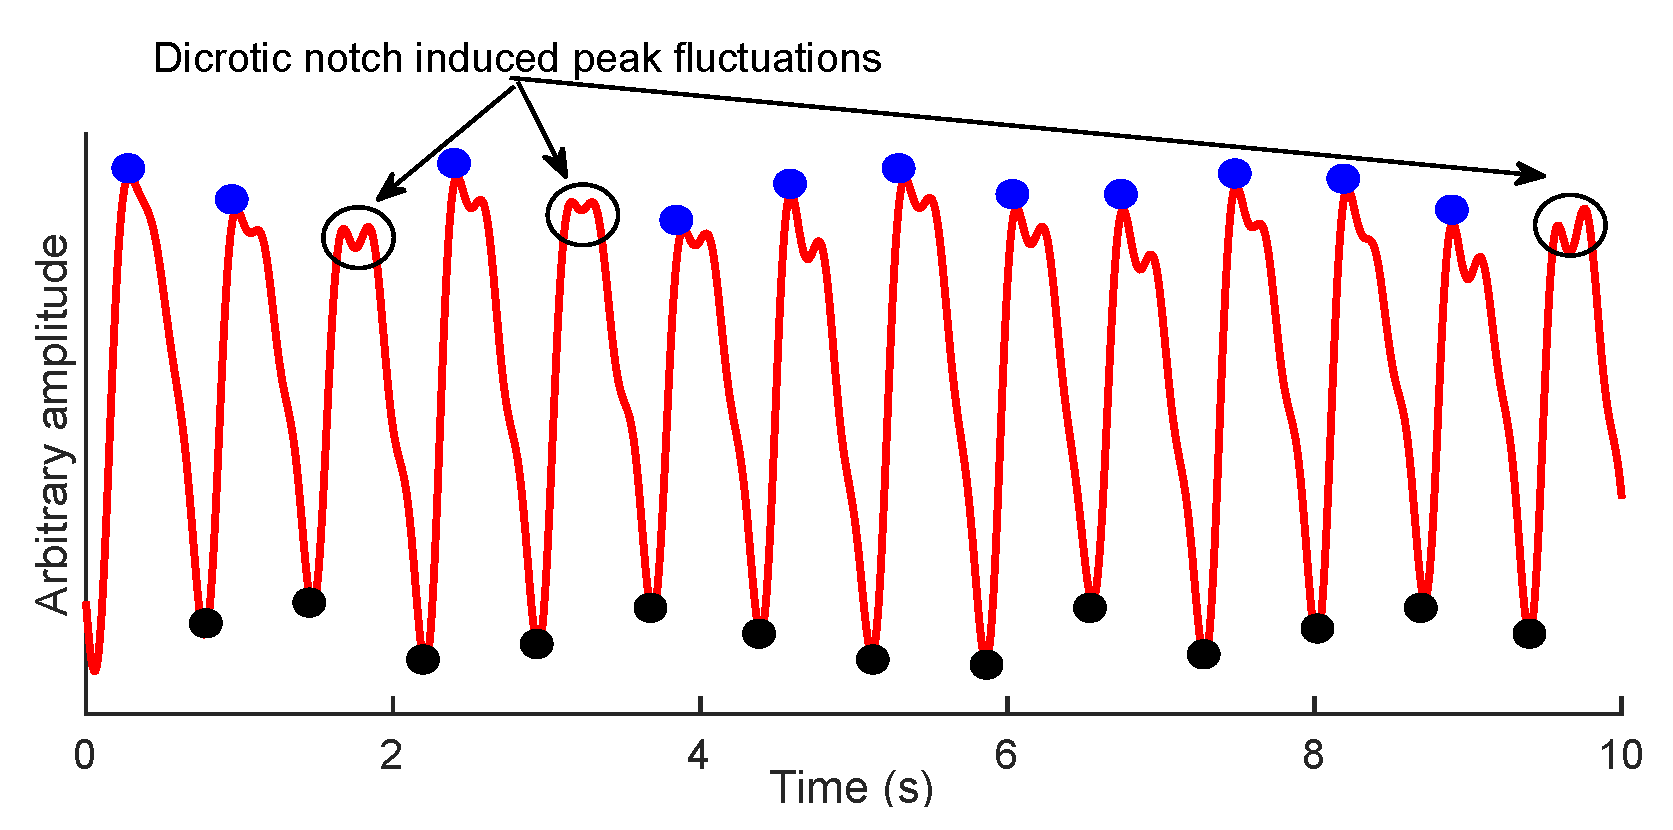
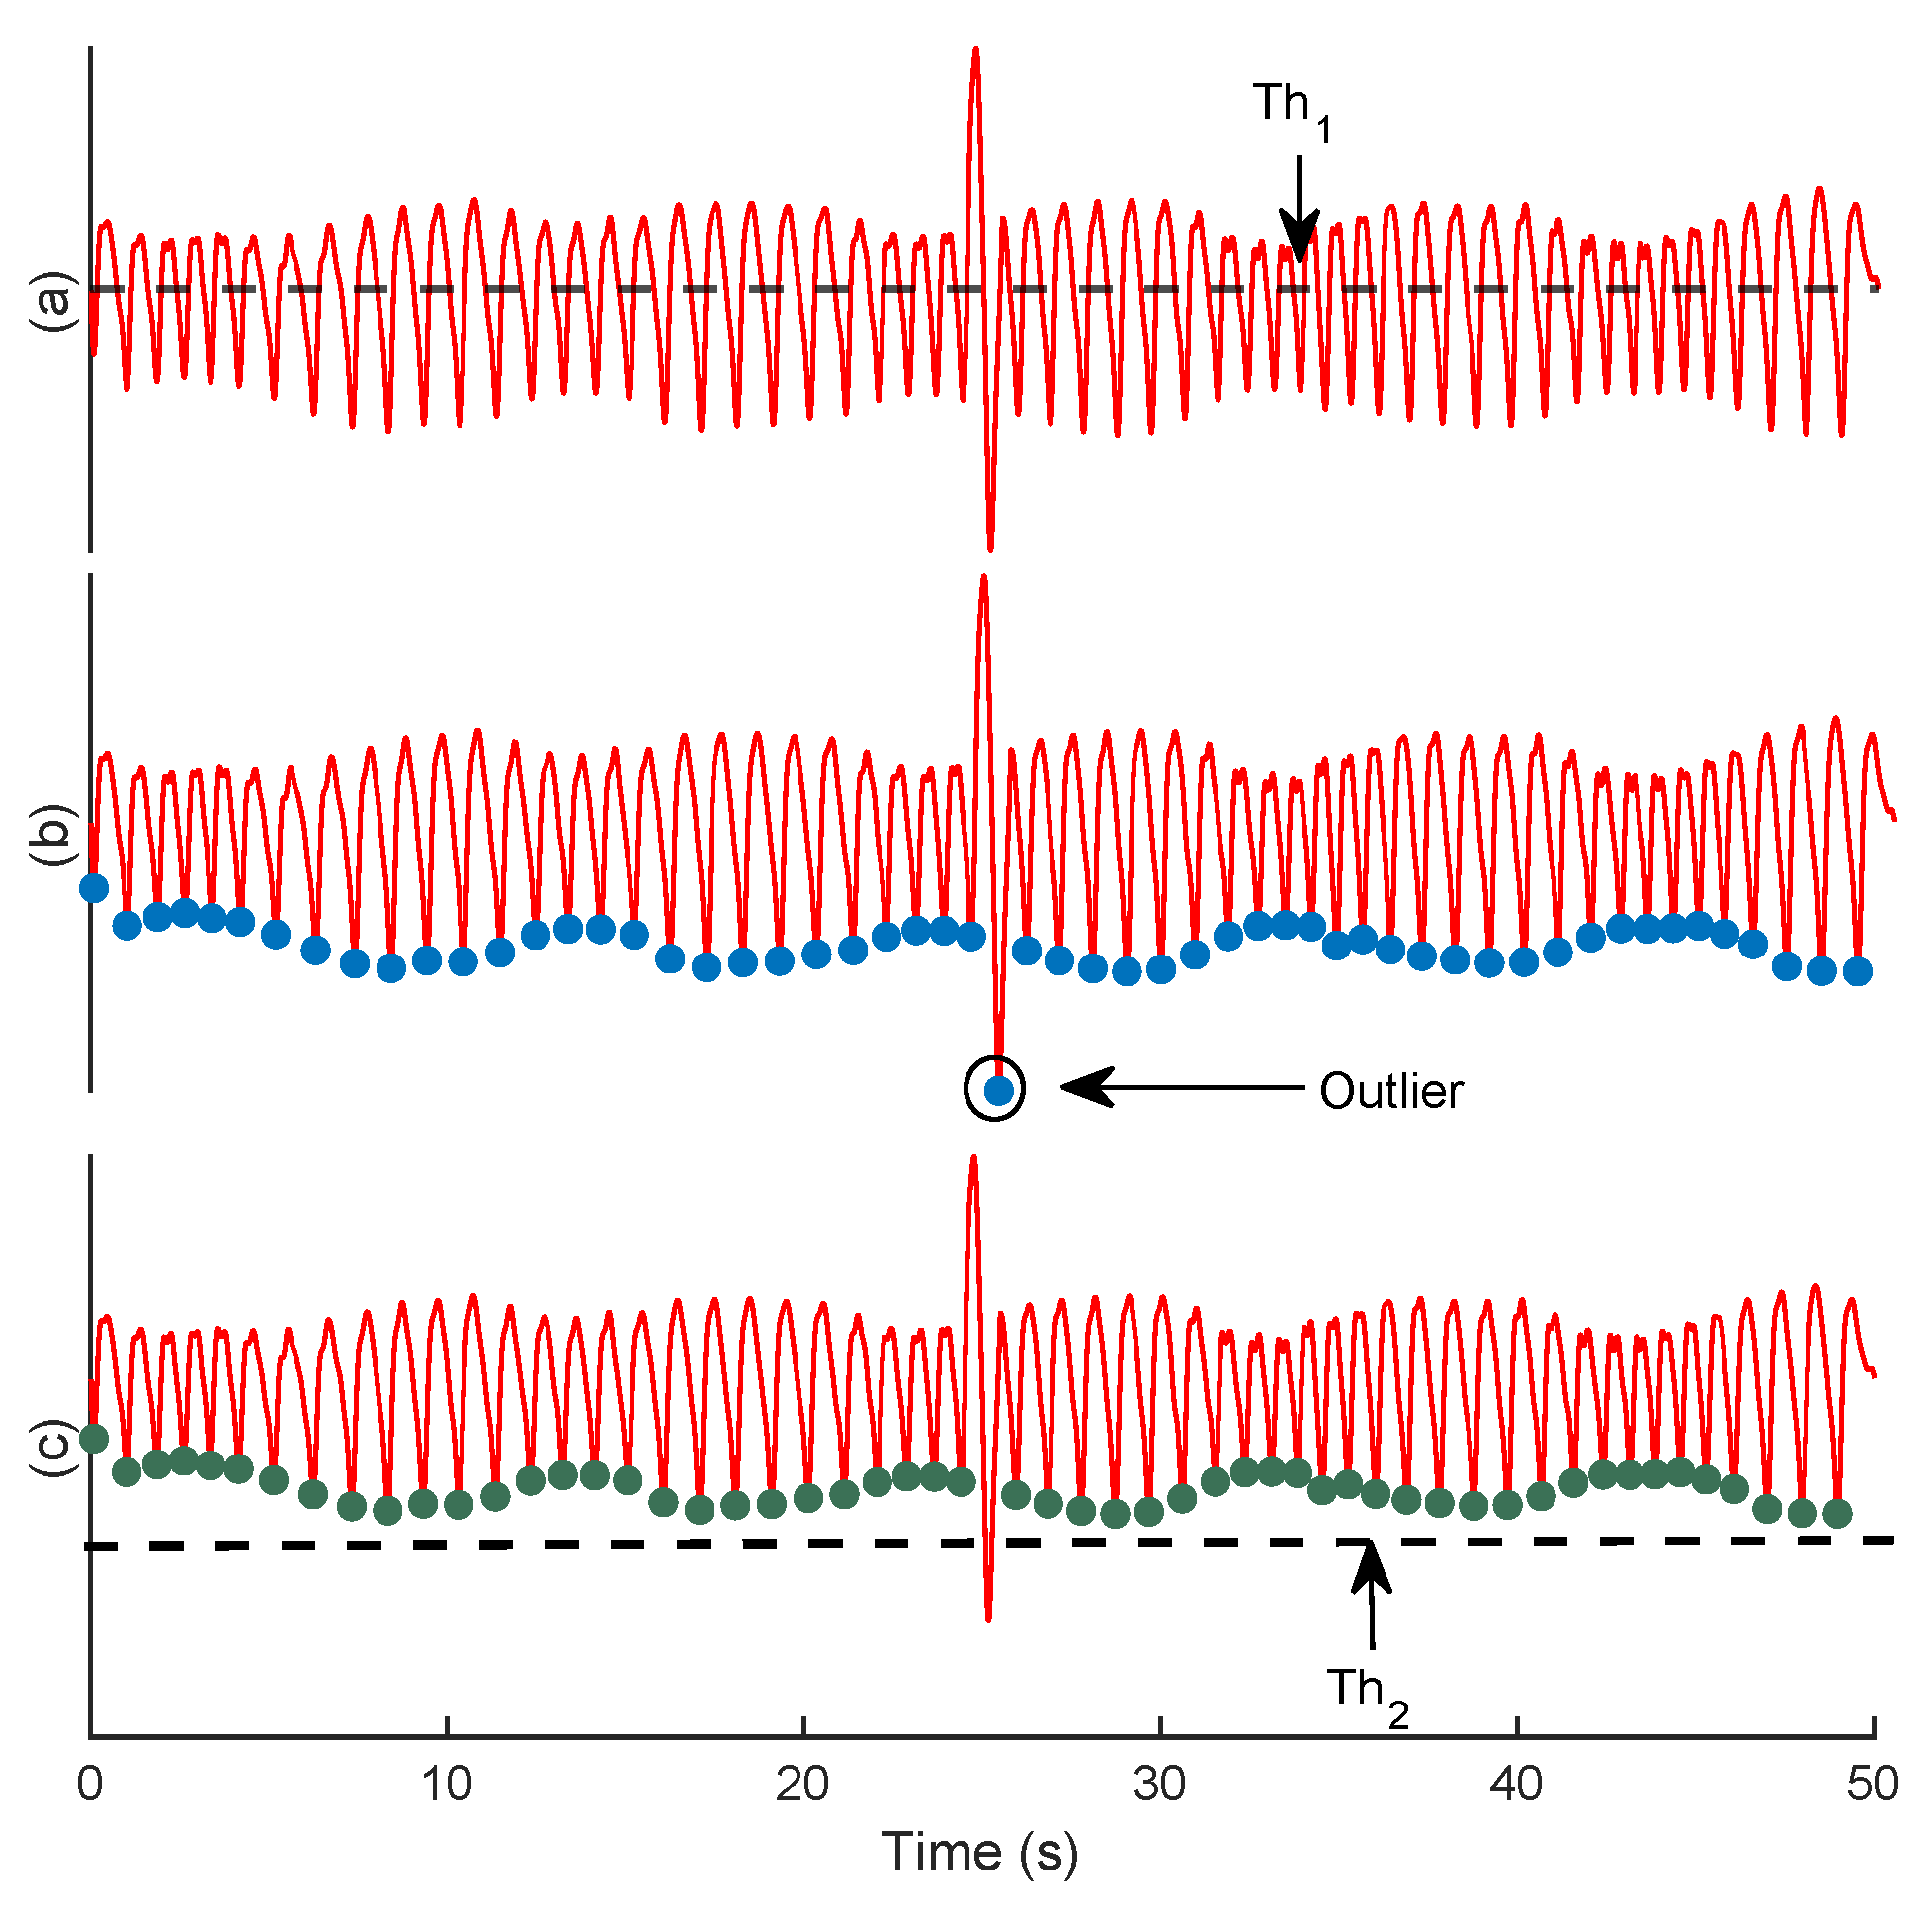
2.2.1. Trough Detection
| Algorithm 1 Localization of signal troughs | |
| Input: signal , constants A, B | |
| Output: Troughs, K | |
| Initialisation 0, 0, [ ], [ ] | |
| 1: | Normalize () |
| 2: | A × Mean () |
| 3: | for to do |
| 4: | if then |
| 5: | |
| 6: | end if |
| 7: | end for |
| 8: | |
| 9: | Mean () + B × std () |
| 10: | for to do |
| 11: | if then |
| 12: | |
| 13: | end if |
| 14: | end for |
| 15: | returnK |
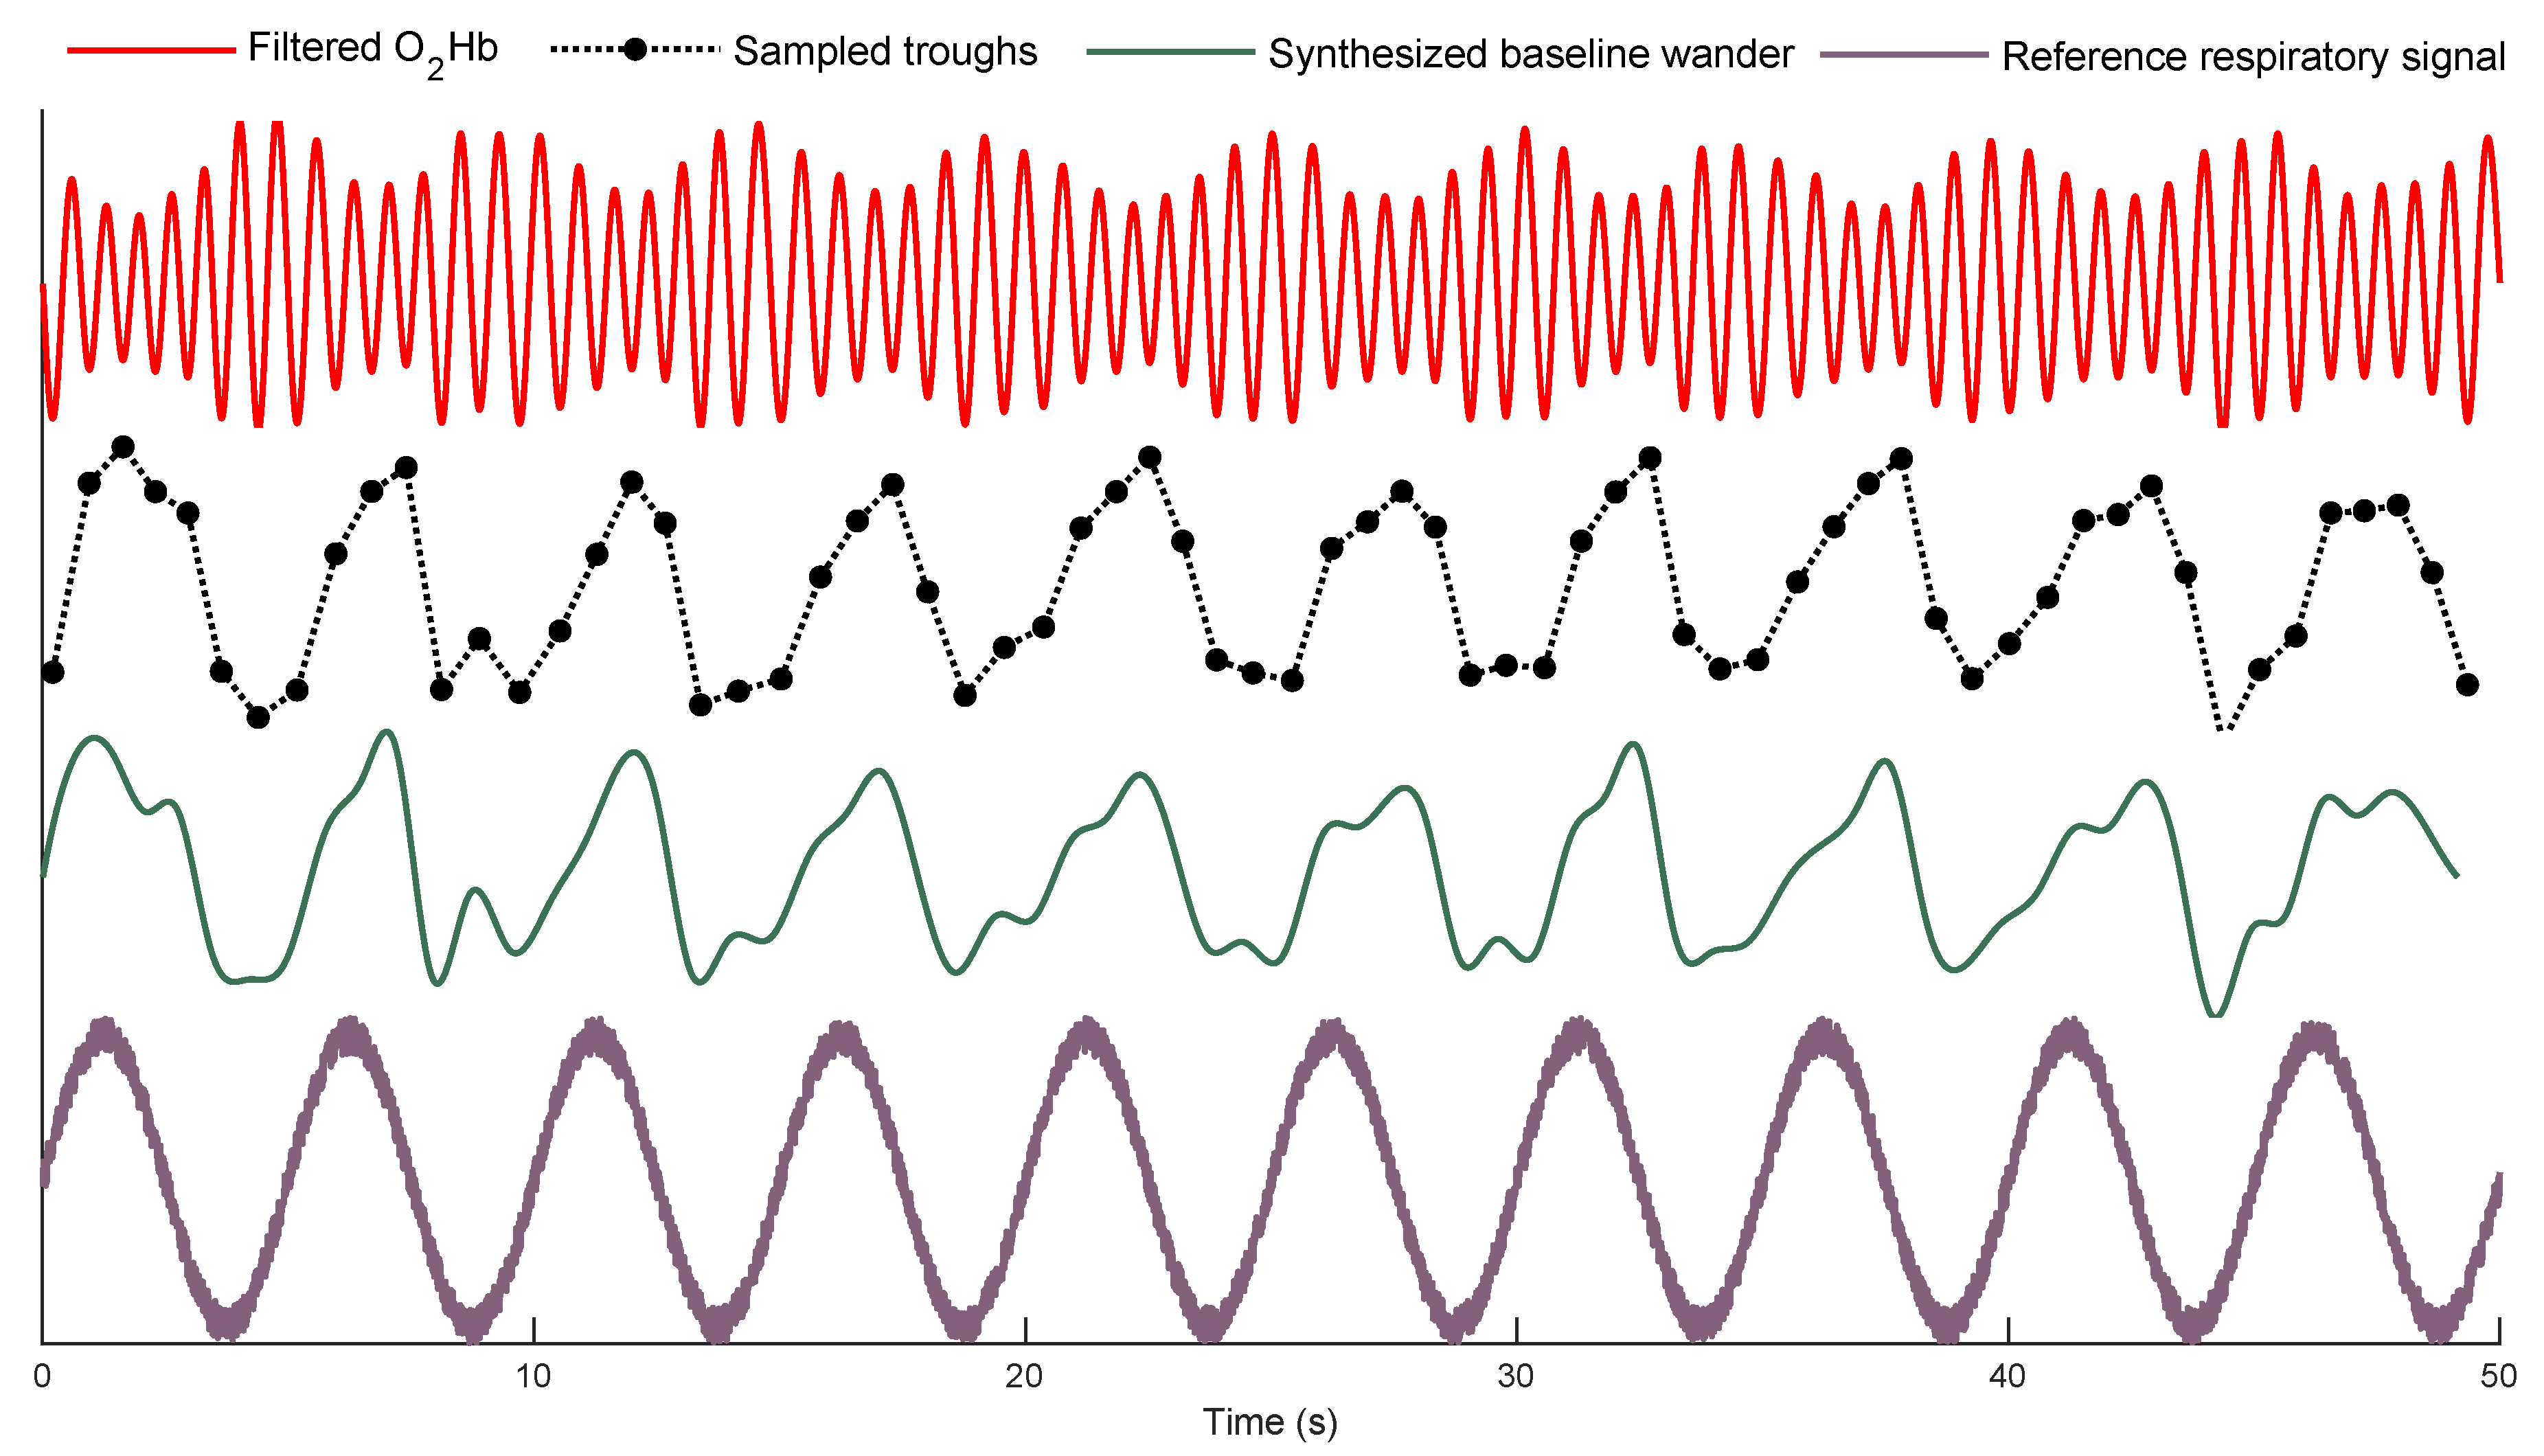
2.2.2. Forming the Baseline Wander Signal
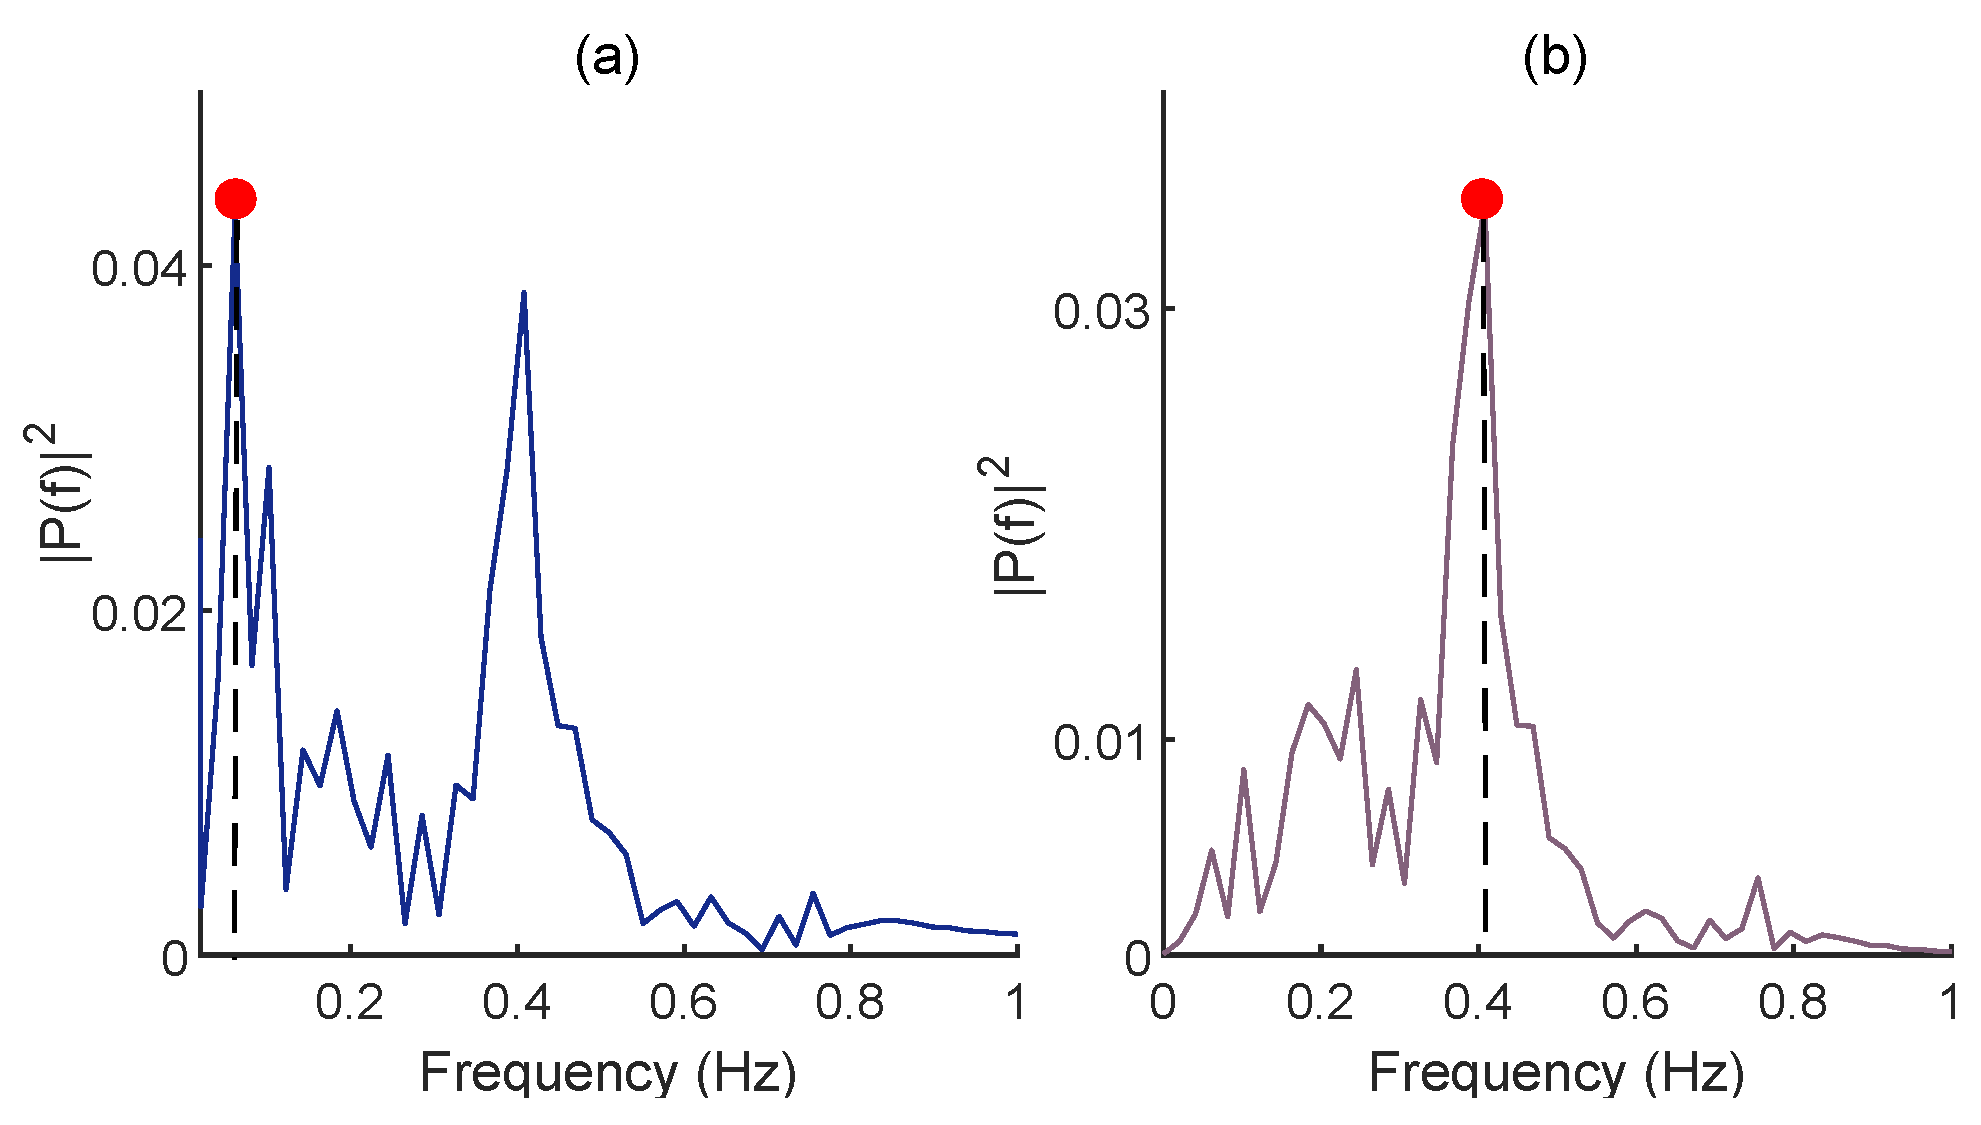
2.2.3. FFT for RR Estimation
| Algorithm 2 Estimation of the RR from the signal’s baseline wander | |
| Input: signal , Troughs of signal K, and the length of moving average | |
| filter L | |
| Output: | |
| 1: | Spline (K, , 1 to length()) |
| 2: | ones(L,1) |
| 3: | filtfilt(,1,) |
| 4: | |
| 5: | FFT () |
| 6: | find( Max()) |
| 7: | r × 60 |
| 8: | return |
2.3. Evaluation Criteria
3. Data
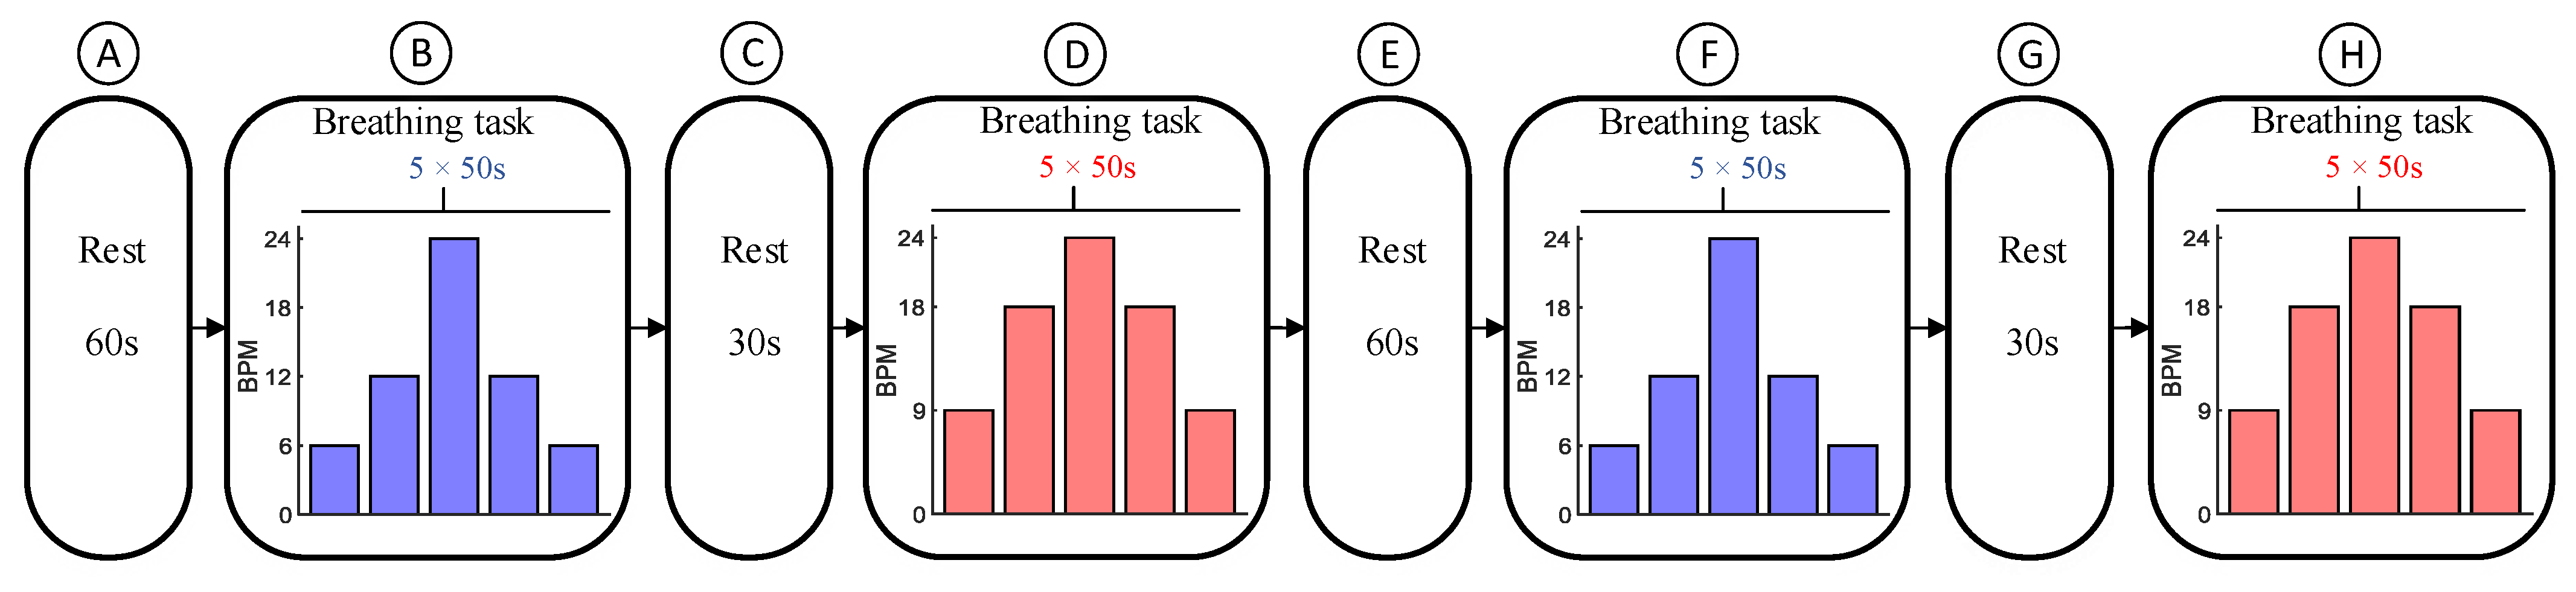
3.1. Data Recording Protocol
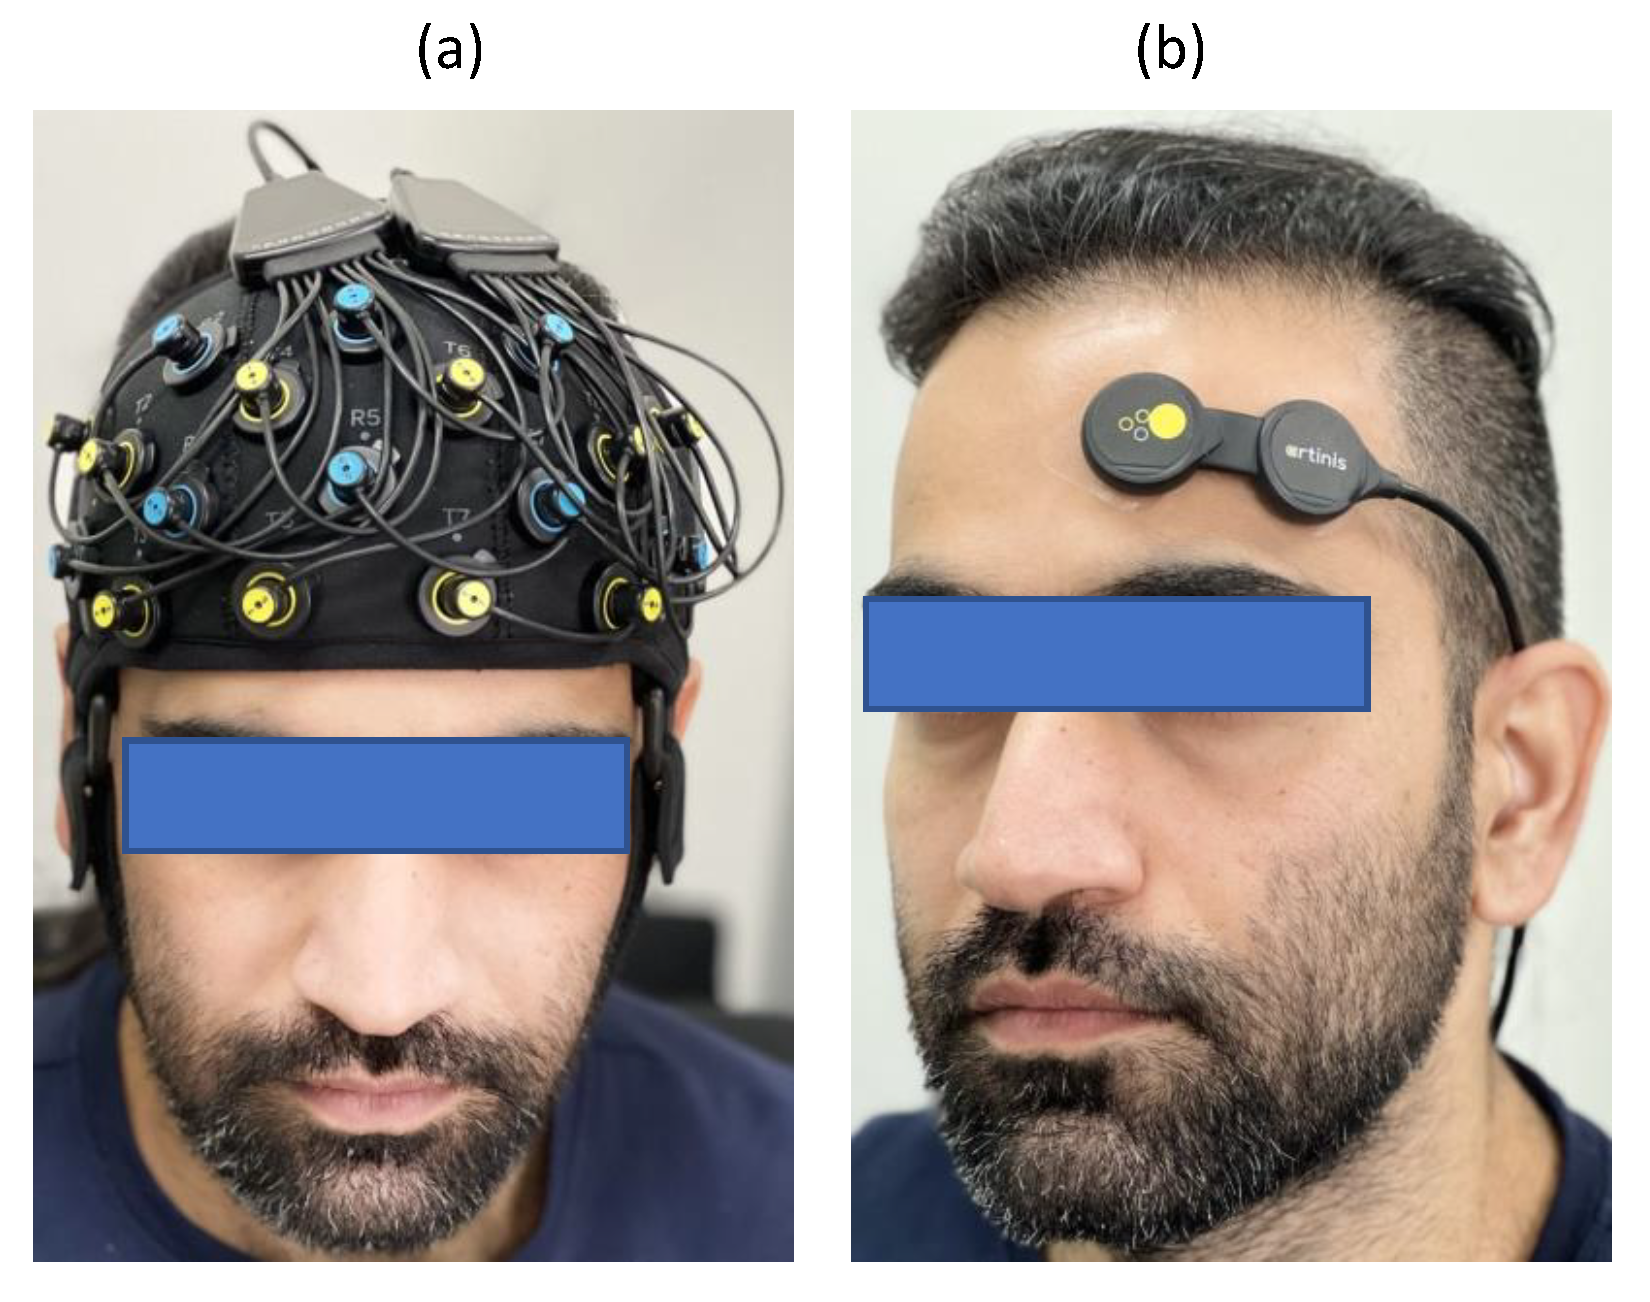
3.2. fNIRS Systems for Data Collection
3.2.1. Dataset I
3.2.2. Dataset II
4. Experimental Results
4.1. Optimization of the Proposed Method’s Parameters
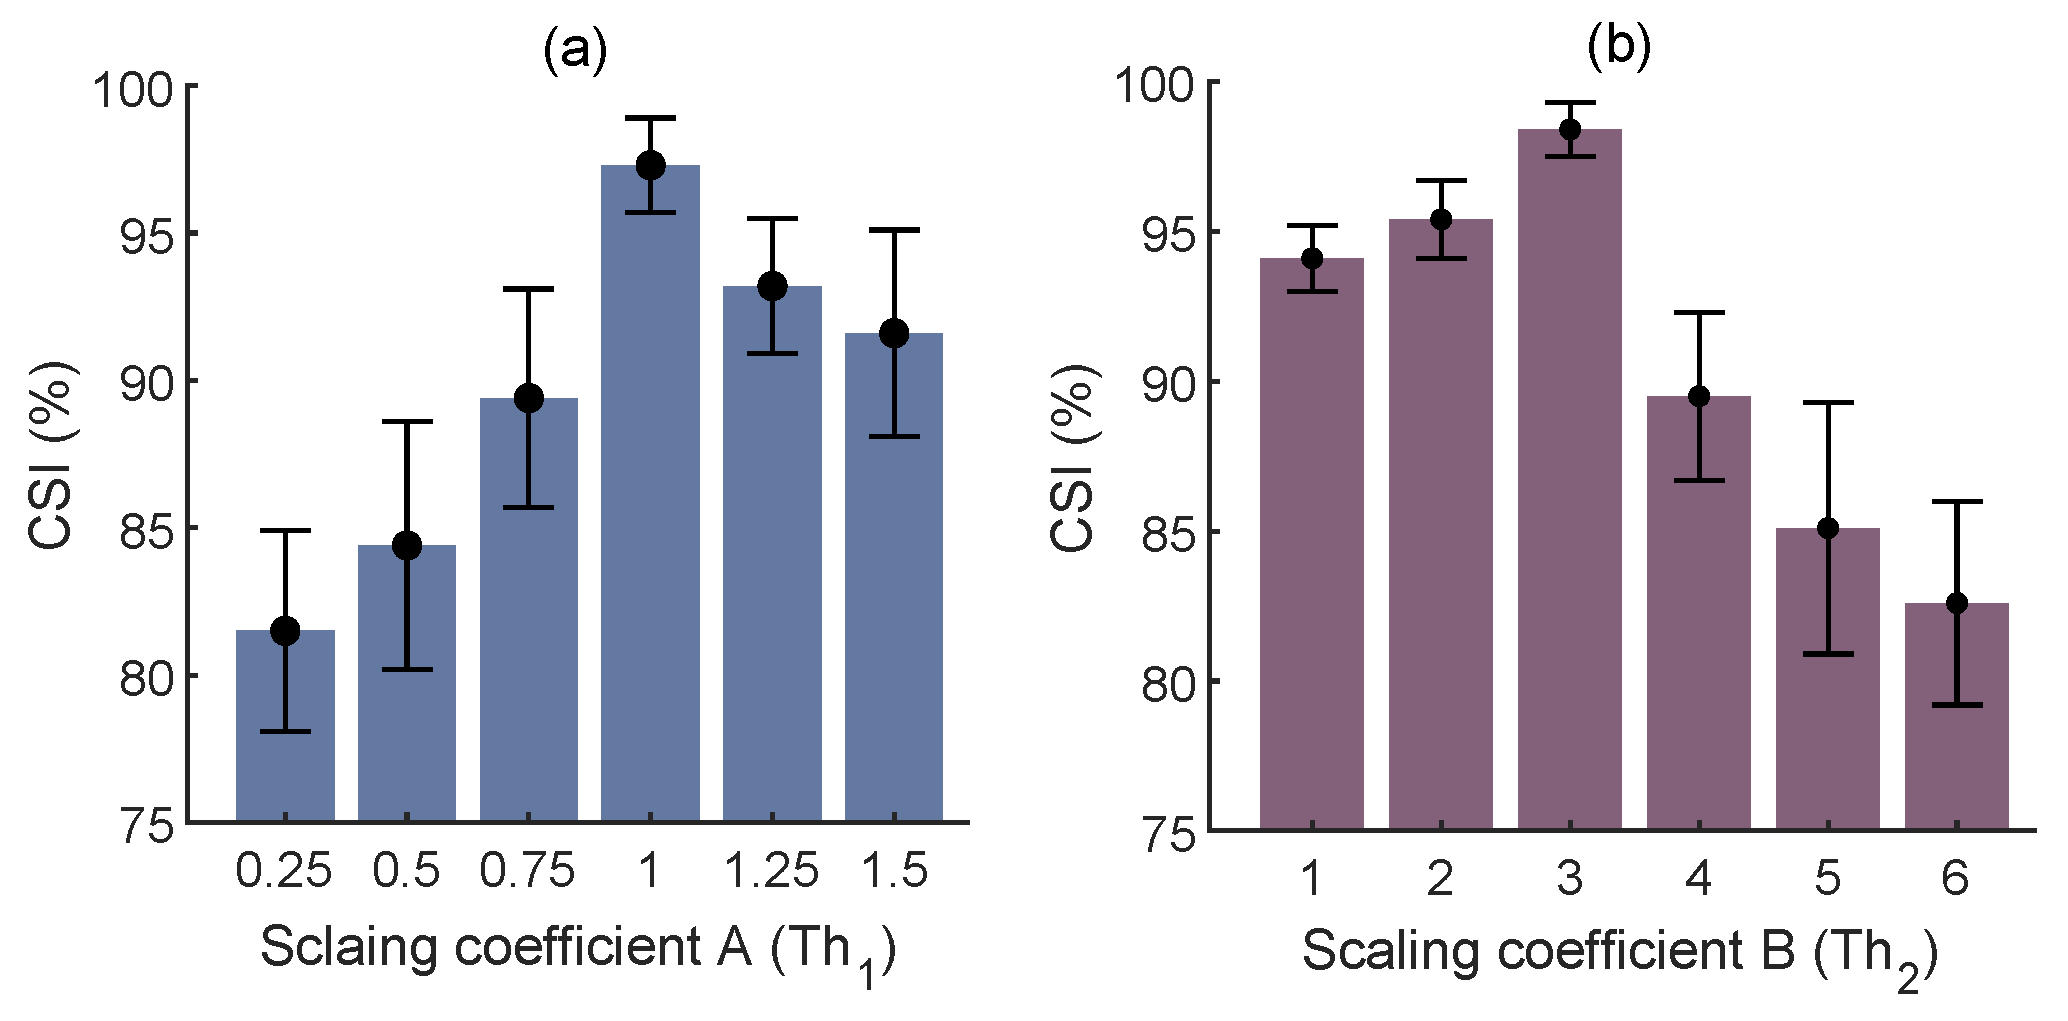
4.1.1. Trough Detection
4.1.2. The Length of MA Filtering
4.1.3. Results of RR Estimation from Dataset I
4.2. Results of RR Estimation from Dataset II
5. Discussion
5.1. Significance and Robustness of the Proposed Method
5.2. Comparison with State-of-the-Art Methods
5.3. Directions for Future Work
6. Conclusions
Author Contributions
Funding
Institutional Review Board Statement
Informed Consent Statement
Data Availability Statement
Conflicts of Interest
References
- Paulmurugan, K.; Vijayaragavan, V.; Ghosh, S.; Padmanabhan, P.; Gulyás, B. Brain–Computer Interfacing Using Functional Near-Infrared Spectroscopy (fNIRS). Biosensors 2021, 11, 389. [Google Scholar] [CrossRef] [PubMed]
- Ferrari, M.; Quaresima, V. A Brief Review on the History of Human Functional Near-Infrared Spectroscopy (fNIRS) Development and Fields of Application. NeuroImage 2012, 63, 921–935. [Google Scholar] [CrossRef] [PubMed]
- Almajidy, R.K.; Mankodiya, K.; Abtahi, M.; Hofmann, U.G. A Newcomer’s Guide to Functional Near Infrared Spectroscopy Experiments. IEEE Rev. Biomed. Eng. 2020, 13, 292–308. [Google Scholar] [CrossRef] [PubMed] [Green Version]
- Scholkmann, F.; Kleiser, S.; Metz, A.J.; Zimmermann, R.; Pavia, J.M.; Wolf, U.; Wolf, M. A Review on Continuous Wave Functional Near-Infrared Spectroscopy and Imaging Instrumentation and Methodology. NeuroImage 2014, 85, 6–27. [Google Scholar] [CrossRef] [PubMed]
- Chao, J.; Zheng, S.; Wu, H.; Wang, D.; Zhang, X.; Peng, H.; Hu, B. fNIRS Evidence for Distinguishing Patients With Major Depression and Healthy Controls. IEEE Trans. Neural Syst. Rehabil. Eng. 2021, 29, 2211–2221. [Google Scholar] [CrossRef]
- Borgheai, S.B.; McLinden, J.; Zisk, A.H.; Hosni, S.I.; Deligani, R.J.; Abtahi, M.; Mankodiya, K.; Shahriari, Y. Enhancing Communication for People in Late-Stage ALS Using an fNIRS-Based BCI System. IEEE Trans. Neural Syst. Rehabil. Eng. 2020, 28, 1198–1207. [Google Scholar] [CrossRef]
- Wang, Z.; Zhang, J.; Zhang, X.; Chen, P.; Wang, B. Transformer Model for Functional Near-Infrared Spectroscopy Classification. IEEE J. Biomed. Health Inform. 2022, 26, 2559–2569. [Google Scholar] [CrossRef]
- Sommer, N.M.; Kakillioglu, B.; Grant, T.; Velipasalar, S.; Hirshfield, L. Classification of fNIRS Finger Tapping Data with Multi-Labeling and Deep Learning. IEEE Sens. J. 2021, 21, 24558–24569. [Google Scholar] [CrossRef]
- Joshi, S.; Herrera, R.R.; Springett, D.N.; Weedon, B.D.; Ramirez, D.Z.M.; Holloway, C.; Dawes, H.; Ayaz, H. Neuroergonomic Assessment of Wheelchair Control Using Mobile fNIRS. IEEE Trans. Neural Syst. Rehabil. Eng. 2020, 28, 1488–1496. [Google Scholar] [CrossRef]
- Pellegrini-Laplagne, M.; Dupuy, O.; Sosner, P.; Bosquet, L. Effect of Simultaneous Exercise and Cognitive Training on Executive Functions, Baroreflex Sensitivity, and Pre-frontal Cortex Oxygenation in Healthy Older Adults: A Pilot Study. GeroScience 2022, 1, 1–22. [Google Scholar] [CrossRef]
- Germain, C.; Perrot, A.; Tomasino, C.; Bonnal, J.; Ozsancak, C.; Auzou, P.; Prieur, F. Effect of the Level of Physical Activity on Prefrontal Cortex Hemodynamics in Older Adults During Single- and Dual-Task Walking. J. Aging Phys. Act. 2022, 1, 1–9. [Google Scholar] [CrossRef] [PubMed]
- Goenarjo, R.; Dupuy, O.; Fraser, S.; Berryman, N.; Perrochon, A.; Bosquet, L. Cardiorespiratory Fitness and Prefrontal Cortex Oxygenation During Stroop Task in Older Males. Physiol. Behav. 2021, 242, 113621. [Google Scholar] [CrossRef] [PubMed]
- Koren, Y.; Mairon, R.; Sofer, I.; Parmet, Y.; Ben-Shahar, O.; Bar-Haim, S. Vision, Cognition, and Walking Stability in Young Adults. Sci. Rep. 2022, 12, 513. [Google Scholar] [CrossRef] [PubMed]
- Bizzego, A.; Neoh, M.; Gabrieli, G.; Esposito, G. A Machine Learning Perspective on fNIRS Signal Quality Control Approaches. IEEE Trans. Neural Syst. Rehabil. Eng. 2022, 30, 2292–2300. [Google Scholar] [CrossRef] [PubMed]
- Patashov, D.; Menahem, Y.; Gurevitch, G.; Kameda, Y.; Goldstein, D.; Balberg, M. fNIRS: Non-stationary Preprocessing Methods. Biomed. Signal Process. Control 2023, 79, 104110. [Google Scholar] [CrossRef]
- Tachtsidis, I.; Scholkmann, F. False Positives and False Negatives in Functional Near-Infrared Spectroscopy: Issues, Challenges, and the Way Forward. Neurophotonics 2016, 3, 031405. [Google Scholar] [CrossRef] [Green Version]
- Zhou, L.; Chen, C.; Liu, Z.; Hu, Y.; Chen, M.; Li, Y.; Hu, Y.; Wang, G.; Zhao, J. A Coarse/Fine Dual-Stage Motion Artifacts Removal Algorithm for Wearable NIRS Systems. IEEE Sens. J. 2021, 21, 13574–13583. [Google Scholar] [CrossRef]
- Ivo, I.A.; Horschig, J.M.; Gerakaki, S.; Wanrooij, M.M.V.; Colier, W.N.J.M. Cerebral Oxygenation Responses to Head Movement Measured with Near-Infrared Spectroscopy. In Biophotonics in Exercise Science, Sports Medicine, Health Monitoring Technologies, and Wearables II; SPIE: Bellingham, WA, USA, 2021; Volume 11638, pp. 40–52. [Google Scholar]
- Zhang, F.; Cheong, D.; Khan, A.F.; Chen, Y.; Ding, L.; Yuan, H. Correcting Physiological Noise in Whole-Head Functional Near-Infrared Spectroscopy. J. Neurosci. Methods 2021, 360, 109262. [Google Scholar] [CrossRef]
- Svinkunaite, L.; Horschig, J.; Floor-Westerdijk, M. Employing Cardiac and Respiratory Features Extracted From fNIRS Signals for Mental Workload Classification. In Biophotonics in Exercise Science, Sports Medicine, Health Monitoring Technologies, and Wearables II; SPIE: Bellingham, WA, USA, 2021; Volume 11638, pp. 53–61. [Google Scholar]
- Hakimi, N.; Jodeiri, A.; Mirbagheri, M.; Setarehdan, S.K. Proposing a Convolutional Neural Network for Stress Assessment by Means of Derived Heart Rate from Functional Near Infrared Spectroscopy. Comput. Biol. Med. 2020, 121, 103810. [Google Scholar] [CrossRef]
- Izzetoglu, M.; Holtzer, R. Effects of Processing Methods on fNIRS Signals Assessed During Active Walking Tasks in Older Adults. IEEE Trans. Neural Syst. Rehabil. Eng. 2020, 28, 699–709. [Google Scholar] [CrossRef]
- Bellissimo, G.; Leslie, E.; Maestas, V.; Zuhl, M. The Effects of Fast and Slow Yoga Breathing on Cerebral and Central Hemodynamics. Int. J. Yoga 2020, 13, 207–212. [Google Scholar] [CrossRef] [PubMed]
- Bak, S.; Shin, J.; Jeong, J. Subdividing Stress Groups into Eustress and Distress Groups Using Laterality Index Calculated from Brain Hemodynamic Response. Biosensors 2022, 12, 33. [Google Scholar] [CrossRef] [PubMed]
- Charlton, P.H.; Birrenkott, D.A.; Bonnici, T.; Pimentel, M.A.; Johnson, A.E.; Alastruey, J.; Tarassenko, L.; Watkinson, P.J.; Beale, R.; Clifton, D.A. Breathing Rate Estimation From the Electrocardiogram and Photoplethysmogram: A Review. IEEE Rev. Biomed. Eng. 2018, 11, 2–20. [Google Scholar] [CrossRef] [PubMed] [Green Version]
- Reddy, P.; Izzetoglu, M.; Shewokis, P.A.; Sangobowale, M.; Diaz-Arrastia, R.; Izzetoglu, K. Evaluation of fNIRS Signal Components Elicited by Cognitive and Hypercapnic Stimuli. Sci. Rep. 2021, 11, 23457. [Google Scholar] [CrossRef]
- Pollonini, L.; Bortfeld, H.; Oghalai, J. PHOEBE: A Method for Real Time Mapping of Optodes-Scalp Coupling in Functional Near-Infrared Spectroscopy. Biomed. Opt. Express 2016, 7, 5104–5119. [Google Scholar] [CrossRef] [Green Version]
- Sappia, M.S.; Hakimi, N.; Colier, W.N.J.M.; Horschig, J.M. Signal Quality Index: An Algorithm for Quantitative Assessment of Functional Near Infrared Spectroscopy Signal Quality. Biomed. Opt. Express 2020, 11, 6732–6754. [Google Scholar] [CrossRef]
- Delpy, D.T.; Cope, M.; Zee, P.V.D.; Arridge, S.; Wray, S.; Wyatt, J. Estimation of Optical Pathlength Through Tissue from Direct Time of Flight Measurement. Phys. Med. Biol. 1988, 33, 1433. [Google Scholar] [CrossRef] [Green Version]
- Lázaro, J.; Gil, E.; Bailón, R.; Laguna, P. Deriving Respiration From the Pulse Photoplethysmographic Signal. In 2011 Computing in Cardiology; IEEE: Piscataway, NJ, USA, 2011; pp. 713–716. [Google Scholar]
- Estañol, B.; Sentíes-Madrid, H.; Elías, Y.; Coyac, P.; Martínez-Memije, R.; Infante, Ó.; Tellez-Zenteno, J.F.; García-Ramos, G. Respiratory and Non-respiratory Oscillations of the Skin Blood Flow: A Window to the Function of the Sympathetic Fibers to the Skin Blood Vessels. Arch. Cardiol. México 2008, 78, 187–194. [Google Scholar]
- Madhav, K.V.; Ram, M.R.; Krishna, E.H.; Komalla, N.R.; Reddy, K.A. Robust Extraction of Respiratory Activity From PPG Signals Using Modified MSPCA. IEEE Trans. Instrum. Meas. 2013, 62, 1094–1106. [Google Scholar] [CrossRef]
- Hernando, A.; Pelaez, M.D.; Lozano, M.T.; Aiger, M.; Gil, E.; Lázaro, J. Finger and Forehead PPG Signal Comparison for Respiratory Rate Estimation based on Pulse Amplitude Variability. In Proceedings of the 2017 25th European Signal Processing Conference (EUSIPCO), Kos, Greece, 28 August–2 September 2017; pp. 2076–2080. [Google Scholar]
- Hernando, A.; Peláez-Coca, M.D.; Lozano, M.T.; Lázaro, J.; Gil, E. Finger and forehead PPG signal comparison for respiratory rate estimation. Physiol. Meas. 2019, 40, 095007. [Google Scholar] [CrossRef] [Green Version]
- Tipton, M.J.; Harper, A.; Paton, J.F.R.; Costello, J.T. The Human Ventilatory Response to Stress: Rate or Depth? J. Physiol. 2017, 17, 5729–5752. [Google Scholar] [CrossRef] [PubMed]
- Grassmann, M.; Vlemincx, E.; Leupoldt, A.; Mittelstädt, J.M.; Bergh, O. Respiratory Changes in Response to Cognitive Load: A Systematic Review. Neural Plast. 2016, 2016, 8146809. [Google Scholar] [CrossRef] [PubMed] [Green Version]
- Iqbal, T.; Elahi, A.; Ganly, S.; Wijns, W.; Shahzad, A. Photoplethysmography-Based Respiratory Rate Estimation Algorithm for Health Monitoring Applications. J. Med. Biol. Eng. 2022, 42, 242–252. [Google Scholar] [CrossRef] [PubMed]
- Tong, Y.; Lindsey, K.P.; Frederick, B. Partitioning of Physiological Noise Signals in the Brain with Concurrent Near-Infrared Spectroscopy and fMRI. J. Cereb. Blood Flow Metab. 2011, 31, 2352–2362. [Google Scholar] [CrossRef] [PubMed] [Green Version]
- Lühmann, A.; Li, X.; Müller, K.R.; Boas, D.A.; Yücel, M.A. Improved physiological noise regression in fNIRS: A multimodal extension of the General Linear Model using temporally embedded Canonical Correlation Analysis. NeuroImage 2020, 208, 116472. [Google Scholar] [CrossRef] [PubMed]
- Charlton, P.H.; Bonnici, T.; Tarassenko, L.; Alastruey, J.; Clifton, D.A.; Beale, R.; Watkinson, P.J. Extraction of respiratory signals from the electrocardiogram and photoplethysmogram: Technical and physiological determinants. Physiol. Meas. 2017, 38, 669–690. [Google Scholar] [CrossRef]


| MA Filter Length (s) | Average AE ± Std (BPM) |
|---|---|
| 2 | 3.2 ± 1.9 |
| 2.5 | 3.1 ± 1.8 |
| 3 | 2.6 ± 1.3 |
| 3.5 | 2.7 ± 1.4 |
| 4 | 2.9 ± 1.9 |
| 4.5 | 2.9 ± 2.1 |
| 5 | 3.1 ± 2.2 |
| Subjects | Average AE (BPM) |
|---|---|
| 1 | 0.9 |
| 2 | 2.7 |
| 3 | 2.7 |
| 4 | 1.1 |
| 5 | 2.2 |
| 6 | 1.9 |
| 7 | 2.1 |
| 8 | 5.2 |
| Subjects | Average AE (BPM) |
|---|---|
| 1 | 1.7 |
| 2 | 0.3 |
| 3 | 0.3 |
| 4 | 0.5 |
| 5 | 1.8 |
| 6 | 0.8 |
| 7 | 1.5 |
| 8 | 2.7 |
| 9 | 2.1 |
| 10 | 0.3 |
| 11 | 0.4 |
| 12 | 0.7 |
| 13 | 3.6 |
| 14 | 0.5 |
| 15 | 1.8 |
| 16 | 1.8 |
| 17 | 0.4 |
| 18 | 2.1 |
Publisher’s Note: MDPI stays neutral with regard to jurisdictional claims in published maps and institutional affiliations. |
© 2022 by the authors. Licensee MDPI, Basel, Switzerland. This article is an open access article distributed under the terms and conditions of the Creative Commons Attribution (CC BY) license (https://creativecommons.org/licenses/by/4.0/).
Share and Cite
Hakimi, N.; Shahbakhti, M.; Sappia, S.; Horschig, J.M.; Bronkhorst, M.; Floor-Westerdijk, M.; Valenza, G.; Dudink, J.; Colier, W.N.J.M. Estimation of Respiratory Rate from Functional Near-Infrared Spectroscopy (fNIRS): A New Perspective on Respiratory Interference. Biosensors 2022, 12, 1170. https://doi.org/10.3390/bios12121170
Hakimi N, Shahbakhti M, Sappia S, Horschig JM, Bronkhorst M, Floor-Westerdijk M, Valenza G, Dudink J, Colier WNJM. Estimation of Respiratory Rate from Functional Near-Infrared Spectroscopy (fNIRS): A New Perspective on Respiratory Interference. Biosensors. 2022; 12(12):1170. https://doi.org/10.3390/bios12121170
Chicago/Turabian StyleHakimi, Naser, Mohammad Shahbakhti, Sofia Sappia, Jörn M. Horschig, Mathijs Bronkhorst, Marianne Floor-Westerdijk, Gaetano Valenza, Jeroen Dudink, and Willy N. J. M. Colier. 2022. "Estimation of Respiratory Rate from Functional Near-Infrared Spectroscopy (fNIRS): A New Perspective on Respiratory Interference" Biosensors 12, no. 12: 1170. https://doi.org/10.3390/bios12121170
APA StyleHakimi, N., Shahbakhti, M., Sappia, S., Horschig, J. M., Bronkhorst, M., Floor-Westerdijk, M., Valenza, G., Dudink, J., & Colier, W. N. J. M. (2022). Estimation of Respiratory Rate from Functional Near-Infrared Spectroscopy (fNIRS): A New Perspective on Respiratory Interference. Biosensors, 12(12), 1170. https://doi.org/10.3390/bios12121170