Article

Highly Sensitive Detection and Differentiation of Endotoxins Derived from Bacterial Pathogens by Surface-Enhanced Raman Scattering

1
College of Food Science and Nutritional Engineering, National Engineering Research Center for Fruit & Vegetable Processing, Key Laboratory of Fruit & Vegetable Processing, Ministry of Agriculture, Beijing Key Laboratory for Food Non-Thermal Processing, China Agricultural University, Beijing 100083, China
2
Department of Physics and Astronomy, University of Georgia, Athens, GA 30602, USA
3
Department of Basic Medical Sciences, College of Medicine, QU Health, Qatar University, Doha P.O. Box 2731, Qatar
4
Biomedical and Pharmaceutical Research Unit, QU Health, Qatar University, Doha P.O. Box 2731, Qatar
*
Authors to whom correspondence should be addressed.
Biosensors 2021, 11(7), 234; https://doi.org/10.3390/bios11070234
Submission received: 12 May 2021 / Revised: 31 May 2021 / Accepted: 2 June 2021 / Published: 11 July 2021
(This article belongs to the Special Issue Biomarkers Used for the Diagnosis of Diseases)

Abstract

:
Bacterial endotoxins, as major components of Gram-negative bacterial outer membrane leaflets and a well-characterized TLR4-MD-2 ligand, are lipopolysaccharides (LPSs) that are constantly shed from bacteria during growth and infection. For the first time, we report that unique surface-enhanced Raman scattering (SERS) spectra of enteric LPSs from E. coli, S. typhimurium, S. minnesota, V. cholerae, Rhizobium species R. CE3, and R. NGR, as well as Neisseria meningitidis endotoxin structures, LPSs, lipid A, and KDO2-lipid A can be obtained. The characteristic peaks of the SERS spectra reveal that most of the tested LPS structures are from lipids and saccharides, i.e., the major components of LPSs, and these spectra can be successfully used to differentiate between endotoxins with principal components analysis. In addition, all the LPS samples here are measured at a concentration of 10 nmole/mL, which corresponds to their relevant pathophysiological concentrations in clinical infections. This study demonstrates that LPSs can be used as biomarkers for the highly sensitive detection of bacteria using SERS-based methods.

Graphical Abstract

1. Introduction

An endotoxin or lipopolysaccharide is a glycolipid and is a major component of the outer membrane in Gram-negative bacteria. Endotoxins are shed from live bacteria as membrane blebs and vesicles or released from dead bacteria into tissue at the site of infection. LPSs are well-characterized pathogen-associated molecular pattern (PAMP) ligands that bind to the human TLR4-MD-2 receptor and elicit strong proinflammatory responses in immune cells [1,2]. For example, Neisseria meningitidis is a strictly human pathogen that causes meningitis and is the leading cause of fulminant sepsis and death [3]. The meningococcal LPS molecule produced by Neisseria meningitidis is composed of a lipid A component containing di-glucosamine that is linked to two KDO sugars and a heptose containing sugar or saccharide chain, as shown in Figure A1. The meningococcal LPS is a very potent inducer of proinflammatory mediator release, known as the cytokine storm, which contributes to massive fulminant meningococcal sepsis and rapid death [3]. As such, the rapid and sensitive detection of trace amounts of meningococcal LPSs in biological fluids is a highly desirable approach to help diagnose meningococcal infection, thus facilitating therapy and saving lives.
Similarly, other Gram-negative bacteria contain endotoxins or LPSs as a major component of their outer membrane. Enteric bacteria LPS structures also contain a lipid A moiety linked to repeating units of polysaccharide chains, known as the O-antigen. Similar to meningococcal LPSs, enteric KDO2-lipid A is responsible for the endotoxic activity of LPSs; however, LPS and lipid A structures from enteric pathogens are more diverse and vary greatly in their ability to elicit TLR4-MD-2 mediated inflammatory responses [4]. Enteric lipid A structures, such as E. coli, Salmonella, and Klebsiella, all have fatty acyl chain lengths ranging from 10 to 16 carbon atoms, as shown in Figure A2, while other Gram-negative bacteria like Bacteroides and Rhizobium contain branched fatty acyl chains with extended lengths of up to 28 carbon atoms [5]. The length of the fatty acyl chain impacts lipid A endotoxic activity, where extended length fatty acyl chains dramatically reduce lipid A potency and act as a TLR4-MD-2 antagonist rather than as an agonist. These pathogenic Gram-negative bacteria can shed active endotoxins and elicit pro-inflammatory responses. Consequently, the rapid and sensitive detection of enteric endotoxin structures in biological fluids and consumed food would greatly restrict the transmission of infections.
The current methods to detect endotoxins in biological fluids and environmental samples are often time-consuming and costly, and some methods are not sensitive enough. A limulus amebocyte lysate (LAL) assay is the most common method to detect an endotoxin [6]. The LAL assay depends on the enzyme purified from a horseshoe crab that forms a clot upon detecting an endotoxin [6]. In spite of the significant enhancement of enzyme specificity and LAL assay performance, the method may yield false positive or negative results as the enzyme reacts with abundantly available glucan molecules derived from yeast and plant sources [6]. Matrix-assisted laser desorption ionization/time of flight mass spectroscopy (MALDI-TOF MS) has also been used to identify bacterial endotoxins accurately, but this method is very expensive and time-consuming and requires specific expertise [7]. New methods that can rapidly and reliably detect bacterial endotoxins with a low limit of detection are highly desired in the fields of human health, environmental monitoring, and food safety.
In recent years, with the development of nanotechnology, biosensors based on novel nanostructures have been used to detect and identify trace amounts of endotoxins in human fluid samples using fluorescence, chemiluminescence, and electrical gradient applications [8,9,10]. Surface-enhanced Raman scattering (SERS) is considered to be one of the most sensitive analytical tools, with the potential to perform single-molecule detection under ambient conditions [11]. Recent ultra-sensitive SERS-based methods can detect single molecule reactions on a substrate surface [12,13]; however, Raman-based studies on the unique spectra of bacterial endotoxin are currently very limited. A recent study reported the in situ detection of a Pseudomonas aeruginosa endotoxin using a nanogold-sputtered cicada wing as a SERS chip; however, it used 4-mercaptobenzoic acid (4-MBA) and p-aminophenol (PAP) as SERS reporters rather than the intrinsic SERS spectra of the endotoxin itself [14]. In order to establish a highly sensitive SERS platform for intrinsic endotoxin detection, highly reproducible and practical substrates are essential. Our previous studies have demonstrated that silver nanorods (AgNRs) fabricated by oblique angle deposition can act as a highly sensitive and reproducible substrate with a SERS enhancement factor of ~109 and a batch-to-batch variation of <10% [15]. AgNR substrates have been applied in the detection of viruses, pathogenic bacteria such as E. coli O157:H7, Salmonella typhimirium, and Staphylococcus aureus, and toxins such as aflatoxins [16]. The utility of SERS from silver nanorods (AgNRs) for the rapid detection of bacterial pathogens via biomarkers has been demonstrated. We have reported that SERS can rapidly detect Pseudomonas aeruginosa pigment, pyocyanin, and pyoverdine in biological fluids with very high sensitivity and specificity when using a AgNR substrate [17].
Here, we report a proof-of-concept study in which SERS from AgNR is utilized to investigate the endotoxin structures of pathogenic bacteria. Highly purified and defined endotoxins from N. meningitidis and other pathogenic enteric bacteria are used to determine the unique SERS spectra. Utilizing principal component analysis (PCA), the unique SERS fingerprint spectra are able to accurately distinguish between meningococcal LPS structures and a collection of enteric LPS structures.

2. Materials and Methods

For endotoxin (LPS) sample preparation, the Neisseria meningitidis lipooligosaccharide (herein called LPS) and its truncated LPS structures (KDO2-lipid A and unglycosylated lipid A) were isolated from N. meningitidis serogroup B and its isogenic mutants as described previously [2]. Of note, the Neisseria meningitidis endotoxin structure contains one side saccharide chain, hence referred to as lipooligosaccharide (LOS), which was used to distinguish between other lipopolysaccharide (LPS) structures. Purified LPSs from the enteric bacteria E. coli, Vibrio cholerae, Salmonella typhimurium, and Salmonella minnesota were obtained from Sigma (St. Louis, MO, USA) and further purified and quantified based on the lipid A content as previously described [4]. Briefly, residual membrane phospholipids were removed by the repeated extraction of the dried LPS samples with ethanol and water in a ratio of 9:1. The expected fatty acyl components of 3-OHC12:0, 3-OHC14:0, and C12:0 and the absence of membrane phospholipids were assessed by mass spectroscopy (GC-MS) (Dr. Russell Carlson, Complex Carbohydrate Research Center, University of Georgia, Athens, GA). LPS stock solutions were prepared in pyrogen-free water at a 10 nmole/mL concentration with extensive vortexing and sonication prior to each dilution as described previously [4]. Highly purified LPSs from Rhizobium etli strain CE3 and Rhizobium niger strain NGR (obtained as kind gifts from Dr. Russell Carlson, Complex Carbohydrate Research Center, University of Georgia, Athens, GA) were used at 10 nmole/mL concentrations. Lipid A is the major component of endotoxin structure responsible for biological activity. As such, all endotoxin structures used in this study were quantified based on their lipid A fatty acyl chain content rather than the total weight of molecule with and without saccharides chains, and stocks are made at 10 nmole/mL as described above [4].
Regarding silver nanorod (AgNRs) substrate fabrication, the AgNRs substrates used in this study were fabricated by an oblique angle deposition (OAD) technique that has been described previously [15,16,18]. Briefly, microscopic glass slides (BD, Portsmouth, NH) were cleaned with a piranha solution (80% sulfuric acid, 20% hydrogen peroxide, v/v) and rinsed with deionized (DI) water before being air-dried and loaded into a custom-made electron beam evaporation system. The glass slides were deposited with a 20-nm titanium layer and then a 200-nm silver film layer through evaporation at rates of ~0.2 nm/s and 0.3 nm/s, respectively. The slides were monitored in situ by a quartz crystal microbalance (QCM). To fabricate the AgNRs, the substrates were tilted to 86° with respect to the incident vapor, and silver was then deposited rate of ~0.3 nm/s until a thickness of 2000 nm was obtained. The morphology of the AgNR substrate has been reported previously [19,20,21]. According to a previous study, the AgNR substrate has a broad and strong absorption when the wavelength of light is >500 nm [19,20,21]. The uniformity and reproducibility of the AgNR substrate for SERS measurements have been reported to be smaller than 10% for the spot-to-spot variation and less than 15% for batch-to-batch variation [19].
Regarding SERS measurement and data analysis, 2 µL of the testing sample was dispensed directly on the AgNR substrate and vacuum-dried in the custom-made vacuum chamber to shorten the sample preparation time. The dried samples on the substrates were then measured by an Enwave ProRaman-L-785A2 Raman analyzer (Enwave Optronics, Irvine, CA, USA) with a 785 nm near-IR diode laser as the excitation source. SERS spectra were collected in a wavenumber range from 400 cm−1 to 1800 cm−1 for 10 to 30 s with a laser power on the sample of 100 mW. Spectra data were acquired from nine randomly selected spots on the AgNR substrate and showed good reproducibility (Appendix C). The original SERS spectra contain a broad fluorescence background, and thus all spectra baselines were first corrected and the average spectra from the nine different measurements per sample were presented as the final spectra results.
Data analysis was performed using version 9.0 of the Origin software package (OriginLab Corporation, Northampton, MA, USA). PCA was conducted with MATLAB 2000b (The MathWorks, Inc., Natick, MA, USA) using the PLS toolbox (Eigenvector Research, Inc., Wenatchee, WA, USA). Savitzky–Golay derivation, normalization, and the mean-center process were used to treat the raw spectra data prior to PCA analysis.

3. Results and Discussion

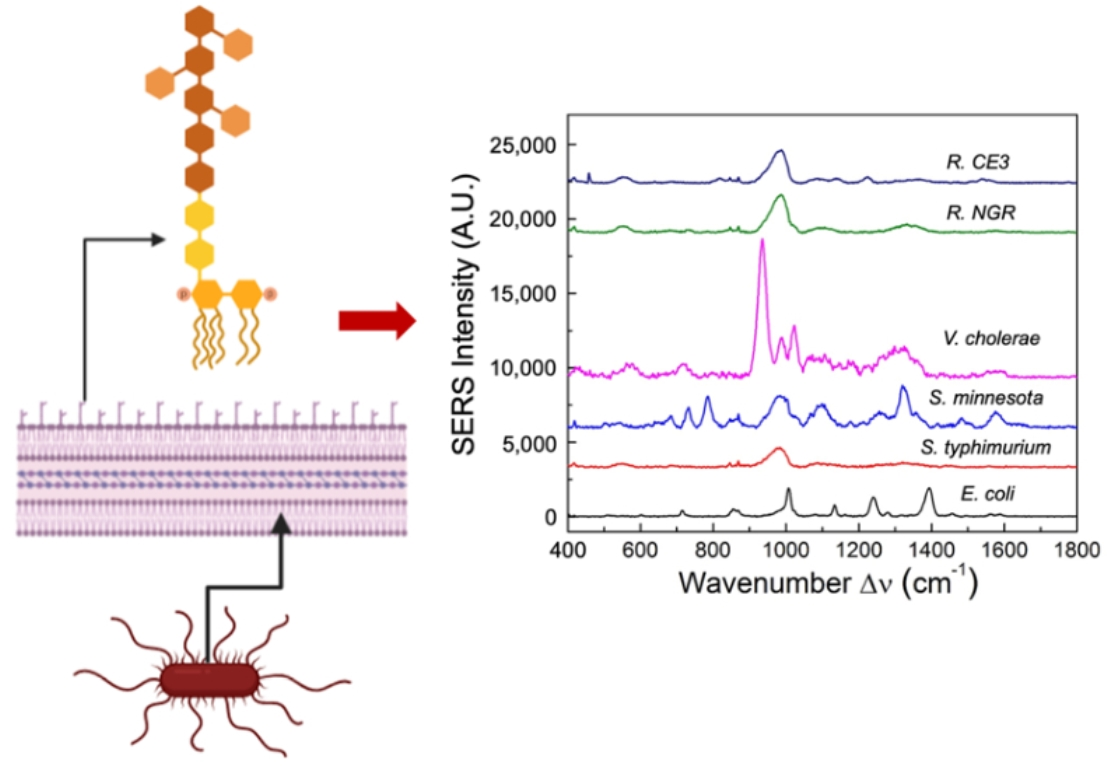
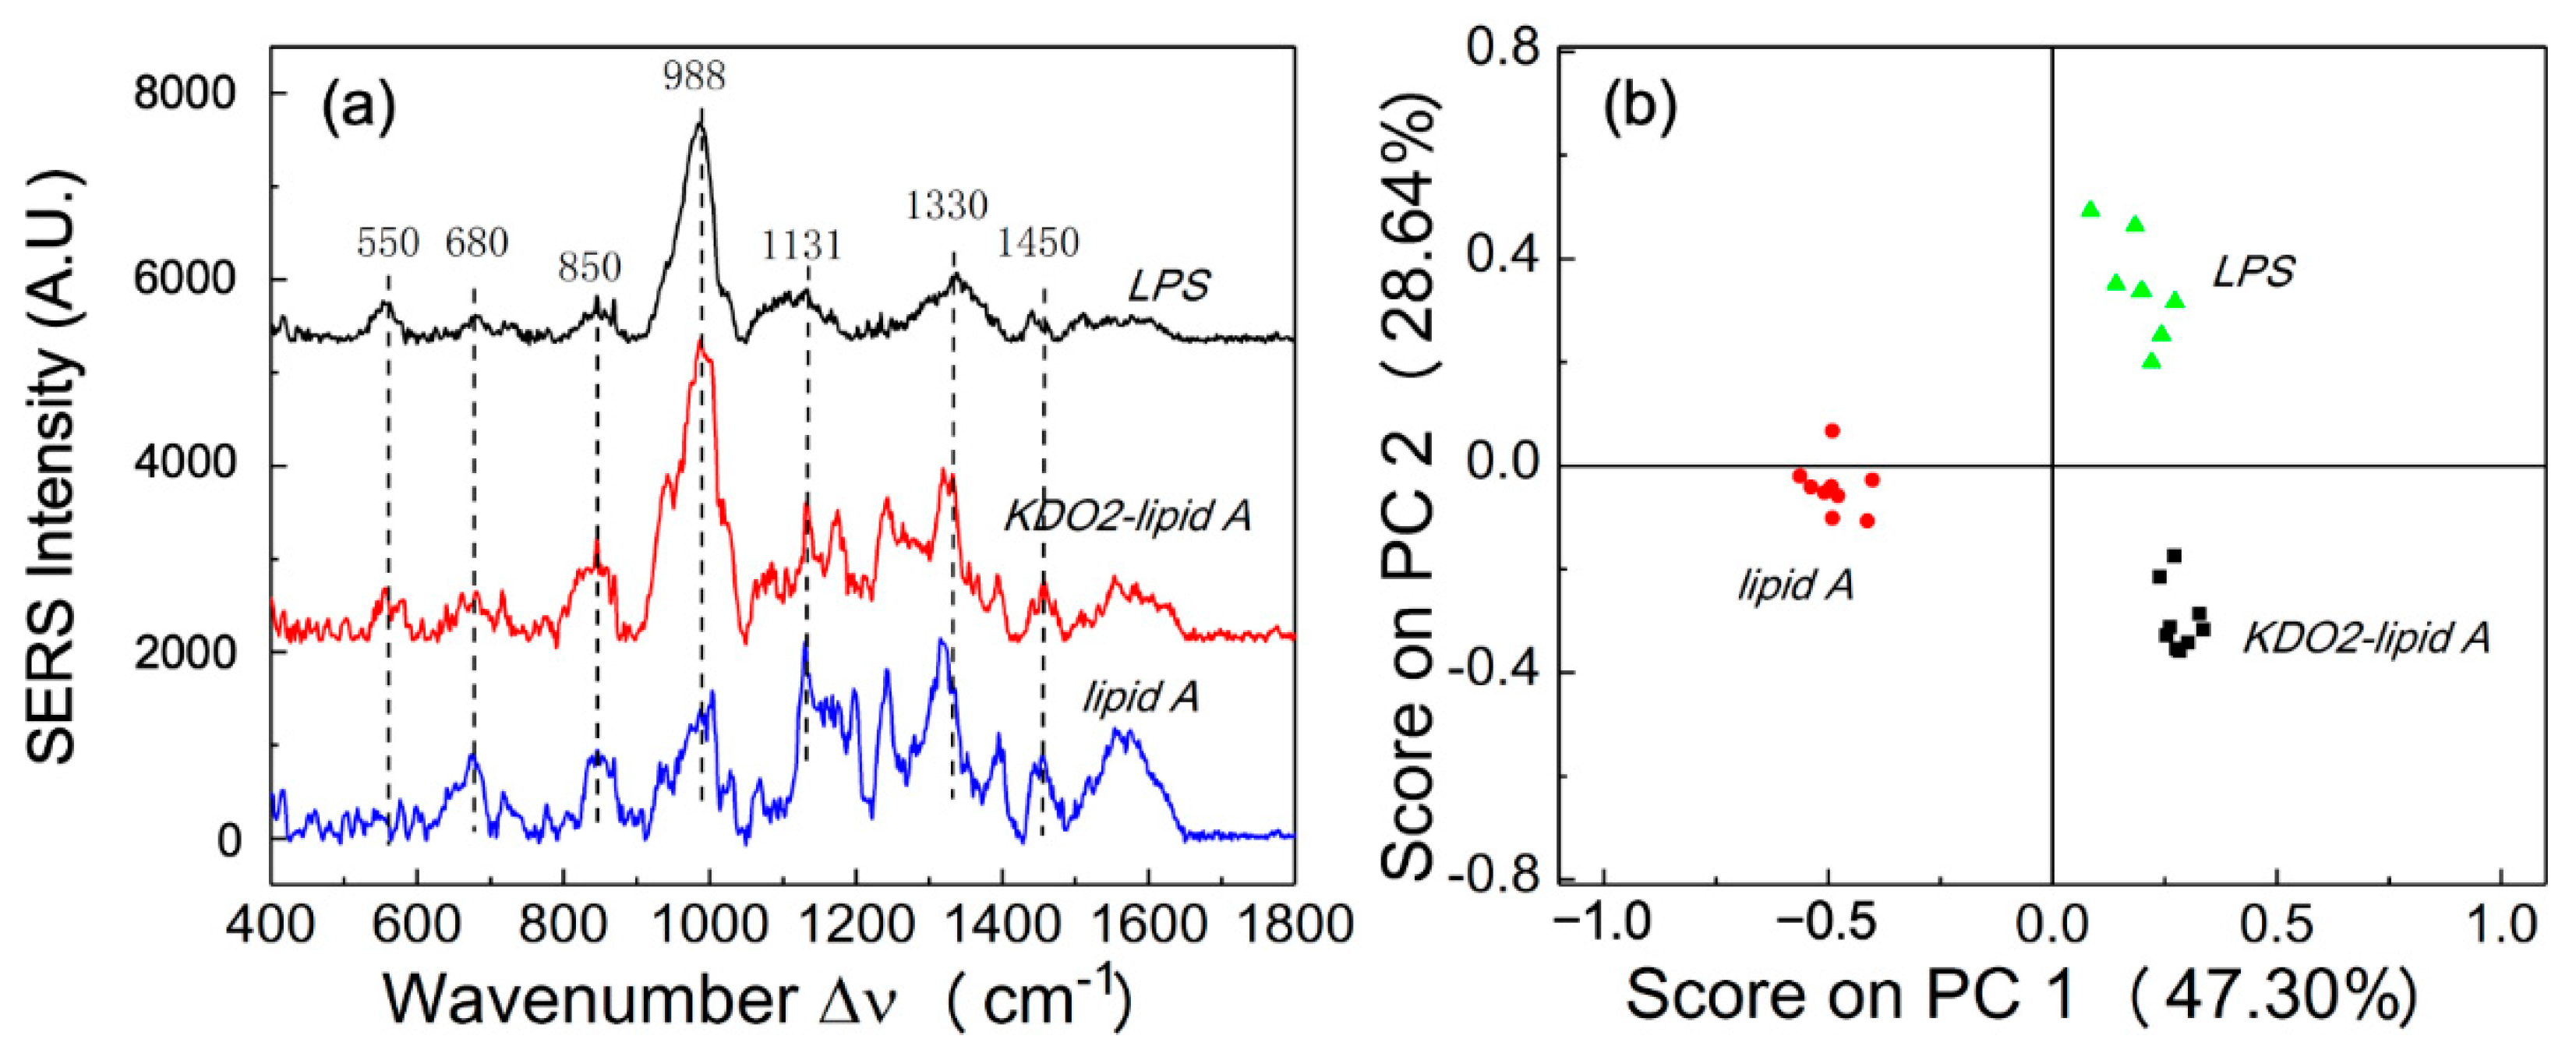
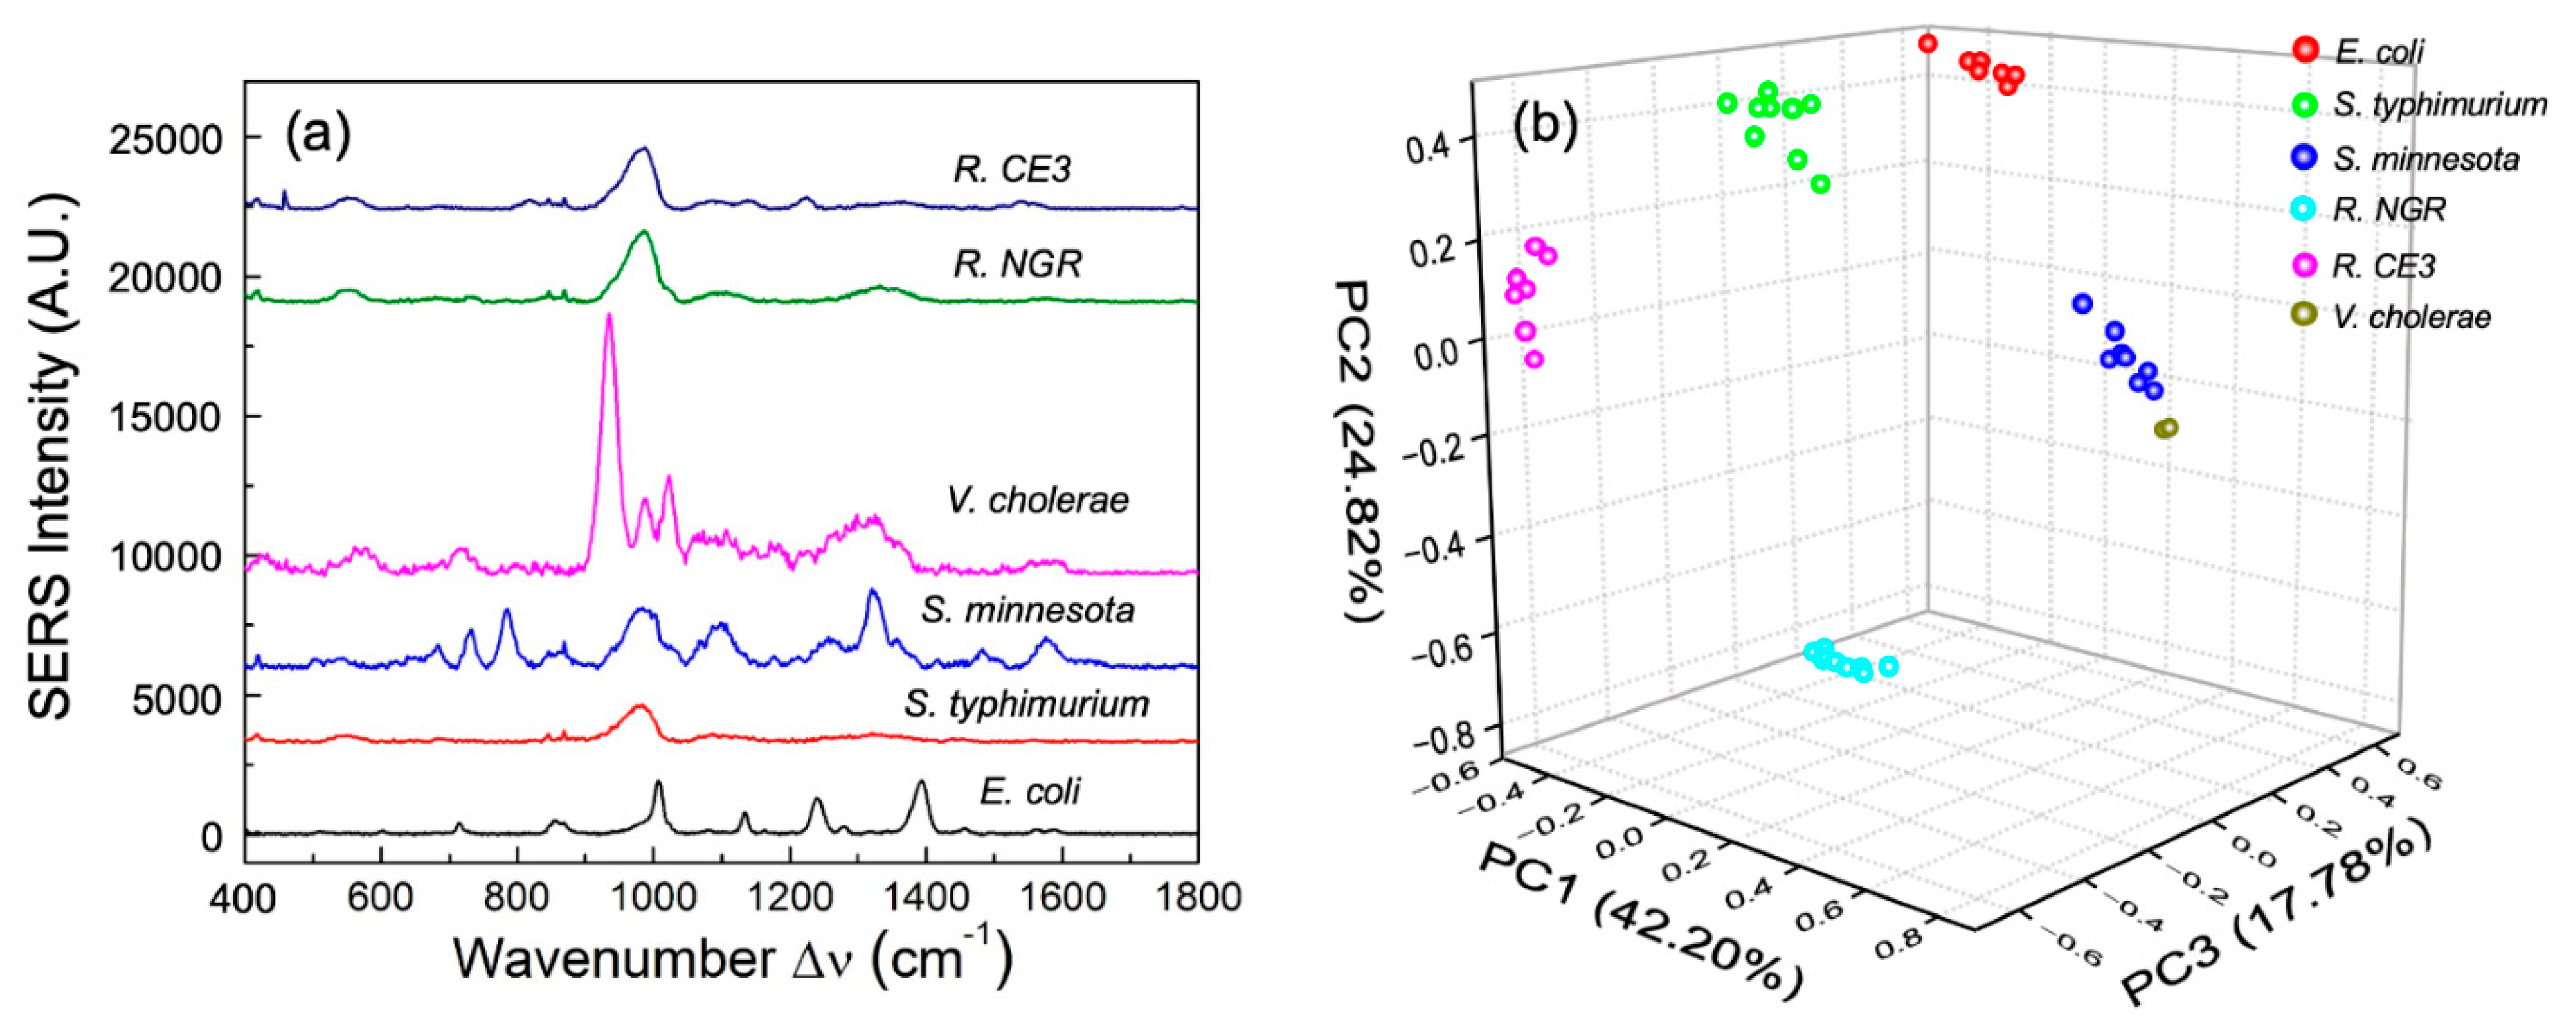
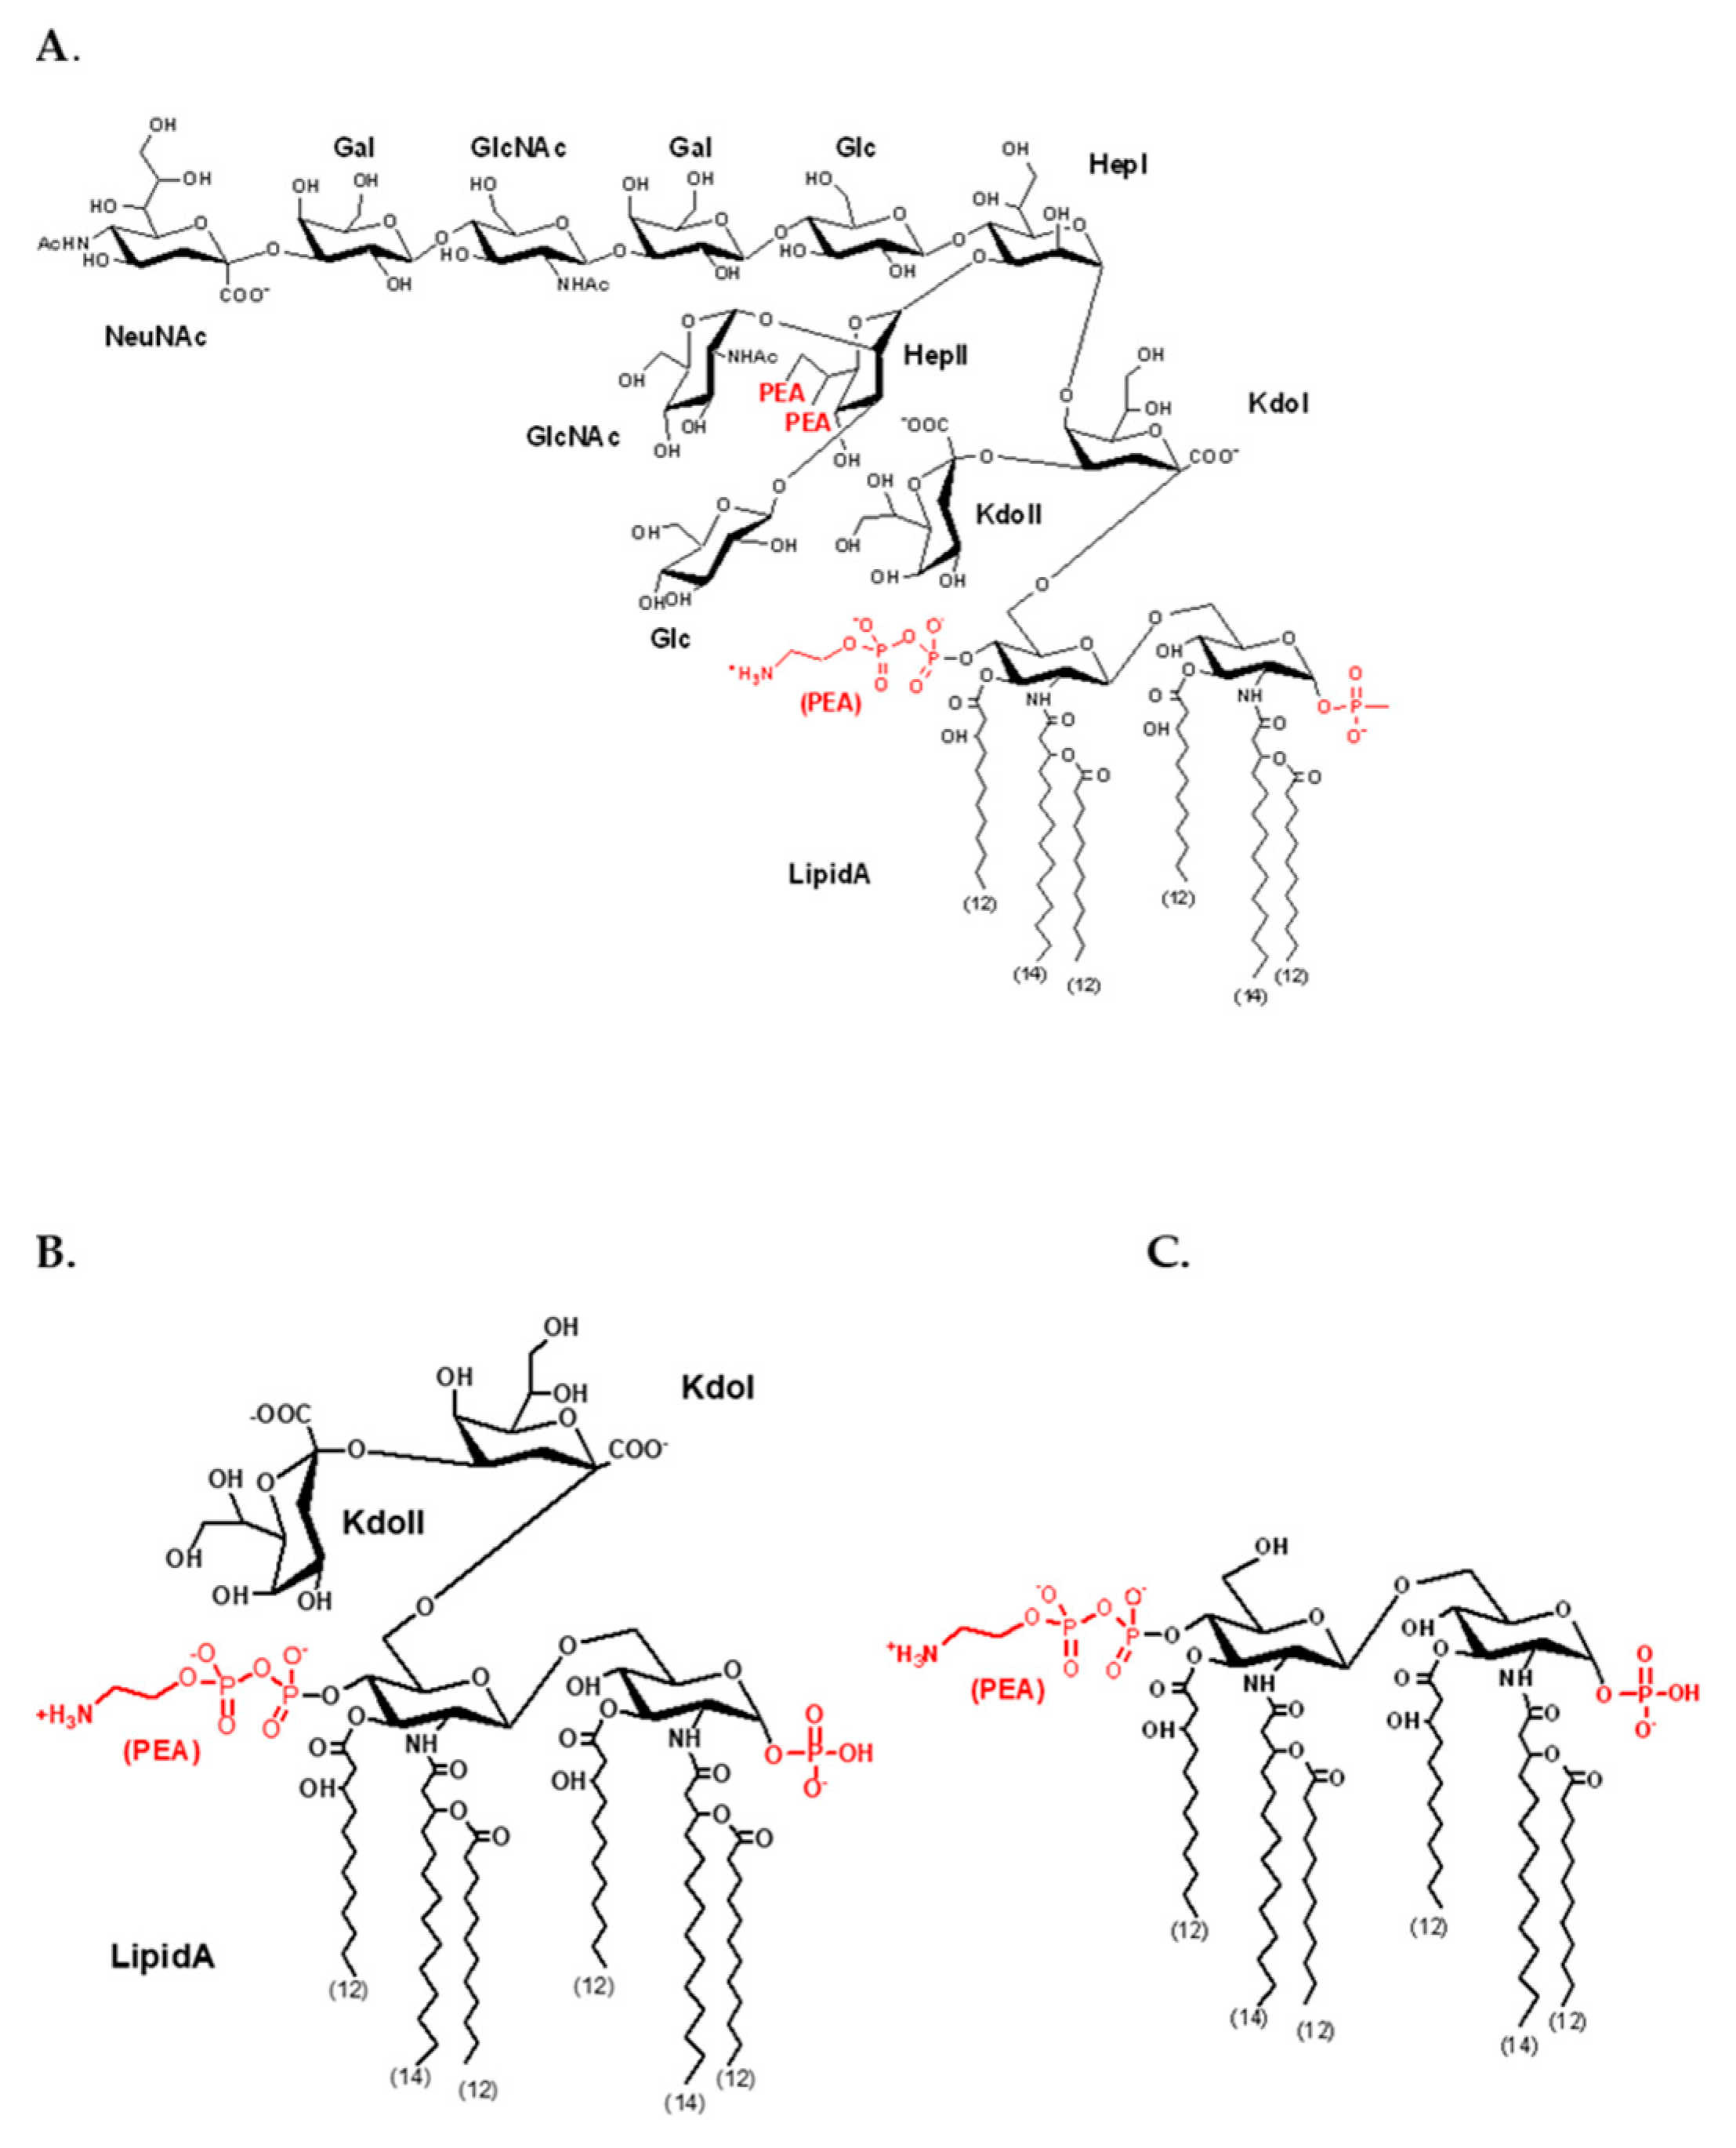
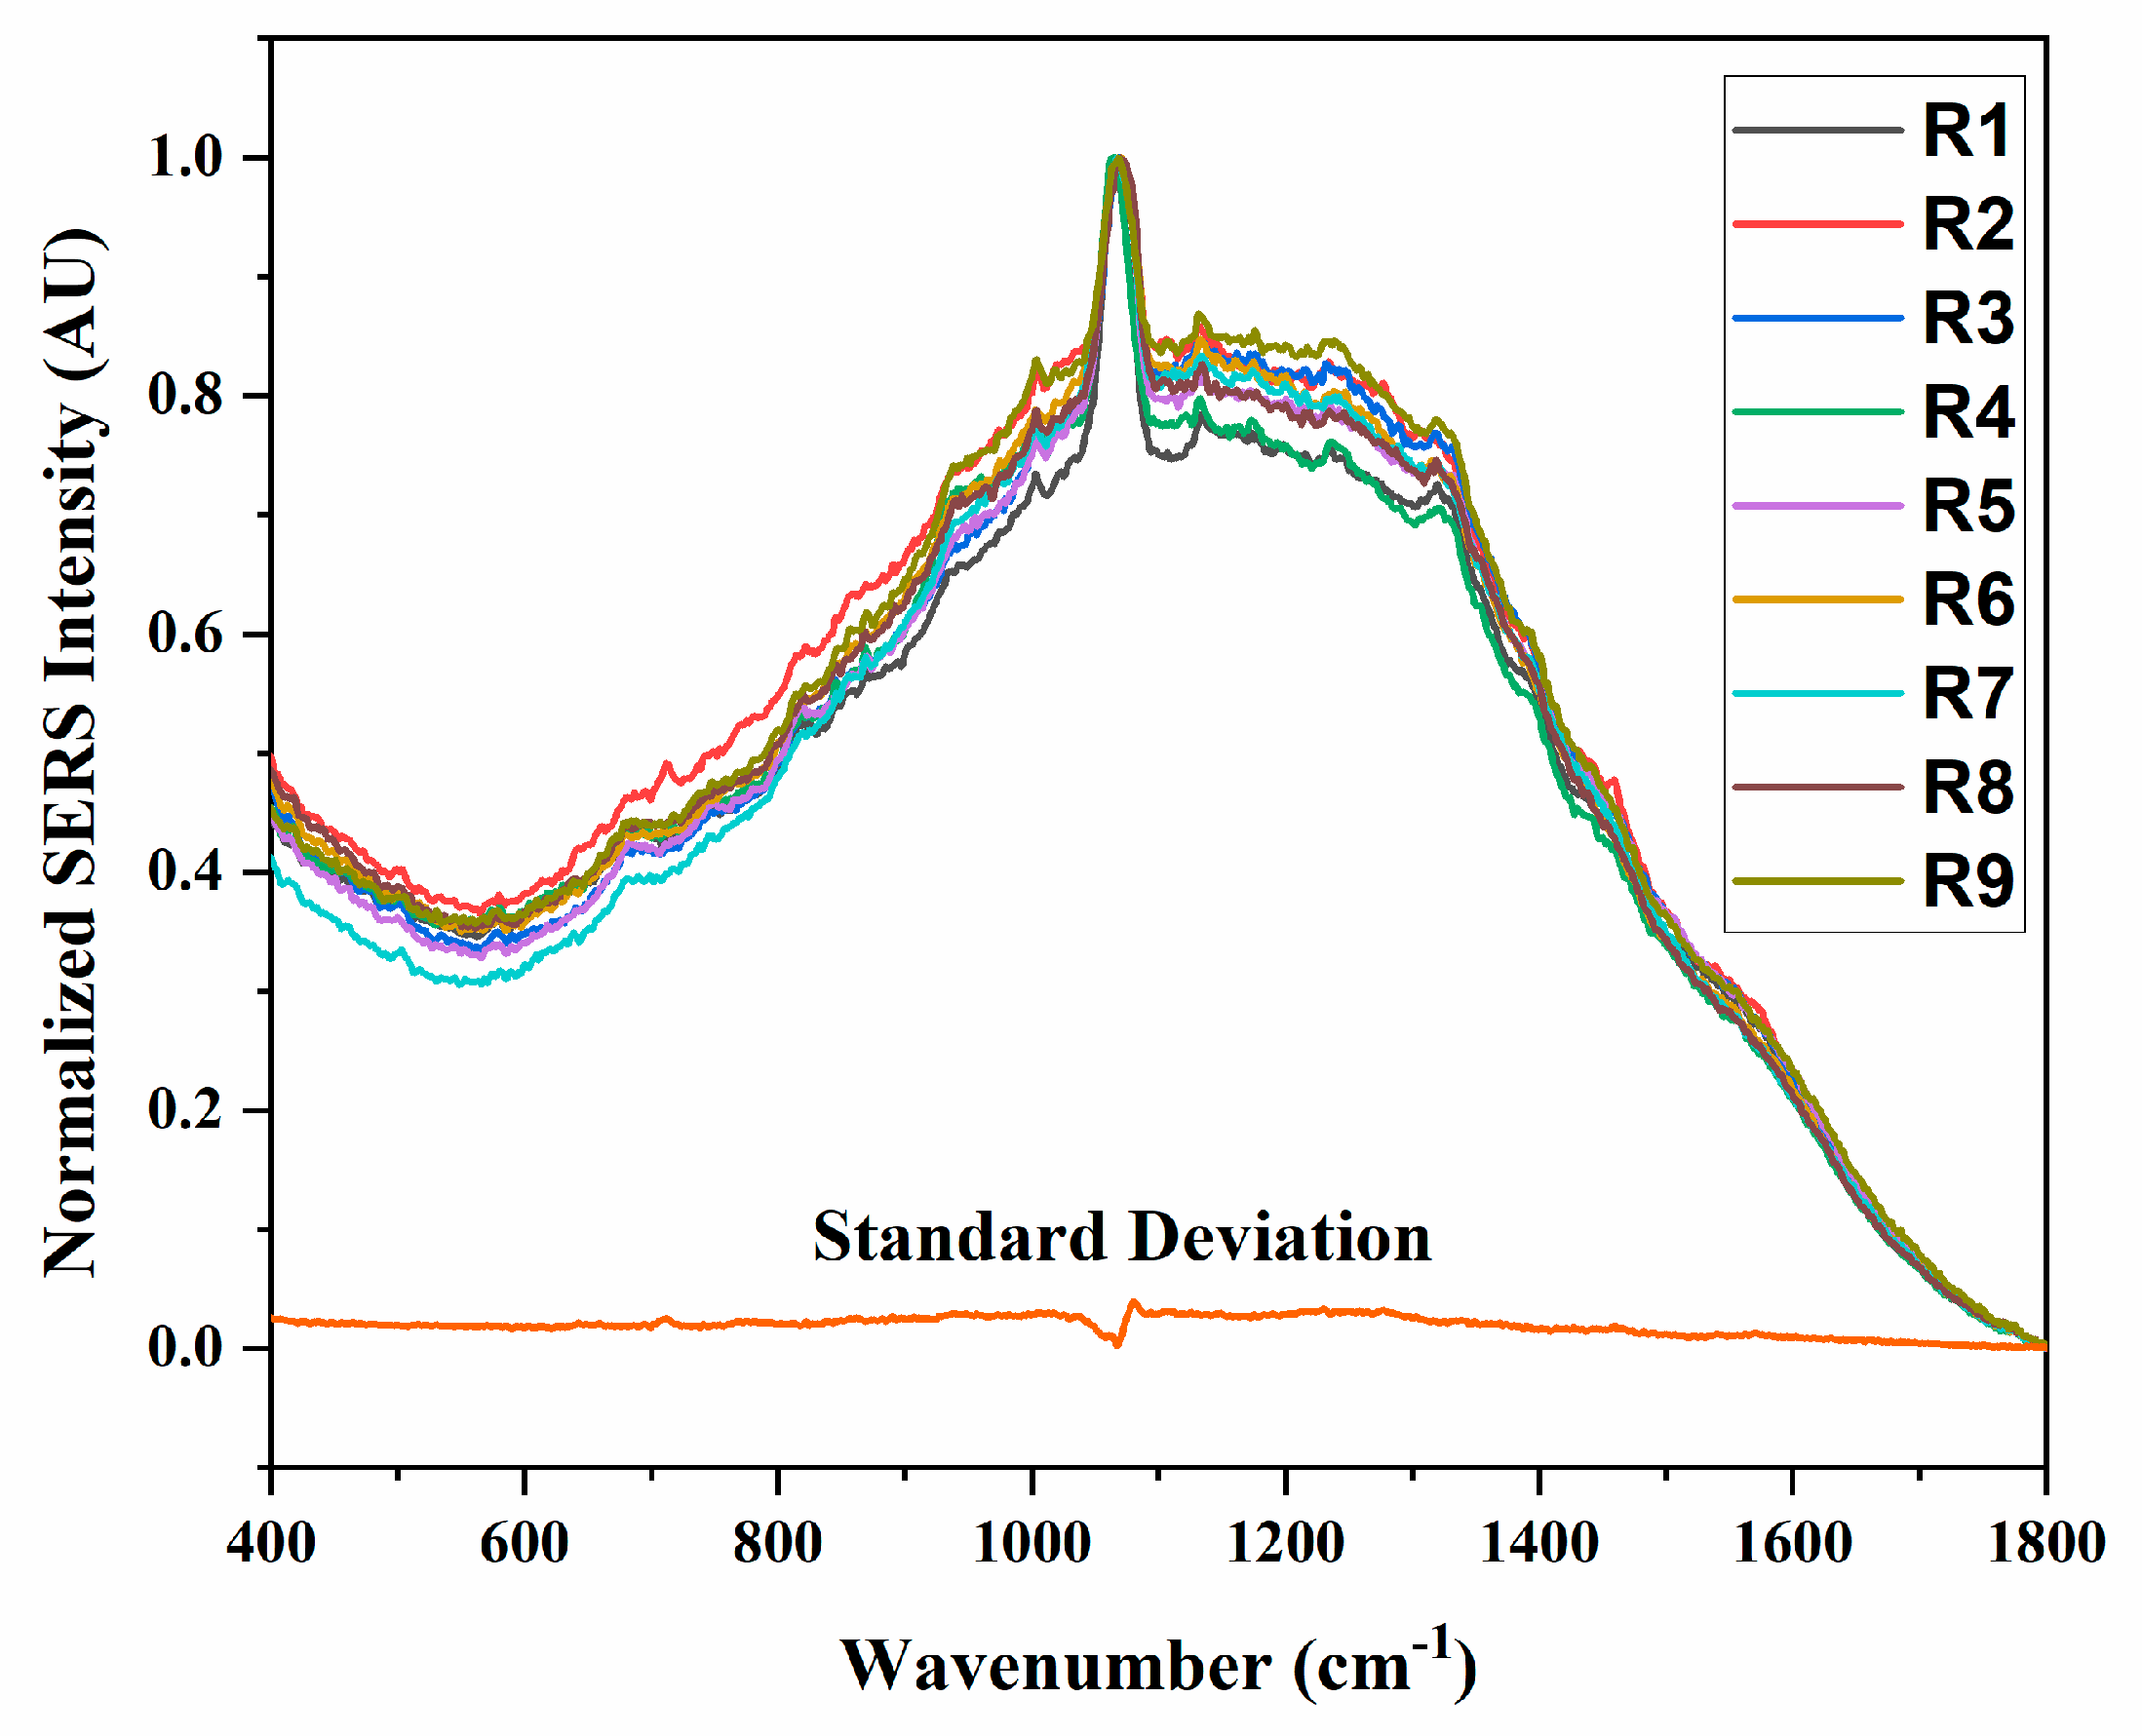
3.1. Meningococcal SERS Spectra

In order to understand the effect of a LPS contributing to its unique SERS spectra, a Neisseria meningitidis LPS (wild type, denoted as LPS), Neisseria meningitidis truncated LPS (KDO2-lipid A), and Neisseria meningitidis unglycosylated lipid A (lipid A) at concentration of 10 nmole/mL were used to obtain SERS spectra. As shown in Figure 1a, the SERS spectrum of a LPS shows significant Raman shift peaks at Δν = 989 cm−1 and Δν = 1330 cm−1, whereas the SERS spectra of KDO2-lipid A has the same significant peaks as those observed from wild-type LPS spectra. Lipid A, the fatty acyl chain linked to the disaccharide backbone of LPS, is primarily responsible for the endotoxic activity in the human host, rather than the sugar chains in LPS [2]. When comparing the SERS signals from naked lipid A structure to those of the LPS with saccharide chains attached, the resulting SERS spectra suggest that the lipid A portion of the LPS could contribute significantly to its unique SERS signal. The SERS spectrum of KDO2-lipid A shows a relatively strong peak at Δν = 989 cm−1 and a weak peak at Δν = 1330 cm−1 as compared to those for lipid A, which indicates that the characteristic peak at Δν = 989 cm−1, which may come from carbohydrates [22]. The peak at Δν = 1330 cm−1 is typically assigned to δ(CH) in phospholipids, which is often used in the in vivo study of biological tissues [23]. The SERS spectra of lipid A have a relatively lower peak at Δν = 989 cm−1 and a much higher peak intensity at Δν = 1330 cm−1, which further suggests that the peak at Δν = 989 cm−1 is corresponding to the carbohydrates since KDO molecule is a sugar, and the signal from phospholipids is dominant in SERS spectra (Figure 1a). Similarly, the peak at Δν = 1131 cm−1, which was assigned to the mode of fatty acid, which also dominates the SERS spectra of lipid A [22,24]. Detailed SERS peak assignments are listed in Table 1.
The data suggest that the SERS spectra from different meningococcal LPS structures can be distinguished based on their detailed compositions. To better analyze the data, we have also performed the PCA analysis as shown in Figure 1b. The spectra of Neisseria meningitidis LPS, KDO2-lipid A, and naked lipid A are well separated based on the score plots of PC1 (47.30%) and PC2 (28.64%). This study demonstrates the detection of highly purified meningococcal endotoxin structures and the differentiation of their SERS spectra in relation to the biological activity in a human host [2,4]. As previously reported, full-length LPSs and KDO2-lipid A show potent immune stimulatory activity in human macrophages, whereas naked lipid A is a very weak endotoxin [2]. The biological activities of endotoxin structures are correlated with fulminant sepsis and disease outcomes [25,26]. Therefore, SERS can be used for the rapid detection and differentiation of a meningococcal endotoxin, which may serve as an indicator of Neisseria meningitidis infection.
Table 1. SERS peak assignment for Neisseria meningitidis LPS structures.
Observed SERS Shift Δν (cm−1)Vibrational Mode Assignment [22,27,28]
550β(CH2) in ring
680δ(C-O-C); fatty acid;
850ν(C-O-C); saccharides (1,4 glycosidic link)
988β(CH); carbohydrates
1131ν(C-C); fatty acid
1330δ(CH); phospholipid
1450α(CH3/CH2), β(CH3/CH2)
β, bending; ν, stretching; δ, deformation.

3.2. Enteric LPS SERS Spectra

The SERS spectra of enteric LPSs at equal molar concentrations of 10 nmole/mL from E. coli, S. typhimurium, S. minnesota, V. cholerae, R. NGR, and R. CE3 are shown in Figure 2a. The spectra of S. typhimurium and S. minnesota, which are from the same species (Salmonella), show similar peaks at Δν = 543 and 981 cm−1, which can be signed to the saccharide and lipid [22,24,27,29]. Similarly, the SERS spectra of R. CE3 and R. NGR also show the same peaks at Δν = 552, 981, and 1330 cm−1 (Figure 2a), which represents cholesterol and lipids [22,24,27,28,29,30]. The spectra of E. coli and V. cholerae are entirely different from the spectra of the Salmonella LPS and Rhizobium LPS, which indicates that unique the SERS spectra of LPS structures could be used to differentiate bacteria species (Figure 2a). Detailed SERS peak assignment for enteric and Rhizobium LPS are shown in Table 2. Note that most of the spectral peaks of these LPSs are from lipids and carbohydrates, which are the major components of LPS. The 3D-score plot of PC 1 (42.20%), PC 2 (24.82%), and PC 3 (17.76%) for the enteric and Rhizobium LPS based on the SERS spectra are shown in Figure 2b. All the spectra from the same LPS are grouped together well and are evidently separated from one another. Different bacteria express unique LPS structures that do not change when expressed in viable cells or shed from the membrane. Therefore, unique LPS SERS can be used to distinguish various bacteria strains.
The SERS spectral peak locations are usually referred to as fingerprint spectra. Different molecules have different fingerprint spectra, which can be used to differentiate between different molecular structures [16]. It is known that LPSs from different bacteria have different molecular structures and bonds [4]. Therefore, our data analysis focused on the peak location difference rather than intensity or peak shape. Since all spectra were normalized, the peak intensities were less important when comparing various LPS structures. In our study, the PCA method was employed to depict the differences between peak intensity, peak position, relative intensity and spectral shape (Figure 2B). Although minor structural differences between bacterial LPSs were found, their biological activities were different and correlated to their effect on human host response [4]. For example, Rhizobium species that contain extended length fatty acyl chains do not exert immune stimulatory activity on human macrophages, which is in contrast to other LPSs like E. coli, Salmonella and Vibrio with fatty acyl chain lengths of C12 and C14. Moreover, Salmonella and E. coli LPS structures vary in their biological activity and differential induction of human TLR4 signaling pathways, consequently modulating the outcome of host response [4]. Taken together, the data provide a proof-of-concept for the utility of SERS in rapid detection of endotoxin and in distinguishing endotoxin structures from bacterial pathogens.

4. Conclusions

In this work, we have shown that the LPS, KDO2-lipid A, and lipid A of Neisseria meningitidis endotoxin structures, as well as the enteric LPSs from E. coli, S. typhimurium, S. minnesota, V. cholerae, R. CE3, and R. NGR, exhibit distinguishable fingerprint SERS spectra that can be separated well using a conventional PCA method. The difference in SERS spectra originates from the carbohydrates and phospholipids of different LPS structures. All the SERS measurements were carried at a low concentration (10 nmole/mL) in accordance with the relevant pathophysiological concentration in clinical infection, which means that the SERS technique has a great potential to detect and differentiate physiologically relevant enteric LPSs from biological fluids. In addition, the spectral differences of the different LPSs demonstrate that LPSs can be used as biomarkers for detecting bacteria, especially in terms of SERS-based detection, which could potentially lead to new ways to sense bacteria.

Author Contributions

Conceptualization, Y.Z. and S.M.Z.; methodology, X.W., Y.Z., S.M.Z.; validation, X.W., Y.Z., S.M.Z.; formal analysis, X.W., Y.Z., S.M.Z.; investigation, X.W., Y.Z., S.M.Z.; data curation, X.W., Y.Z., S.M.Z.; writing—original draft preparation, X.W., S.M.Z.; writing—review and editing, X.W., Y.Z., S.M.Z.; supervision, Y.Z., S.M.Z.; project administration, Y.Z., S.M.Z.; funding acquisition, Y.Z., S.M.Z., Y.Z., S.M.Z. conceived the study; Y.Z., S.M.Z. designed the experiments, X.W. performed the experiments; X.W., Y.Z., S.M.Z. analyzed the data; X.W., Y.Z., S.M.Z. wrote the manuscript. All authors have read and agreed to the published version of the manuscript.

Funding

This research was funded in part by National Institute of Health grant R21-AI096364 and National Science Foundation under contract number grant CBET-1064228. This study was made possible in part by NPRP grant NPRP12S-0224-190144 from the Qatar National Research Fund (a member of the Qatar Foundation). The findings achieved herein are solely the responsibility of the authors. https://www.qnrf.org/en-us (accessed on 4 June 2021). https://grants.nih.gov/grants (accessed on 4 June 2021).

Institutional Review Board Statement

Not applicable.

Informed Consent Statement

Not applicable.

Data Availability Statement

Available upon request.

Acknowledgments

The authors also thank Funing Chen’s technical help in generating some SERS spectra measurements.

Conflicts of Interest

The authors declare no conflict of interest.

Appendix A

Figure A1. Schematic representation of meningococcal LPS structures. (A) N. meningitidis strain NMB wild-type LPS structure; (B) minimally glycosylated meningococcal KDO2-lipid A structure; (C) unglycosylated meningococcal lipid A structure.
Biosensors 11 00234 g0a1

Appendix B

Figure A2. Schematic representation of different enteric lipid A structures. (A): E. coli; (B): Salmonella; (C): Vibrio cholerae; (D): Rhizobium.
Biosensors 11 00234 g0a2

Appendix C

Figure A3. Reproducibility of LPS spectra on AgNR. Nine spectra (R1 to R9) are shown for the same LPS as measured at different locations on the AgNR substrate.
Biosensors 11 00234 g0a3

References

  1. Park, B.S.; Song, D.H.; Kim, H.M.; Choi, B.-S.; Lee, H.; Lee, J.-O. The structural basis of lipopolysaccharide recognition by the TLR4-MD-2 complex. Nature 2009, 458, 1191–1195. [Google Scholar] [CrossRef]
  2. Zughaier, S.M.; Tzeng, Y.-L.; Zimmer, S.M.; Datta, A.; Carlson, R.W.; Stephens, D.S. Neisseria meningitidis lipooligosaccharide structure-dependent activation of the macrophage CD14/Toll-like receptor 4 pathway. Infect. Immun. 2004, 72, 371–380. [Google Scholar] [CrossRef] [PubMed] [Green Version]
  3. Brandtzaeg, P.; Ovstebo, R.; Kierulf, P. Bacteremia and compartmentalization of LPS in meningococcal disease. Prog. Clin. Biol. Res. 1995, 392, 219–233. [Google Scholar] [PubMed]
  4. Zughaier, S.M.; Zimmer, S.M.; Datta, A.; Carlson, R.W.; Stephens, D.S. Differential induction of the toll-like receptor 4-MyD88-dependent and -independent signaling pathways by endotoxins. Infect. Immun. 2005, 73, 2940–2950. [Google Scholar] [CrossRef] [PubMed] [Green Version]
  5. Forsberg, L.S.; Carlson, R.W. The structures of the lipopolysaccharides from Rhizobium etli strains CE358 and CE359. The complete structure of the core region of R. etli lipopolysaccharides. J. Biol. Chem. 1998, 273, 2747–2757. [Google Scholar] [CrossRef] [Green Version]
  6. Iwanaga, S. Biochemical principle of Limulus test for detecting bacterial endotoxins. Proc. Jpn. Acad. Ser. B Phys. Biol. Sci. 2007, 83, 110–119. [Google Scholar] [CrossRef] [Green Version]
  7. Larrouy-Maumus, G.; Clements, A.; Filloux, A.; McCarthy, R.; Mostowy, S. Direct detection of lipid A on intact Gram-negative bacteria by MALDI-TOF mass spectrometry. J. Microbiol. Methods 2016, 120, 68–71. [Google Scholar] [CrossRef] [PubMed] [Green Version]
  8. Wu, Y.; Deng, P.; Tian, Y.; Feng, J.; Xiao, J.; Li, J.; Liu, J.; Li, G.; He, Q. Simultaneous and sensitive determination of ascorbic acid, dopamine and uric acid via an electrochemical sensor based on PVP-graphene composite. J. Nanobiotechnol. 2020, 18, 112. [Google Scholar] [CrossRef]
  9. Kim, S.-E.; Su, W.; Cho, M.; Lee, Y.; Choe, W.-S. Harnessing aptamers for electrochemical detection of endotoxin. Anal. Biochem. 2012, 424, 12–20. [Google Scholar] [CrossRef]
  10. Seth, R.; Ribeiro, M.; Romaschin, A.; Scott, J.A.; Manno, M.; Scott, J.A.; Liss, G.M.; Tarlo, S.M. Occupational endotoxin exposure and a novel luminol-enhanced chemiluminescence assay of nasal lavage neutrophil activation. J. Allergy Clin. Immunol. 2011, 127, 272–275. [Google Scholar] [CrossRef]
  11. Kneipp, J.; Kneipp, H.; Kneipp, K. SERS—A single-molecule and nanoscale tool for bioanalytics. Chem. Soc. Rev. 2008, 37, 1052–1060. [Google Scholar] [CrossRef]
  12. Choi, H.-K.; Lee, K.S.; Shin, H.-H.; Koo, J.-J.; Yeon, G.J.; Kim, Z.H. Single-Molecule Surface-Enhanced Raman Scattering as a Probe of Single-Molecule Surface Reactions: Promises and Current Challenges. Acc. Chem. Res. 2019, 52, 3008–3017. [Google Scholar] [CrossRef]
  13. Fang, W.; Jia, S.; Chao, J.; Wang, L.; Duan, X.; Liu, H.; Li, Q.; Zuo, X.; Wang, L.; Wang, L.; et al. Quantizing single-molecule surface-enhanced Raman scattering with DNA origami metamolecules. Sci. Adv. 2019, 5, eaau4506. [Google Scholar] [CrossRef] [Green Version]
  14. Xiang, S.; Ge, C.; Li, S.; Chen, L.; Wang, L.; Xu, Y. In Situ Detection of Endotoxin in Bacteriostatic Process by SERS Chip Integrated Array Microchambers within Bioscaffold Nanostructures and SERS Tags. ACS Appl. Mater. Interfaces 2020, 12, 28985–28992. [Google Scholar] [CrossRef]
  15. Driskell, J.D.; Shanmukh, S.; Liu, Y.; Chaney, S.; Hennigan, S.; Jones, L.; Krause, D.; Tripp, R.A.; Zhao, Y.-P.; Dluhy, R.A. Novel Nanoarray SERS Substrates Used for High Sensitivity Virus Biosensing and Classification. Nanosci. Nanotechnol. Chem. Biol. Def. 2009, 1016, 99–114. [Google Scholar]
  16. Wu, X.; Chen, J.; Park, B.; Huang, Y.W.; Zhao, Y. The Use of Silver Nanorod Array-Based Surface-Enhanced Raman Scattering Sensor for Food Safety Applications, in Advances in Applied Nanotechnology for Agriculture, in Advances in Applied Nanotechnology for Agriculture. Am. Chem. Soc. 2013, 1143, 85–108. [Google Scholar]
  17. Wu, X.; Chen, J.; Li, X.; Zhao, Y.; Zughaier, S.M. Culture-free diagnostics of Pseudomonas aeruginosa infection by silver nanorod array based SERS from clinical sputum samples. Nanomedicine 2014, 10, 1863–1870. [Google Scholar] [CrossRef] [Green Version]
  18. Liu, Y.J.; Chu, H.Y.; Zhao, Y.P. Silver Nanorod Array Substrates Fabricated by Oblique Angle Deposition: Morphological, Optical, and SERS Characterizations. J. Phys. Chem. C 2010, 114, 8176–8183. [Google Scholar] [CrossRef]
  19. Driskell, J.D.; Shanmukh, S.; Liu, Y.; Chaney, S.B.; Tang, X.J.; Zhao, Y.P.; Dluhy, A.R. The Use of Aligned Silver Nanorod Arrays Prepared by Oblique Angle Deposition as Surface Enhanced Raman Scattering Substrates. J. Phys. Chem. C 2008, 112, 895–901. [Google Scholar] [CrossRef]
  20. Zhao, Y.P.; Chaney, S.B.; Zhang, Z.Y. Absorbance spectra of aligned Ag nanorod arrays prepared by oblique angle deposition. J. Appl. Phys. 2006, 100, 063527. [Google Scholar] [CrossRef]
  21. Abell, J.; Driskell, J.; Dluhy, R.; Tripp, R.; Zhao, Y.-P. Fabrication and characterization of a multiwell array SERS chip with biological applications. Biosens. Bioelectron. 2009, 24, 3663–3670. [Google Scholar] [CrossRef] [PubMed]
  22. Czamara, K.; Majzner, K.; Pacia, M.Z.; Kochan, K.; Kaczor, A.; Baranska, M. Raman spectroscopy of lipids: A review. J. Raman Spectrosc. 2015, 46, 4–20. [Google Scholar] [CrossRef]
  23. Utzinger, U.; Heintzelman, D.L.; Mahadevan-Jansen, A.; Malpica, A.; Follen, M.; Richards-Kortum, R. Near-infrared Raman spectroscopy for in vivo detection of cervical precancers. Appl. Spectrosc. 2001, 55, 955–959. [Google Scholar] [CrossRef]
  24. Krafft, C.; Neudert, L.; Simat, T.; Salzer, R. Near infrared Raman spectra of human brain lipids. Spectrochim. Acta Part A Mol. Biomol. Spectrosc. 2005, 61, 1529–1535. [Google Scholar] [CrossRef] [PubMed]
  25. Brandtzaeg, P.; Bryn, K.; Kierulf, P.; Ovstebø, R.; Namork, E.; Aase, B.; Jantzen, E. Meningococcal endotoxin in lethal septic shock plasma studied by gas chromatography, mass-spectrometry, ultracentrifugation, and electron microscopy. J. Clin. Investig. 1992, 89, 816–823. [Google Scholar] [CrossRef] [PubMed] [Green Version]
  26. Zughaier, S.M.; Lindner, B.; Howe, J.; Garidel, P.; Koch, M.H.; Brandenburg, K.; Stephens, D.S. Physicochemical characterization and biological activity of lipooligosaccharides and lipid A from Neisseria meningitidis. J. Endotoxin Res. 2007, 13, 343–357. [Google Scholar] [CrossRef]
  27. Wiercigroch, E.; Szafraniec, E.; Czamara, K.; Pacia, M.Z.; Majzner, K.; Kochan, K.; Kaczor, A.; Baranska, M.; Malek, K. Raman and infrared spectroscopy of carbohydrates: A review. Spectrochim. Acta Part A Mol. Biomol. Spectrosc. 2017, 185, 317–335. [Google Scholar] [CrossRef]
  28. Ruggiero, L.; Sodo, A.; Bruni, F.; Ricci, M.A. Hydration of monosaccharides studied by Raman scattering. J. Raman Spectrosc. 2018, 49, 1066–1075. [Google Scholar] [CrossRef]
  29. Notingher, I.; Green, C.; Dyer, C.; Perkins, E.; Hopkins, N.; Lindsay, C.; Hench, L.L. Discrimination between ricin and sulphur mustard toxicity in vitro using Raman spectroscopy. J. R. Soc. Interface 2004, 1, 79–90. [Google Scholar] [CrossRef] [Green Version]
  30. Malini, R.; Venkatakrishna, K.; Kurien, J.; Pai, K.M.; Rao, L.; Kartha, V.B.; Krishna, C.M. Discrimination of normal, inflammatory, premalignant, and malignant oral tissue: A Raman spectroscopy study. Biopolymers 2006, 81, 179–193. [Google Scholar] [CrossRef] [PubMed]
  31. Lu, X.; Al-Qadiri, H.M.; Lin, M.; Rasco, B.A. Application of Mid-infrared and Raman Spectroscopy to the Study of Bacteria. Food Bioprocess Technol. 2011, 4, 919–935. [Google Scholar] [CrossRef]
  32. Delgado-Coello, B.; Montalvan-Sorrosa, D.; Cruz-Rangel, A.; Sosa-Garrocho, M.; Hernández-Téllez, B.; Macías-Silva, M.; Castillo, R.; Mas-Oliva, J. Label-free surface-enhanced Raman spectroscopy of lipid-rafts from hepatocyte plasma membranes. J. Raman Spectrosc. 2017, 48, 659–667. [Google Scholar] [CrossRef]
Figure 1. Meningococcal LPS Raman SERS spectra. (a) SERS spectra of LPS, KDO2-lipid A, and lipid A obtained from Neisseria meningitidis endotoxin structures. (b) The PCA score plot of SERS spectra of LPS, KDO2-lipid A, and lipid A.
Biosensors 11 00234 g001
Figure 2. Different enteric LPS Raman SERS spectra. (a) SERS spectra of different enteric LPSs obtained from E. coli, S. typhimurium, S. minnesota, V. cholerae, R. CE3, and R. NGR. (b) PCA score plot of six enteric LPSs based on their SERS spectra.
Biosensors 11 00234 g002
Table 2. SERS peak assignment for enteric LPS structures.
Observed SERS Shift Δν (cm−1)Vibrational Mode Assignment [22,27,30,31,32]
543δ(C-O-C) in glycosidic ring
552β(CH2) in ring
715ν(C-N)
733β(C-O-C) in carbohydrates
787ν(C-O) in ring
855δ(C-O-C)
981β(CH) in lipid
1025ν(CO) in carbohydrates
1087ν(C-O) in lipid
1131ν(C-C) in fatty acid
1309τ(CH3/CH2) in lipid
1330δ(CH) in phospholipid
β, bending; δ, deformation; τ, twisting; ν, stretching.
Publisher’s Note: MDPI stays neutral with regard to jurisdictional claims in published maps and institutional affiliations.

