Article

Enabling Continuous Wearable Reflectance Pulse Oximetry at the Sternum

1
Wallace H. Coulter Department of Biomedical Engineering, Georgia Institute of Technology, Atlanta, GA 30332, USA
2
Bioengineering Graduate Program, Georgia Institute of Technology, Atlanta, GA 30332, USA
3
Department of Anesthesiology, Feinberg School of Medicine, Northwestern University, Chicago, IL 60611, USA
4
Department of Biomedical Engineering, McCormick School of Engineering, Northwestern University, Evanston, IL 60201, USA
5
School of Electrical and Computer Engineering, Georgia Institute of Technology, Atlanta, GA 30332, USA
*
Author to whom correspondence should be addressed.
Biosensors 2021, 11(12), 521; https://doi.org/10.3390/bios11120521
Submission received: 12 November 2021 / Revised: 12 December 2021 / Accepted: 13 December 2021 / Published: 17 December 2021

Abstract

:
In light of the recent Coronavirus disease (COVID-19) pandemic, peripheral oxygen saturation (SpO2) has shown to be amongst the vital signs most indicative of deterioration in persons with COVID-19. To allow for the continuous monitoring of SpO2, we attempted to demonstrate accurate SpO2 estimation using our custom chest-based wearable patch biosensor, capable of measuring electrocardiogram (ECG) and photoplethysmogram (PPG) signals with high fidelity. Through a breath-hold protocol, we collected physiological data with a wide dynamic range of SpO2 from 20 subjects. The ratio of ratios (R) used in pulse oximetry to estimate SpO2 was robustly extracted from the red and infrared PPG signals during the breath-hold segments using novel feature extraction and PPGgreen-based outlier rejection algorithms. Through subject independent training, we achieved a low root-mean-square error (RMSE) of 2.64 ± 1.14% and a Pearson correlation coefficient (PCC) of 0.89. With subject-specific calibration, we further reduced the RMSE to 2.27 ± 0.76% and increased the PCC to 0.91. In addition, we showed that calibration is more efficiently accomplished by standardizing and focusing on the duration of breath-hold rather than the resulting range in SpO2. The accurate SpO2 estimation provided by our custom biosensor and the algorithms provide research opportunities for a wide range of disease and wellness monitoring applications.

1. Introduction

Due to the novel Coronavirus disease (COVID-19) pandemic, there is a clear need to monitor respiratory functions in outpatient settings to help assess the progression of COVID-19 during the presymptomatic, symptomatic, and recovery stages. In a recent effort to record and model the trajectories of several vital signs in hospitalized COVID-19 patients, Pimentel et al. showed that peripheral oxygen saturation (SpO2) is amongst the most indicative of parameters of COVID-19 progression prior to primary outcomes, suggesting the importance to monitor SpO2 continuously [1]. Through remote SpO2 monitoring, accurate tracking of COVID-19 progression allows for the implementation of disease-management strategies for both timely interventions and the optimization of scarce medical resources [2].
Unfortunately, existing SpO2 measurement devices are inconvenient for monitoring in outpatient settings. Typically, SpO2 is measured through pulse oximeters placed at peripheral extremities such as the fingers; however, these devices obstruct normal activities of daily living (ADLs) due to restriction of finger usage. In addition, finger-clip based pulse oximeters are accordingly limited in practice to intermittent or single-point measurements. Recently, commercial wrist-worn devices such as Apple Watch, Fitbit Sense Advanced Smartwatch, and Garmin Vivosmart 4 have been developed that allow for more convenient monitoring and offer continuous SpO2 measurements. Unfortunately, SpO2 measured at the wrist is likely more susceptible to motion artifacts when compared to measurement sites closer to the center of mass of the body, such as the forehead and ear during walking, as shown by Longmore et al. [3]. In addition, peripheral sites such as the wrist respond to apnea events at a slower than central sites [4,5] due to the redistribution of blood flow, oxygen conservation [6], and their distal location to the heart.
Thus, central pulse oximeters offer a promising approach for ambulatory outpatient monitoring and in detecting acute hypoxemia events. Furthermore, chest-based pulse oximeters might be advantageous for their synergistic incorporation with other cardiac monitoring methods—such as electrocardiography and seismocardiography—for a more holistic understanding of cardiac functions [7,8,9,10]. Nevertheless, a few major challenges such limitations to the reflectance design, the presence of respiratory artifacts, and the malperfusion of the sternum pose difficulties to the adoption of chest-based approaches. Despite these challenges, prior evaluations have suggested that a chest-based approach might be feasible [3,11,12,13,14,15].
However, existing methods using chest-based devices are not rigorously validated, and thus more work is needed to advance chest-worn pulse oximetry. Specifically, validating chest-based pulse oximetry for continuous monitoring would require a sufficiently large and diverse subject population, a wide dynamic range of SpO2, a resultant root-mean-square error (RMSE) lower than 3.5% [16], and ideally a form factor that does not interfere with ADLs. Upon investigation, there are some clear gaps in the existing literature in these areas that should be addressed. For example, either insufficient sample size (N = 1) in [11] or narrow dynamic range for SpO2 (88–99%) in [12] limits the validity of the accuracy of their approaches. Meanwhile, Näslund et al. [15] showed a strong agreement between their estimated SpO2 and arterial oxygen saturation (SaO2); however, their device was unable to capture the pulsatile component of the PPG signals and therefore might be susceptible to motion artifacts and skin pigmentation [17] (p. 34). Kramer et al. [13] achieved accurate SpO2 estimations (RMSE of 2.9%, N = 13), but their work lacks the key details necessary for replicating their algorithm such as preprocessing and feature extraction. Finally, Vetter et al. [14] conducted a study following the International Organization for Standardization 9919 international standard, included a moderate number of subjects (N = 10) and a wide dynamic range of SpO2 (70–99%), and provided sufficient details of their approach. Nevertheless, the prototype appears to be cumbersome to use as it requires a chest-strap to affix the device for sufficient contact pressure. Additionally, due to the lack of leave-one-subject-out (LOSO) cross validation for training and testing the model, their method is susceptible to data leakage and therefore the high accuracy attained may not be generalizable. To the best of our knowledge, there exists no known accurate chest-based pulse oximetry approach that has been thoroughly validated within the literature. This work attempts to address these shortcomings and present a chest-based pulse oximeter that can estimate SpO2 in close agreement with a commercially available, validated finger pulse oximeter.
The aim of this paper is to demonstrate the feasibility of our small, standalone chest-based wearable patch biosensor. In this work, we collected data from 20 subjects who underwent a breath-hold perturbation to induce hypoxia and used PPG signals from a custom chest-based biosensor to estimate SpO2. To estimate SpO2 robustly, we present a novel algorithm to extract key PPG features to account for poor perfusion at the sternum [18] and involuntary respiratory artifacts [19]. In addition, we developed a PPGgreen-based outlier rejection algorithm for rejecting red and infrared (IR) PPG beats of lower quality. Finally, we demonstrate the optimal calibration scheme for practical usage of this chest-based pulse oximetry. These contributions pave the way for the continuous monitoring of SpO2. The complete study protocol and algorithmic advancements necessary to achieve accurate chest-based pulse oximetry are described in detail below.

2. Materials and Methods

2.1. Principle of PPG

The PPG signal used in this work represents the changes in the reflected light emitting diodes’ (LEDs) light intensity, as detected by the photodiodes (PDs). According to the Beer–Lambert law, the intensity of the reflectance PPG measured is related to the optical path length of light traveled from the LEDs to the PDs [17] (pp. 47–48). The changes of PPG intensity with respect to each component (arterial blood, venous blood, tissue, bone, etc.) have different pulsating dynamics [20]. By using appropriate filter banks, we can leverage the cardiac pulsation of the PPG to target its arterial, pulsatile, small-signal component. Specifically, the portion of the PPG signal that is representative of cardiac pulsation and the periodic changes in blood volume is termed the alternating current (AC) component, and the baseline wander of the PPG—which is slower than the cardiac frequency—is termed the direct current (DC) component [20]. The AC and DC components of the PPG in multiple wavelengths (i.e., red and IR PPG) can reveal the oxygenation saturation of the underlying arteries [17]. More details are provided in Section 2.4.

2.2. Breath-Hold Study Design

The breath-hold study was designed to induce hypoxemia and sufficient changes in SpO2. This study was conducted under a protocol approved by the Georgia Institute of Technology Institutional Review Board (H21100). A total of 22 (16 males, 6 females) young volunteers were recruited for the breath-hold study and written informed consent was obtained. The number of subjects recruited exceeds that of similar studies [14,21,22]. In this dataset, two subjects were excluded for analysis. The data of one subject suffered from poor ECG quality—due to expired ECG electrodes that were inadvertently used. The data of the subject exhibited an abnormal distribution of the extracted features compared to those shown in [17] (p. 51). Specifically, the ratio of ratios (R) systematically deviates more than three standard deviations across all SpO2 levels. Therefore, for this work, only data of the remaining 20 subjects were used for analysis. Demographic information of these 20 subjects including age, weight, height, Fitzpatrick skin type, perfusion indices (PI), etc. are summarized in Table 1. Note that the distribution of PI for red and infrared in this dataset falls well below the poor perfusion threshold (0.3%) as defined by the Food and Drug Administration (FDA) [16], suggesting this measurement site is indeed malperfused.
In the breath-hold study, subjects were first asked to shave their chest hair to reduce interference. Subsequently, each subject performed 10 end-expiratory breath-holds while sitting in an upright posture with a one-minute break between breath-holds. One minute was found to be sufficiently long for SpO2 to return to its baseline level. Subjects were instructed to hold their breath for as long as possible. Throughout the study, subjects wore a nose clip and held the disposable mouthpiece (AFT36 bacteriological filter; Biopac System Inc., Santa Barbara, CA, USA) between their lips. After the data were collected, important oxygenation/deoxygenation events were manually labeled.
As depicted in Figure 1, we collected the following information: ECG (Biopac ECG100A; Biopac System Inc., Santa Barbara, CA, USA), right index finger SpO2 (Biopac OXY100E, TSD124A Finger Clip Transducer; Biopac System Inc.), and respiratory flow (TSD117A Medium Flow Pneumotach Transducer; Biopac System Inc.) data, all sampled at 2000 Hz. The Biopac OXY100E module reports an accuracy ±2% for a SpO2 range of 70–100%. We used the 3M™ Red Dot™ ECG electrodes (model 2660; 3M, Saint Paul, MN, USA) throughout the study. Data outside of this SpO2 range were discarded since the accuracy is unknown.
In parallel, we also attached the wearable patch biosensor to the subject’s mid-sternum and collected single-lead ECG, two sets of multiwavelength PPGs (red, infrared [IR], and green), and triaxial seismocardiogram (SCG, not used in this study), sampled at 500, 67, and 1000 Hz, respectively. The hardware used in the biosensor is almost identical to that reported in our previous work [8,10,23] except for the addition of the PPG modules and the change in form factor. The ECG analog front-end (AFE) and the accelerometer AFE (for SCG) remain the same. Specifically, the PPG AFE used to drive the LEDs and obtain data from the PDs is the Maxim 86170 (Maxim Integrated, San Jose, CA, USA). The multi-chip LEDs, which has red (660 nm), and IR (950 nm), and green (526 nm) wavelengths, are the SFH 7016 (OSRAM, Munich, Germany), and the PDs are the VEMD 8080 (Vishay Semiconductors, Heilbronn, Baden-Württemberg, Germany). Serial Peripheral Interface was used as the communication protocol between the microcontroller and peripheral sensors. This device is also equipped with wireless capabilities (i.e., Bluetooth and Wi-Fi) for transmitting data. However, in this study, data were stored in the Secure Digital card and later retrieved by a custom-built software application as in previous work [8,10,23]. The battery life of the device at the full sample rates of all sensors is up to 60 h. The front and lateral views of the device are shown in Figure 2.

2.3. Manual Labeling

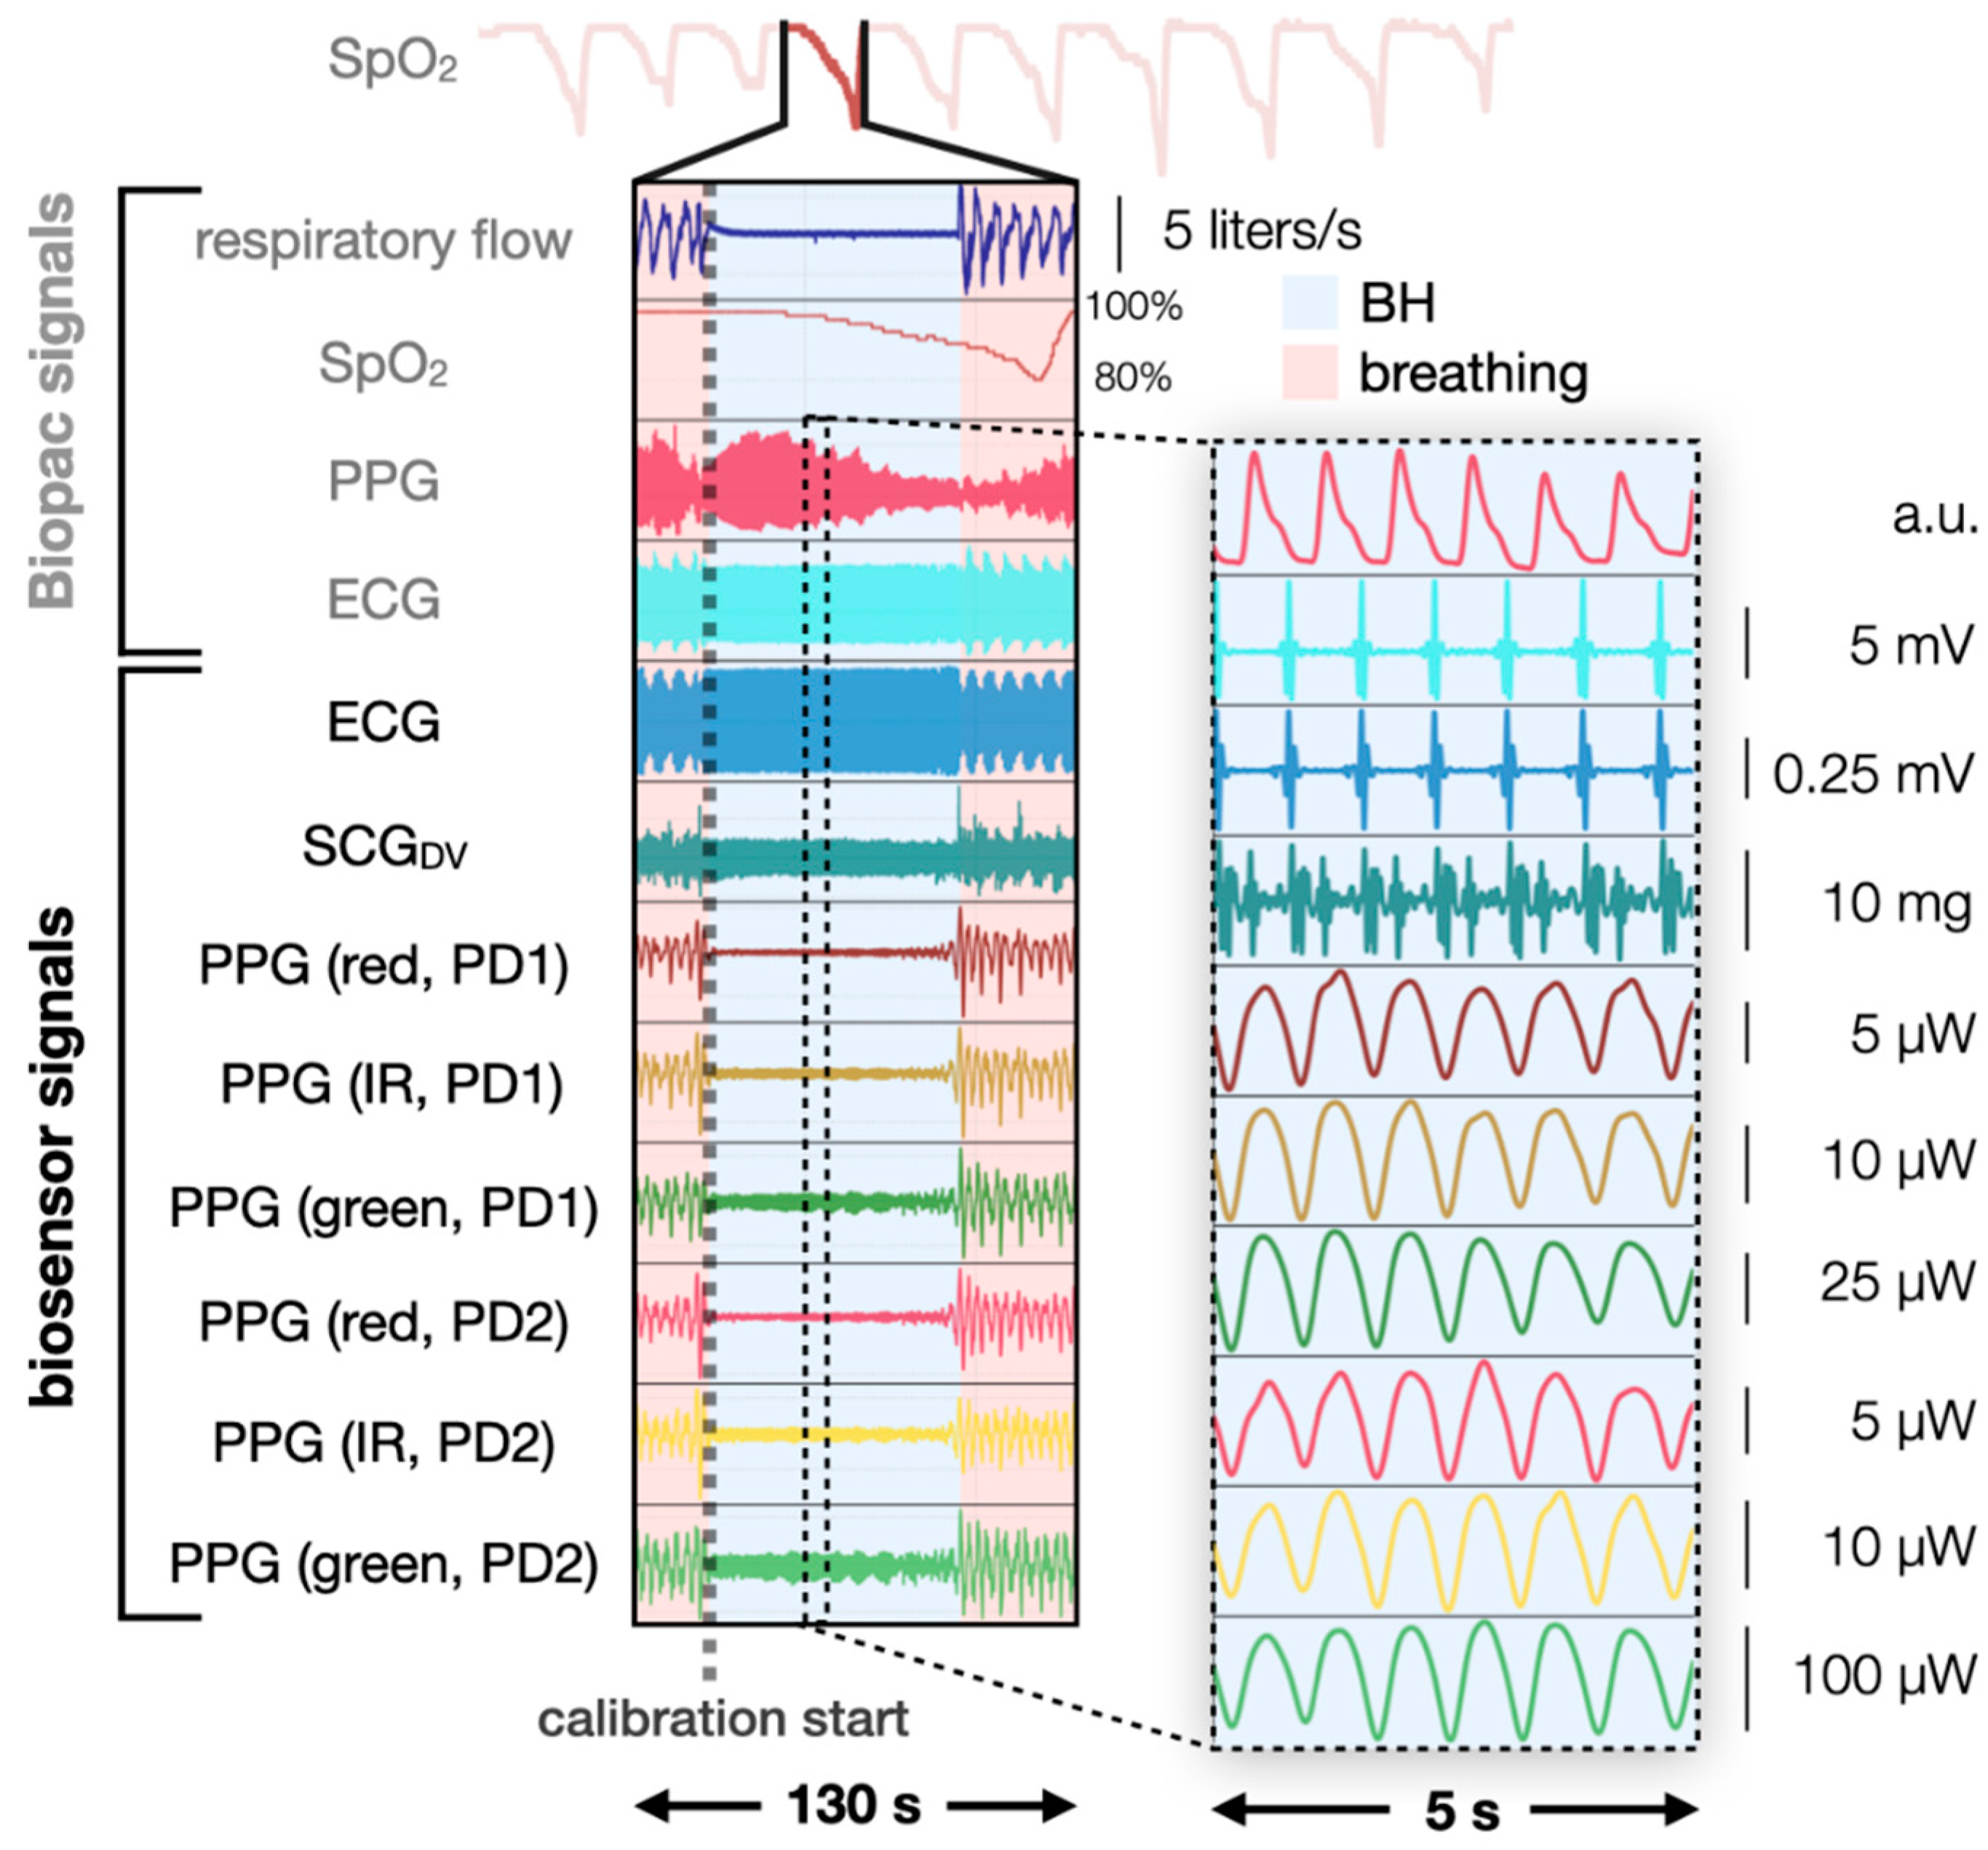
In Figure 3, filtered, high-quality physiological signals acquired during breath-hold and breathing are presented. For each subject, we selected the photodiode (PD) with higher quality as determined by visual inspection. The discrepancy can be attributed to the differences in LED/PD separation distance as LED/PD separation distance can affect the quality of PPG [17] (p. 88). Further assessment may be needed since optimizing the LED/PD separation distance is a critical factor for obtaining a good quality signal. Manual labeling was performed using the respiratory flow and the SpO2 data. Alignment was necessary since it has been observed that deoxygenation events do not occur simultaneously for different body sites, and SpO2 measured at the finger is usually delayed from SpO2 measured at central sites [4,5,24]. This delay can be partially attributed to the oxygen-conserving effect induced by breath-hold. Similar to the diving response [6], breath-hold also leads to bradycardia and peripheral vasoconstriction to reduce oxygen consumption in peripheries and redistribute blood flow to vital organs such as the brain and the heart [6]. The combined effect leads to a delayed deoxygenation measurement by a finger-pulse oximeter when compared to a pulse oximeter placed closer to the heart or the brain. Davies et al. reported a mean delay of 16.75 ± 5.88 s across subjects for their in-ear reflectance pulse oximetry [4].
From the respiratory flow (top signal in Figure 3), breathing (the “oscillating” part, pink) and breath-hold (the “silent” part, blue) segments can be easily distinguished. From the ground truth SpO2 (the second signal on the left in Figure 3), three distinct timestamps were recorded of each deoxygenation event: start, nadir, and end. The start of deoxygenation is defined as the point where SpO2 begins to drop drastically (rate of SpO2 decline > 0.5%/cardiac cycle for 3 consecutive cardiac cycle). The nadir of deoxygenation is defined as the lowest SpO2 within the deoxygenation event. The end of deoxygenation is defined as the point where SpO2 returns to the baseline level. Usually, the nadir and the end of deoxygenation can be easily identified. To account for the delay of deoxygenation between finger and chest deoxygenation, the nadir deoxygenation of the finger is aligned to the end of the breath-hold, based on the assumption that chest arteries received well-oxygenated blood immediately following the end of the breath-hold. Though our results suggest this alignment procedure is somewhat accurate, we found that a more precise alignment algorithm was required to achieve adequate accuracy; the updated alignment algorithm is applied and provided in Appendix A.

2.4. Signal Processing Pipeline

2.4.1. Principle of Pulse Oximetry

To relate the aligned signals to ground truth SpO2, relevant features in the biosensor signals need to be extracted. We followed the standard approach described in [17] (p. 131) and tailored the algorithm to our pulse oximetry. The key feature, R, defined as the ratio of the normalized AC component (also a ratio) of two optical wavelengths, can be extracted from the PPG signals:
R = AC red AC IR DC red DC IR  
where ACred is the AC component of the red PPG, ACIR is the AC component of the IR PPG, DCred is the DC component of the red PPG, and DCIR is the AC component of the IR PPG. Normalization is performed by dividing the AC component of a wavelength by its DC component. R, along with the absorption coefficients of oxyhemoglobin (HbO2) and deoxyhemoglobin (Hb) for different wavelengths, can be used together to derive SaO2 directly. According to [17] (p. 50), the theoretical relationship between SaO2 and R is defined as:
SaO 2 = ε Hb ( λ red ) ε Hb ( λ IR ) R   ε Hb ( λ red ) ε HbO 2 ( λ red ) + [ ε HbO 2 ( λ IR ) ε Hb ( λ IR ) ] R
where εHb is the absorption coefficients of Hb, εHbO2 is the absorption coefficients of HbO2, λred is the wavelength of the red PPG, and λIR is the wavelength of the IR PPG. If further approximated using a Taylor series expansion,
SaO 2 ^ = A × R + B C × R + D m × R + b = SpO 2
emerges as an empirical model that governs the relationship between SpO2, the surrogate of SaO2, and R. In Equation (3), A, B, C, and D replace the absorbance coefficients of the Hb and HbO2 at the two wavelengths [17] (p. 54), m is the slope, and b is the intercept.

2.4.2. Preprocessing Overview

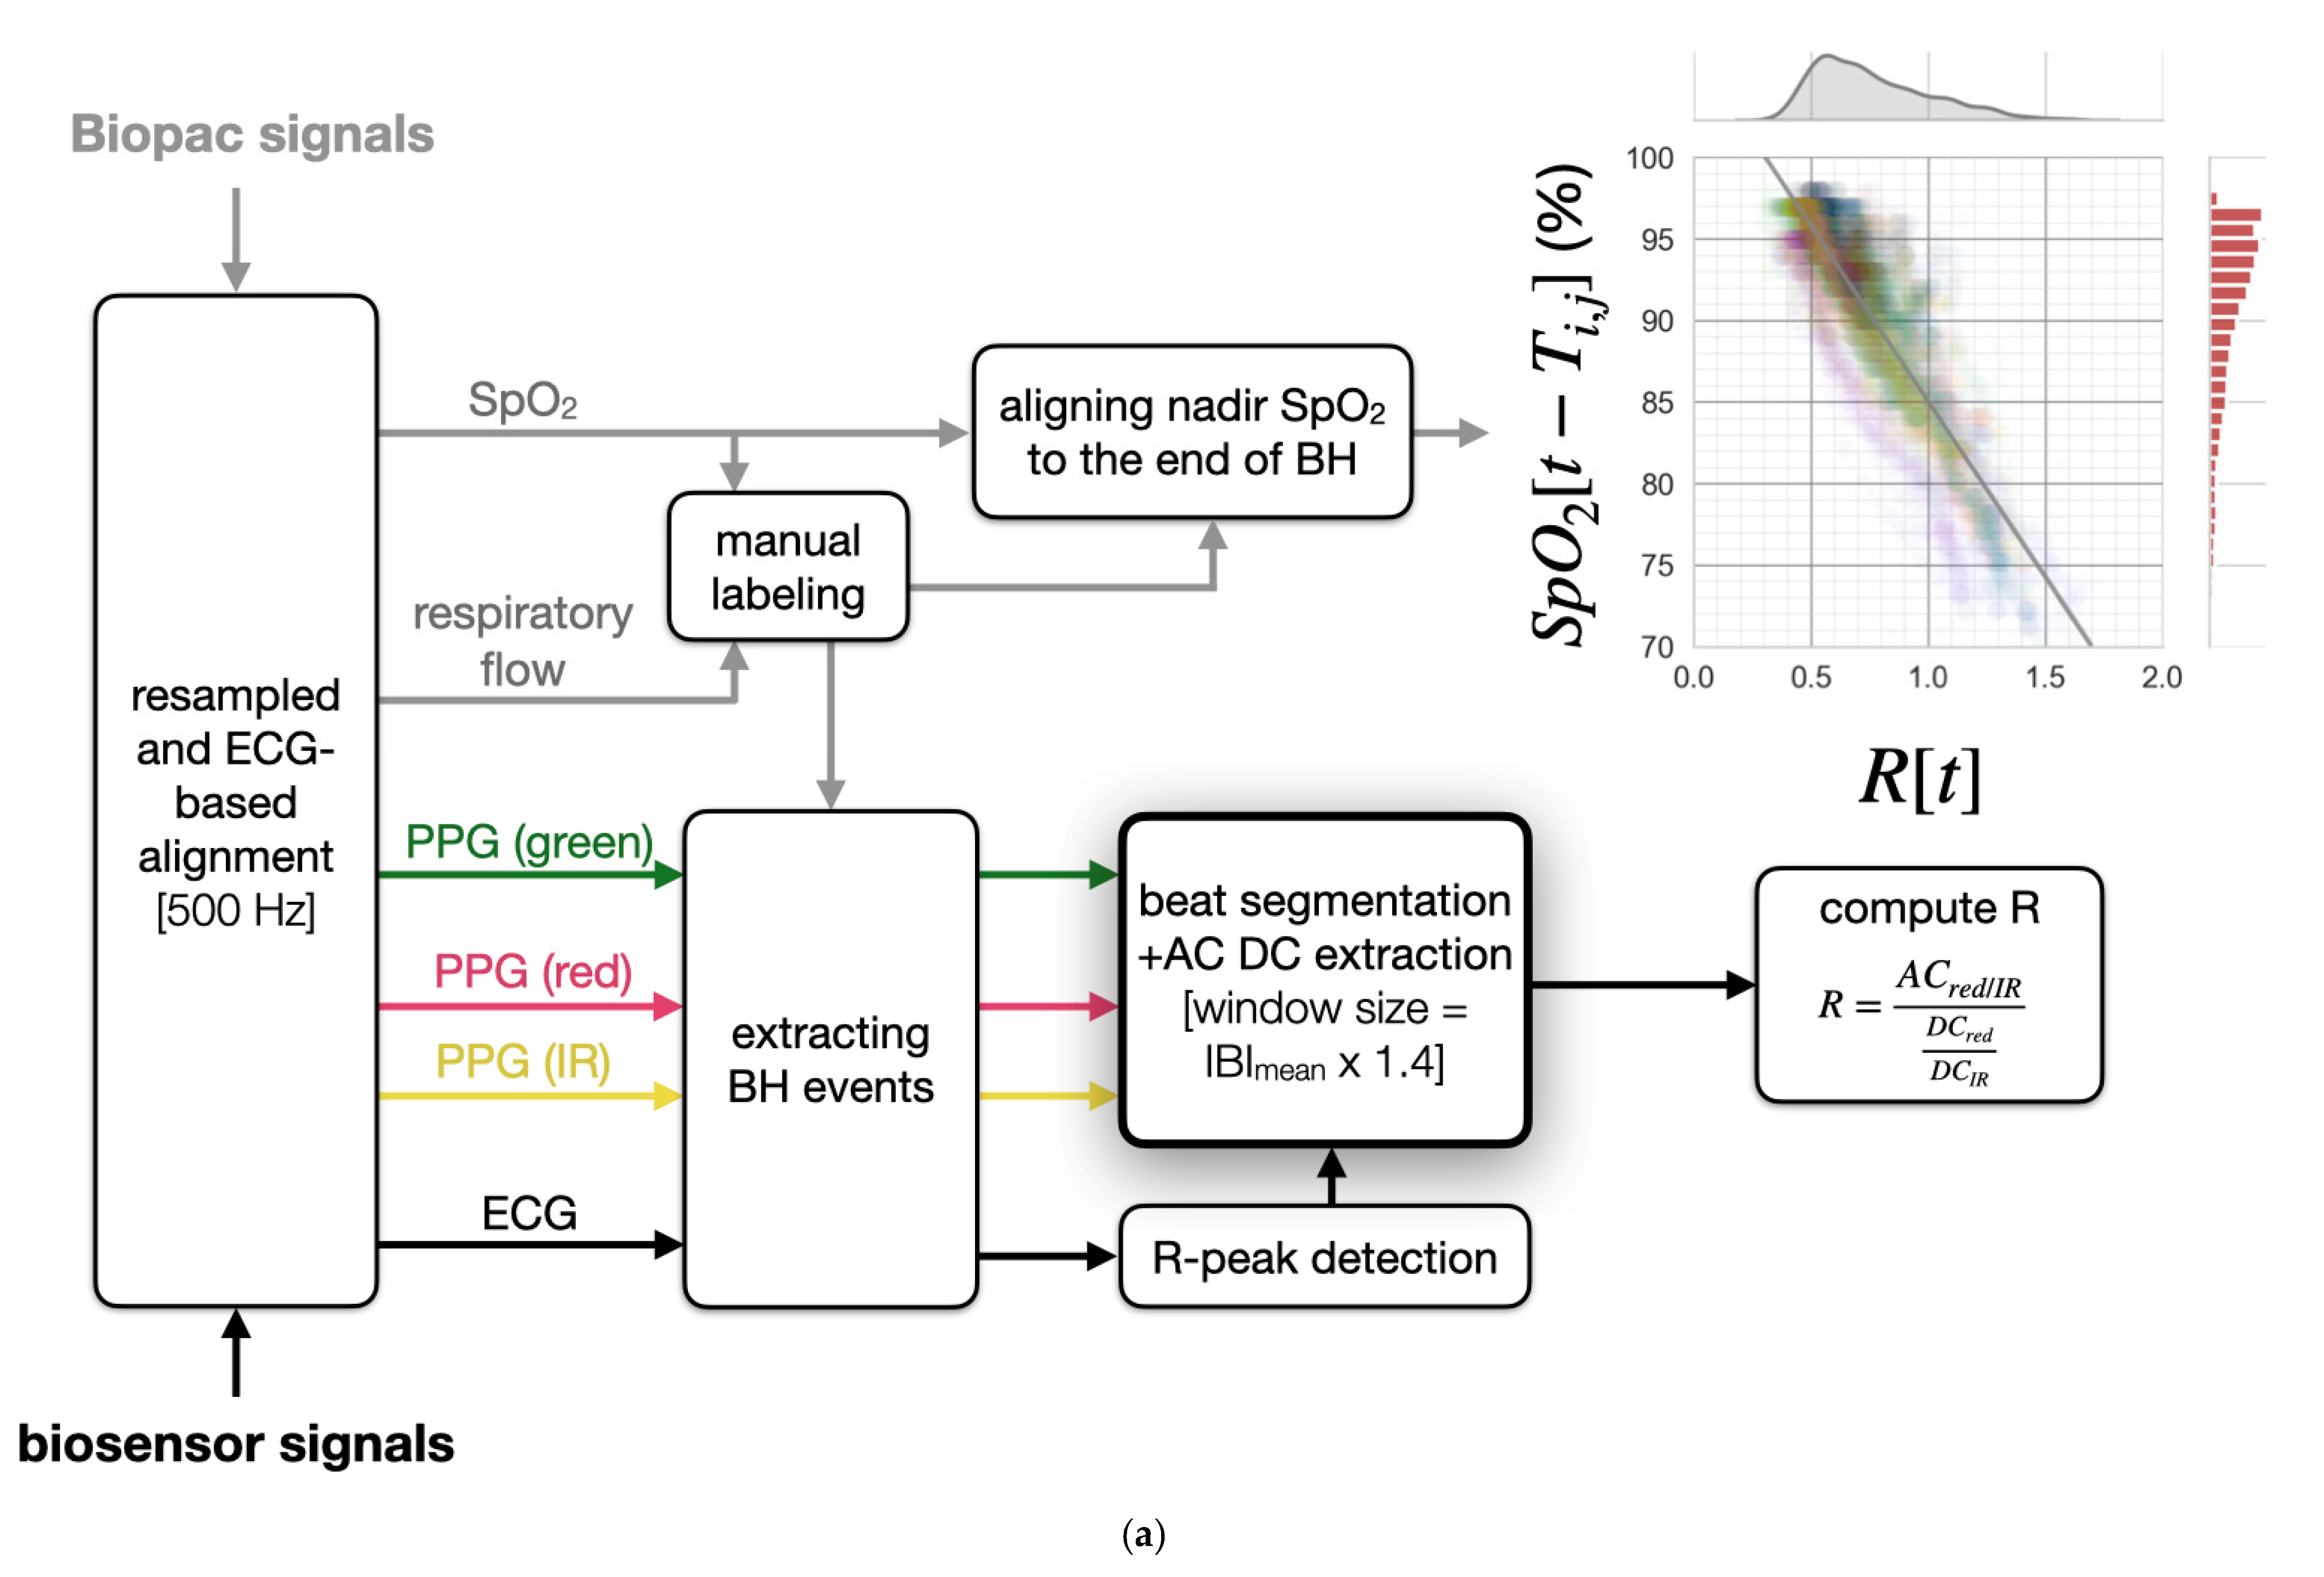
Figure 4a illustrates our signal-preprocessing pipeline, which we used to extract R from the wearable patch biosensor signals. Although there are other signals in the dataset, we only found six that are relevant to this work, namely, finger SpO2, red PPG, IR PPG, green PPG, ECG, and respiratory flow. The Biopac and biosensor signals were first resampled to 500 Hz and synchronized by maximizing the cross-correlation of their ECG signals. The Biopac SpO2 was further aligned to the biosensor signals on a per breath-hold basis, using the manual label described in Section 2.3. Due to both respiratory artifacts when emerging from breath-hold and the lack of range in measured SpO2 values, we only target SpO2 estimation during the breath-hold segments of the signals. Each extracted R from the breath-hold segments was paired with the manually aligned SpO2, and both a scatter plot—demonstrating the correlation between R and SpO2—and distributions plots to show the skewness of R and SpO2—are depicted in Figure 4a. The skewness of R and SpO2 can be partially attributed to our ability to maintain oxygenation homeostasis, enabled by the continuous supply of oxygen by the oxygen stores upon breath-hold [6]. Before uncovering the relationship between R and SpO2, we will first demonstrate robust feature extraction and the outlier rejection algorithms necessary to extract R for the chest-based pulse oximetry.

2.4.3. Robust Feature Extraction via Linear Transformation

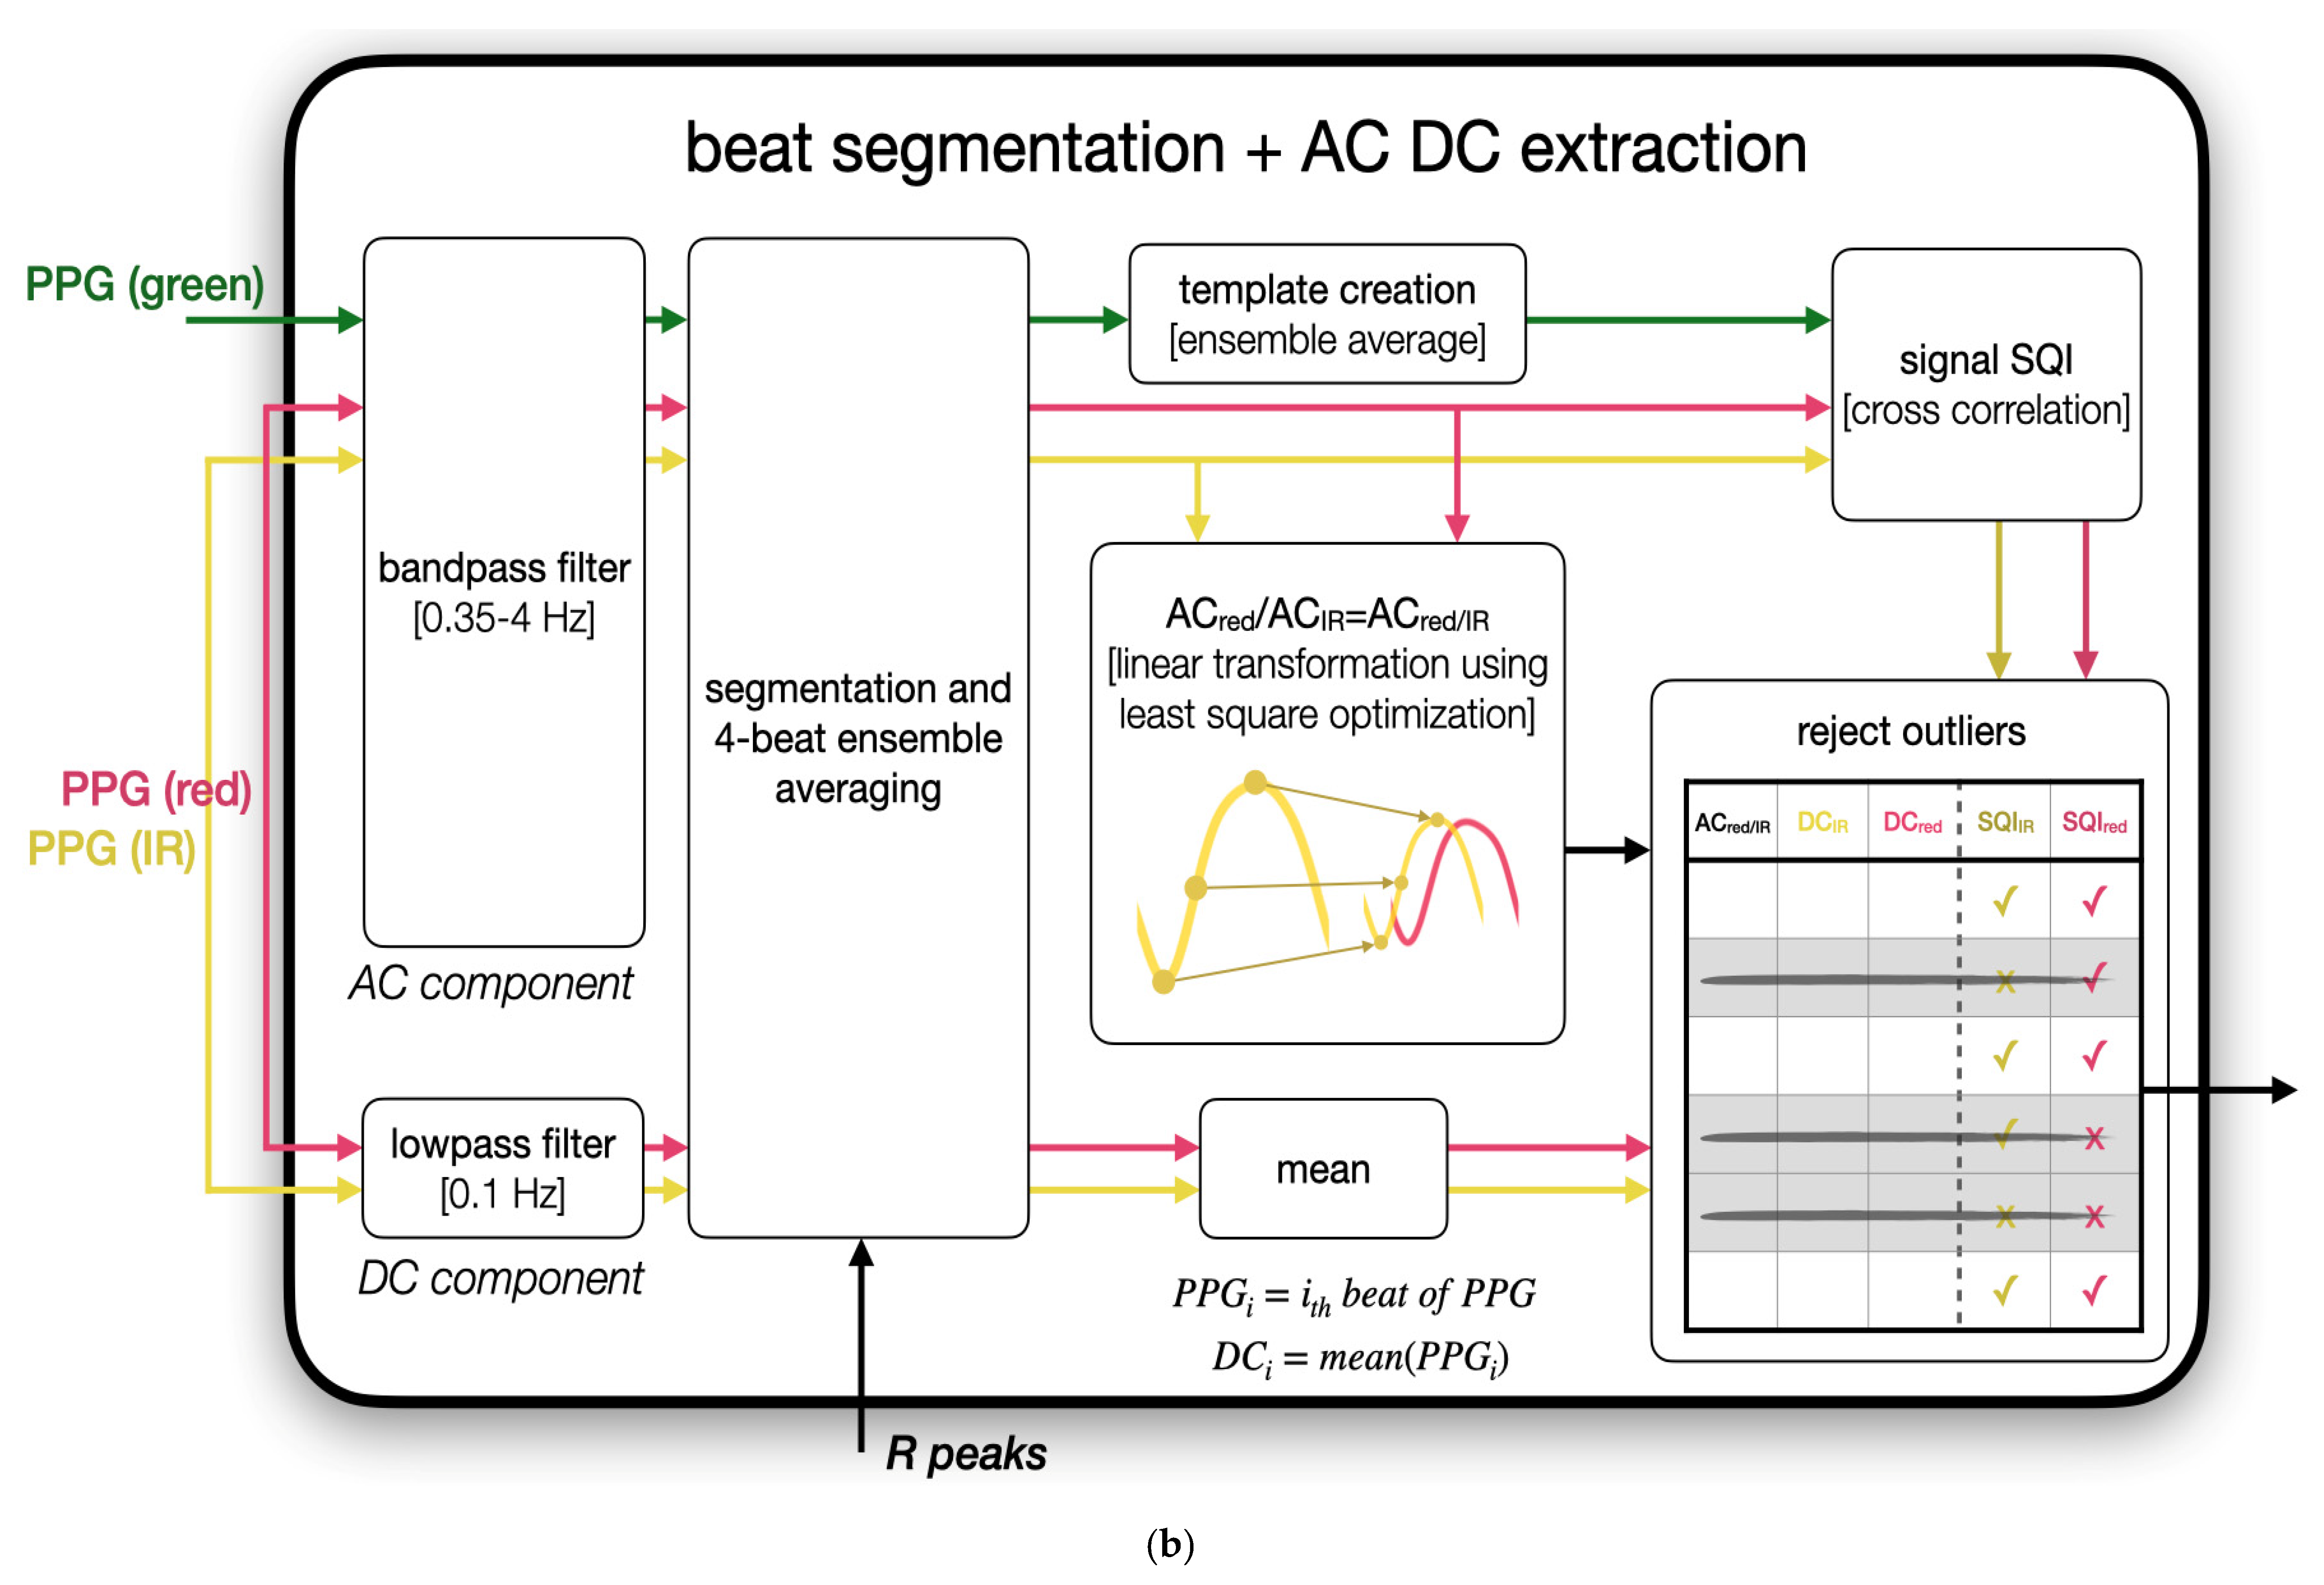
To compute R, it is necessary to compute AC features and DC features of each PPG beat. Note that a feature represents a scalar value to represent the characteristic of a PPG beat in the context of this work. In Figure 4b, the block diagram for beat segmentation and feature extraction has been shown. To isolate the AC component, an empirically validated bandpass filter, with a passband of 0.35 to 4 Hz was first applied. The low cutoff was chosen to remove the baseline wander, due to involuntary respiratory movement. The high cutoff was chosen empirically so as to reduce the dicrotic notch and preserve only the frequency components with less variation across wavelengths. The AC component was segmented into PPG beats using ECG R-peaks detected by a Pan-Tomkins algorithm [25], modified for R-peak correction and further smoothed using 4-beat ensemble averaging. Conventionally, computing AC features for red and IR PPG relies on robust peak and valley extraction. Although we were able to minimize respiratory artifacts through the breath-hold protocol, involuntary respiratory movements were still present and observable in some subjects. Evidently, extracting R robustly from respiration-corrupted PPG can be challenging [12,26]. Conventionally, the peak and valley of PPG in each cardiac cycle are extracted to compute the AC features [17] (pp. 129–130). In a preliminary analysis, we found that this method is not reliable as the signal can be easily distorted by the subtle—yet still significant—involuntary respiratory movements at this low perfusion site. To address this, we introduced a novel algorithm that does not require peak and valley extraction. Specifically, by rearranging the terms in Equation (1), we can obtain,
R = AC red AC IR DC red DC IR = AC red / IR DC red DC IR
By computing the ACred/IR, the ratio of ACred to ACIR, we can avoid the difficulty of extracting peaks and valleys in distorted PPG signals. To do so, we leveraged the fact that the IR PPG beat, denoted as PPGIR, appears to have a similar morphology to the red PPG beat, denoted as PPGred, after being bandpass filtered. Therefore, we can model the relationship of the two PPG beats using a linear transformation method:
α 1 , α 2 = argmin α 1 ,   α 2 PPG red α 1 PPG IR α 2 2 2
where PPG red , PPG IR N , N is the number of samples in the PPG beat, and α 1 , α 2 denote the scale and the bias that will minimize the ℓ2-norm of their differences. With the assumption that the differences, once optimized, should be closely distributed, we rejected beats with differences of more than five median absolute deviations from the median, which is a more robust rejection criterion compared to the “standard deviations around the mean” method [27]. Note we rejected only 1.79% using this method. The optimal scale, α 1 , represents the ratio of the AC component of the two wavelengths:
AC red / IR = α 1
In parallel, the DC component was isolated using a low-pass filter with a high cutoff frequency at 0.1 Hz. This cutoff was based on a heuristic assumption that physiological dynamics of faster than 0.1 Hz (e.g., involuntary respiratory movement) do not directly relate to the deoxygenation induced by breath-hold based on data shown in [28,29,30]. The DC component was similarly segmented and smoothed to ensure consistency with the processing steps for AC extraction. Finally, DC features were computed as the mean of the segmented DC beats.

2.4.4. PPGgreen-Based Outlier Rejection

Although we carefully selected the parameters of the preprocessing and feature extraction pipeline, some PPG beats may still be distorted due to motion artifacts and involuntary respiratory movements and therefore can hinder accurate SpO2 estimation. Hence, we designed a novel outlier rejection algorithm using the green PPG beats as a signal quality template for its robustness against noise [31], so as to reduce the contamination of abnormal features extracted. Our signal quality assessment relied on two assumptions: (1) reliable red or IR PPG beats in the bandwidth filtered constitute a morphology similar to that of green PPG beats; and (2) outliers in AC ratios are defined as datapoints that deviate by more than five median absolute deviations from the median (similar to the ACred/IR rejection method). To determine the similarity, we consider a methodology described in [32]. First, the normalized cross-correlation (NCC) between a PPG beat with its corresponding template is computed:
NCC k ,   λ = n = 1 N ( PPG λ ( n ) PPG λ ¯ ) ( PPG green ( n + k ) PPG green ¯ ) n = 1 N ( PPG λ ( n ) PPG λ ¯ ) 2 n = 1 N ( PPG green ( n + k ) PPG green ¯ ) 2  
where PPGλ(n) denotes the nth sample in the PPG beat of wavelength λ, PPG λ ¯ denotes the average value of the samples in a PPG beat of wavelength λ, and NCCk, λ denotes the correlation coefficient between PPGλ and the k-lag PPGgreen. Next, the maximal NCCλ, NCCmax,λ, defined as
NCC max ,   λ = argmax k NCC k , λ
is selected as a measure of the SQI of the PPGλ and has a range of [0, 1]. Both assumptions translate directly to the two upper right blocks in Figure 4b. Each signal quality index (SQI) method has an empirically determined threshold, 0.7, and a sample is excluded if either SQI method suggests so. The PPGgreen-based outlier rejection algorithm rejected nearly 8.07% of the beats.

2.4.5. Computation of R

The output matrix in Figure 5b has a dimension of Nbeats × 5, where the five columns represent the AC features (ACred/IR), two DC features (DCred, DCIR), and the two binary SQI decisions (SQIred, SQIIR). Only features approved by the SQI algorithm were used to compute R. Note that we also experimented with the peak and valley method, but it would require a more aggressive outlier rejection threshold (~30% rejection ratio) to achieve comparable SpO2 estimation accuracy. Finally, R is computed by dividing ACred/IR by DC red DC IR as shown below,
R = AC red / IR DC red DC IR = α 1 DC red DC IR  
In this dataset, R is a unit-less measure and generally ranges from 0.4 to 1.6 for SpO2 above 70%.

2.5. SpO2 Estimation

2.5.1. Linear Regression

The temporally aligned SpO2 and the extracted R were subsequently used to train the parameters in Equation (3). The parameters m (slope) and b (intercept) were estimated by minimizing the ℓ2-norm of the difference between the ground truth SpO2 and estimated SpO2:
m , b = argmin m ,   b   SpO 2 m R b 2 2 = f ( x )
where x denotes pairs of SpO2 and R, and f represents an arbitrary function for determining the optimal parameters of an objective function.

2.5.2. Training and Calibration Schemes

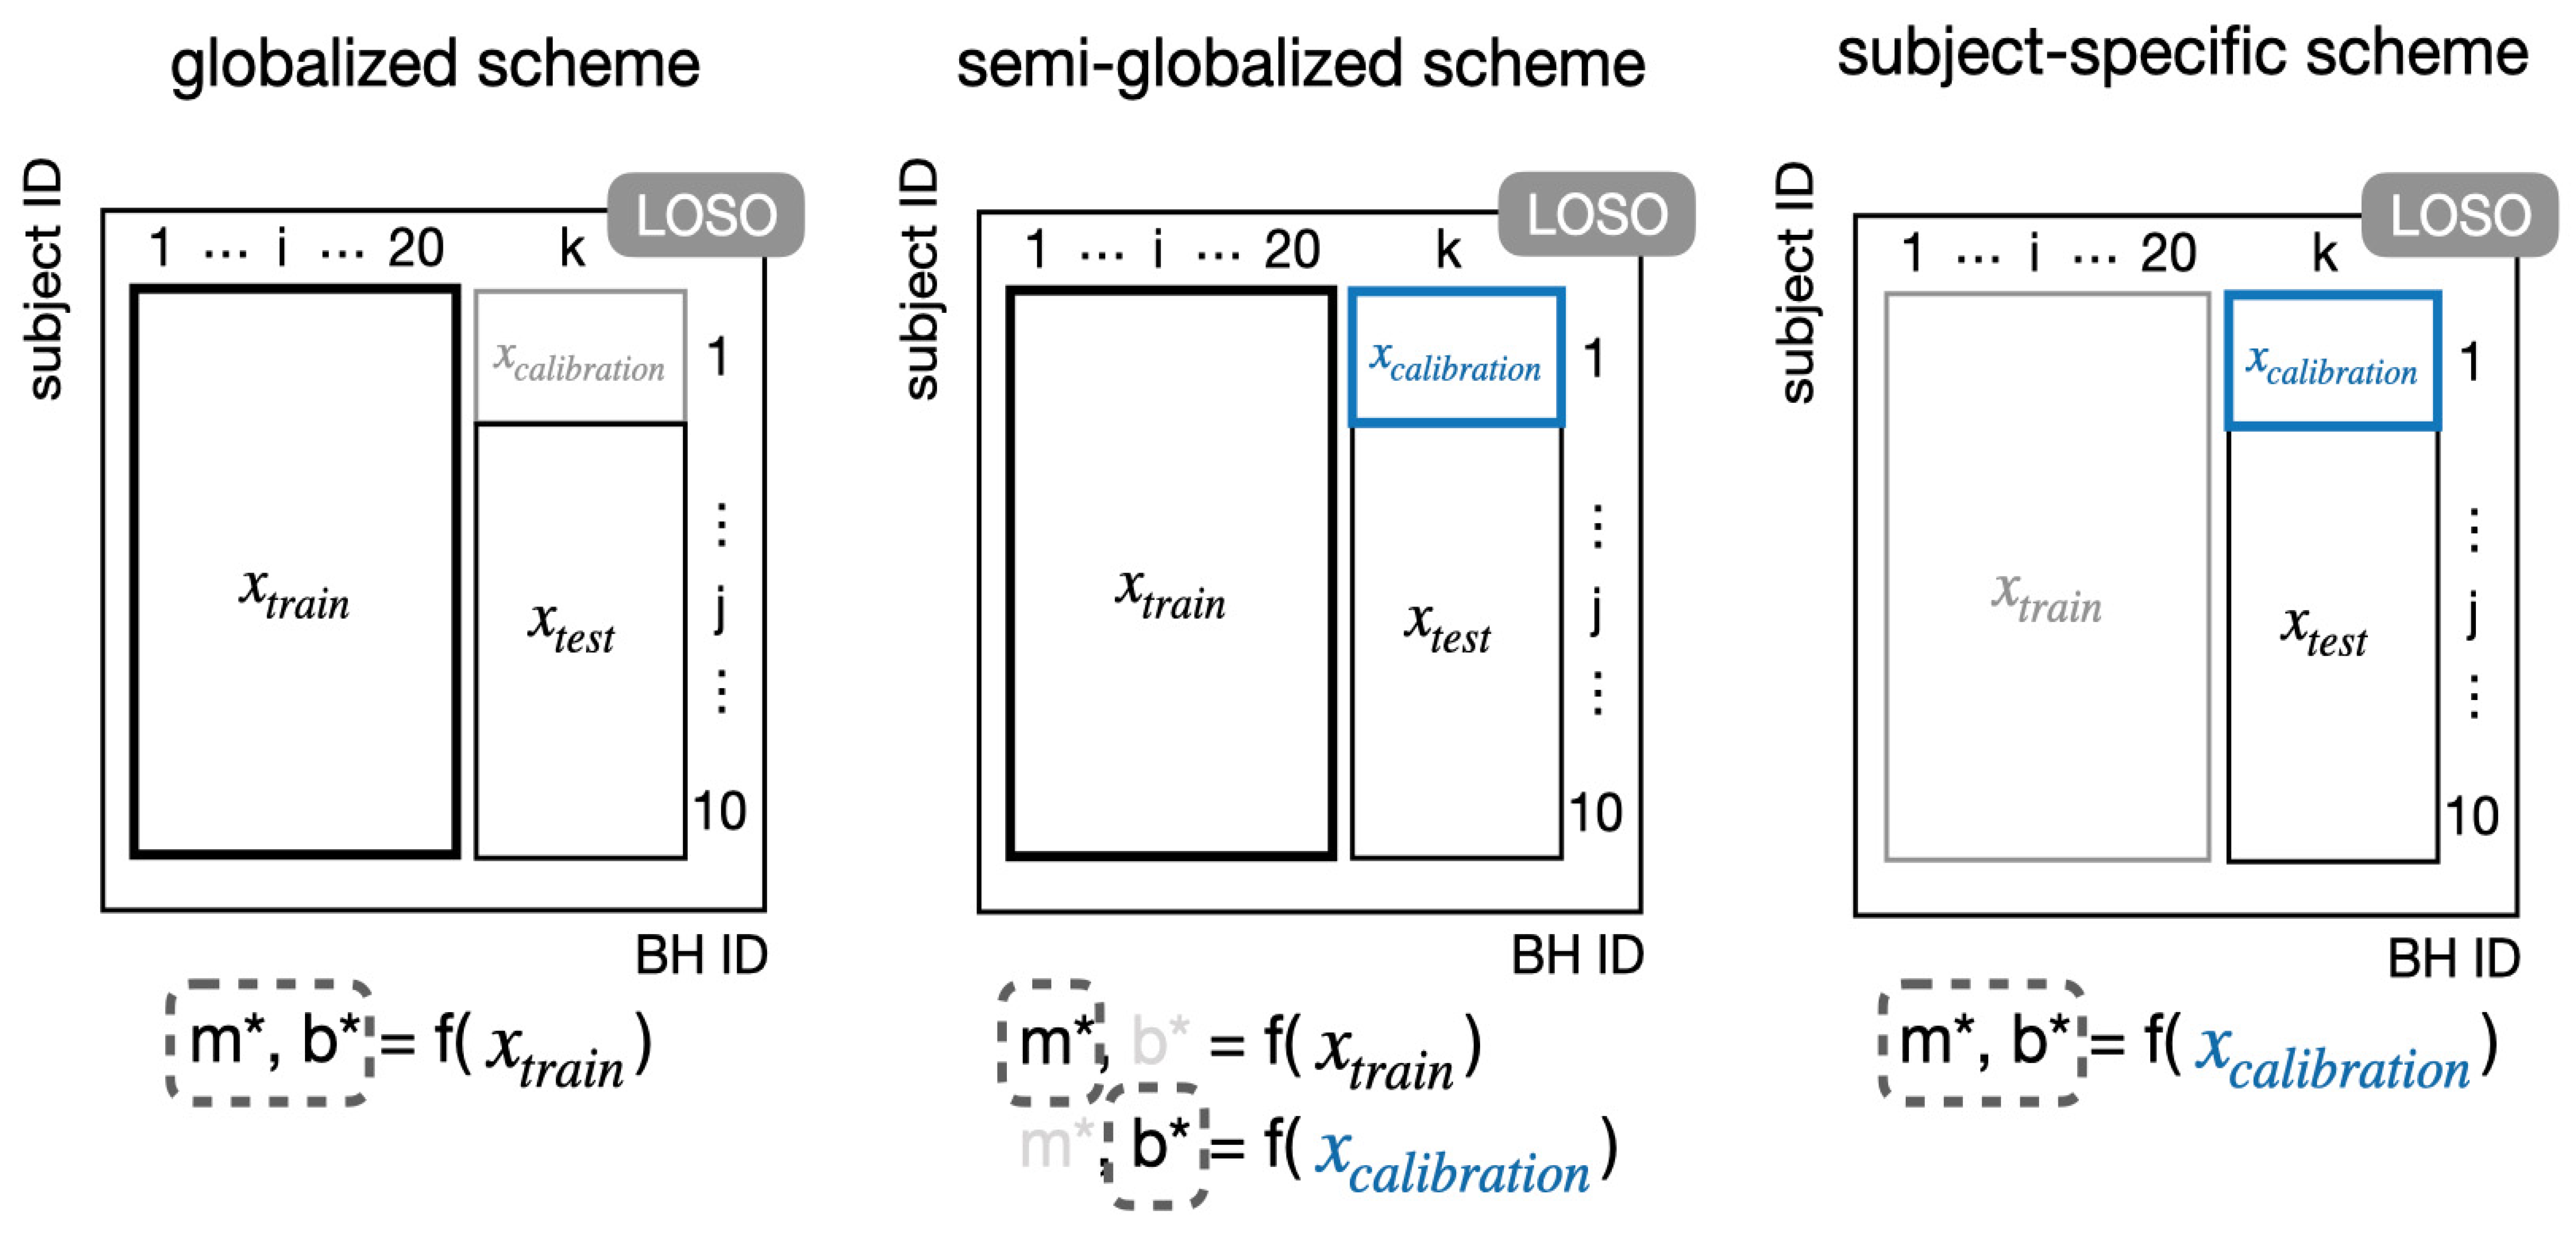
Since including a one-time, short calibration procedure is realistic for practical usage of the device, we also investigated the best training and subject-specific calibration procedure. Three training and calibration schemes were considered, including a (1) globalized scheme containing subject-independent training (see Figure 5a); (2) semi-globalized scheme featuring global training with subject-specific calibration (see Figure 5b); (3) subject-specific scheme (see Figure 5c). The globalized scheme is equivalent to the standard LOSO cross validation. The semi-globalized scheme described herein is analogous to the semi-globalized method discussed in [33], aside from the fact that we used duration rather than number of points to standardize the subject-specific calibration. Particularly, in the semi-globalized scheme the globally trained intercept b was replaced by a subject-specific calibrated b (using the data in the first of the 10 breath-holds). The subject-specific scheme involved training both parameters using only the first breath-hold data of the subject. Note that we also explored calibration using m, but the results were considerably worse and therefore not reported. In both globalized and semi-globalized schemes, LOSO cross validation was also used to assess generalizability of the models trained. To compare model performance fairly and to avoid data leakage, we excluded the first breath-hold of the test subjects for evaluation of the globalized schemes to ensure identical testing data.

2.5.3. Evaluating Model Performance

To assess the performance of these three schemes, we recorded the RMSE, the parameters of the linear model on a per subject basis, and the Pearson correlation coefficient (PCC) of estimated SpO2 on all subjects jointly. The mean and the standard deviation of the subject-specific RMSEs were computed to summarize the performance of each scheme and subsequently used as the critical metric to assess the capability of the pulse oximetry. Note that the errors presented in this work are all absolute errors rather than relative/percentage errors. The unit of RMSE is denoted by %, which represent the oxygen saturation level.

3. Results

3.1. Accuracy of SpO2 Estimation

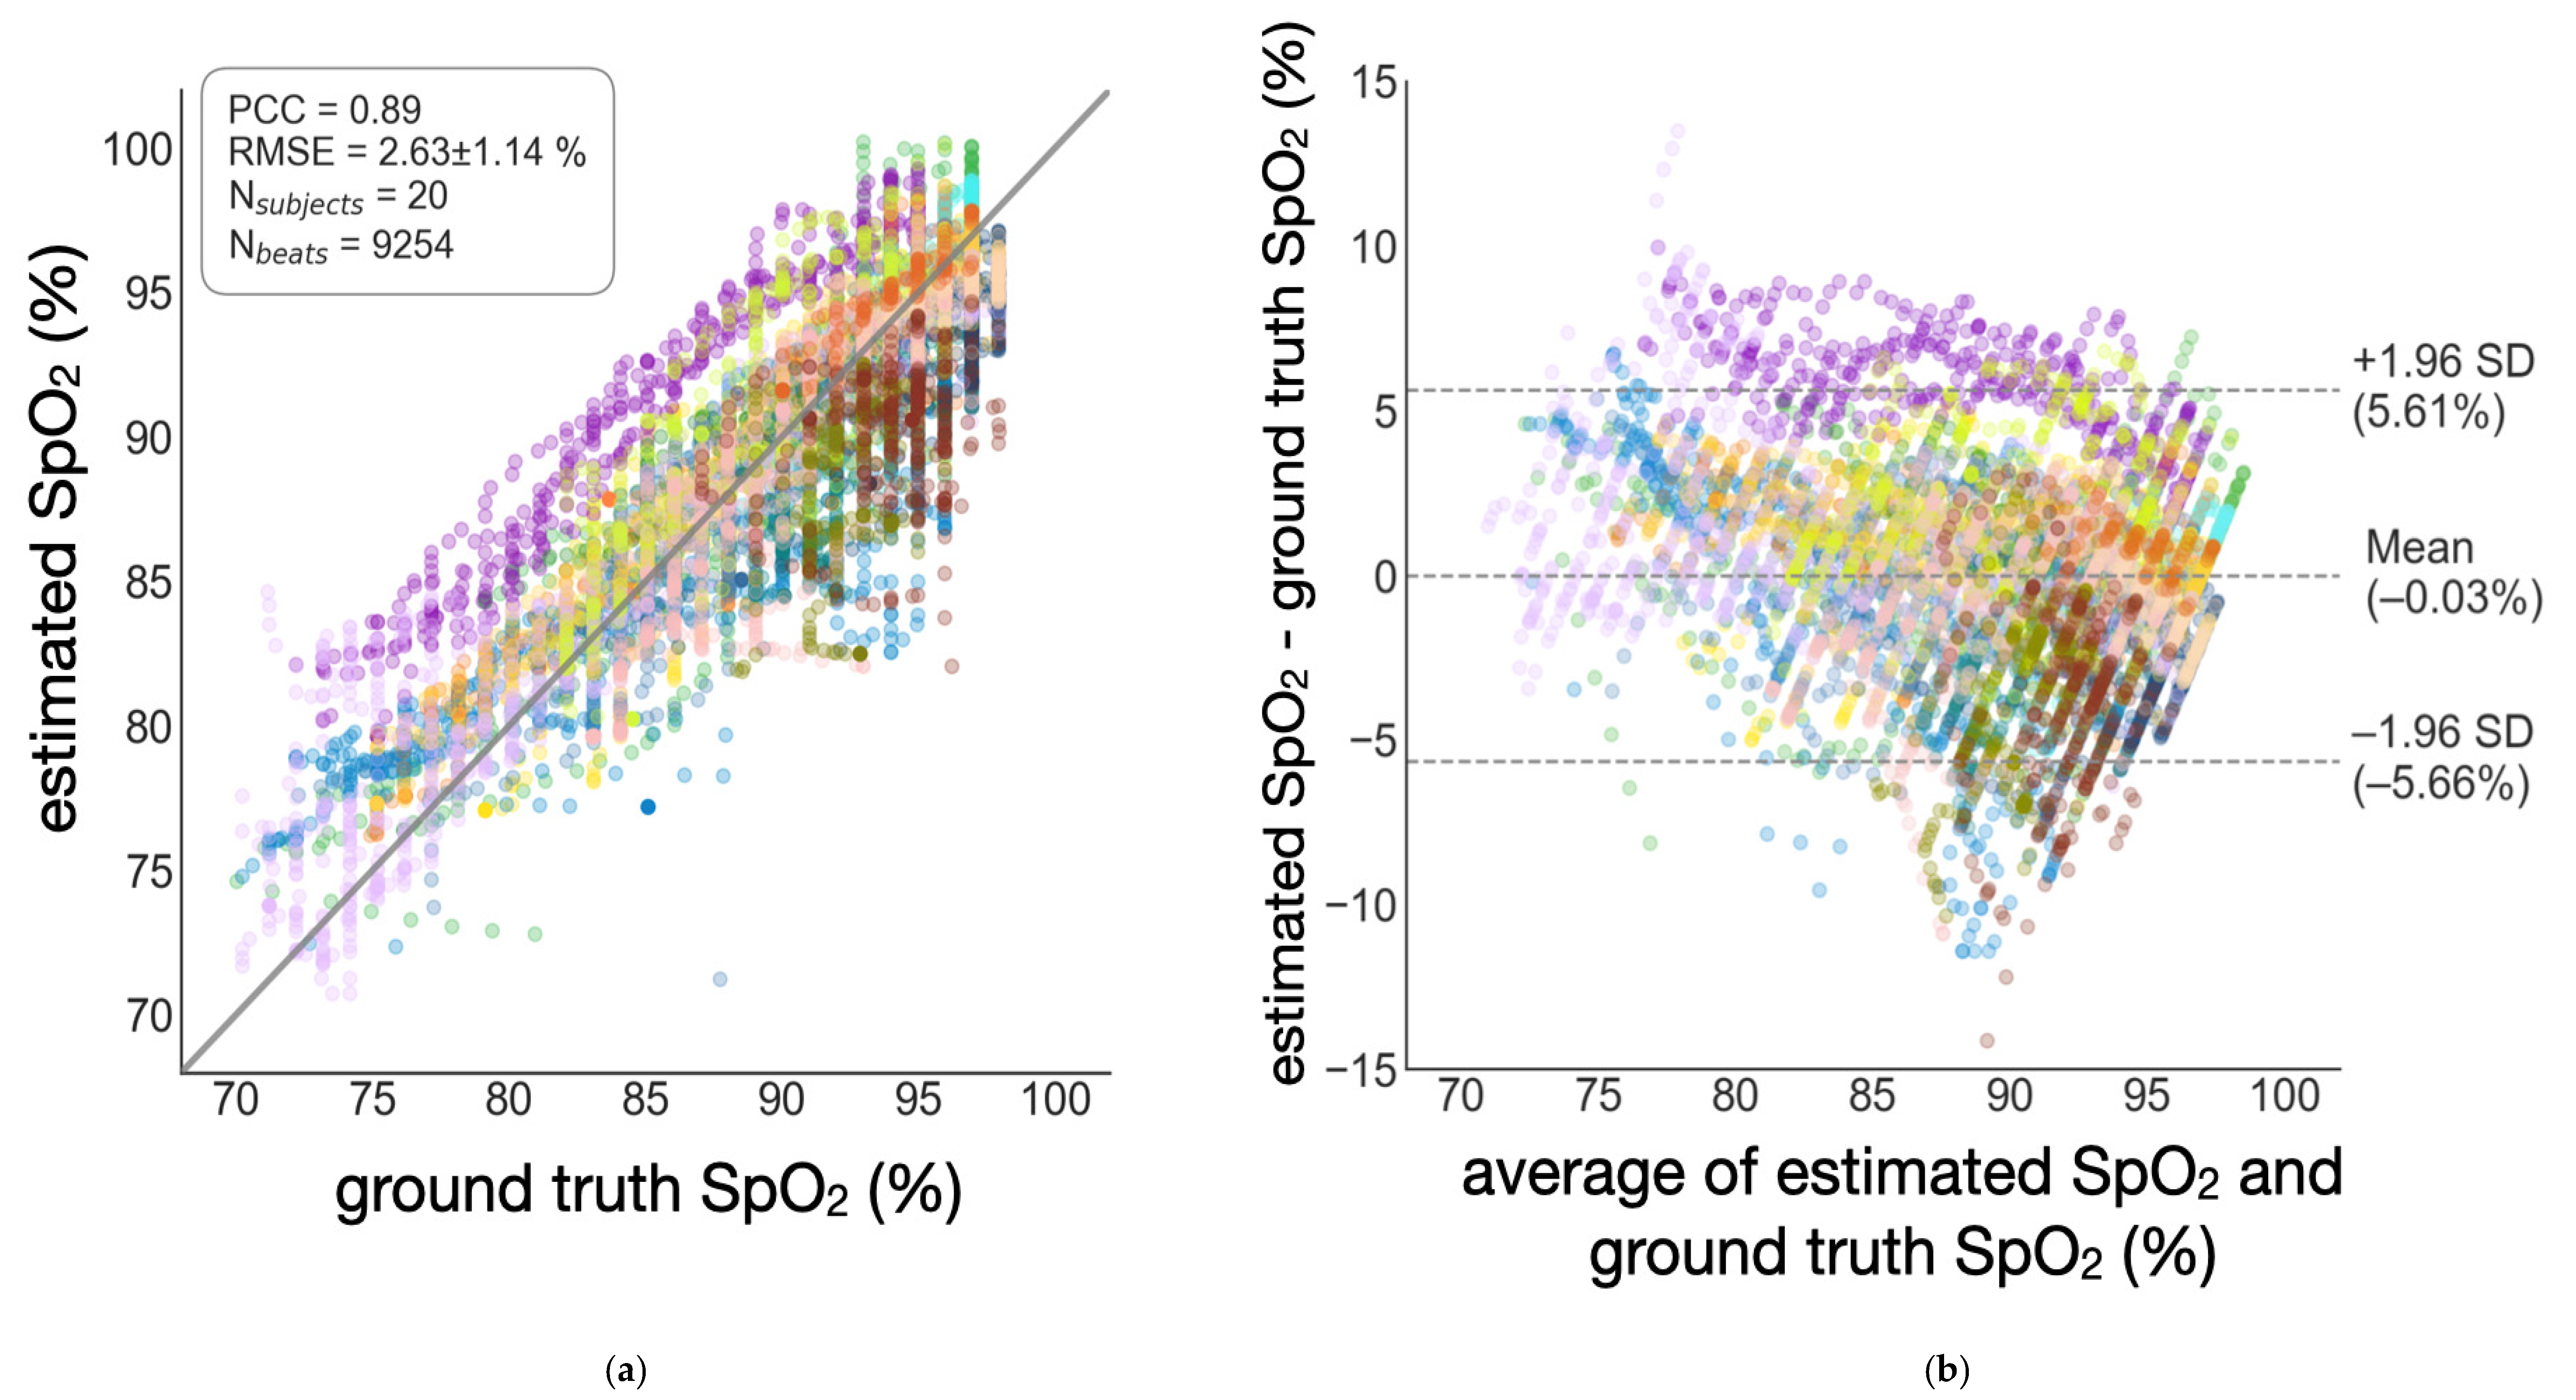
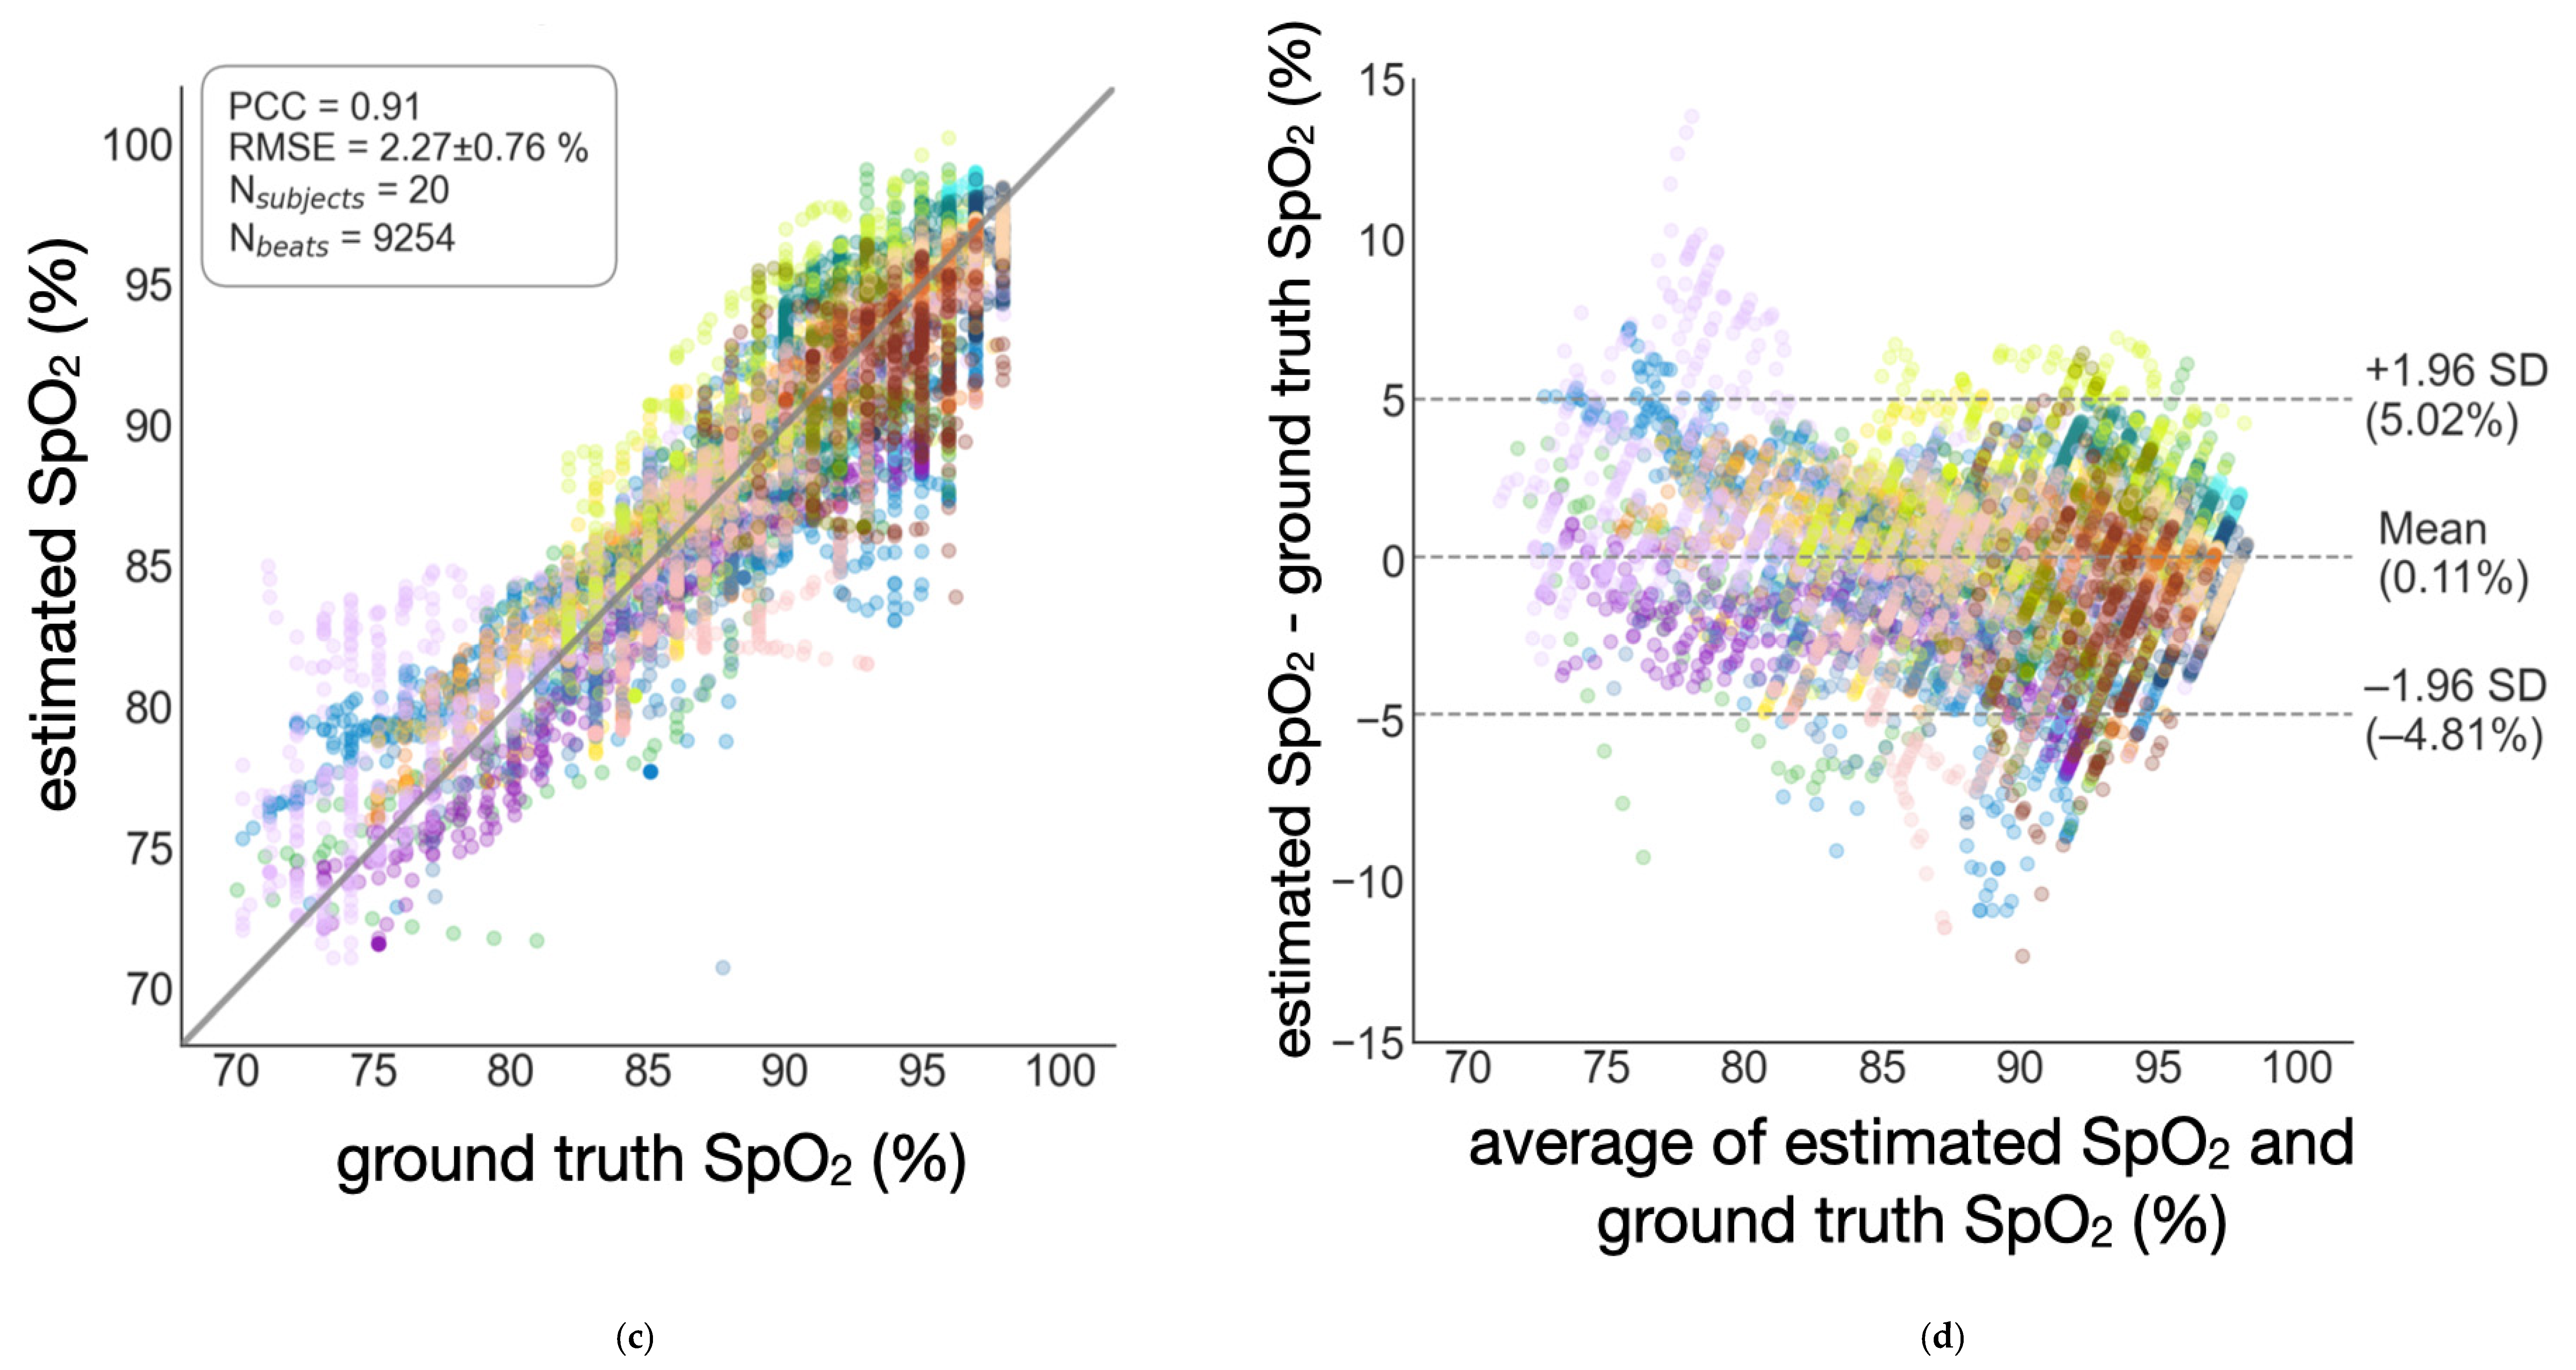
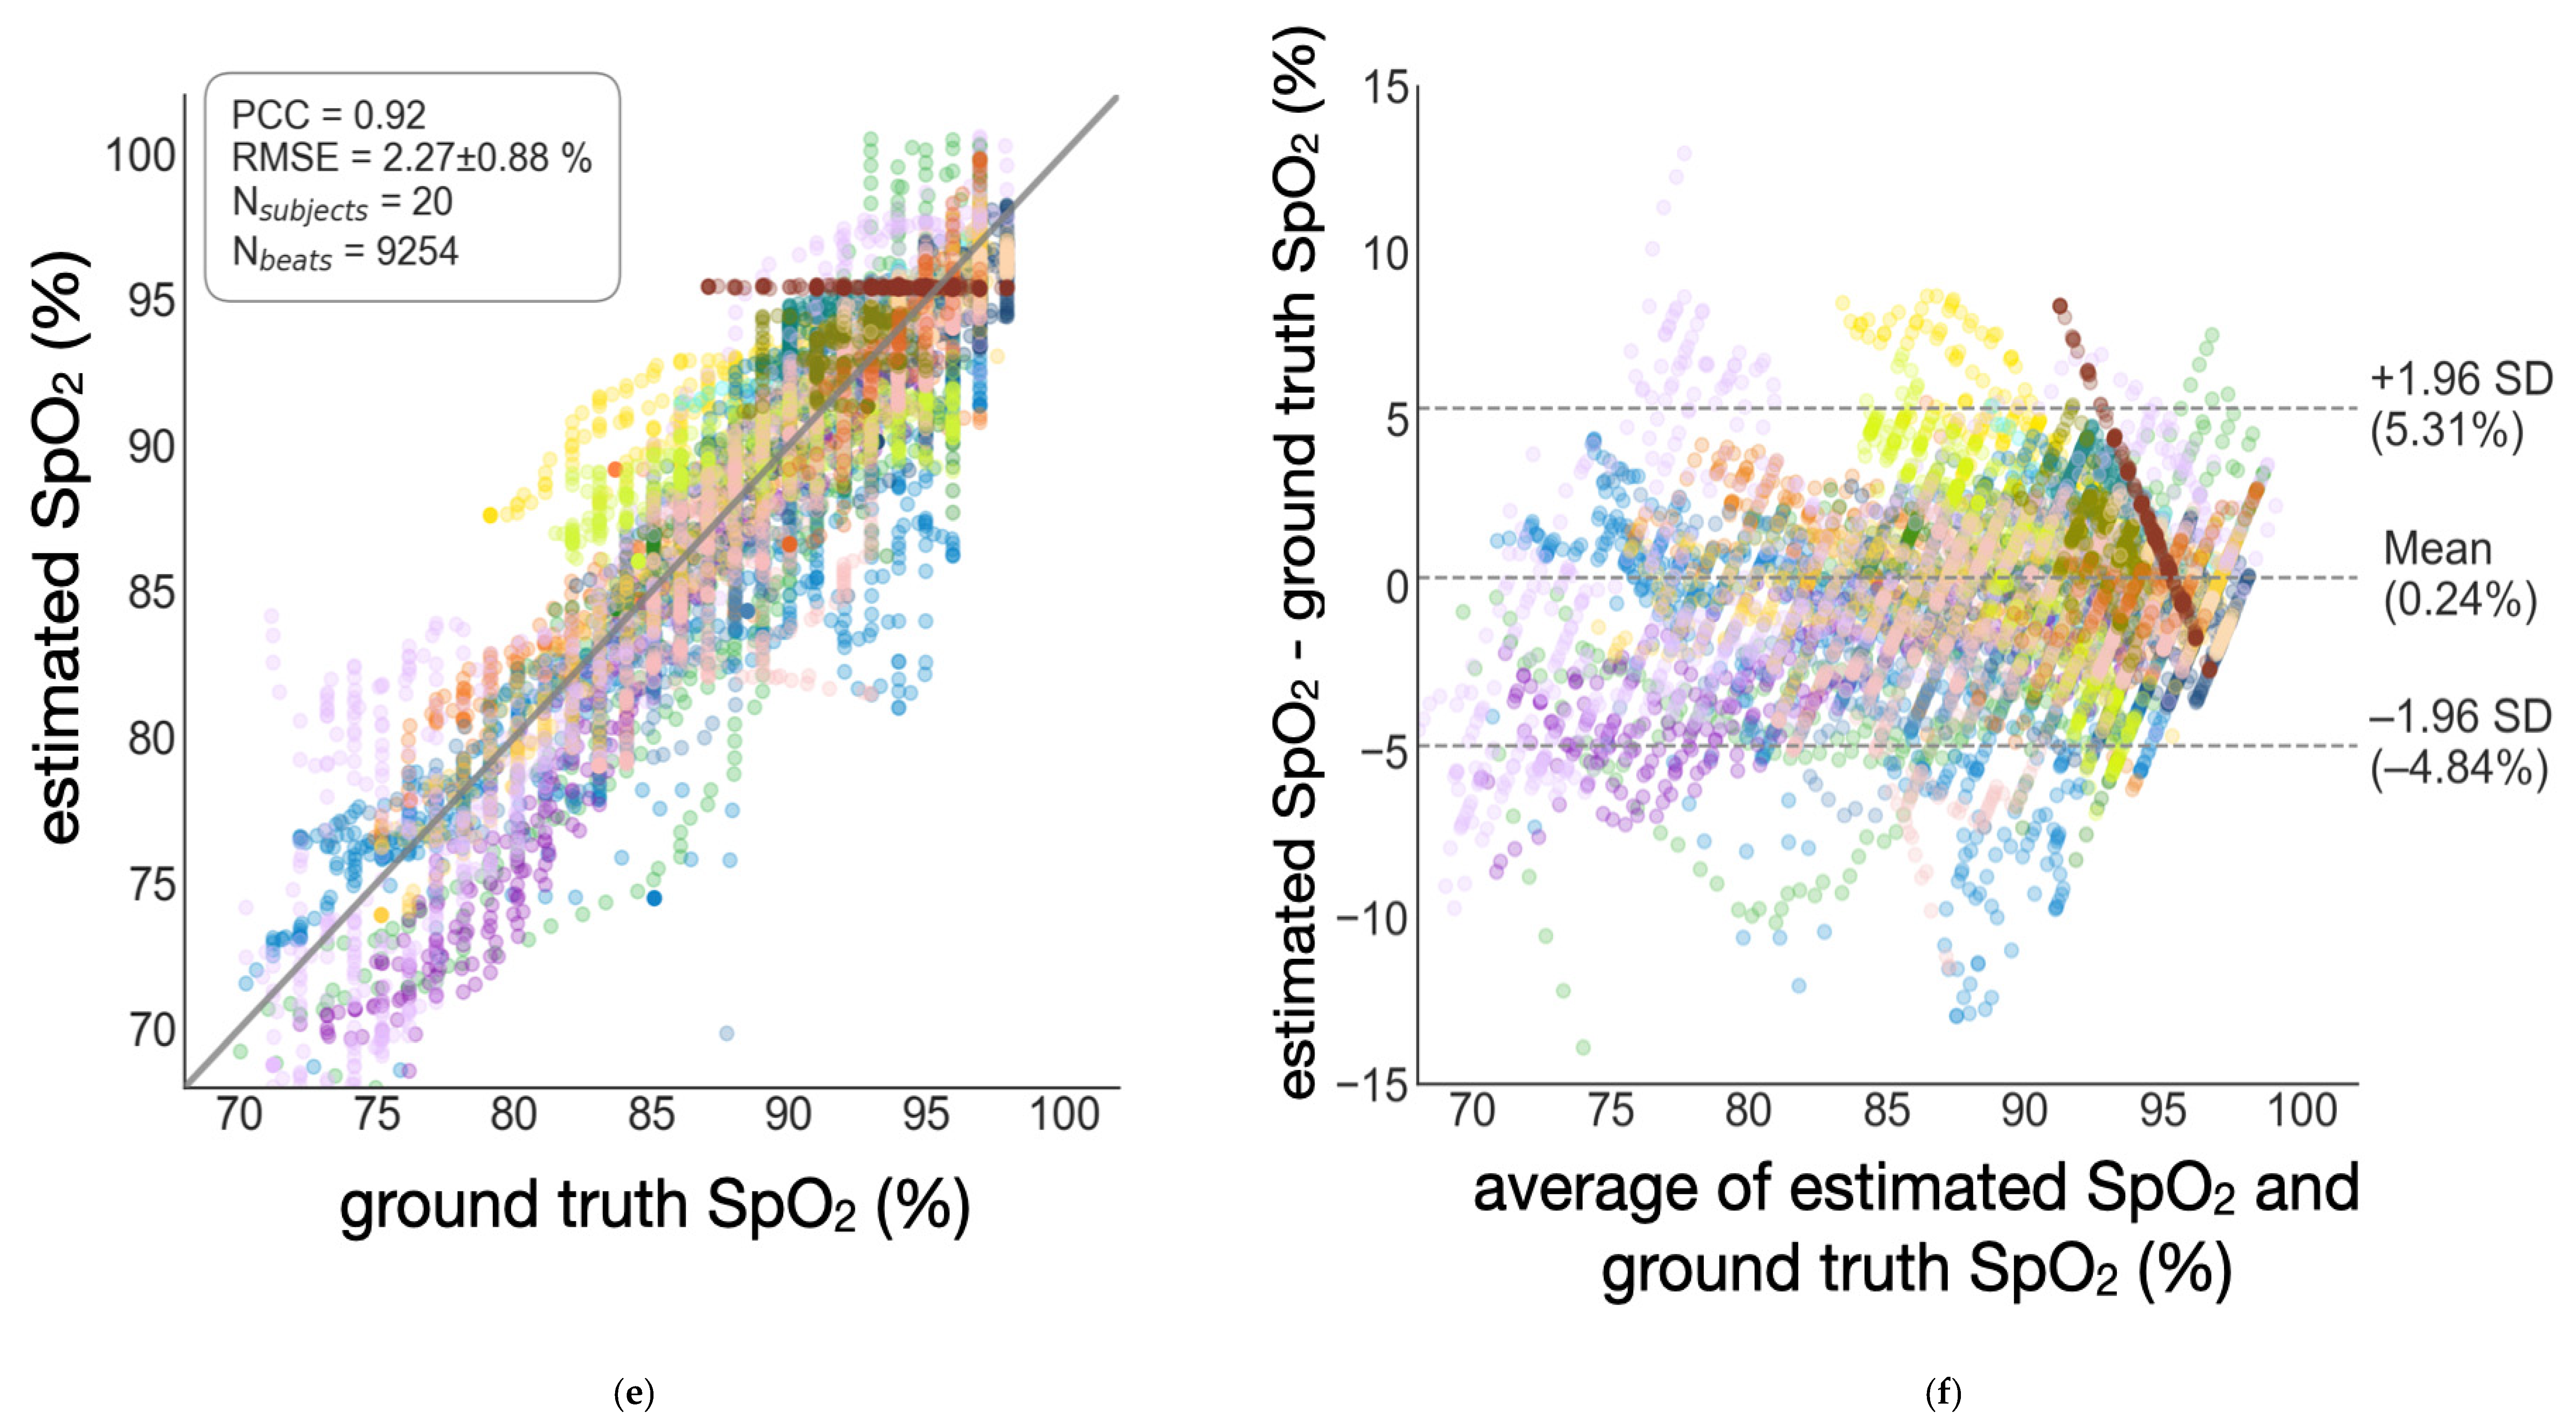
In Figure 6, regression plots and Bland–Altman plots are provided to demonstrate the estimation results. We also summarize the RMSEs across subjects, PCC, bias, and 95% limits of agreement (LOR) in Table 2. The globalized scheme achieves lowest accuracy (see Figure 6a,b). The semi-globalized scheme shows better accuracy (see Figure 6c,d). The subject-specific scheme achieves the best accuracy (see Figure 6e,f). Using the semi-globalized model, we were able to lower the mean RMSE by 0.36% and increase PCC by 0.02 when compared to the globalized model. The semi-globalized scheme and the subject-specific scheme have similar performance levels, both of which are superior to the globalized scheme. From the Bland–Altman plots, both models show minimal bias.

3.2. Semi-Globalized Scheme vs. Subject-Specific Scheme

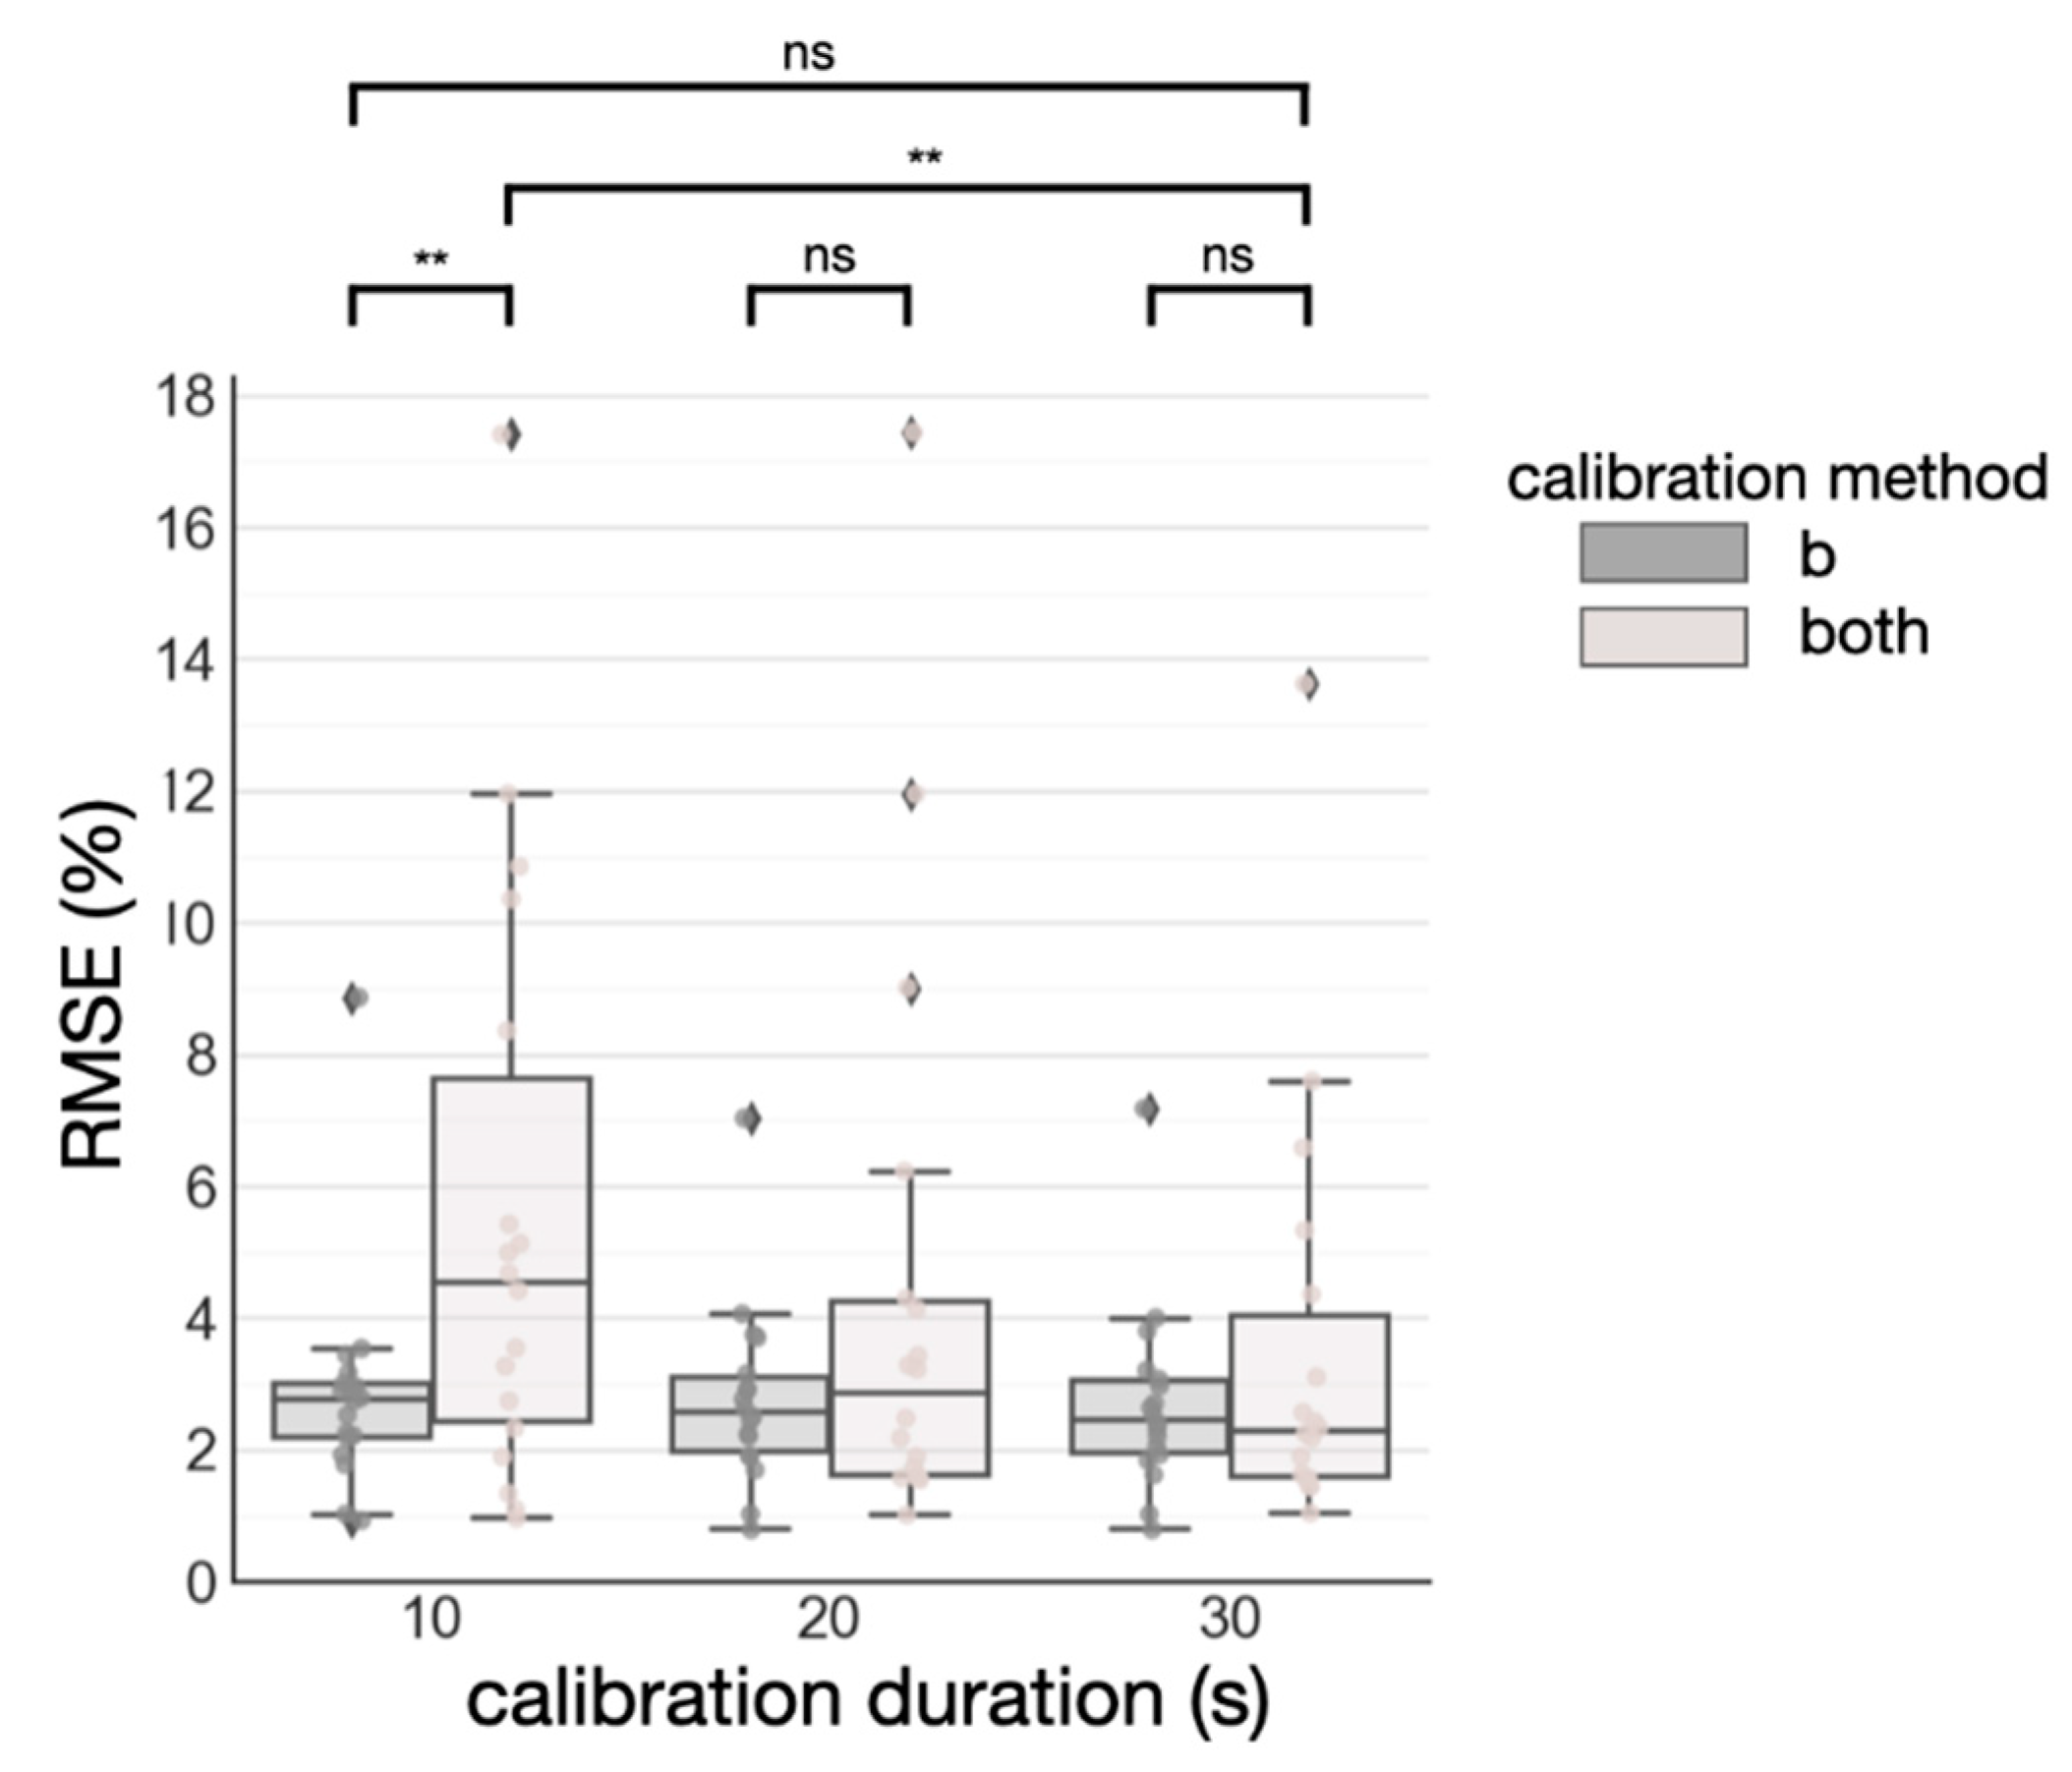
Since it has not been previously examined in the literature, we also studied which parameters benefit the most from subject-specific calibration. This is accomplished by comparing the semi-globalized scheme (i.e., calibrating b) to the subject-specific scheme (i.e., calibrating both m and b) while varying the calibration duration constraints. The duration constraint was imposed by considering data only within the said duration. Surprisingly, the semi-globalized model works more efficiently at reducing RMSE, as shown in Figure 7. Note 2 outlier subjects were excluded for better visualization. In all three duration constraints (10 s, 20 s, and 30 s), the semi-globalized schemes achieved a lower RMSE. When comparing the RMSE of calibrating b, constrained by a calibration duration of 10 s, to calibrating both parameters by a calibration duration of 30 s, we found no statistical significance (p > 0.05) as determined by a paired sample t-test. Therefore, we determined that the semi-globalized scheme is the best calibration strategy for this dataset as it would require a shorter duration to achieve similar performance to the subject-specific scheme.

3.3. Standardizing Subject-Specific Calibration: Duration vs. SpO2 Range

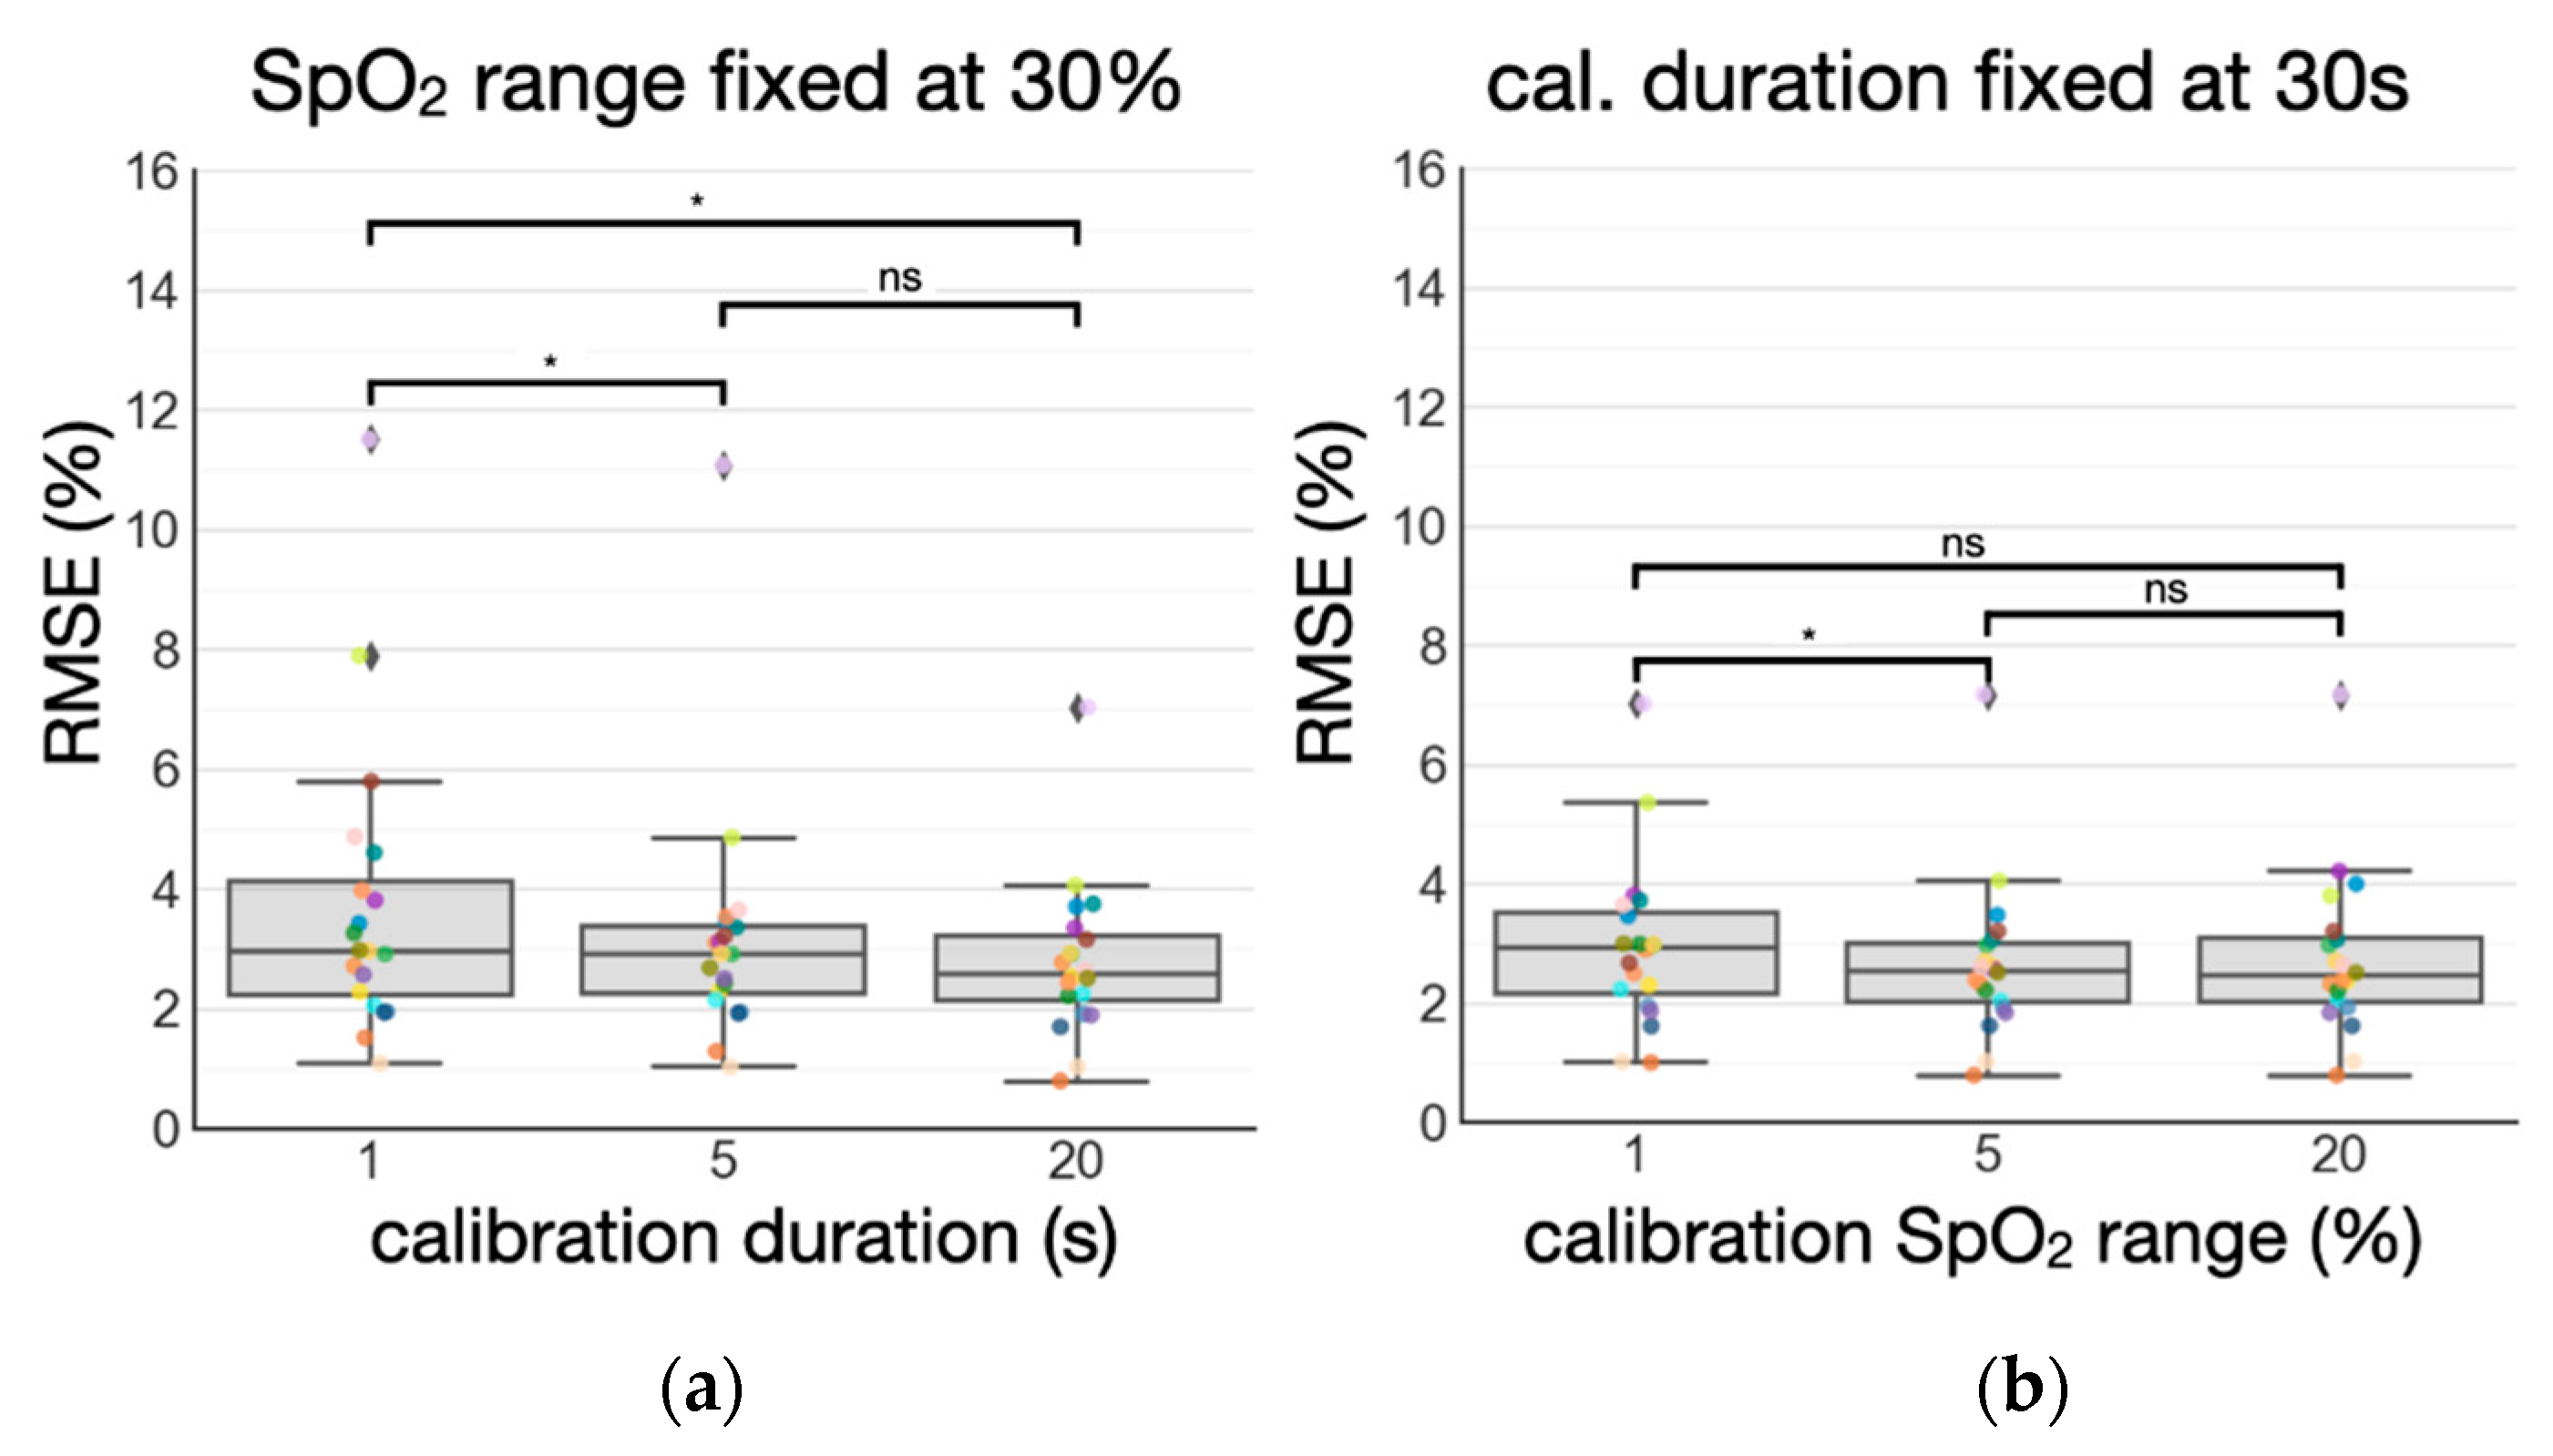
To study the most efficient way to collect data for calibration, we also examined the changes in RMSE by imposing different constraints on the calibration data, including a duration constraint and SpO2 range constraint. Similar to the duration constraint, the SpO2 range constraint considers data only within the said SpO2 range. According to the results shown in Figure 8a, we found that increasing calibration duration from 1 s to 20 s while fixing SpO2 range to 30% leads to significant (p < 0.05) reduction in mean RMSE across the subjects. On the other hand, the results shown in Figure 8b suggest that increasing the calibration SpO2 range from 1% to 20%, while fixing the duration to 30 s, did not lead to a significant (p > 0.05) difference in mean RMSE. Paired sample t-tests were used for the statistical analysis. Standardizing calibration duration appears to be the best calibration strategy here.

3.4. Effect of Varying Melanin Content

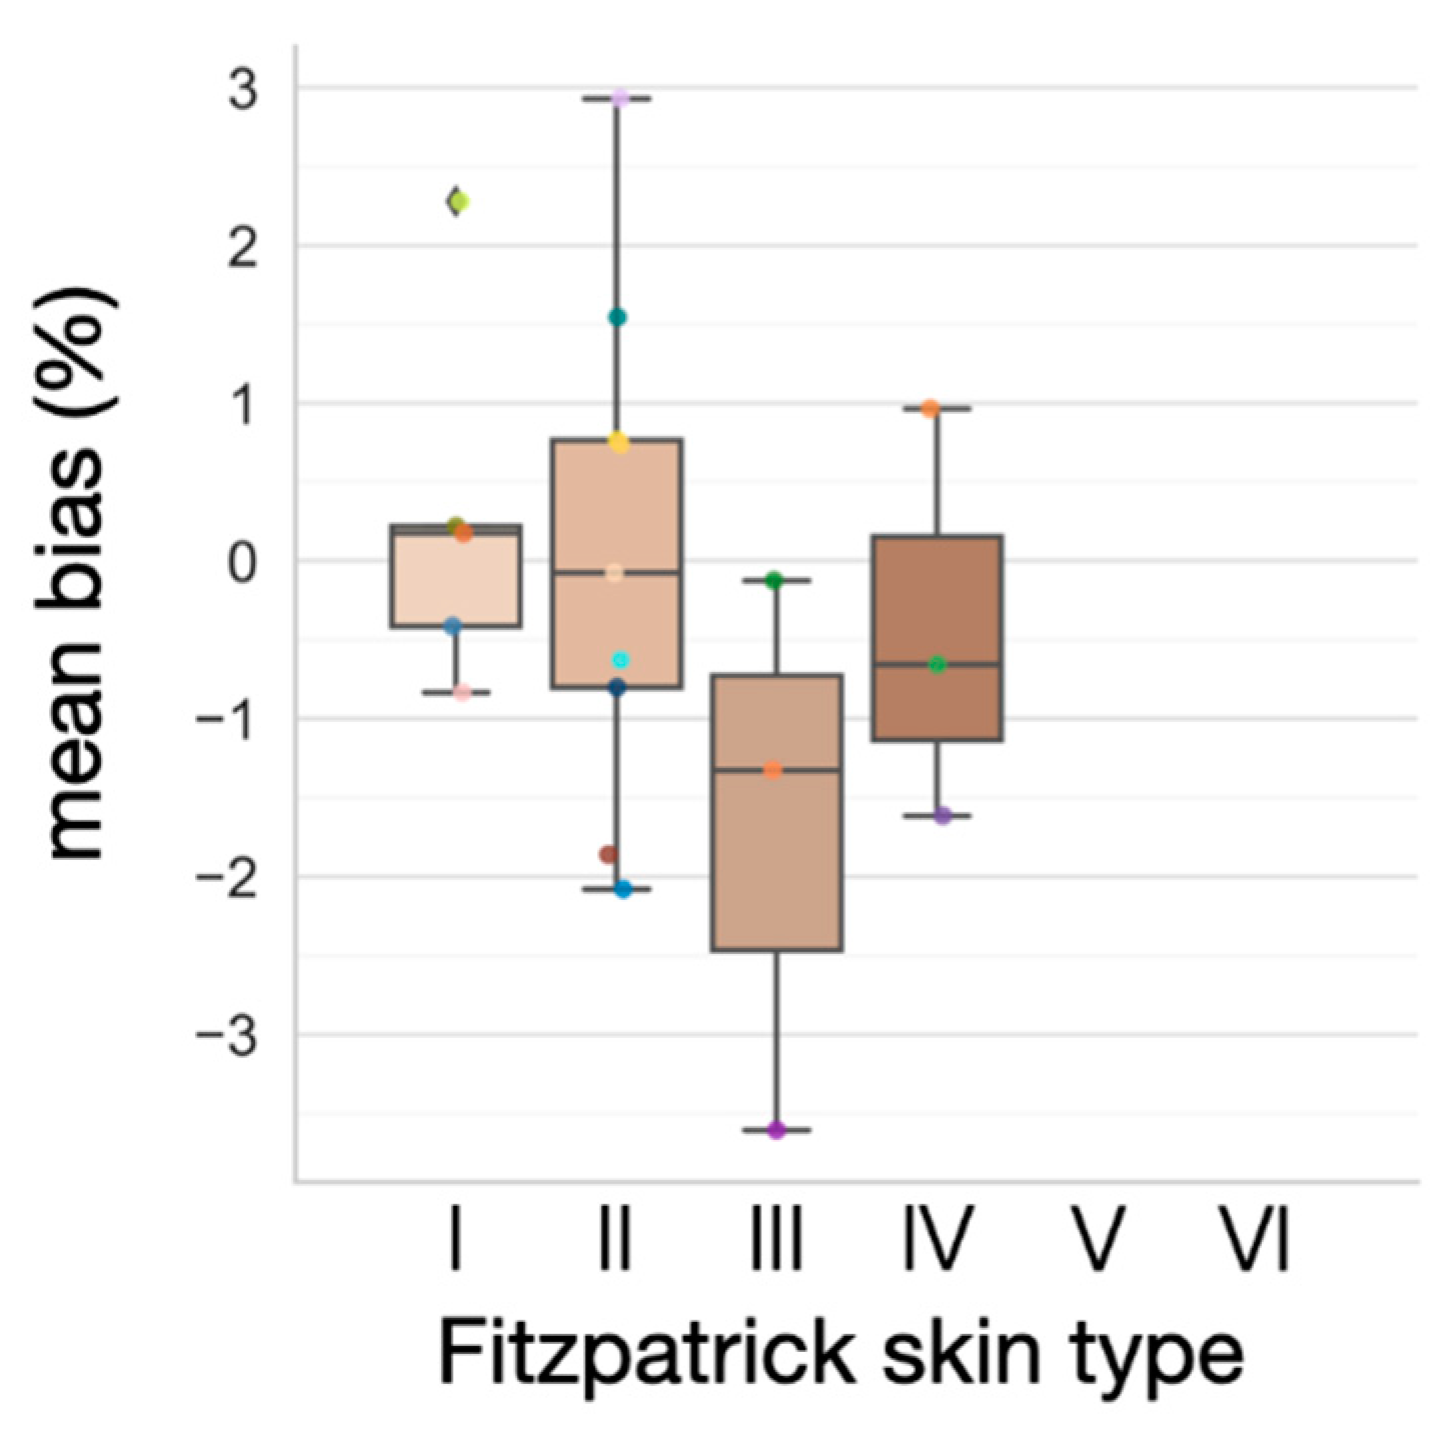
Since none of the subjects had nail polish on their right index finger or tattoos on their sternum, we only considered the confounding effect of the difference in melanin content. In this analysis, we assessed melanin levels using self-reported Fitzpatrick skin types [34] and studied the way melanin content affects the bias between finger and sternum SpO2. In Figure 9, the errors between different Fitzpatrick skin types are shown to be statistically insignificant (p > 0.05), using a one-way analysis of variance (ANOVA). This implies that our device does not introduce different bias for subjects with varying skin melanin content when compared to the finger pulse oximeter, understandably, as both operate on the same principles. However, it is worth noting that there are five subjects for skin type I, nine subjects for skin type II, three subjects for skin type III, three subjects for skin type IV, and zero subject for skin type V and VI. Due to the limited sample size and lack of data for the darkest Fitzpatrick skin types, the results attained here may not provide meaningful insight with a true accuracy of the proposed chest-based pulse oximetry on persons of all melanin levels. Note that in [35,36], it was reported that melanin content leads to SpO2 overestimation at low SaO2. Further investigation is required to study the way melanin content affects the accuracy of the chest-based pulse oximetry at various SaO2 levels.

4. Discussion

We unified previous evaluations of central-pulse oximetry and addressed relevant concerns while showing an accuracy that is comparable to the state-of-the-art [13]. To the best of our knowledge, this is the first thorough evaluation of chest-based pulse oximetry that jointly features a sufficient sample size, a wide dynamic range of SpO2, minimal respiratory artifacts, and rigorous cross validation to avoid data leakage. Furthermore, the study protocol, our alignment method, and key algorithmic components were described in full detail to allow for replication. This work paves the way for realizing the simultaneous monitoring of, in addition to SpO2, the cardiac, pulmonary, and cardiopulmonary functions using a small, standalone wearable patch device continuously and remotely, unlocking opportunities in personalized health intervention outside of a clinical setting.

4.1. Accurate SpO2 Estimation

We achieved low mean RMSEs for all training and calibration schemes, which were well within the criteria (RMSE ≤ 3.5%) for reflective pulse oximetry outlined by the FDA standard [16]. Our work addresses the challenges of the aforementioned approaches and estimated SpO2 accurately using a novel algorithm that proves to be robust, for PPG measured at this poorly perfused site. The breath-hold protocol successfully induced hypoxemia and reduced respiratory artifacts. Furthermore, the novel algorithms described in Section 2.4.2 to derive R leverage the morphological similarity between PPGred and PPGIR. Our method avoids peak and valley extraction for distorted PPG beat, and proves to be less susceptible to artifacts. The PPGgreen-based outlier rejection algorithm was inspired by the robustness of PPGgreen against motion artifacts [31]. Together, they alleviated difficulty in feature extraction for most PPG beats and excluded undesired PPG beats robustly.

4.2. Standardization of Subject-Specific Calibration

Besides accurate SpO2 measurements, we also designed experiments to identify the best training and calibration for this dataset for improving RMSE. More data points help to better calibrate the model to the test subject, and they do so by reducing the noise in the R extracted rather than capturing a wider SpO2 dynamic range, as evident from the results in Figure 6. Subject-specific calibration of b helps to reduce the randomness in the data. In contrast, if we were to calibrate m alone, we expect SpO2 range to have a more important role. Ultimately, we can benefit from both longer calibration duration and wider SpO2 range, but in a situation where hypoxemia is not preferred by the intended users, we have shown that limited SpO2 dynamic range with a sufficiently long calibration duration can still efficiently improve accuracy. This finding is beneficial for the usage of the device since it alleviates the need to induce changes in SpO2 and consequently makes the subject-specific calibrating procedure more practical and safer. Consequently, if necessary, breath-hold duration should be standardized instead of the SpO2 range.
When observing the data used to calibrate both m and b for test subjects, we noticed that the first breath-hold is consistently shorter across subjects. As a direct consequence, data of the first breath-hold generally does not have a wide SpO2 dynamic range. Furthermore, subjects seemed to be able to hold their breath longer due their adaptive tolerance to withstand the vaguely defined “discomfort” [37]. Since estimating the slope m requires a sufficient dynamic range of SpO2, calibrating m using just the first breath-hold is usually not enough. Using all 10 breath-holds and adequate SpO2 dynamic range across all training subjects offers a clear advantage to the globally trained m over the calibrated m. Hence, when the calibration data were limited (within the duration of one breath-hold), training m globally and calibrating b using the test subject’s data can achieve better accuracy.

4.3. Practical Use Case

The current manufacturing cost of the device is on the order of $200. However, producing this device on a large scale can reduce the cost substantially as components would be ordered in volume and manufacturing processes can be refined to improve manufacturability. We do not foresee any challenges with scalability as the devices manufactured so far show robust functionality. The practical subject-specific calibration procedure can be designed by aggregating the conclusions made thus far. We suggest a 15 s breath-hold during which the ground truth SpO2 and biosensor data are collected from a target subject. This breath-hold duration is selected because all breath-hold durations across the subjects in this study exceed 15 s. Using the data from the subjects analyzed in this study, we found the globally trained slope mglobal to be −21.54 and the intercept bglobal to be 106.69. Following the semi-globalized scheme, bglobal can be replaced by bsubject-specific, which was calibrated using data from the 15 s breath-hold of the target subject. The resulting subject-specific linear model takes the form of SpO2 = mglobal × R + bsubject-specific. One potential reason for calibration failure could be the adoption of smoking behavior. According to [38], smokers have elevated levels of carboxyhemoglobin (COHb). As a result, assumptions (i.e., the only hemoglobin species in the arteries are Hb and HbO2) made in Equation (2) are violated, which can subsequently lead to the overestimation of SpO2.

4.4. Limitations

One key limitation is that we only validated the accuracy of our pulse oximetry during segments with minimal respiratory artifacts. Kramer et al. [13] previously reported high accuracy from subjects undergoing spontaneous breathing despite a lack of details of their algorithm. Future work should investigate whether our proposed ACred/IR extraction and PPGgreen outlier rejection algorithm can withstand respiratory artifacts more severe than the involuntary respiratory movements during breath-hold and attain similar accuracy. In addition, we noticed that the deoxygenation dynamics of R still may not be perfectly aligned to those in SpO2, even after precise alignment. Our alignment method assumed that the delay between the start of breath-hold and chest SaO2 deoxygenation is distributed across the integer values in the interval [−10, 10], as described in Appendix A. However, the delay may exceed beyond this, and therefore it is likely that we still captured an undesired delay for some subjects. Specifically, inter-subject and intra-subject variability in this delay may directly translate to variability in the estimated b, which explains the importance of calibrating b. For example, consider the case where the error in alignment is 1 s in a breath-hold of a subject. The desaturation rate, of around 0.26% per second, can be roughly estimated from Figure 3. The 1 s error in alignment can lead to a difference of 0.26% for all datapoints of that breath-hold, and therefore, systematically introduces a bias. Besides this bias, the breath-hold study method may also lead to another shortcoming. The SpO2 at different measurement sites may not map to one another completely, even if the delay has been accounted for [5]. This is understandable because the sternum and finger have different tissue and vascularization compositions and therefore deliver and consume oxygen at different rates as well. Finally, similar to most commercial finger pulse oximeters, the chest-based pulse oximetry may suffer from motion artifacts, the presence of HbCO and HbMET, venous pulsation [39], etc. However, we expect to considerably improve RMSE further if we can induce deoxygenation slowly and compare the estimation when using the validation protocol suggested by the FDA [16] and show improved accuracy of biosensor’s measurements despite the above limitation.

4.5. Future Work

The results and techniques demonstrated in this work allow for the accurate measurements of SpO2, which can in turn be used to better inform underlying pulmonary dysfunctions unobtrusively, continuously, and remotely. Together, with its ability to measure cardiac function, we can next validate the wearable patch biosensor for its ability to quantitatively and objectively assess disease progression of cardiovascular and pulmonary diseases such as COVID-19, nocturnal hypoxia caused by sleep apnea, and high-altitude sickness. Ultimately, tracking these health parameters may provide a better understanding of the cardiopulmonary-related comorbidities and consequently facilitate the adoption of longitudinal wearable monitoring devices, for detecting underlying disease when symptoms are subtle and unnoticeable.

5. Conclusions

Here, we demonstrated that our custom, chest-worn wearable patch biosensor was capable of accurately estimating SpO2 while subjects underwent a 10 breath-hold protocol. We presented that standardizing the calibration duration, rather than calibration range, was the most important factor for optimal calibration. Finally, we found that differences in Fitzpatrick skin types do not introduce disparities in bias. Future studies will focus on improving the study protocol to induce gradual changes in SaO2 as per the FDA guidelines, while measuring gold standard SaO2 simultaneously through a co-oximetry of arterial blood samples [16], designing algorithms that mitigate respiratory artifacts when present, and by recruiting a larger population that is demographically diverse, especially participants with higher Fitzpatrick skin types. Together with its holistic cardiac monitoring, this device can provide longitudinal and quantitative information of disease progression in both cardiovascular and pulmonary diseases.

Author Contributions

Conceptualization, M.C., V.G.G. and O.T.I.; data curation, M.C.; methodology, M.C.; validation, M.C.; formal analysis, M.C.; investigation, M.C. and C.A.A.; resources, O.T.I. and M.E.; data curation, M.C.; writing—original draft preparation, M.C.; writing—review and editing, M.C., V.G.G., J.A.H., C.A.A., M.E. and O.T.I.; visualization, M.C. and V.G.G.; Software, M.C., V.G.G. and J.A.H.; supervision, O.T.I.; project administration, M.C.; funding acquisition, O.T.I. and M.E. All authors have read and agreed to the published version of the manuscript.

Funding

This work was funded by the Centers for Disease and Control and Prevention (CDC), under contract number 75D30120C09558.

Institutional Review Board Statement

The study was conducted according to the protocol approved by the Georgia Institute of Technology Institutional Review Board (H21100, approved on 30 April 2021).

Informed Consent Statement

Informed consent was obtained from all subjects involved in the study.

Data Availability Statement

The data presented in this study are available on request from the corresponding author. The data are not publicly available due to them containing information that may compromise the privacy of the research subjects.

Conflicts of Interest

O.T.I. is a Scientific Advisor to Physiowave, Inc., and Co-founder and Chief Scientific Advisor for Cardiosense, Inc. M.E. is also the Co-founder and Chief Technical Advisor for Cardiosense, Inc. J.A.H. is the Co-founder and Hardware Lead for Cardiosense, Inc. The funders had no role in the design of the study; in the collection, analyses or interpretation of the data; in the writing of the manuscript; or in the decision to publish the results.

Appendix A

The manually aligned R and SpO2 samples are still susceptible to delay due to lack of ground truth SaO2 data at the chest. To further reduce alignment error, we used a greedy algorithm to find the delay that will minimize the alignment error. Specifically, we first used all R and SpO2rough, which represent the SpO2 roughly aligned using the manual label, to train the parameters of the linear model described in Equation (10). Next, we used the trained linear model estimate SpO2, SpO 2 ^ , from the samples of R. An RMSE is computed between SpO2rough and SpO 2 ^ of each breath-hold of each subject. Next, we evaluated the RMSE between SpO2rough, t, which represent the SpO2 roughly aligned using the manual label with a delay of t seconds and SpO 2 ^ . Note that t ranges from [−10, 10] seconds with a 1 s interval. Finally, SpO2precise, SpO2 more precisely aligned for each breath-hold of each subject was found using,
SpO 2 precise = argmin SpO 2 rough ,   t   SpO 2 SpO 2 rough ,   t 2 2
The same optimization method was repeated for all breath-holds of all subjects to complete the precise alignment procedure.

References

  1. Pimentel, M.A.F.; Redfern, O.C.; Hatch, R.; Young, J.D.; Tarassenko, L.; Watkinson, P.J. Trajectories of Vital Signs in Patients with COVID-19. Resuscitation 2020, 156, 99–106. [Google Scholar] [CrossRef]
  2. Shah, S.; Majmudar, K.; Stein, A.; Gupta, N.; Suppes, S.; Karamanis, M.; Capannari, J.; Sethi, S.; Patte, C. Novel Use of Home Pulse Oximetry Monitoring in COVID-19 Patients Discharged from the Emergency Department Identifies Need for Hospitalization. Acad. Emerg. Med. 2020, 27, 681–692. [Google Scholar] [CrossRef]
  3. Longmore, S.K.; Lui, G.Y.; Naik, G.; Breen, P.P.; Jalaludin, B.; Gargiulo, G.D. A Comparison of Reflective Photoplethysmography for Detection of Heart Rate, Blood Oxygen Saturation, and Respiration Rate at Various Anatomical Locations. Sensors 2019, 19, 1874. [Google Scholar] [CrossRef] [PubMed] [Green Version]
  4. Davies, H.J.; Williams, I.; Peters, N.S.; Mandic, D.P. In-Ear SpO2: A Tool for Wearable, Unobtrusive Monitoring of Core Blood Oxygen Saturation. Sensors 2020, 20, 4879. [Google Scholar] [CrossRef] [PubMed]
  5. Sugino, S.; Kanaya, N.; Mizuuchi, M.; Nakayama, M.; Namiki, A. Forehead Is as Sensitive as Finger Pulse Oximetry during General Anesthesia. Can. J. Anesth. 2004, 51, 432–436. [Google Scholar] [CrossRef] [Green Version]
  6. Bouten, J.; Bourgois, J.G.; Boone, J. Hold Your Breath: Peripheral and Cerebral Oxygenation during Dry Static Apnea. Eur. J. Appl. Physiol. 2020, 120, 2213–2222. [Google Scholar] [CrossRef]
  7. Inan, O.T.; Pouyan, M.B.; Javaid, A.Q.; Dowling, S.; Etemadi, M.; Dorier, A.; Heller, J.A.; Bicen, A.O.; Roy, S.; De Marco, T.; et al. Novel Wearable Seismocardiography and Machine Learning Algorithms Can Assess Clinical Status of Heart Failure Patients. Circ.-Heart. Fail. 2018, 11, e004313. [Google Scholar] [CrossRef]
  8. Semiz, B.; Carek, A.M.; Johnson, J.C.; Ahmad, S.; Heller, J.A.; Garcia-Vicente, F.G.; Caron, S.; Hogue, C.W.; Etemadi, M.; Inan, O. Non-Invasive Wearable Patch Utilizing Seismocardiography for Peri-Operative Use in Surgical Patients. IEEE J. Biomed. Health Inform. 2021, 25, 1572–1582. [Google Scholar] [CrossRef] [PubMed]
  9. Aydemir, V.B.; Nagesh, S.; Shandhi, M.M.H.; Fan, J.; Klein, L.; Etemadi, M.; Heller, J.A.; Inan, O.T.; Rehg, J.M. Classification of Decompensated Heart Failure From Clinical and Home Ballistocardiography. IEEE Trans. Bio-Med. Eng. 2020, 67, 1303–1313. [Google Scholar] [CrossRef]
  10. Shandhi, M.M.H.; Bartlett, W.H.; Heller, J.A.; Etemadi, M.; Young, A.; Plötz, T.; Inan, O.T. Estimation of Instantaneous Oxygen Uptake During Exercise and Daily Activities Using a Wearable Cardio-Electromechanical and Environmental Sensor. IEEE J. Biomed. Health Inform. 2021, 25, 634–646. [Google Scholar] [CrossRef]
  11. Schreiner, C.; Catherwood, P.; Anderson, J.; McLaughlin, J. Blood Oxygen Level Measurement with a Chest-Based Pulse Oximetry Prototype System. In Proceedings of the Computing in Cardiology, Belfast, UK, 26–29 September 2010; pp. 537–540. [Google Scholar]
  12. AKiruthiga, A.; Alex, A.; Balamugesh, T.; Prabhu, D.; Christopher, D.J.; Preejith, S.P.; Joseph, J.; Sivaprakasam, M. Reflectance Pulse Oximetry for Blood Oxygen Saturation Measurement from Diverse Locations-A Preliminary Analysis. In Proceedings of the 2018 IEEE International Symposium on Medical Measurements and Applications (MeMeA), Rome, Italy, 11–13 June 2018; pp. 1–6. [Google Scholar]
  13. Kramer, M.; Lobbestael, A.; Barten, E.; Eian, J.; Rausch, G. Wearable Pulse Oximetry Measurements on the Torso, Arms, and Legs: A Proof of Concept. Mil. Med. 2017, 182, 92–98. [Google Scholar] [CrossRef] [Green Version]
  14. Vetter, R.; Rossini, L.; Ridolfi, A.; Sola, J.; Chetelat, O.; Correvon, M.; Krauss, J. Frequency Domain SpO2 Estimation Based on Multichannel Photoplethysmographic Measurements at the Sternum. In Proceedings of the World Congress on Medical Physics and Biomedical Engineering, Munich, Germany, 7–12 September 2009; pp. 326–329, ISBN 978-3-642-03881-5. [Google Scholar]
  15. Näslund, E.; Lindberg, L.-G.; Lund, I.; Näslund-Koch, L.; Larsson, A.; Frithiof, R. Measuring Arterial Oxygen Saturation from an Intraosseous Photoplethysmographic Signal Derived from the Sternum. J. Clin. Monit. Comput. 2020, 34, 55–62. [Google Scholar] [CrossRef] [Green Version]
  16. Pulse Oximeters—Premarket Notification Submissions [510(k)s] Guidance for Industry and Food and Drug Administration Staff. Available online: https://www.fda.gov/regulatory-information/search-fda-guidance-documents/pulse-oximeters-premarket-notification-submissions-510ks-guidance-industry-and-food-and-drug (accessed on 12 December 2021).
  17. King, P.H. Design Of Pulse Oximeters. IEEE Eng. Med. Biol. 1998, 17, 117. [Google Scholar] [CrossRef]
  18. Arnold, M. The Surgical Anatomy of Sternal Blood Supply. J. Thorac. Cardiovasc. Surg. 1972, 64, 596–610. [Google Scholar] [CrossRef]
  19. Andersson, J.; Schagatay, E. Effects of Lung Volume and Involuntary Breathing Movements on the Human Diving Response. Eur. J. Appl. Physiol. 1997, 77, 19–24. [Google Scholar] [CrossRef] [PubMed]
  20. Reisner, A.; Shaltis, P.A.; McCombie, D.; Asada, H.H.; Warner, D.S.; Warner, M.A. Utility of the Photoplethysmogram in Circulatory Monitoring. Anesthesiology 2008, 108, 950–958. [Google Scholar] [CrossRef] [PubMed] [Green Version]
  21. Vijayarangan, S.; Suresh, P.; SP, P.; Joseph, J.; Sivaprakasam, M. Proceedings of Robust Modelling of Reflectance Pulse Oximetry for SpO2 Estimation. In Proceedings of the 2020 42nd Annual International Conference of the IEEE Engineering in Medicine Biology Society (EMBC), Montreal, QC, Canada, 20–24 July 2020; pp. 374–377. [Google Scholar]
  22. Priem, G.; Martinez, C.; Bodinier, Q.; Carrault, G. Clinical Grade SpO2 Prediction through Semi-Supervised Learning. In Proceedings of the 2020 IEEE 20th International Conference on Bioinformatics and Bioengineering (BIBE), Cincinnati, OH, USA, 26–28 October 2020; pp. 914–921. [Google Scholar]
  23. Ganti, V.; Carek, A.M.; Jung, H.; Srivatsa, A.V.; Cherry, D.; Johnson, L.N.; Inan, O.T. Enabling Wearable Pulse Transit Time-Based Blood Pressure Estimation for Medically Underserved Areas and Health Equity: Comprehensive Evaluation Study. JMIR mHealth uHealth 2021, 9, e27466. [Google Scholar] [CrossRef] [PubMed]
  24. Reynolds, L.M.; Nicolson, S.C.; Steven, J.M.; Escobar, A.; McGonigle, M.E.; Jobes, D.R. Influence of Sensor Site Location on Pulse Oximetry Kinetics in Children. Anesth. Analg. 1993, 76, 751–754. [Google Scholar] [CrossRef]
  25. Pan, J.; Tompkins, W.J. A Real-Time QRS Detection Algorithm. IEEE Trans. Biomed. Eng. 1985, 32, 230–236. [Google Scholar] [CrossRef]
  26. Tanveejul, A.P.M.; Alex, A.; Preejith, S.P.; Christopher, D.J.; Chandy, S.; Joseph, J.; Sivaprakasam, M. A Study on the Subject and Location Specificity in Reflectance Based SpO2 Estimation Using R-Value Based Calibration Curve. In Proceedings of the 2020 IEEE International Symposium on Medical Measurements and Applications (MeMeA), Bari, Italy, 1 June–1 July 2020; pp. 1–6. [Google Scholar]
  27. Leys, C.; Ley, C.; Klein, O.; Bernard, P.; Licata, L. Detecting Outliers: Do Not Use Standard Deviation around the Mean, Use Absolute Deviation around the Median. J. Exp. Soc. Psychol. 2013, 49, 764–766. [Google Scholar] [CrossRef] [Green Version]
  28. Andersson, J.P.A.; Linér, M.H.; Rünow, E.; Schagatay, E.K.A. Diving Response and Arterial Oxygen Saturation during Apnea and Exercise in Breath-Hold Divers. J. Appl. Physiol. 2002, 93, 882–886. [Google Scholar] [CrossRef] [PubMed] [Green Version]
  29. Andersson, J.; Schagatay, E. Arterial Oxygen Desaturation during Apnea in Humans. Undersea Hyperb. Med. 1998, 25, 21–25. [Google Scholar] [PubMed]
  30. Stewart, I.B.; Bulmer, A.C.; Sharman, J.E.; Ridgway, L. Arterial Oxygen Desaturation Kinetics during Apnea. Med. Sci. Sports Exerc. 2005, 37, 1871–1876. [Google Scholar] [CrossRef]
  31. Matsumura, K.; Toda, S.; Kato, Y. RGB and Near-Infrared Light Reflectance/Transmittance Photoplethysmography for Measuring Heart Rate during Motion. IEEE Access 2020, 8, 80233–80242. [Google Scholar] [CrossRef]
  32. Krasteva, V.; Jekova, I. QRS Template Matching for Recognition of Ventricular Ectopic Beats. Ann. Biomed. Eng. 2007, 35, 2065–2076. [Google Scholar] [CrossRef]
  33. Ganti, V.G.; Carek, A.; Nevius, B.N.; Heller, J.; Etemadi, M.; Inan, O. Wearable Cuff-Less Blood Pressure Estimation at Home via Pulse Transit Time. IEEE J. Biomed. Health Inform. 2021, 25, 1926–1937. [Google Scholar] [CrossRef]
  34. Fitzpatrick, T.B. The Validity and Practicality of Sun-Reactive Skin Types I Through VI. Arch. Dermatol. 1988, 124, 869–871. [Google Scholar] [CrossRef] [PubMed]
  35. Feiner, J.R.; Severinghaus, J.W.; Bickler, P.E. Dark Skin Decreases the Accuracy of Pulse Oximeters at Low Oxygen Saturation: The Effects of Oximeter Probe Type and Gender. Anesth. Analg. 2007, 105, S18–S23. [Google Scholar] [CrossRef] [Green Version]
  36. Bickler, P.E. Effects of Skin Pigmentation on Pulse Oximeter Accuracy at Low Saturation. J. Am. Soc. Anesthesiol. 2005, 102, 715–719. [Google Scholar] [CrossRef]
  37. Parkes, M.J. Breath-Holding and Its Breakpoint. Exp. Physiol. 2006, 91, 1–15. [Google Scholar] [CrossRef]
  38. Glass, K.L.; Dillard, T.A.; Phillips, Y.Y.; Torrington, K.G.; Thompson, J.C. Pulse Oximetry Correction for Smoking Exposure. Mil. Med. 1996, 161, 273–276. [Google Scholar] [CrossRef] [PubMed] [Green Version]
  39. Chan, E.D.; Chan, M.M.; Chan, M.M. Pulse Oximetry: Understanding Its Basic Principles Facilitates Appreciation of Its Limitations. Respir. Med. 2013, 107, 789–799. [Google Scholar] [CrossRef] [PubMed] [Green Version]
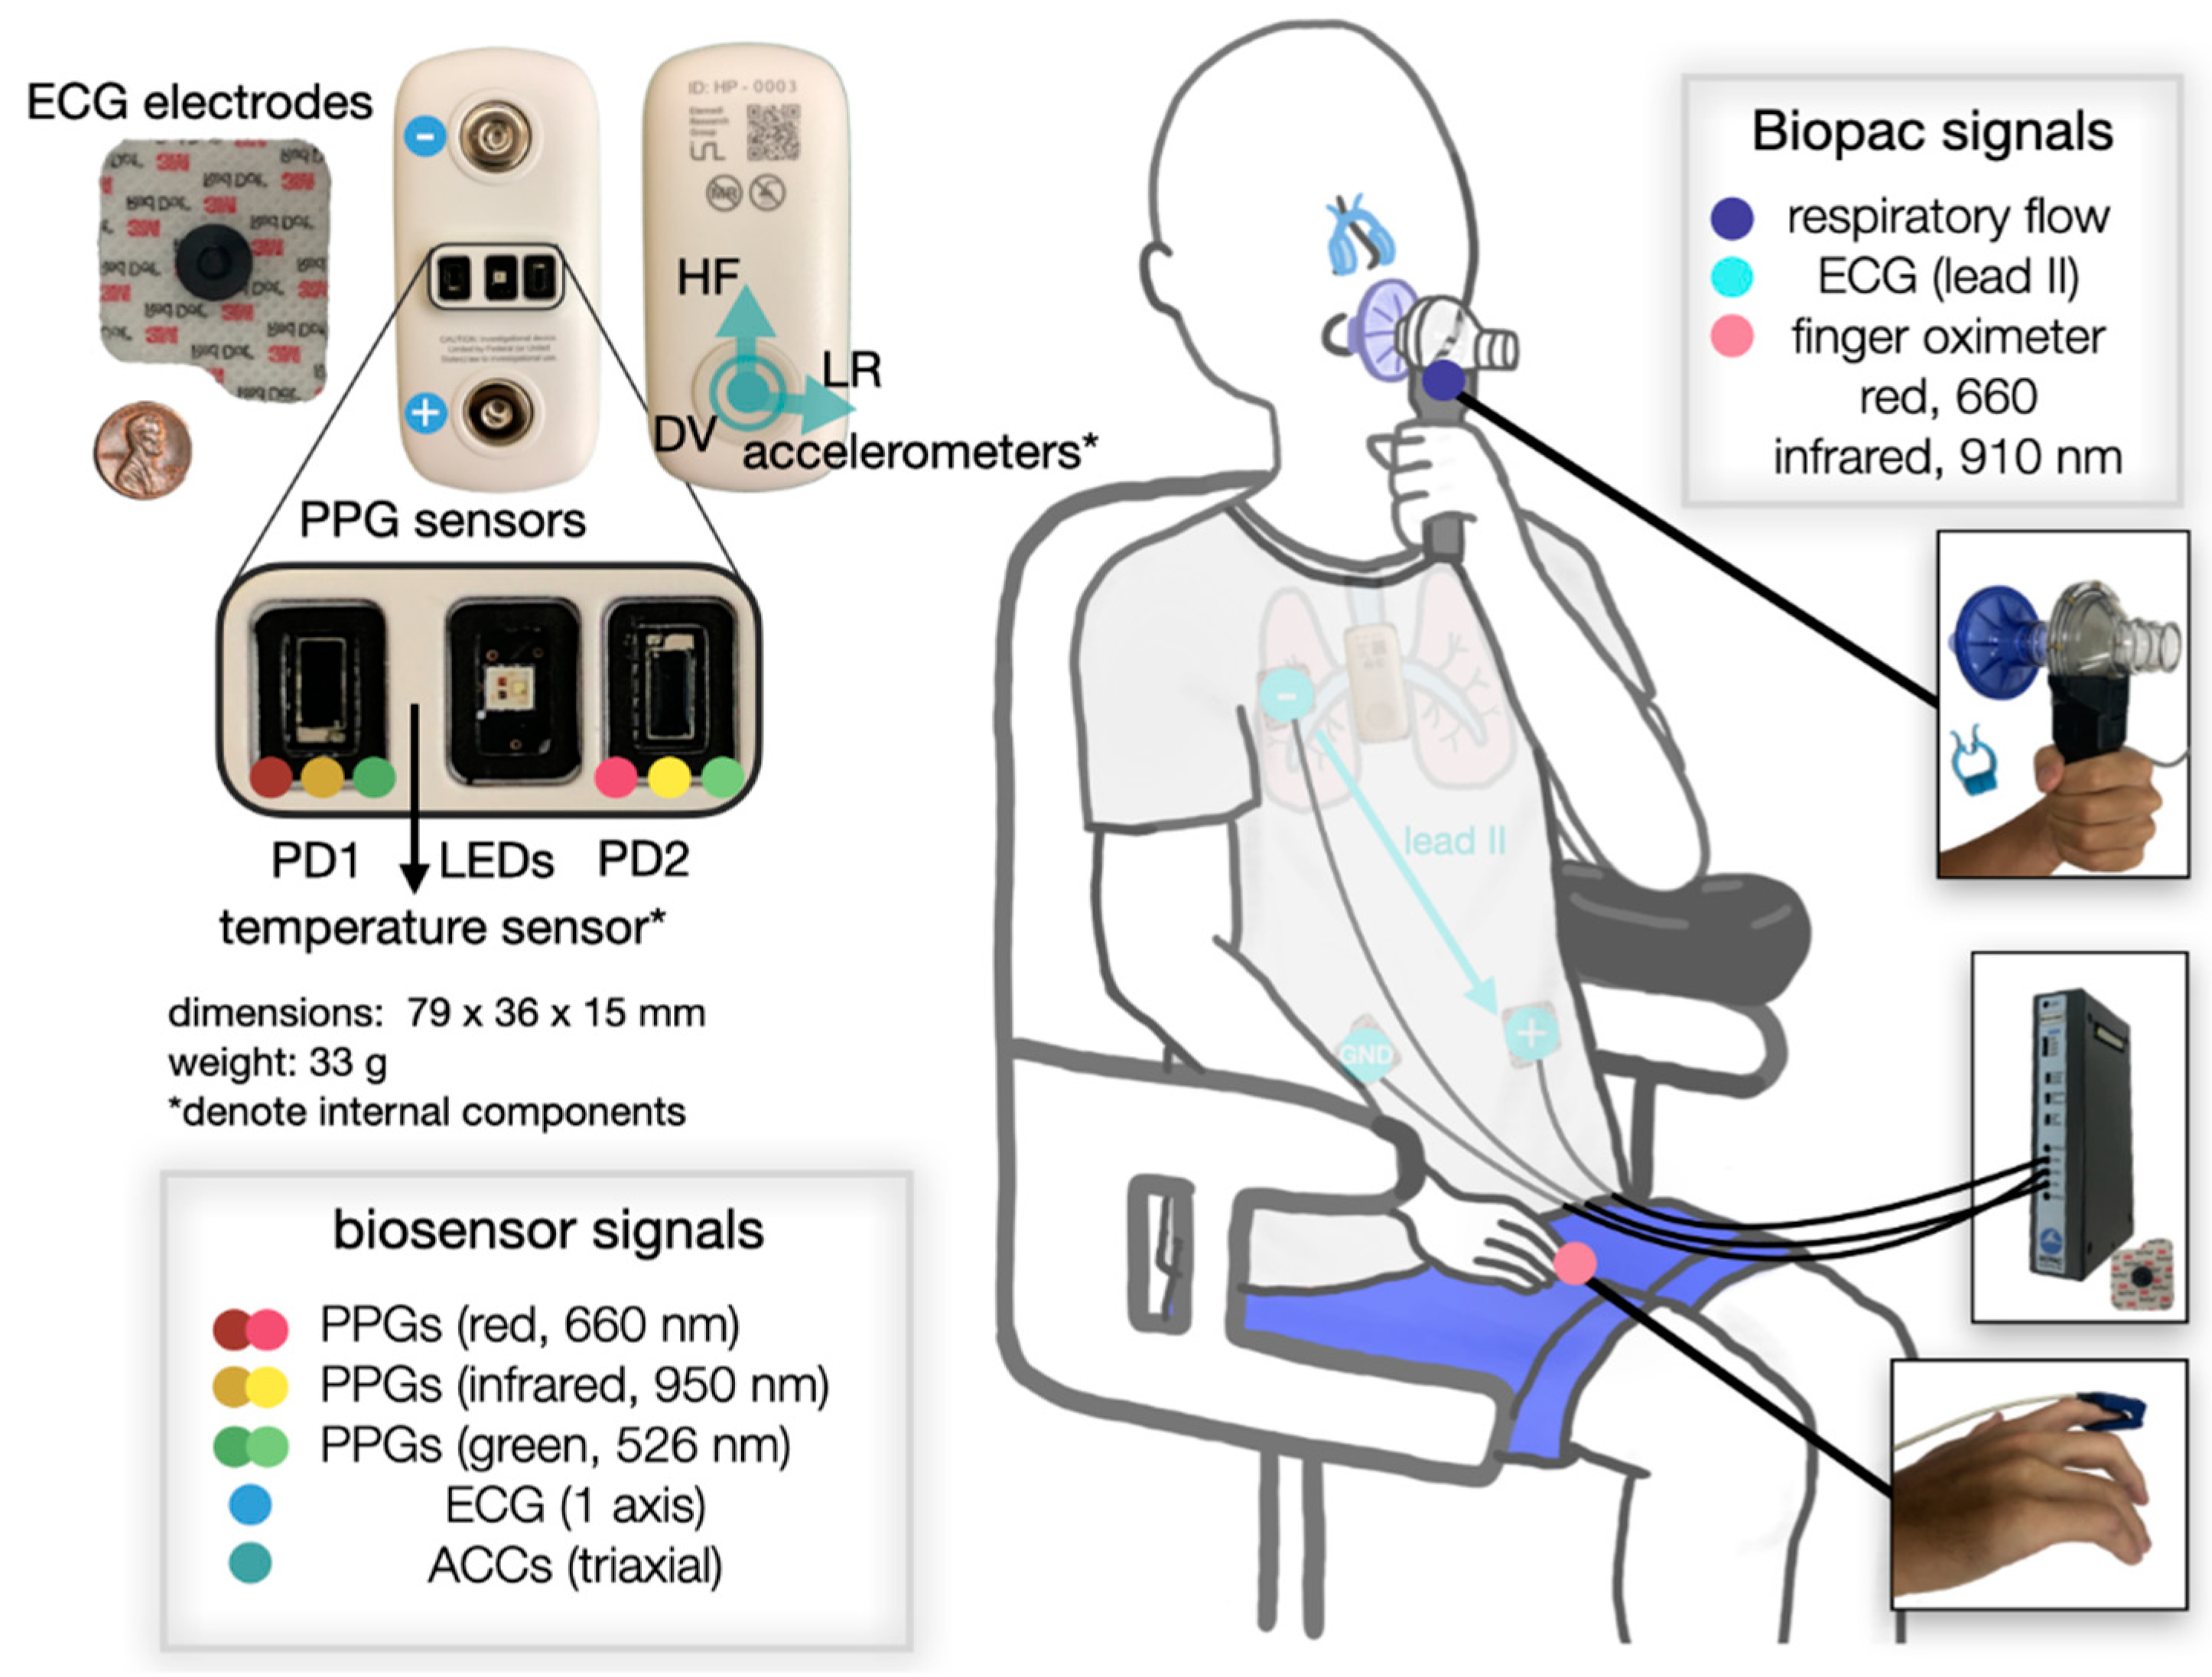
Figure 1. Illustration of a subject undergoing the breath-hold study. Placements of the wearable patch biosensor (left side) and the ground truth Biopac sensors (right side) are depicted. The relative size of the biosensor is shown with an off-the-shelf ECG electrode and a penny. Note that the photodiode (PD) has an area of 4.5 mm2. PD1 is on the left side and PD2 is on the right side of the subject.
Biosensors 11 00521 g001
Figure 2. From the frontal view, the wearable patch biosensor is attached to the sternum of the subject using ECG electrodes. The superior end of the device starts approximately two fingers down from the suprasternal notch. From the lateral view, the protruded part of the device that houses the LEDs and PDs is visible. Note that light is hardly visible from the sides of the device.
Biosensors 11 00521 g002
Figure 3. Biopac and biosensor signals during the fourth breath-hold (BH, blue) and during normal breathing (pink). A 5 s window during breath-hold is shown to illustrate the quality of the signals.
Biosensors 11 00521 g003
Figure 4. Feature extraction block diagrams. (a) Overview of the signal preprocessing and manual labeling pipeline. Extracted pairs of ratio of ratios (R) and SpO2 were used for training and calibration of the model. Ti,j denotes the delay found between R and SpO2 for the jth breath-hold of subject i. The aligned data were displayed in the upper right scatter plot. The distribution of R and SpO2 are also shown above and on the right of the scatter plot, respectively. IBImean denotes the mean of the interbeat intervals (IBI) of a subject. (b) The block diagram for PPG beats segmentation, ACred/IR extraction, DC feature extraction, and PPGgreen-based outlier rejection.
Biosensors 11 00521 g004aBiosensors 11 00521 g004b
Figure 5. Different model training schemes, where xtrain denotes the data from the training subjects; xcalibration denotes the first breath-hold data from the test subject; xtest denotes the data of the test subject excluding the first breath-hold; k denotes the left-out subject. The parameters used to construct the model are in the dashed boxes. Data or parameters not used at all were colored in light gray. (a) Globalized scheme (no subject-specific calibration). (b) Semi-globalized scheme (with subject-specific calibration). (c) Subject-specific scheme.
Biosensors 11 00521 g005
Figure 6. Estimation performance of the wearable patch biosensor. The root-mean-square error (RMSE) across subjects and Pearson correlation coefficient (PCC) are shown. Note each color represents a subject. (a) Regression analysis of the globalized scheme. (b) Bland–Altman analysis of the globalized scheme. (c) Regression analysis of the semi-globalized scheme. (d) Bland–Altman analysis of the semi-globalized scheme. (e) Regression analysis of the subject-specific scheme. (f) Bland–Altman analysis of the subject-specific scheme.
Biosensors 11 00521 g006aBiosensors 11 00521 g006bBiosensors 11 00521 g006c
Figure 7. Calibration using b and using both b and m. ns denotes not significant (p > 0.05), and a double asterisk denotes significant differences (p < 0.01) as determined by paired sample t-tests.
Biosensors 11 00521 g007
Figure 8. Calibration analysis. (a) RMSE is reduced significantly with increasing calibration duration while fixing SpO2 range. (b) RMSE does not change significantly with increasing SpO2 range while fixing calibration duration. ns denotes not significant (p > 0.05), and a single asterisk denotes significant differences (p < 0.05) as determined by paired sample t-tests.
Biosensors 11 00521 g008
Figure 9. Mean bias across varying Fitzpatrick skin types. The differences between Fitzpatrick skin types are not statistically significant (p > 0.05). One-way analysis of variance (ANOVA) was used for statistical analysis.
Biosensors 11 00521 g009
Table 1. Demographics and physiological responses during breath-hold of the subjects included in the analysis.
VariableFemale (N = 6)Male (N = 14)
DemographicsAge (years)28.00 (2.00)26.15 (2.19)
Fitzpatrick skin type (I–VI)1.83 (1.17)2.36 (0.93)
Weight (kg)56.35 (11.61)76.44 (11.97)
Height (cm)163.03 (7.46)178.03 (7.09)
BMI (kg/m2)21.02 (2.86)24.05 (2.84)
Breath-hold responseBaseline SpO2 (%)96.50 (0.84)96.29 (1.27)
Nadir SpO2 (%)88.80 (4.81)80.52 (8.70)
Breath-hold duration (s)44.07 (25.64)55.99 (15.52)
Approximate finger SpO2 delay (s)24.91 (8.69)27.42 (12.49)
Perfusion index (PI)Red PPG (%)0.05 (0.03)0.07 (0.04)
Infrared PPG (%)0.08 (0.04)0.10 (0.06)
Green PPG (%)0.56 (0.23)0.60 (0.40)
Note values are presented in mean (standard deviation).
Table 2. Comparing the results of three training schemes based on their RMSE, PCC, bias, and 95% LOR.
RMSEPCCbias95% LOR
Globalized2.63 ± 1.14%0.89−0.03%[−5.66%, 5.61%]
Semi-globalized2.27 ± 0.76%0.910.11%[−4.81%, 5.02%]
Subject-specific2.27 ± 0.88%0.920.24%[−4.84%, 5.31%]
Publisher’s Note: MDPI stays neutral with regard to jurisdictional claims in published maps and institutional affiliations.