Magnetic Attributes of NiFe2O4 Nanoparticles: Influence of Dysprosium Ions (Dy3+) Substitution

 ,
,  ,
, 

Abstract
:1. Introduction
2. Experimental
3. Results and Discussion
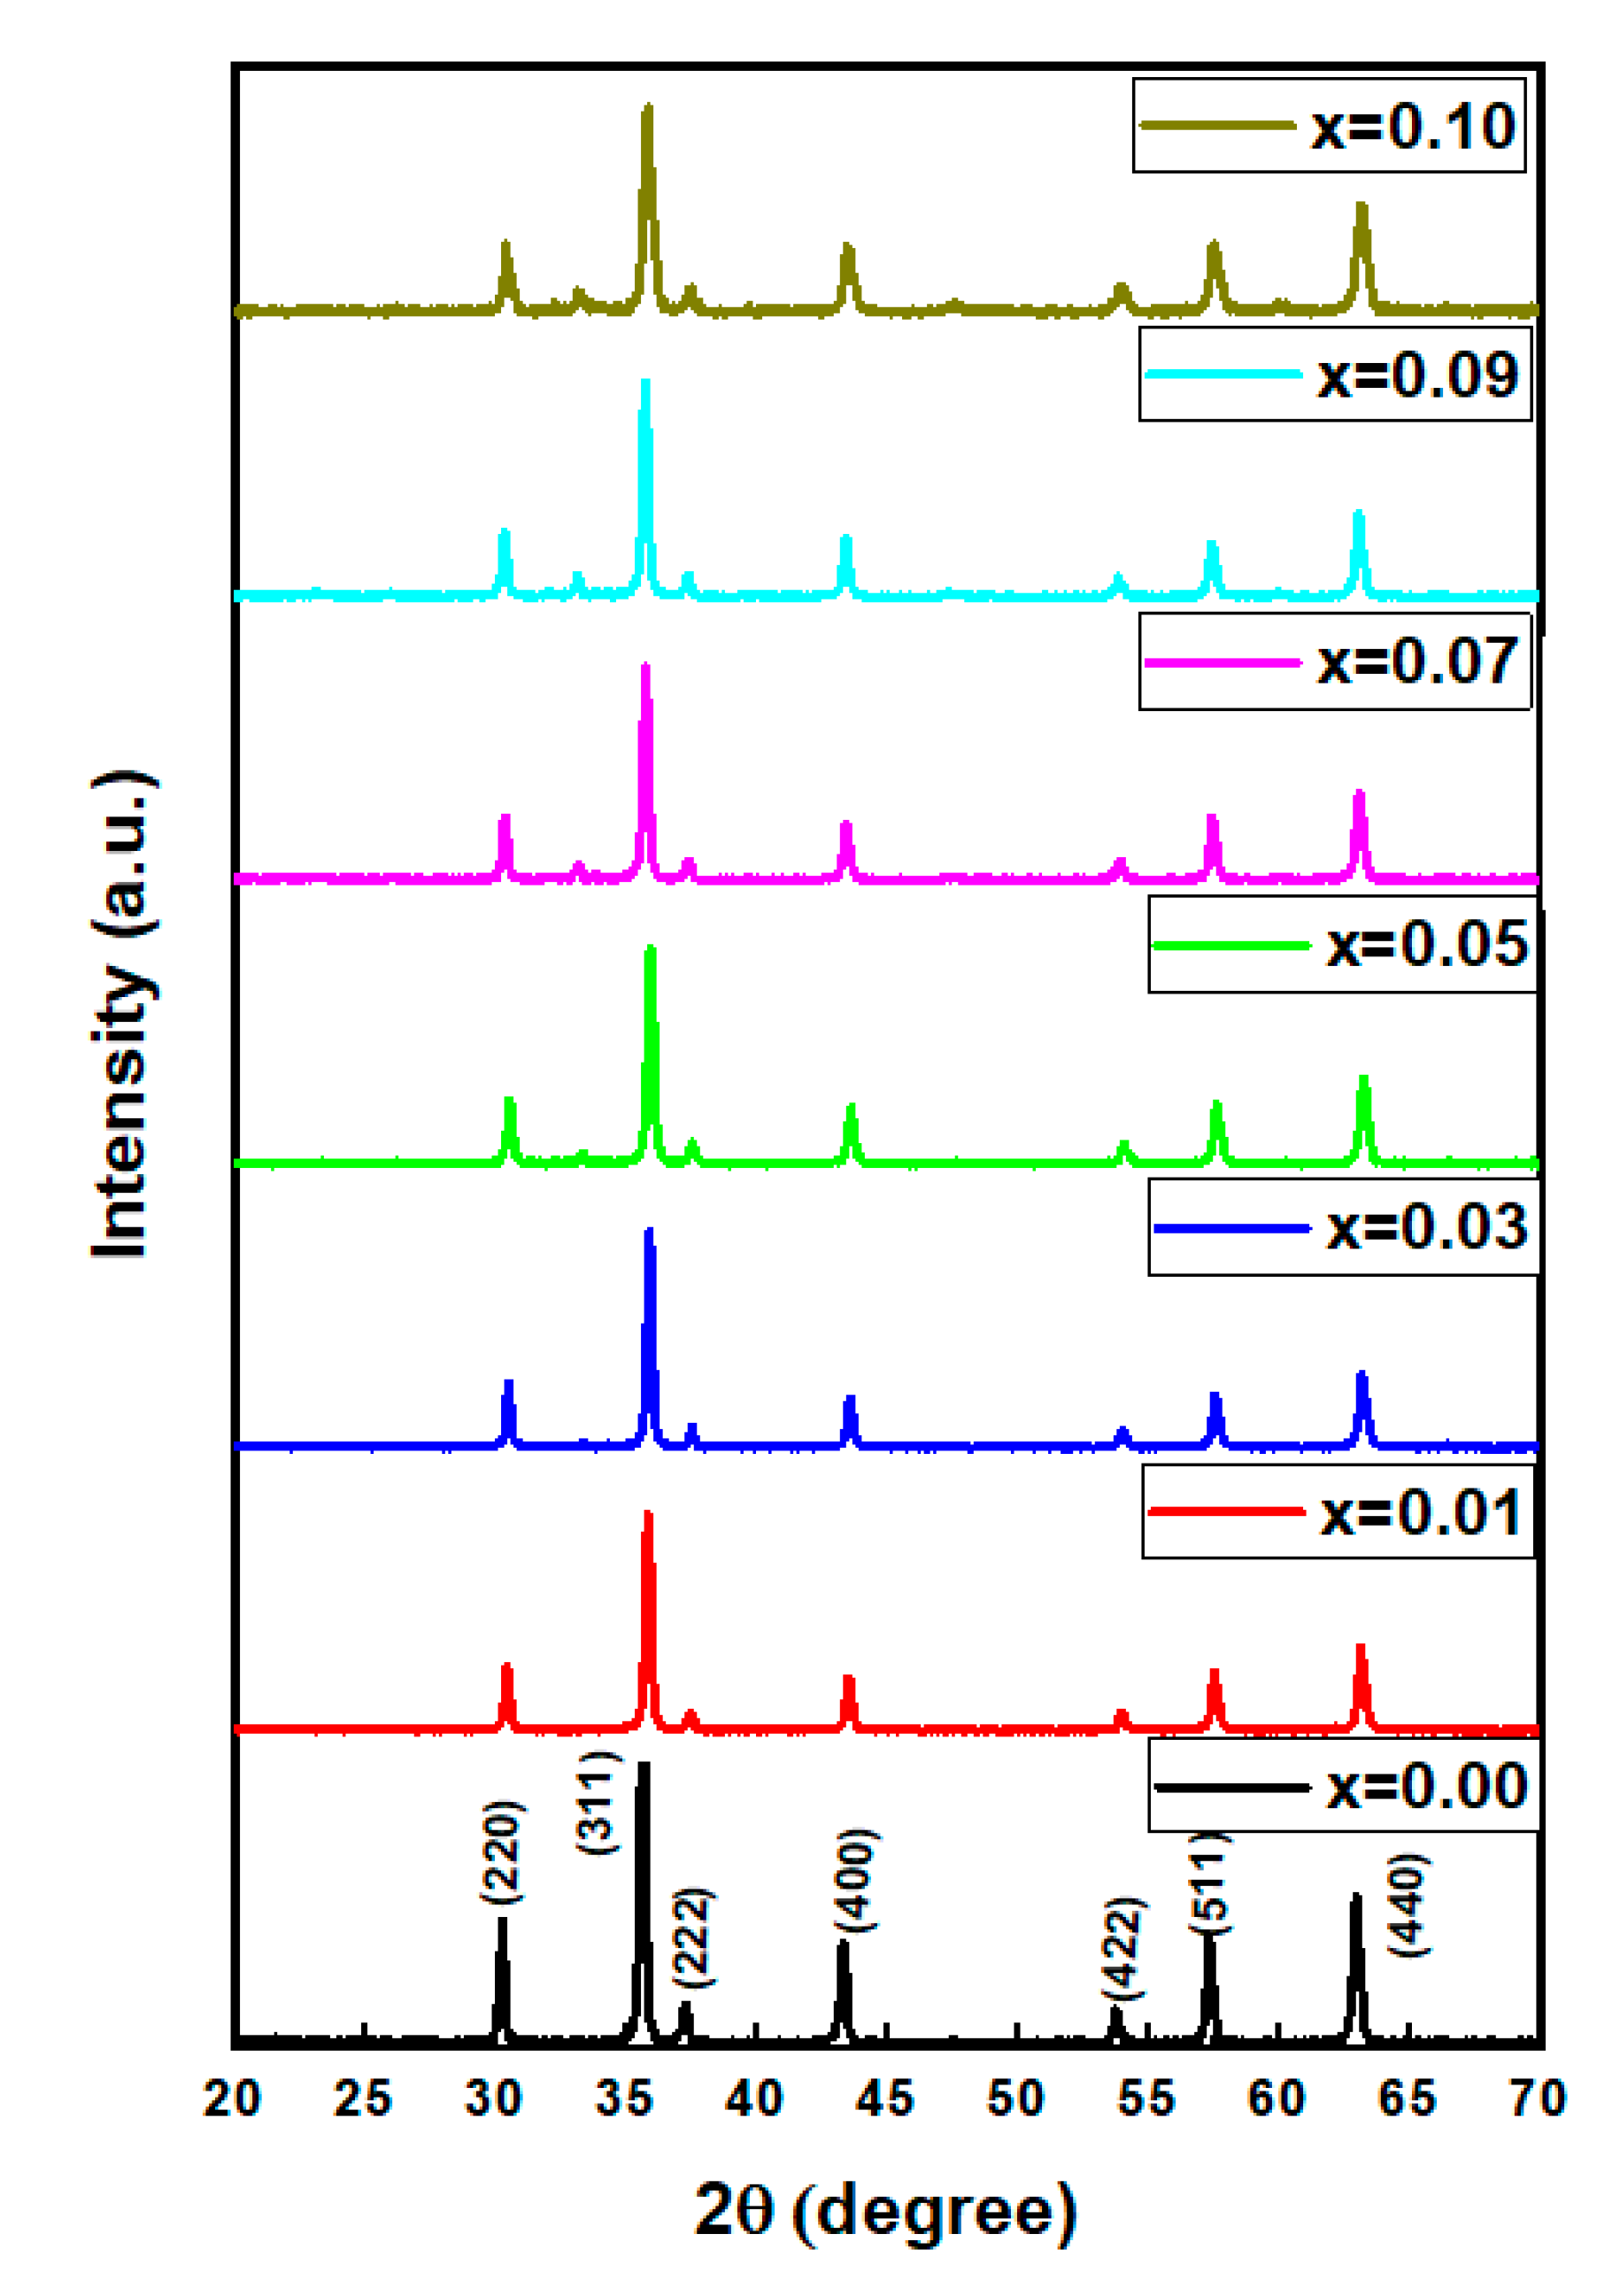
3.1. Structure
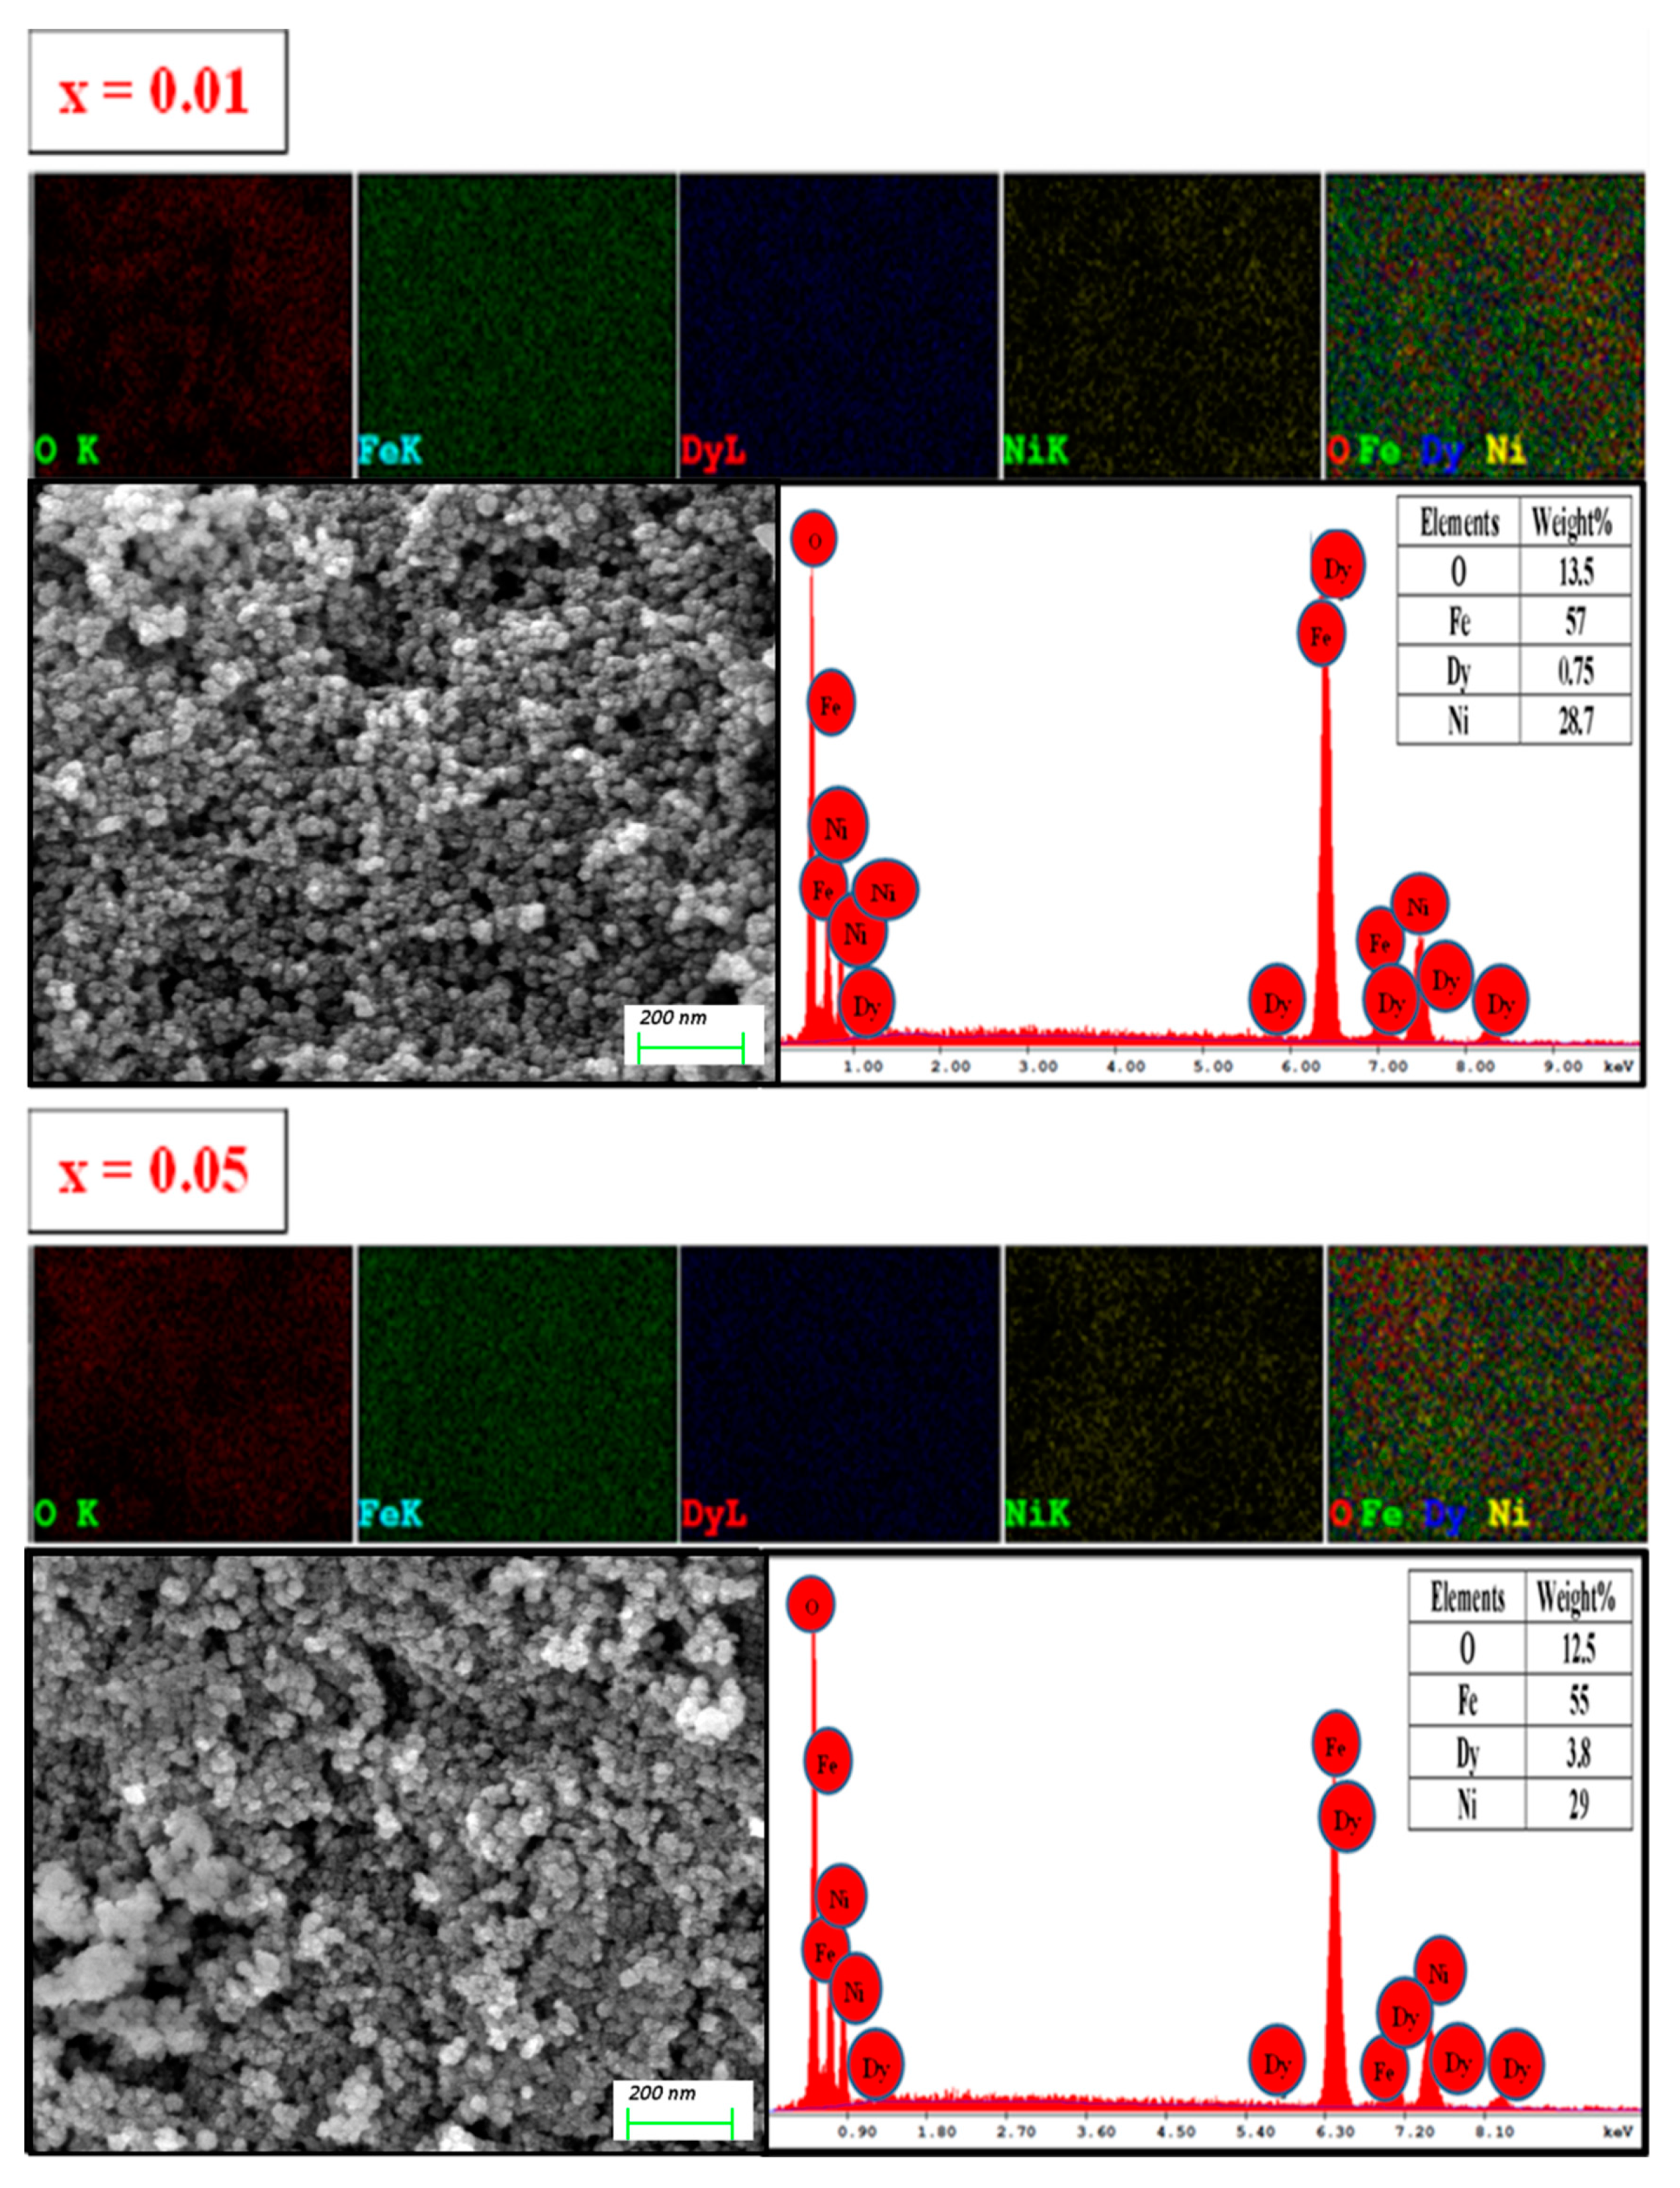
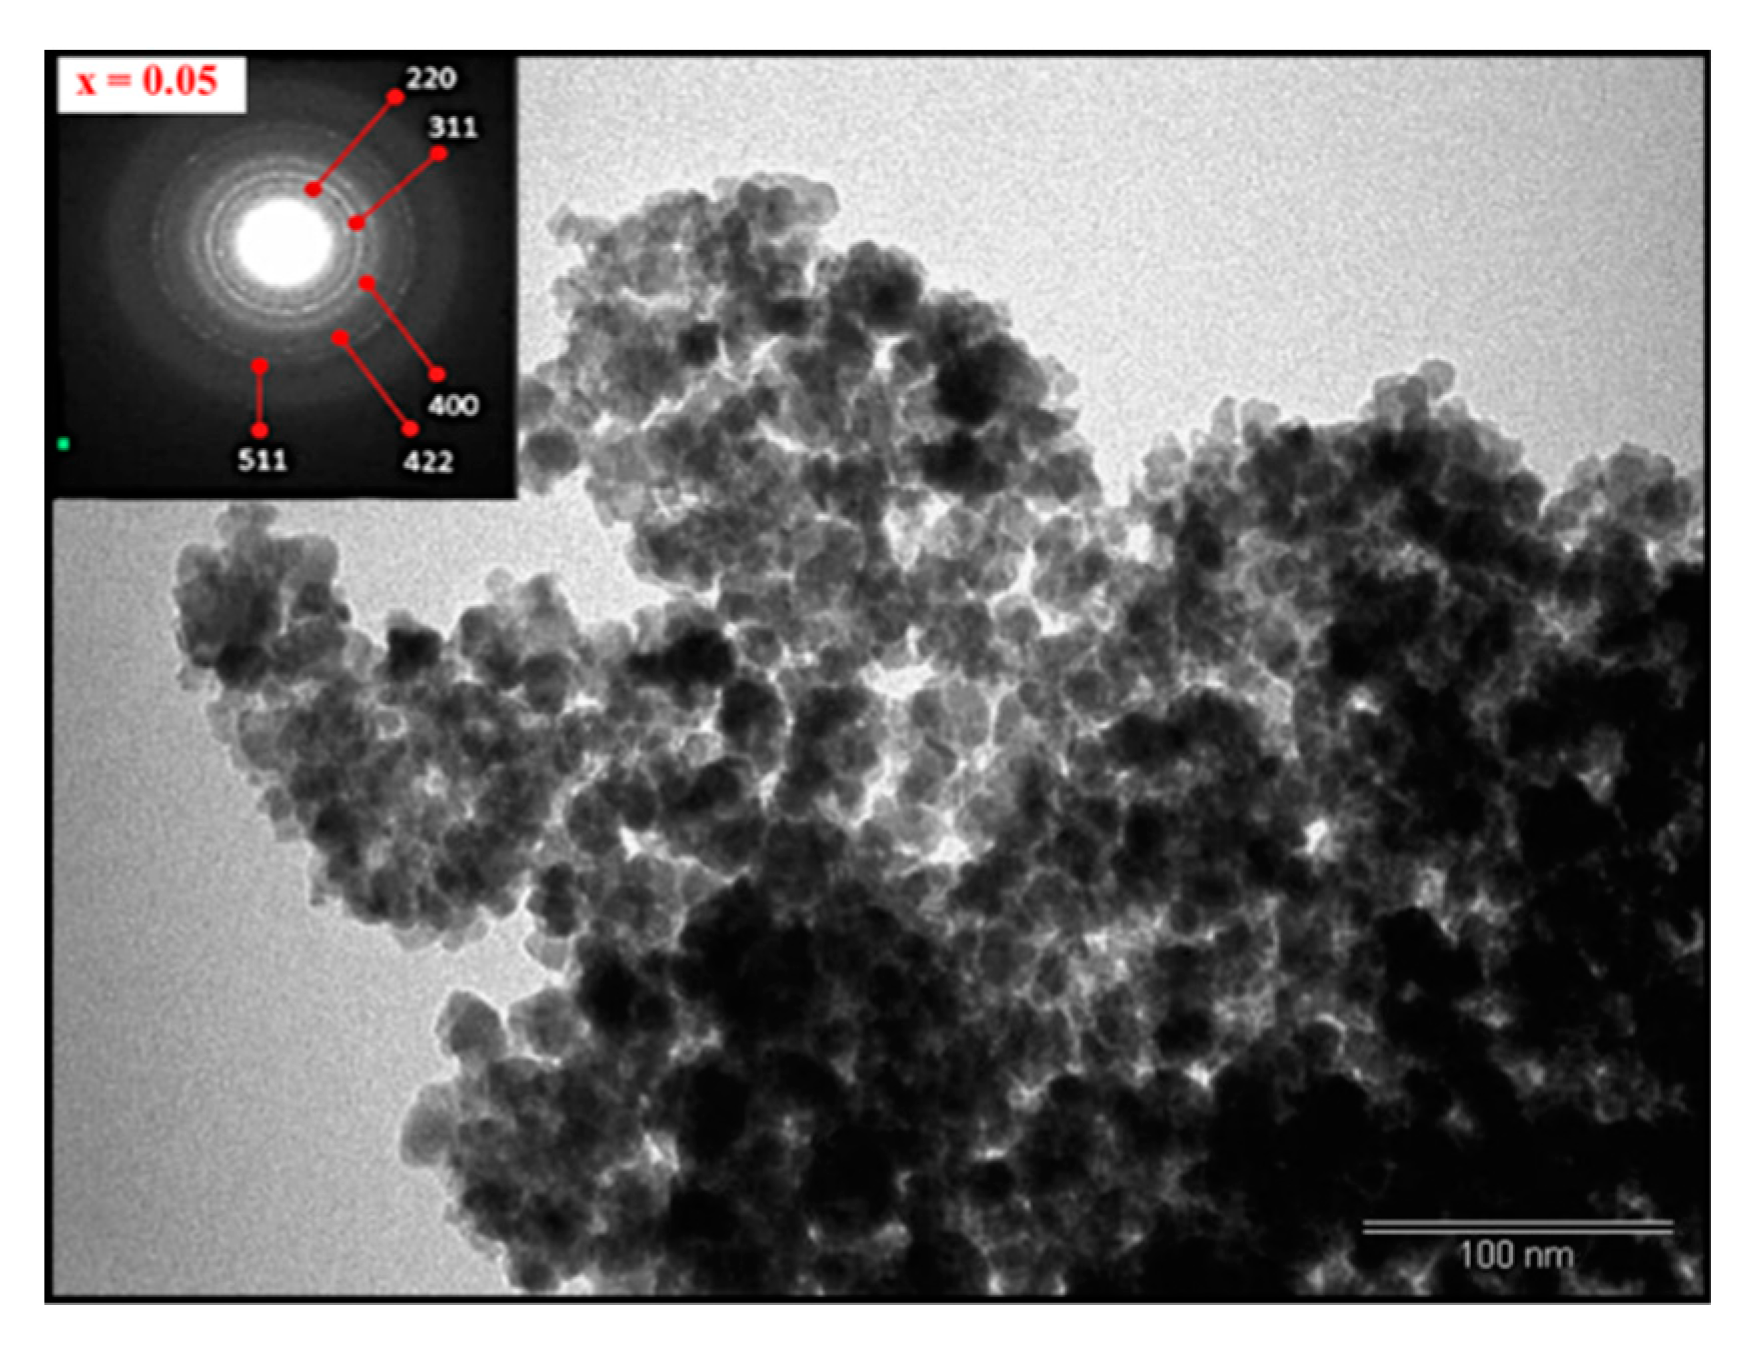
3.2. Morphology
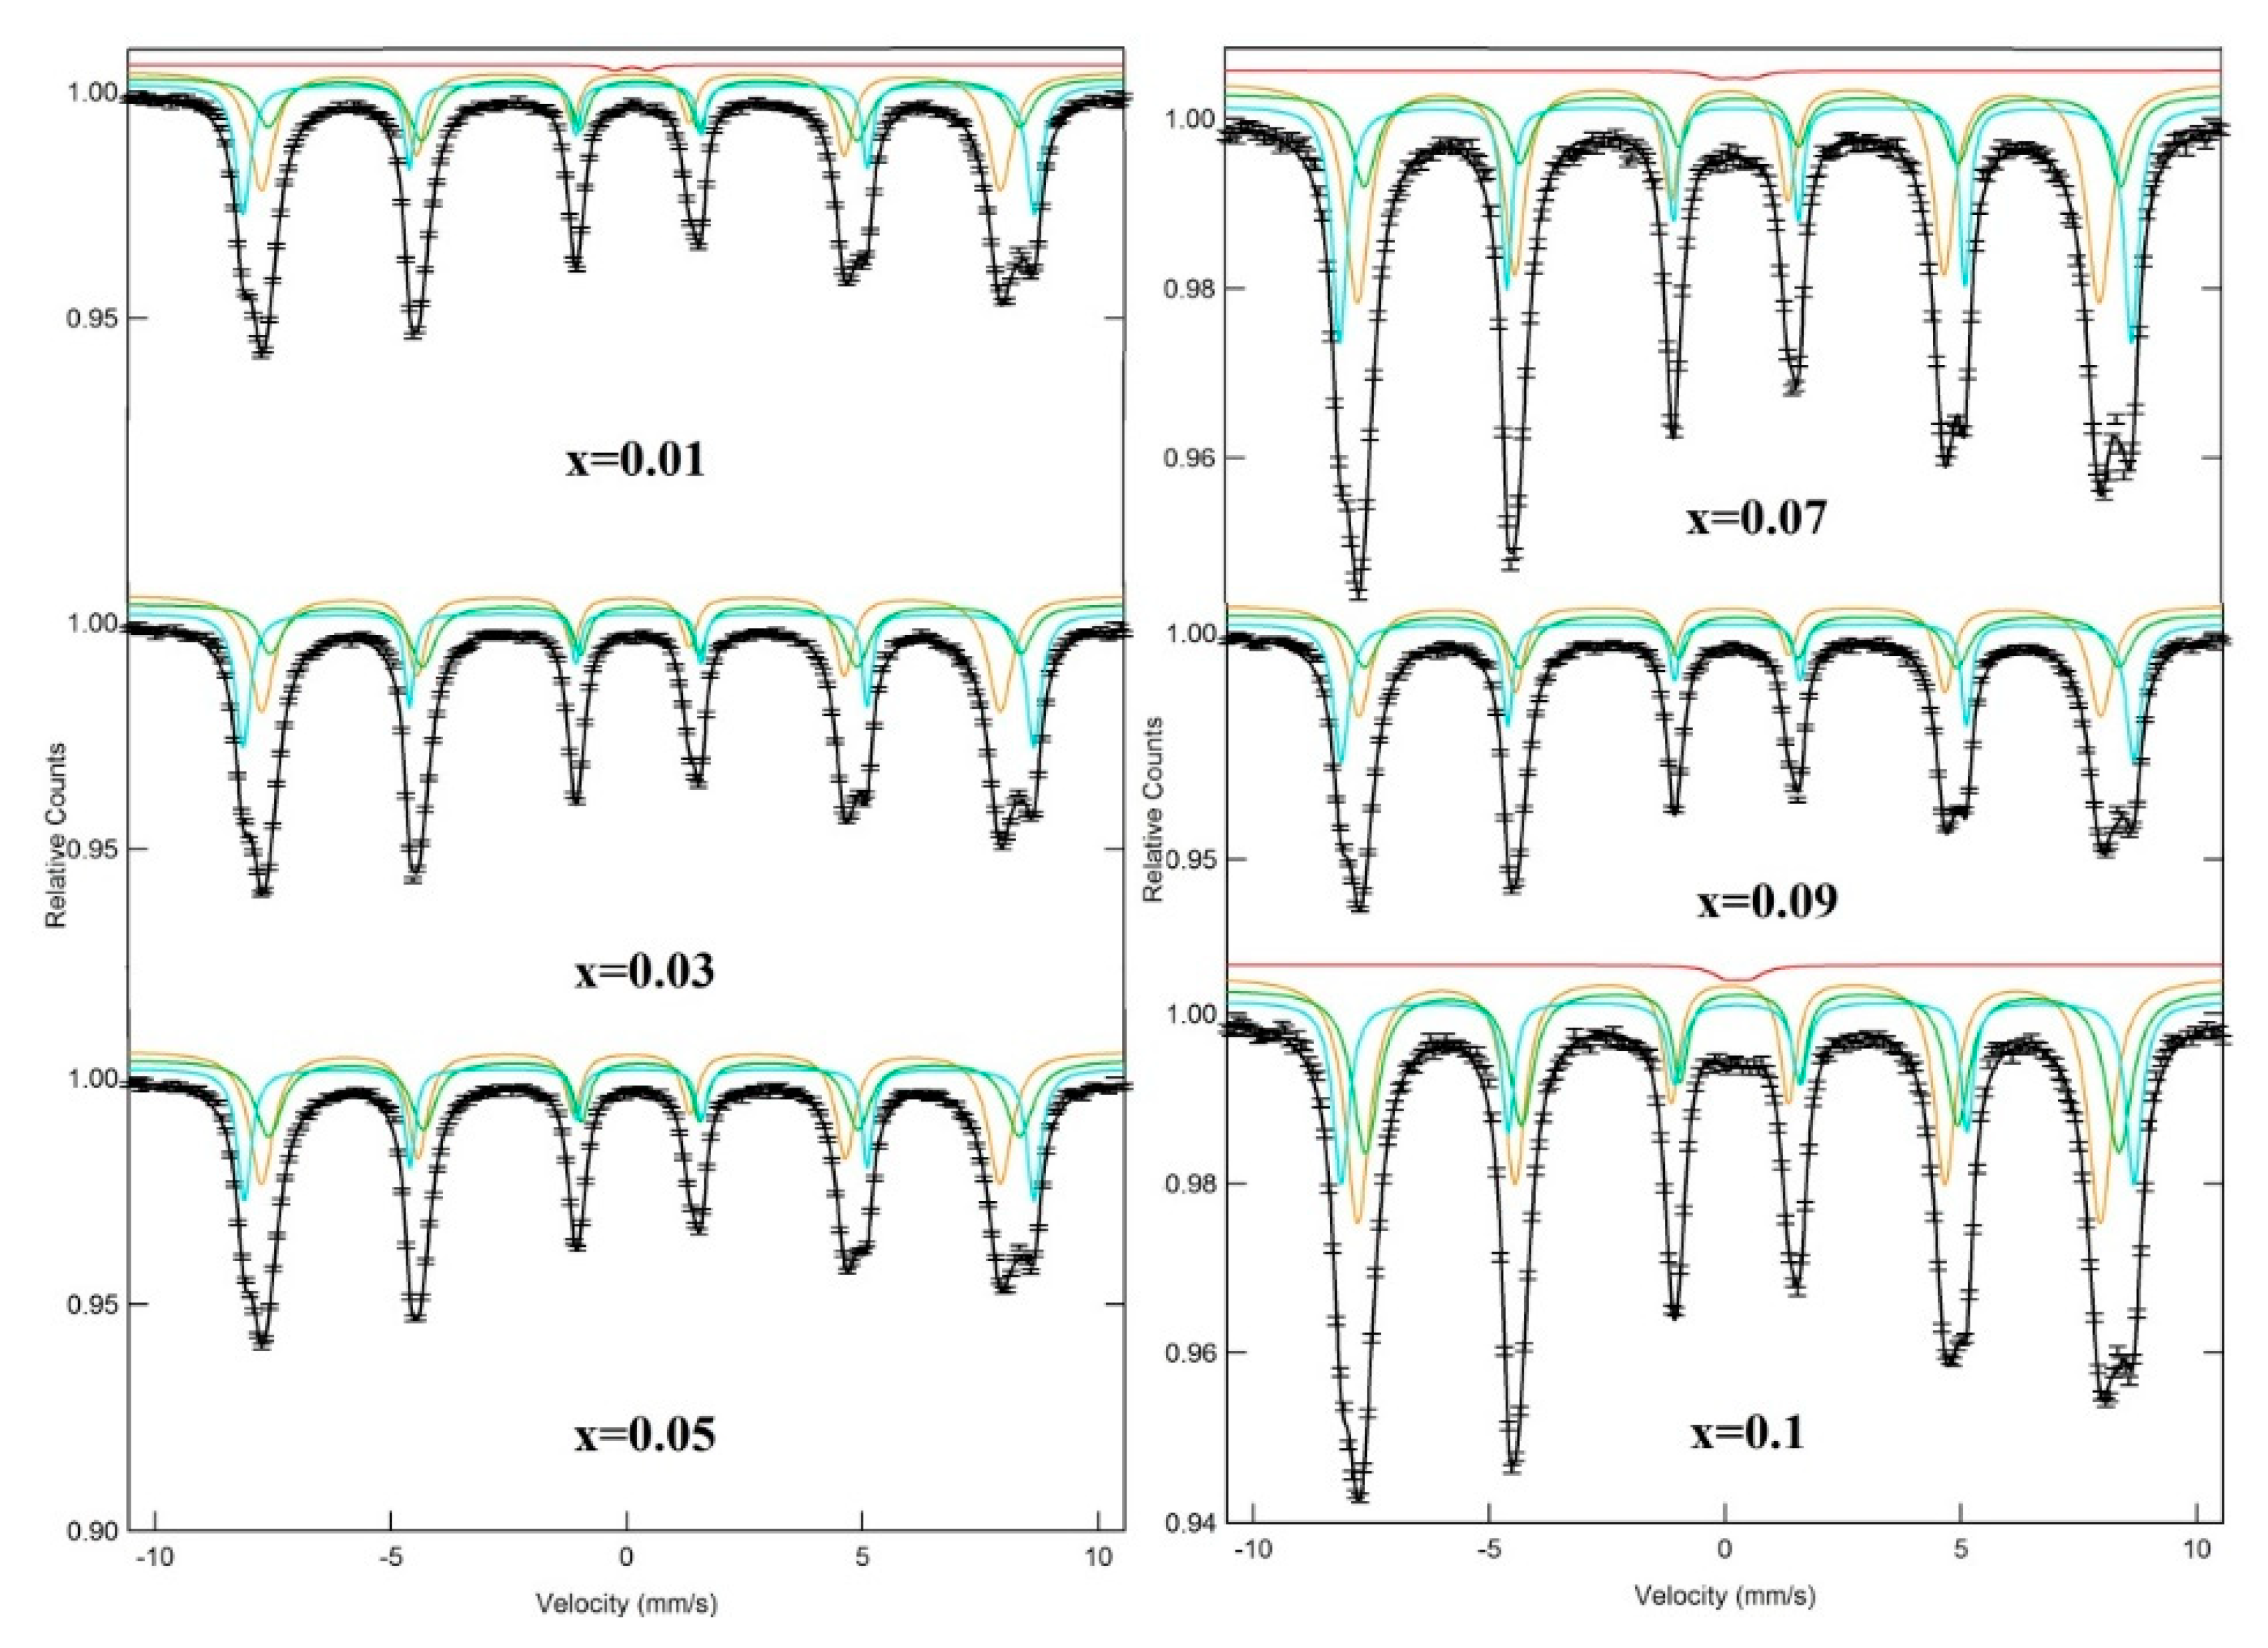
3.3. Mössbauer Spectra
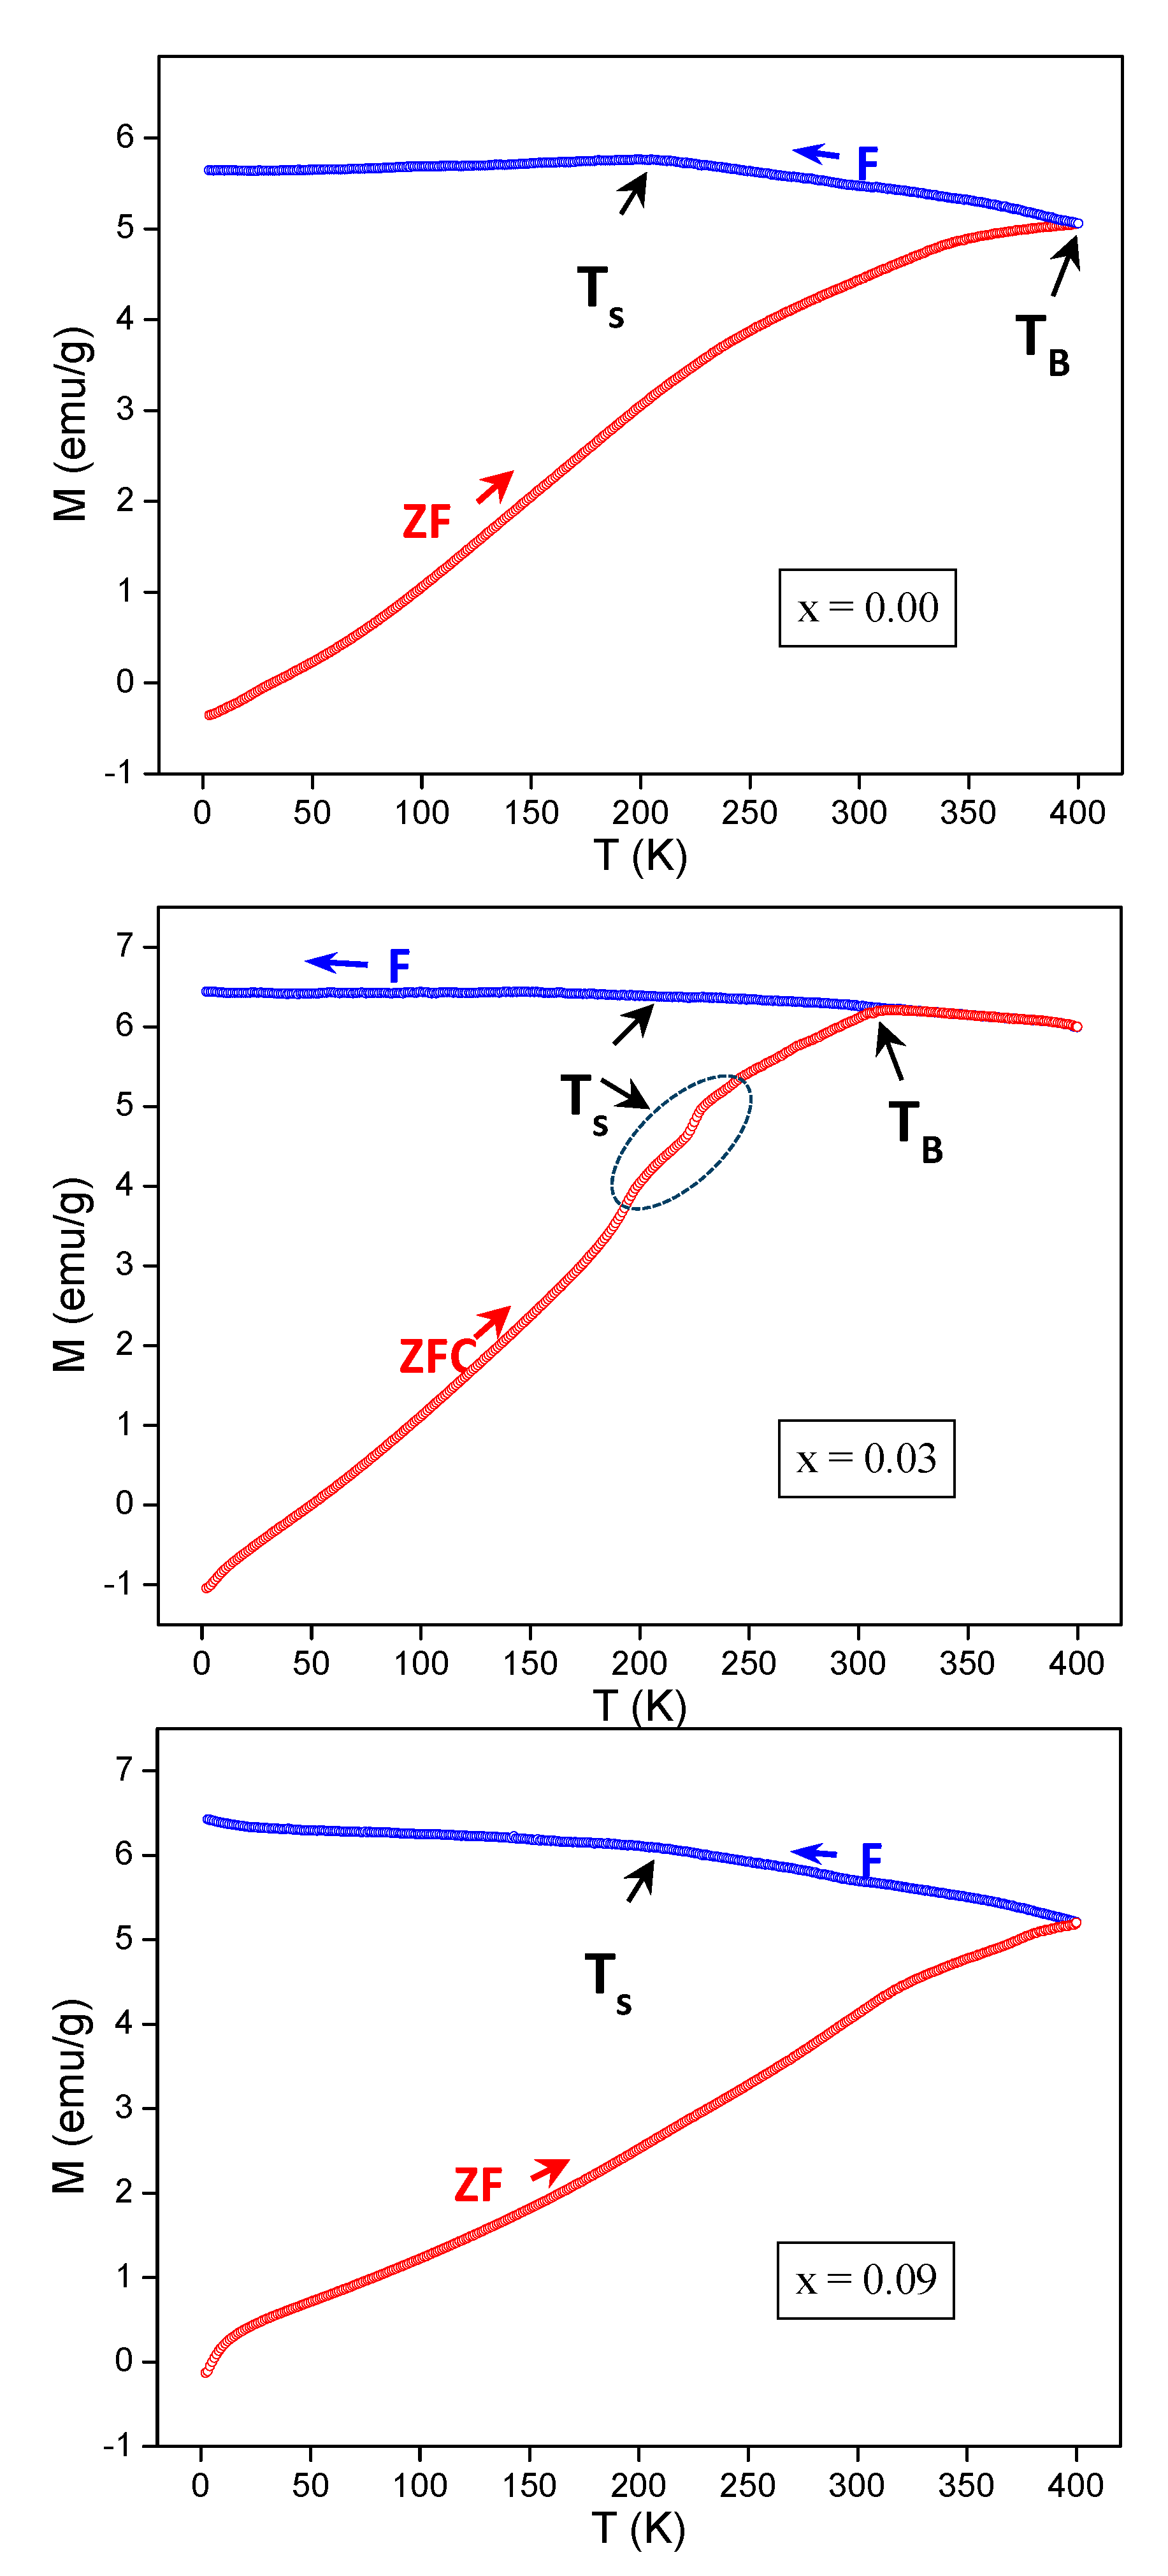
3.4. ZFC-FC Magnetizations
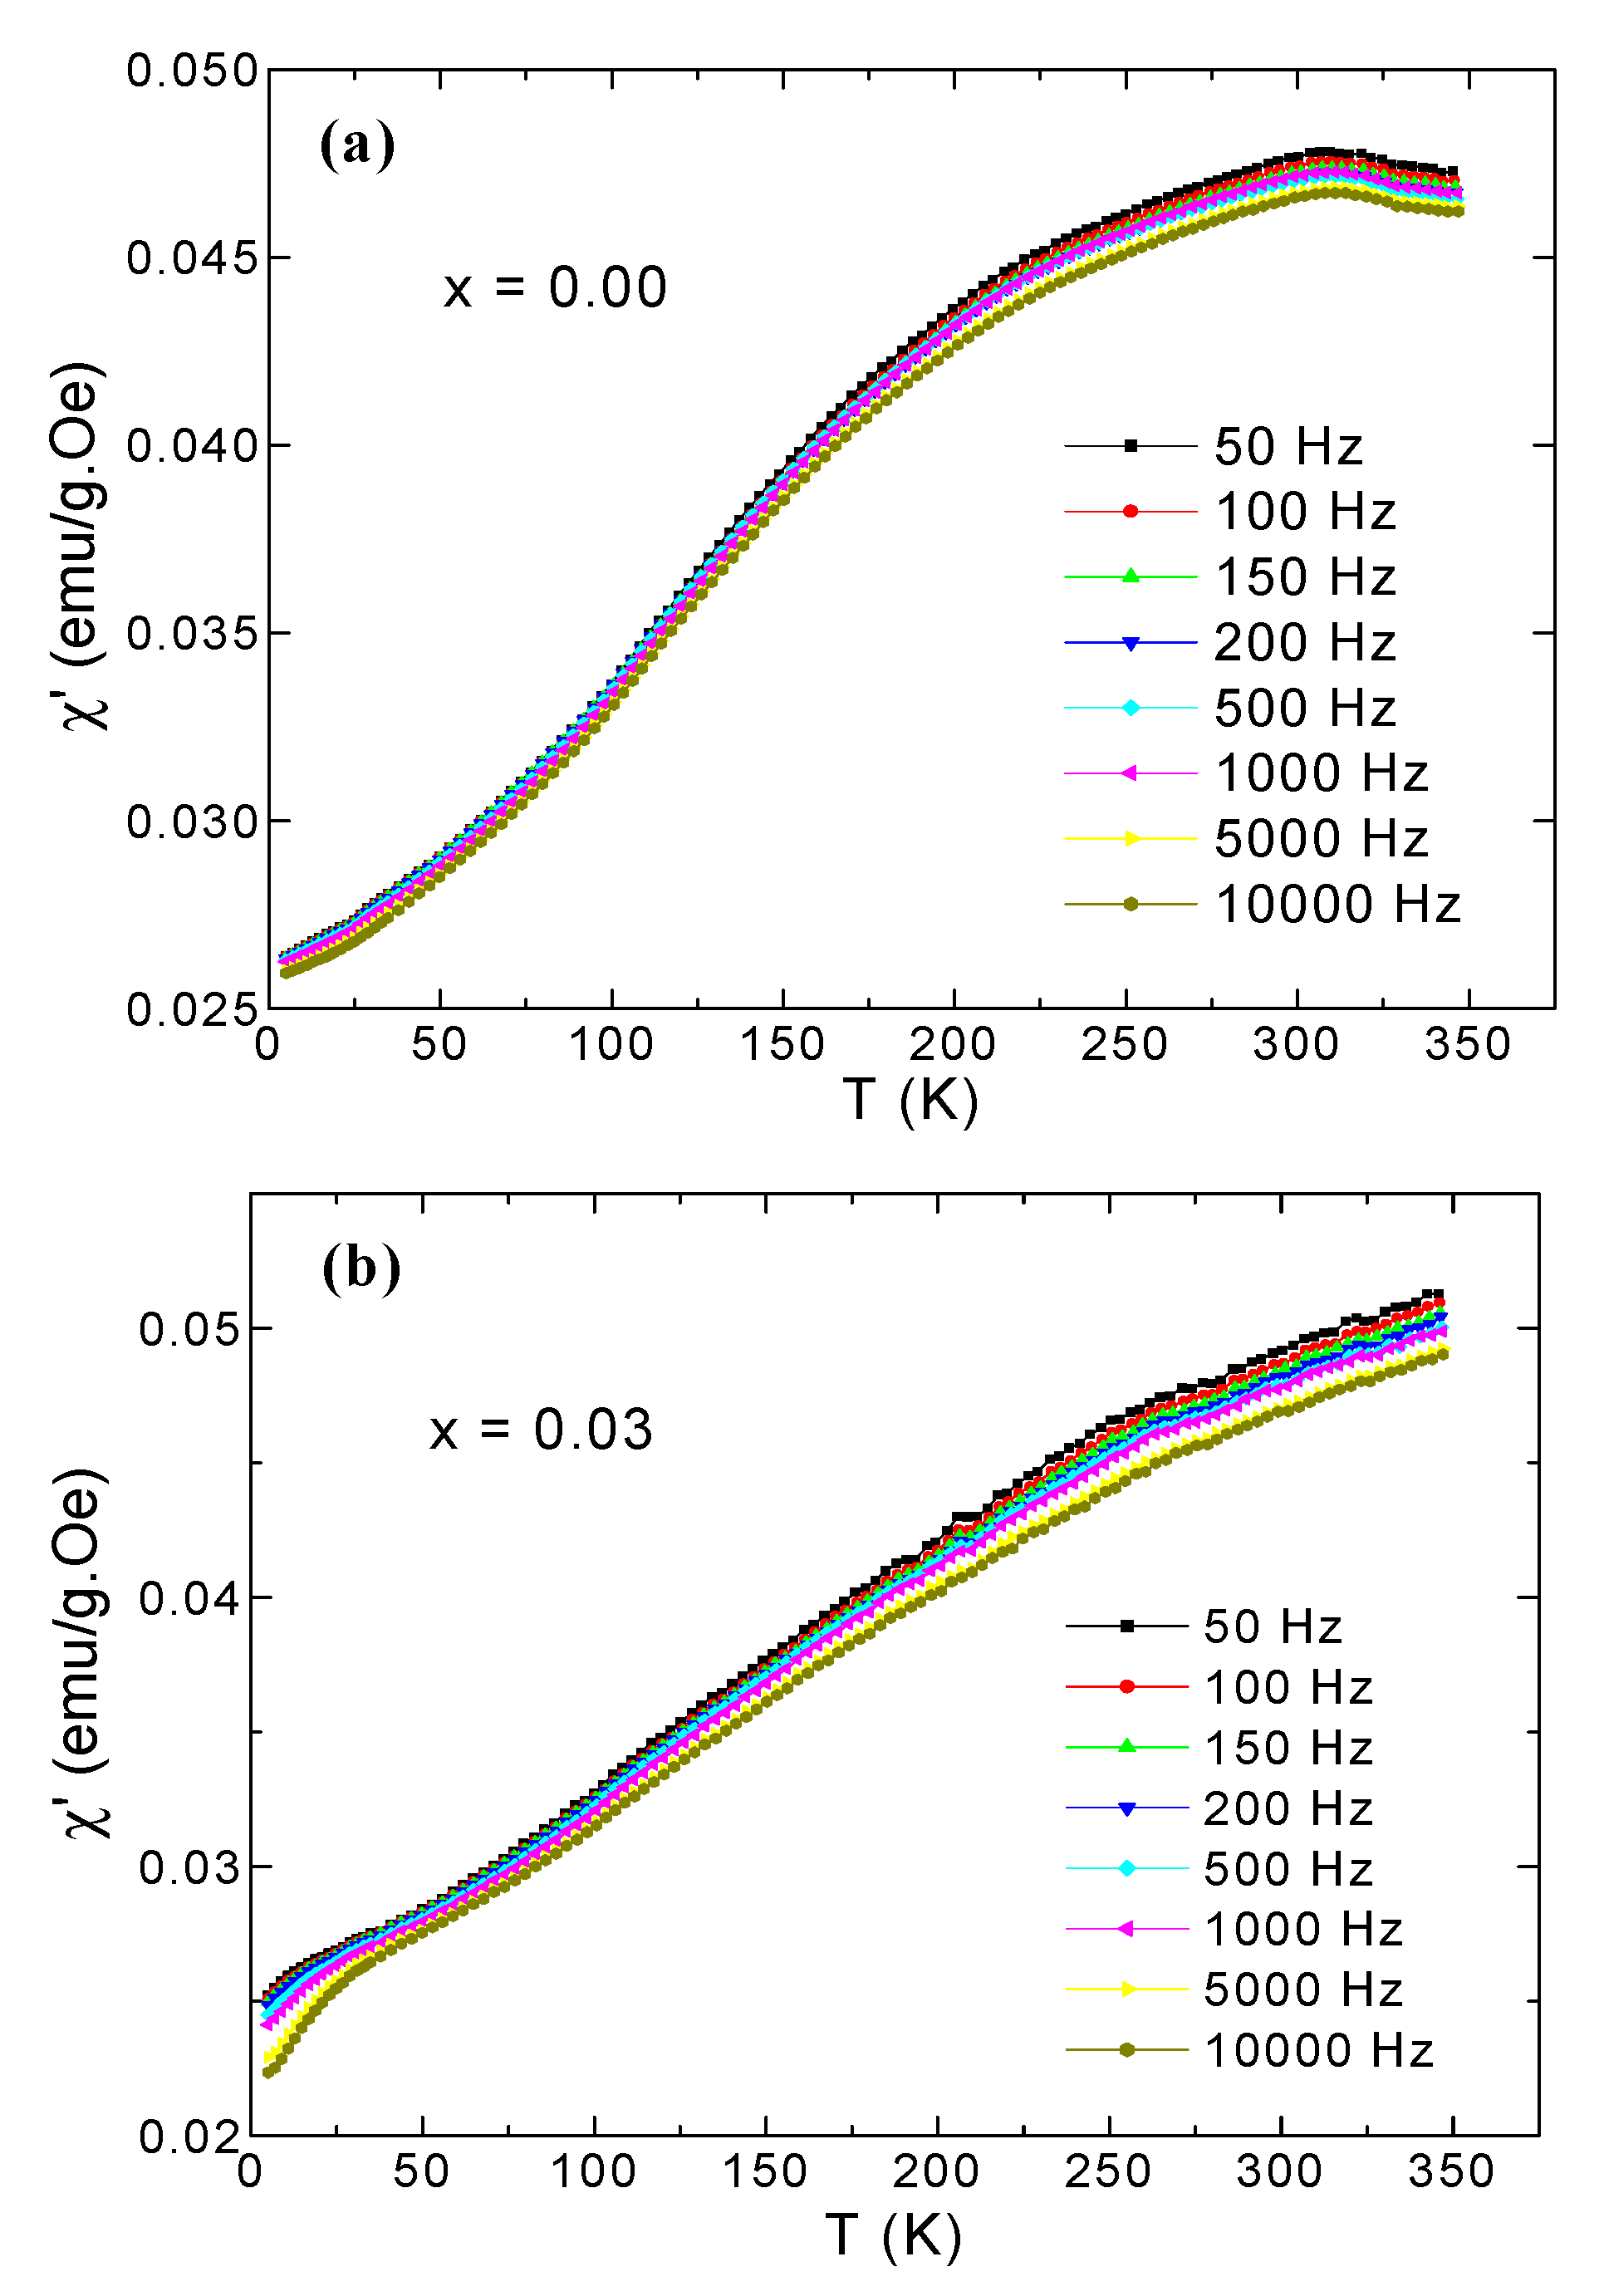
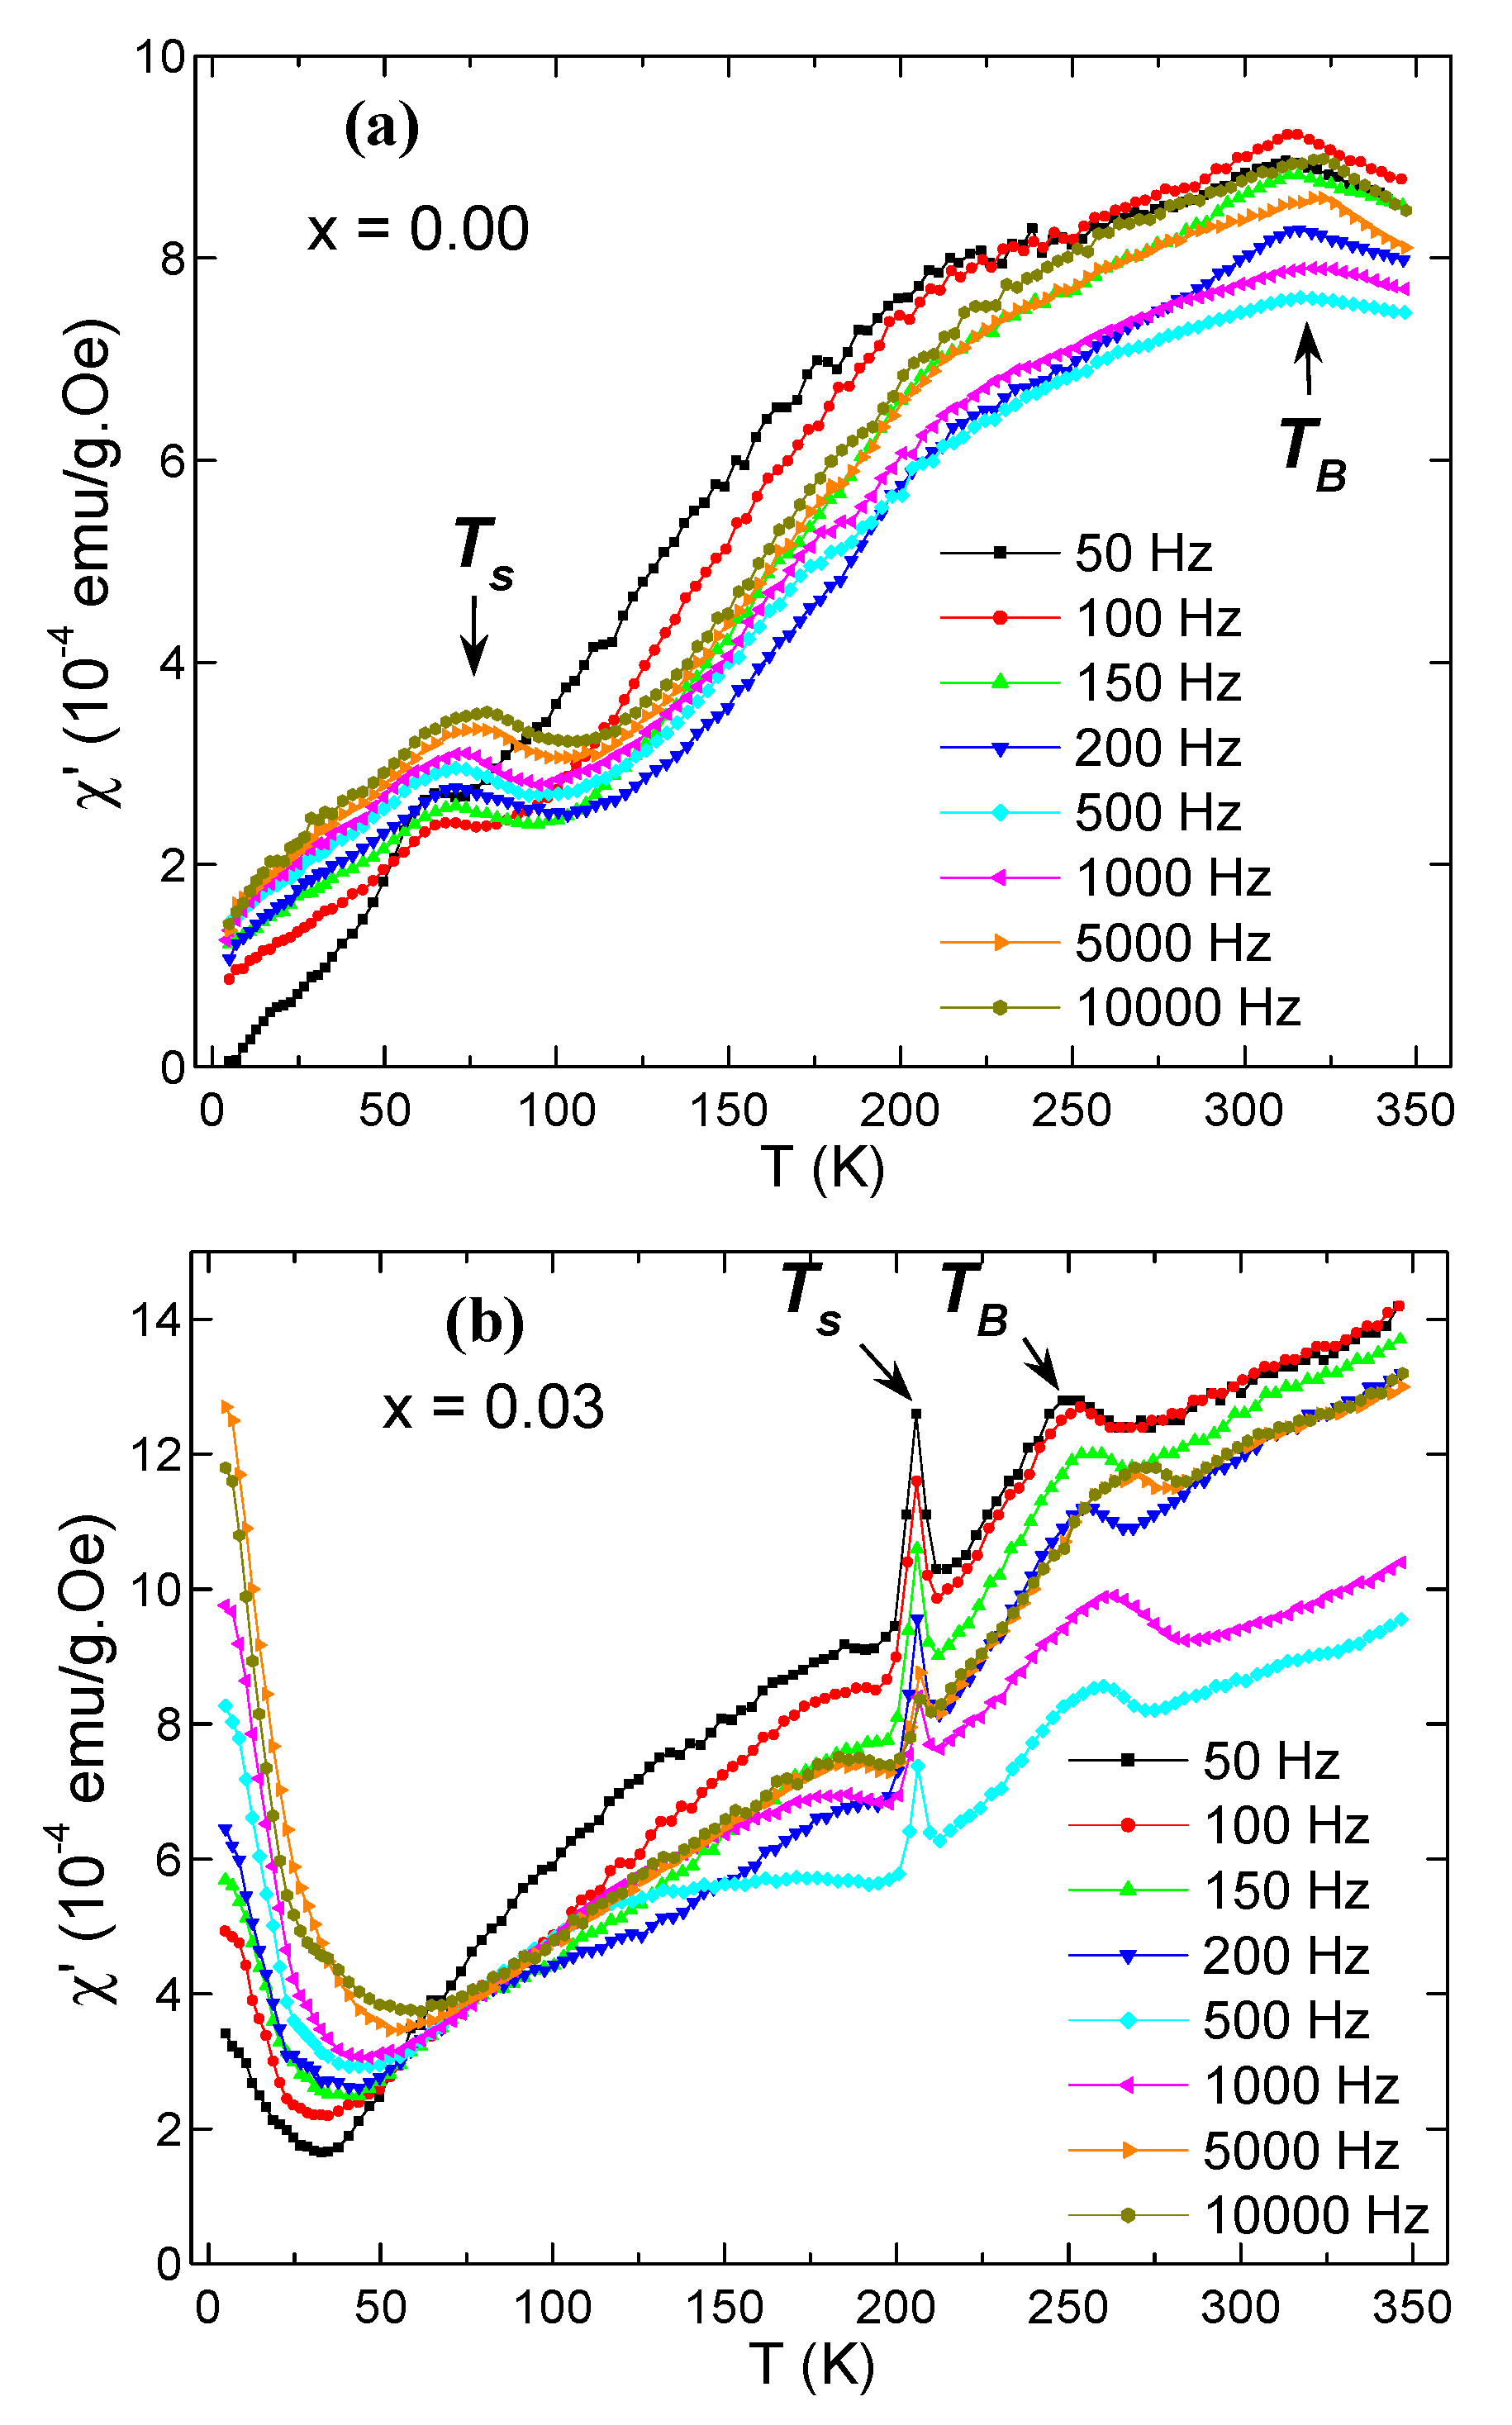
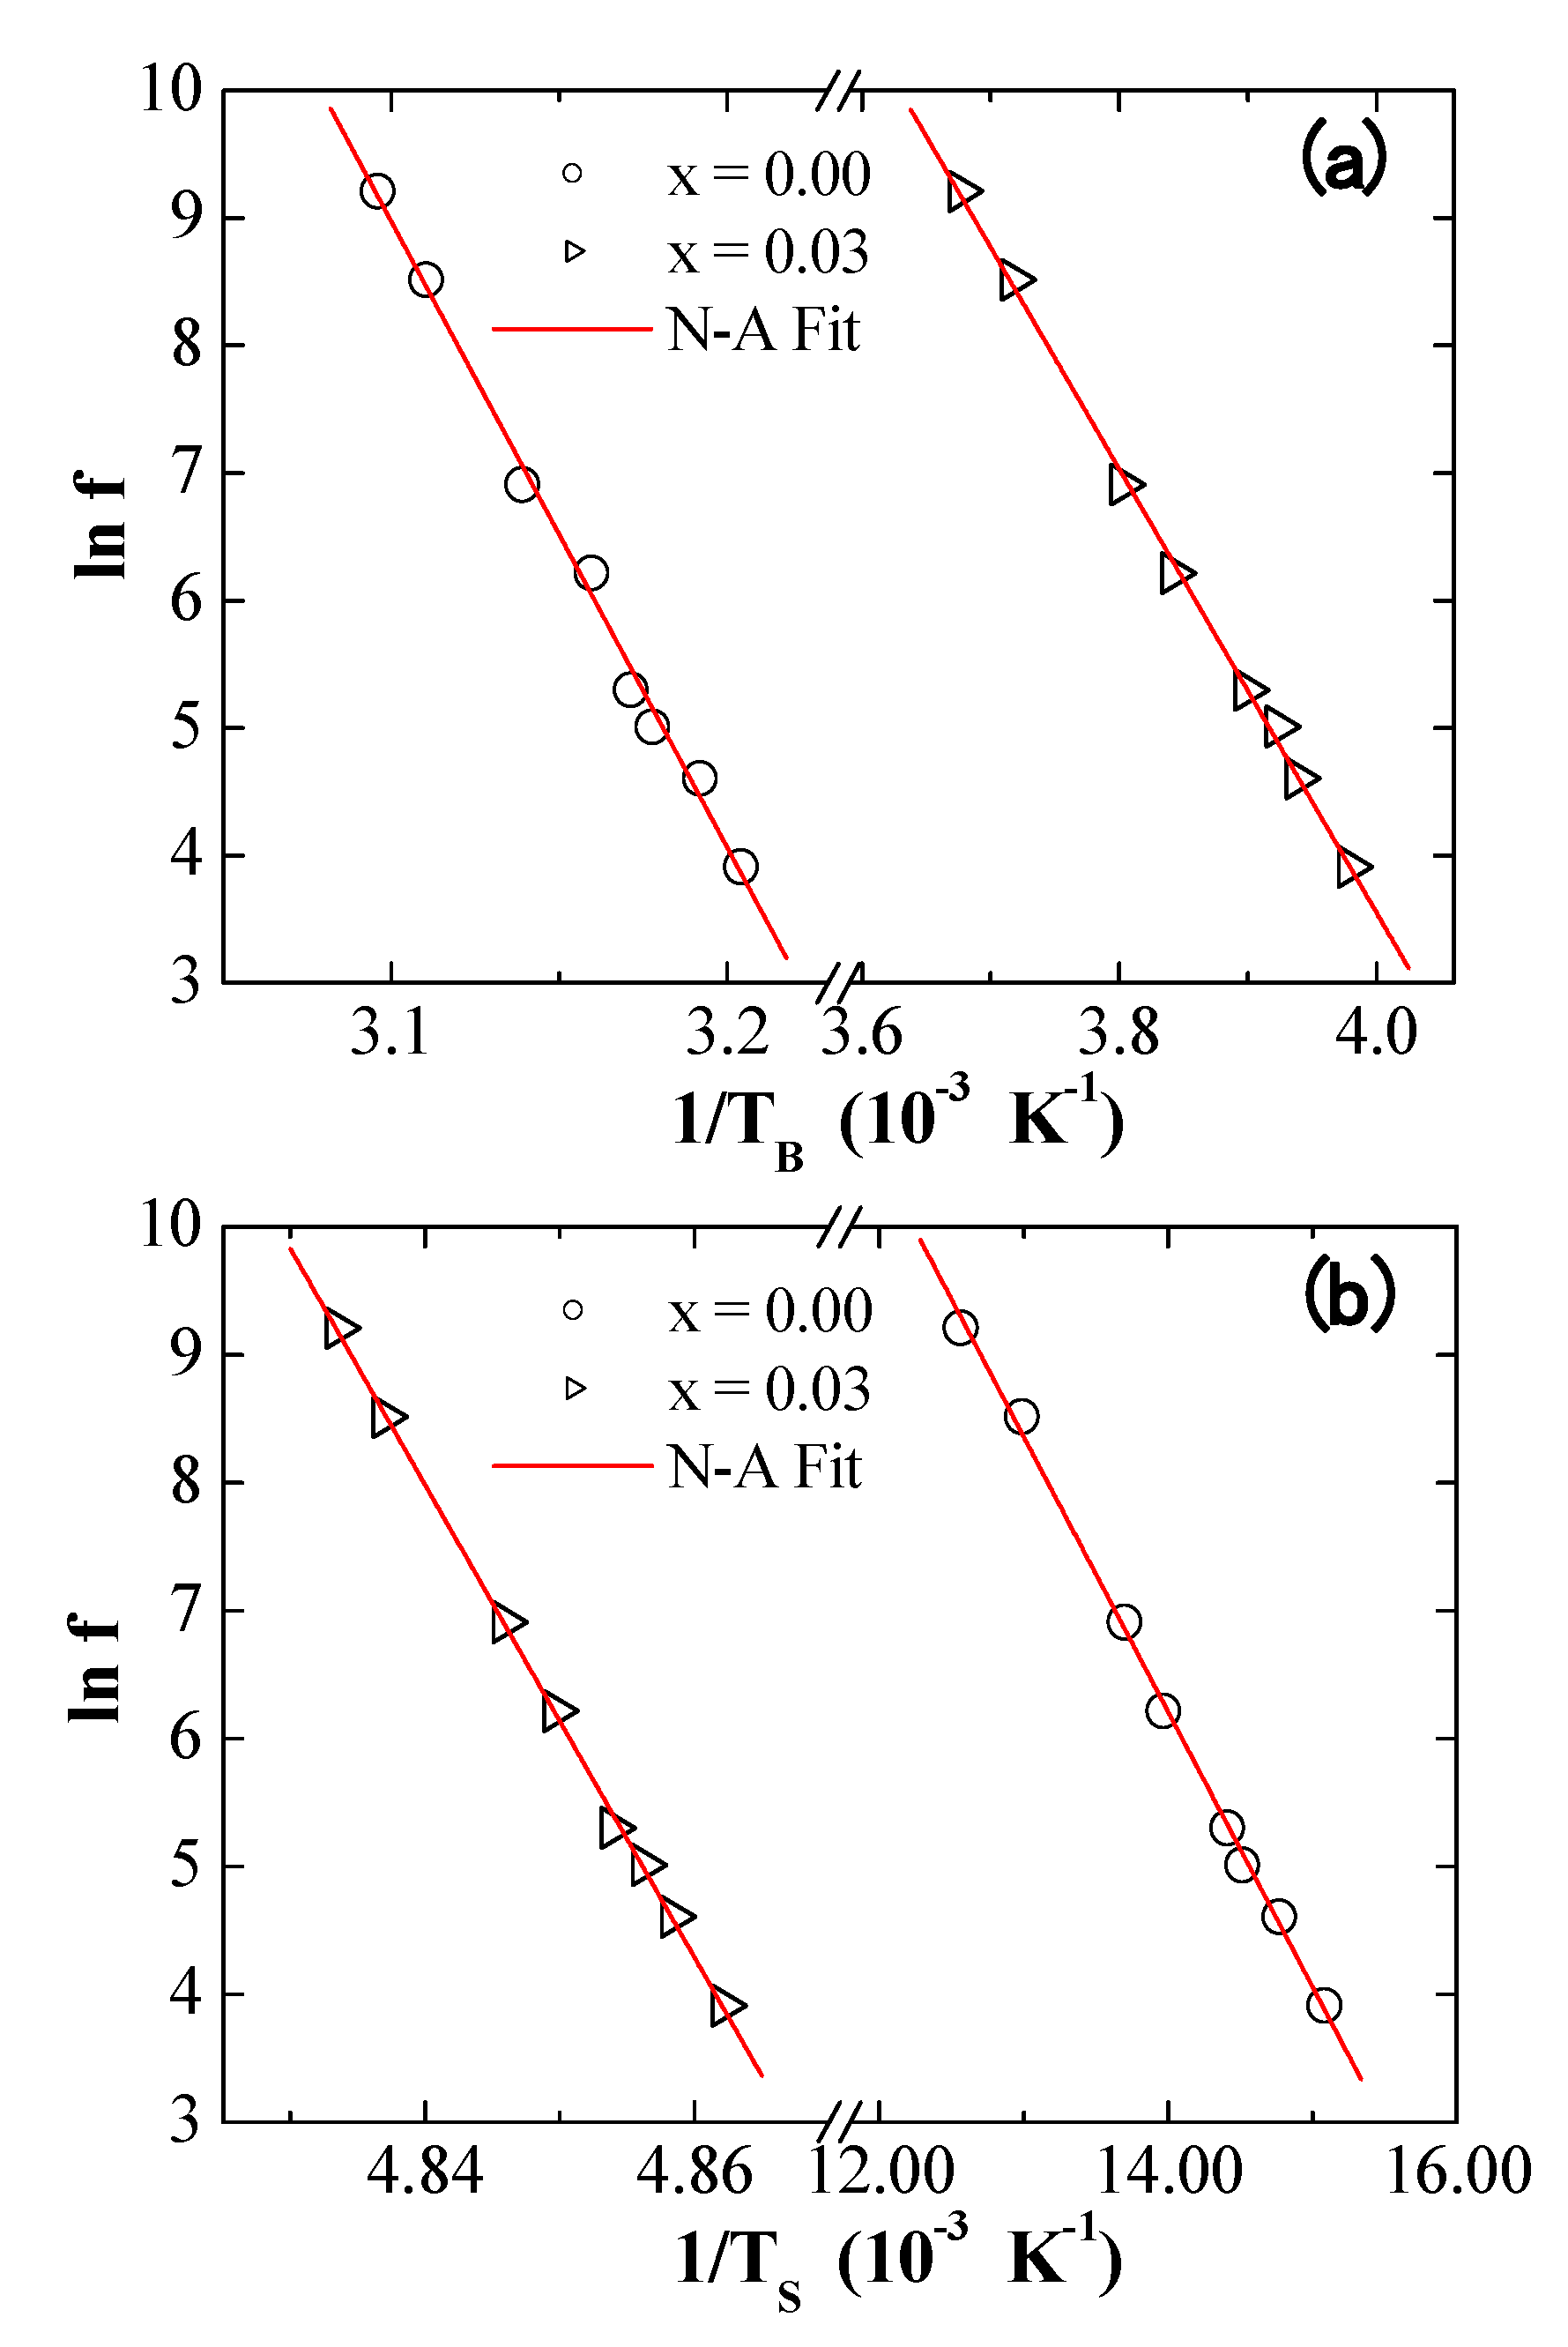
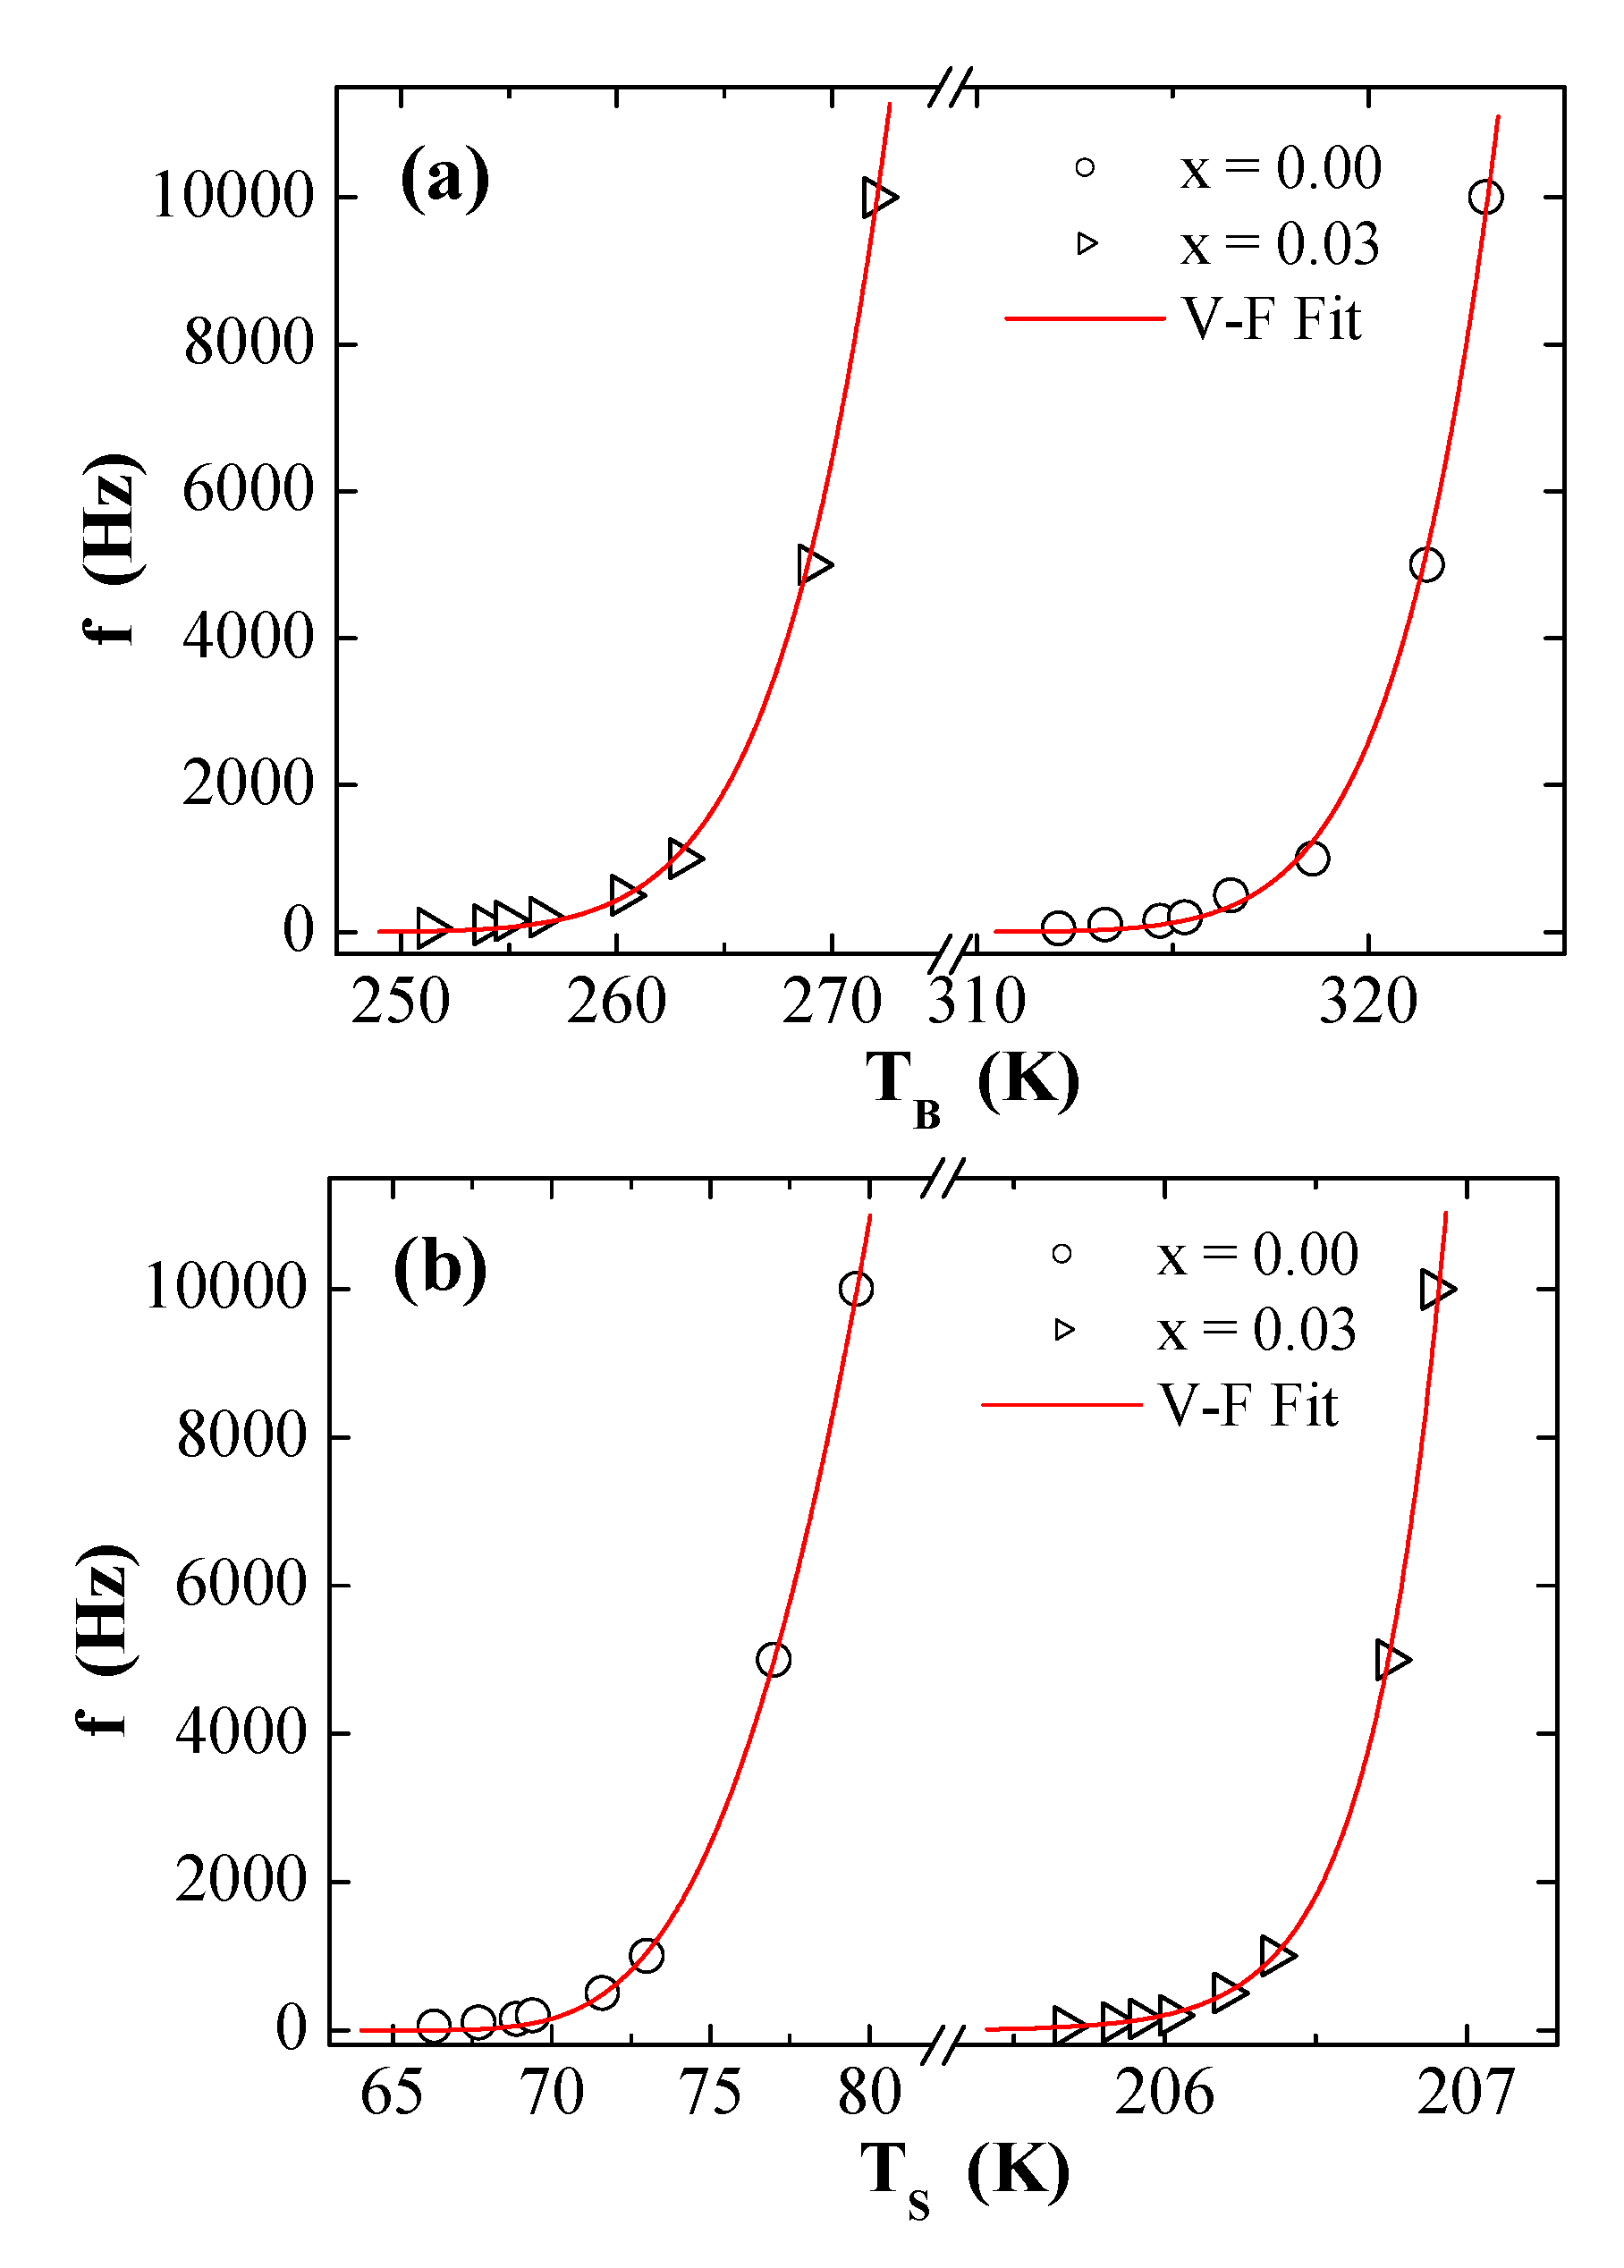
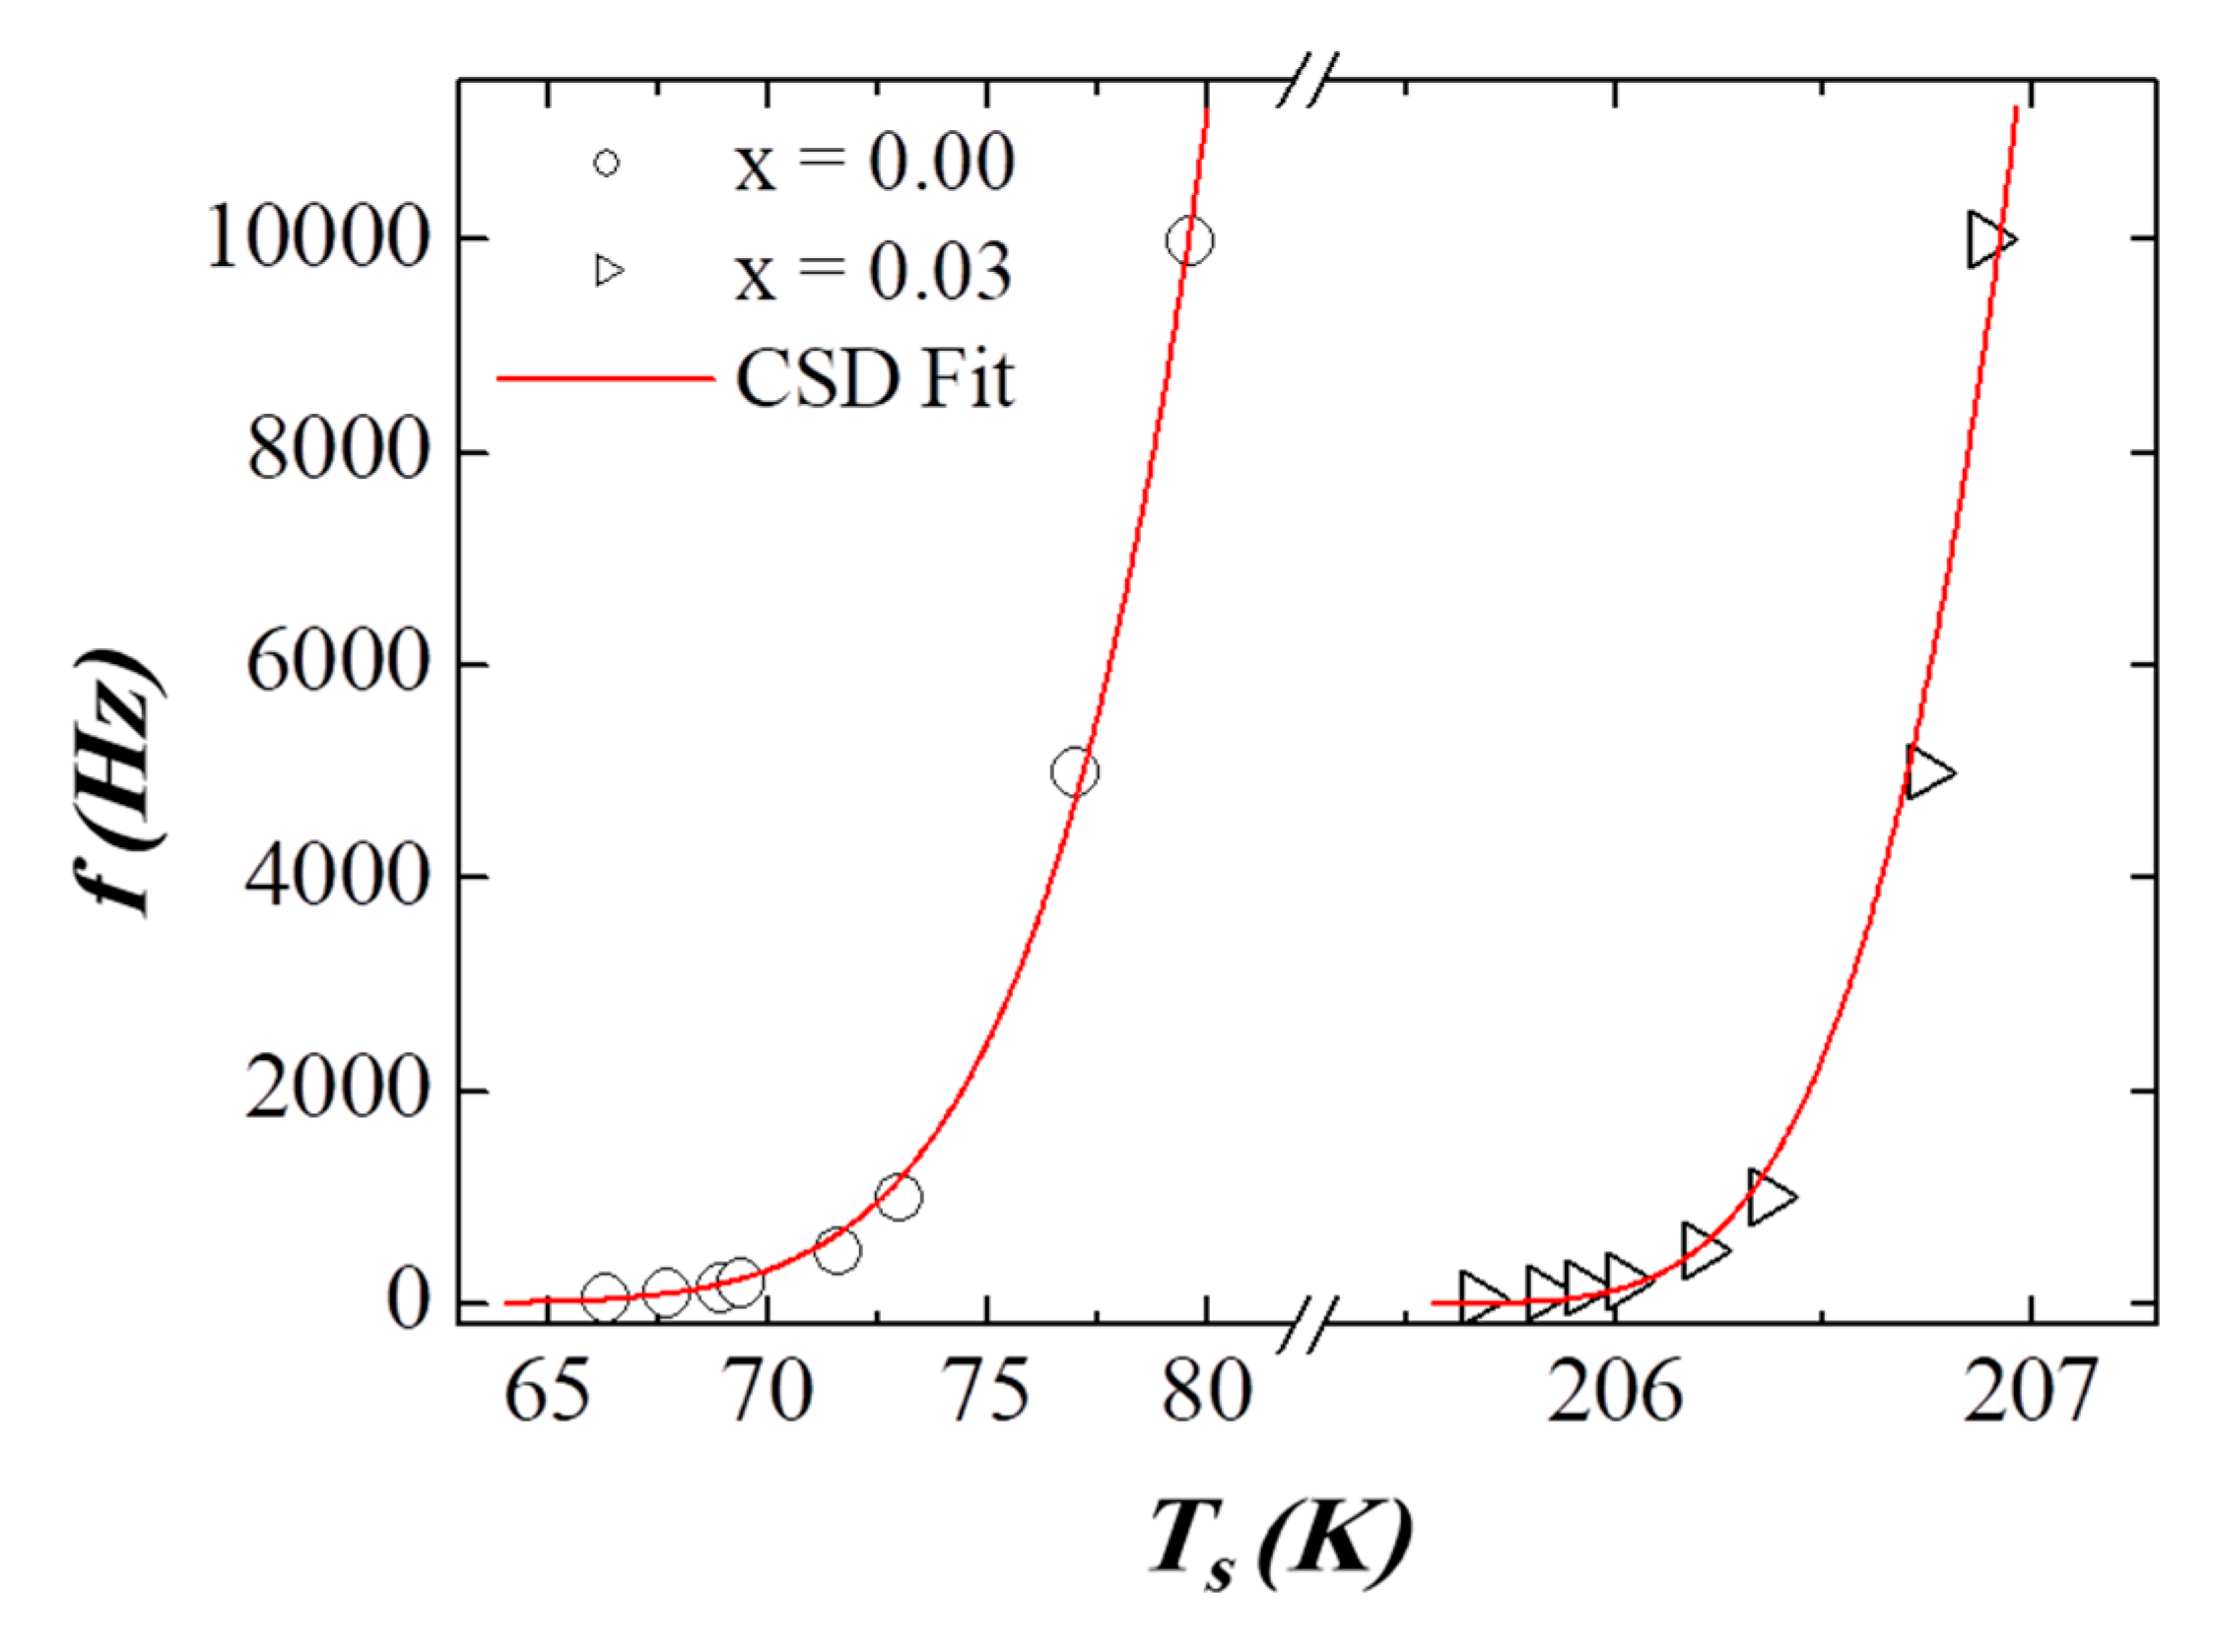
3.5. AC Susceptibility
4. Conclusions
Author Contributions
Funding
Acknowledgments
Conflicts of Interest
References
- Kavas, H.; Kasapoğlu, N.; Baykal, A.; Köseoğlu, Y. Characterization of NiFe2O4 nanoparticles synthesized by various methods. Chem. Pap. 2009, 63, 450–455. [Google Scholar] [CrossRef]
- Ati, A.A.; Othaman, Z.; Samavati, A. Influence of cobalt on structural and magnetic properties of nickel ferrite nanoparticles. J. Mol. Struct. 2013, 1052, 177–182. [Google Scholar] [CrossRef]
- Vigneswari, T.; Raji, P. Structural and magnetic properties of calcium doped nickel ferrite nanoparticles by co-precipitation method. J. Mol. Struct. 2017, 1127, 515–521. [Google Scholar] [CrossRef]
- Wahba, A.M.; Mohamed, M.B. Structural, magnetic, and dielectric properties of nanocrystalline Cr-substituted Co0.8Ni0.2Fe2O4 ferrite. Ceram. Int. 2014, 40, 6127–6135. [Google Scholar] [CrossRef]
- Sözeri, H.; Alveroğlu, E.; Kurtan, U.; Şenel, M.; Baykal, A. Cobalt substituted nickel ferrites via Pechini’s sol–gel citrate route: X-band electromagnetic characterization. J. Supercond. Nov. Magn. 2013, 26, 213–218. [Google Scholar]
- Mozaffari, M.; Amighian, J.; Darsheshdar, E. Magnetic and structural studies of nickel-substituted cobalt ferrite nanoparticles, synthesized by the sol–gel method. J. Magn. Magn. Mater. 2014, 350, 19–22. [Google Scholar] [CrossRef]
- Yaseneva, P.; Bowker, M.; Hutchings, G. Structural and magnetic properties of Zn-substituted cobalt ferrites prepared by co-precipitation method. Phys. Chem. Chem. Phys. 2011, 13, 18609. [Google Scholar] [CrossRef] [PubMed]
- Srinivasamurthy, K.; Angadi, V.; Kubrin, S.; Matteppanavar, S.; Kumar, P.M.; Rudraswamy, B. Evidence of enhanced ferromagnetic nature and hyperfine interaction studies of Ce-Sm doped Co-Ni ferrite nanoparticles for microphone applications. Ceram. Int. 2018, 44, 18878–18885. [Google Scholar] [CrossRef]
- Stergiou, C. Magnetic, dielectric and microwave absorption properties of rare earth doped Ni–Co and Ni–Co–Zn spinel ferrites. J. Magn. Magn. Mater. 2017, 426, 629–635. [Google Scholar] [CrossRef]
- Boda, N.; Boda, G.; Naidu, K.C.B.; Srinivas, M.; Batoo, K.M.; Ravinder, D.; Reddy, A.P. Effect of rare earth elements on low temperature magnetic properties of Ni and Co-ferrite nanoparticles. J. Magn. Magn. Mater. 2019, 473, 228–235. [Google Scholar] [CrossRef]
- Singh, R.K.; Shah, J.; Kotnala, R. Magnetic and dielectric properties of rare earth substituted Ni0.5Zn0.5Fe1.95R0.05O4 (R = Pr, Sm and La) ferrite nanoparticles. Mater. Sci. Eng. B 2016, 210, 64–69. [Google Scholar] [CrossRef]
- Akhtar, M.N.; Khan, M.A. Effect of rare earth doping on the structural and magnetic features of nanocrystalline spinel ferrites prepared via sol gel route. J. Magn. Magn. Mater. 2018, 460, 268–277. [Google Scholar] [CrossRef]
- Sahariya, J.; Mund, H.S.; Sharma, A.; Dashora, A.; Itou, M.; Sakurai, Y.; Ahuja, B.L. Magnetic properties of NiFe2−xRExO4 (RE=Dy, Gd) using magnetic Compton scattering. J. Magn. Magn. Mater. 2014, 360, 113–117. [Google Scholar] [CrossRef]
- Bharathi, K.K.; Noor-A-Alam, M.; Vemuri, R.; Ramana, C.V. Correlation between microstructure, electrical and optical properties of nanocrystalline NiFe1.925 Dy0.075 O4 thin films. RSC Adv. 2012, 2, 941–948. [Google Scholar] [CrossRef]
- Almessiere, M.; Slimani, Y.; Güner, S.; Baykal, A.; Ercan, I. Effect of dysprosium substitution on magnetic and structural properties of NiFe2O4 nanoparticles. J. Rare Earths 2019. [Google Scholar] [CrossRef]
- Chawla, S.K.; Meena, S.S.; Kaur, P.; Mudsainiyan, R.K.; Yusuf, S.M. Effect of site preferences on structural and magnetic switching Properties of Co–Zr doped strontium hexaferrite SrCoxZrxFe(12-2x)O19. J. Magn. Magn. Mater. 2015, 378, 84–91. [Google Scholar] [CrossRef]
- Joseyphus, R.J.; Narayanasamy, A.; Shinoda, K.; Jeyadevan, B.; Tohji, K. Synthesis and magnetic properties of the size-controlled Mn–Zn ferrite nanoparticles by oxidation method. J. Phys. Chem. Solids 2006, 67, 1510–1517. [Google Scholar] [CrossRef]
- Chae, K.P.; Kwon, W.H.; Lee, J.-G. Influence of aluminum doping in Li–Co–Ti ferrite. J. Magn. Magn. Mater. 2012, 324, 2701–2705. [Google Scholar] [CrossRef]
- Kumar, H.; Sing, J.P.; Srivastava, R.C.; Patel, K.R.; Chae, K.H. Synthesis and characterization of DyxCoFe2−xO4 nanoparticles. Superlattices Microstruct. 2017, 109, 296–306. [Google Scholar] [CrossRef]
- Kumar, H.; Srivastava, R.; Singh, J.P.; Negi, P.; Agrawal, H.; Das, D.; Chae, K.H. Structural and magnetic study of dysprosium substituted cobalt ferrite nanoparticles. J. Magn. Magn. Mater. 2016, 401, 16–21. [Google Scholar] [CrossRef]
- Morales, M.-B.; Phan, M.-H.; Pal, S.; Frey, N.-A.; Srikanth, H. Particle blocking and carrier fluid freezing effects on the magnetic properties of Fe3O4-based ferrofluids. J. Appl. Phys. 2009, 105, 07B511. [Google Scholar] [CrossRef]
- Humbe, A.V.; Kounsalye, J.S.; Shisode, M.V.; Jadhav, K. Rietveld refinement, morphology and superparamagnetism of nanocrystalline Ni0.70−xCuxZn0.30Fe2O4 spinel ferrite. Ceram. Int. 2018, 44, 5466–5472. [Google Scholar] [CrossRef]
- Graham, C.D. Introduction to Magnetic Materials; Wiley: Hoboken, NJ, USA, 2009. [Google Scholar]
- Bhowmik, R.; Aneeshkumar, K. Low temperature ferromagnetic properties, magnetic field induced spin order and random spin freezing effect in Ni1.5Fe1.5O4 ferrite; prepared at different pH values and annealing temperatures. J. Magn. Magn. Mater. 2018, 460, 177–187. [Google Scholar] [CrossRef]
- Ajroudi, L.; Mliki, N.; Bessais, L.; Madigou, V.; Villain, S.; Leroux, C.; Leroux, C. Magnetic, electric and thermal properties of cobalt ferrite nanoparticles. Mater. Res. Bull. 2014, 59, 49–58. [Google Scholar] [CrossRef] [Green Version]
- Peddis, D.; Cannas, C.; Piccaluga, G.; Agostinelli, E.; Fiorani, D. Surface spin freezing effects on enhanced saturation magnetization and magnetic anisotropy in CoFe2O4 nanoparticles. Nanotechnology 2010, 21, 125705. [Google Scholar] [CrossRef]
- Chen, X.; Bedanta, S.; Petracic, O.; Kleemann, W.; Sahoo, S.; Cardoso, S.; Freitas, P.P.; Freitas, P. Superparamagnetism versus superspin glass behavior in dilute magnetic nanoparticle systems. Physica B 2005, 72, 214436. [Google Scholar] [CrossRef]
- Zeb, F.; Sarwer, W.; Nadeem, K.; Kamran, M.; Mumtaz, M.; Krenn, H.; Letofsky-Papst, I. Surface spin-glass in cobalt ferrite nanoparticles dispersed in silica matrix. J. Magn. Magn. Mater. 2016, 407, 241–246. [Google Scholar] [CrossRef]
- Almessiere, M.A.; Slimani, Y.; Güngüneş, H.; Baykal, A.; Trukhanov, S.V.; Trukhanov, A.V. Manganese/Yttrium Codoped Strontium Nanohexaferrites: Evaluation of Magnetic Susceptibility and Mossbauer Spectra. Nanomaterials 2019, 9, 24. [Google Scholar] [CrossRef]
- Slimani, Y.; Almessiere, M.; Baykal, A. AC susceptibility study of Cu substituted BaFe12O19 nanohexaferrites. Ceram. Int. 2018, 44, 13097–13105. [Google Scholar] [CrossRef]
- Kumar, D.; Banerjee, A. A critical examination of magnetic states of La0.5Ba0.5CoO3: Non-Griffiths phase and interacting ferromagnetic-clusters. arXiv 2012, arXiv:1211.4936. [Google Scholar]
- Suzuki, M.; Fullem, S.I.; Suzuki, I.S.; Wang, L.; Zhong, C.-J. Observation of superspin-glass behavior inFe3O4nanoparticles. Phys. B 2009, 79, 024418. [Google Scholar] [CrossRef]
- Fiorani, D.; Testa, A.M.; Lucari, F.; D’Orazio, F.; Romero, H. Magnetic properties of maghemite nanoparticle systems: Surface anisotropy and interparticle interaction effects. B: Condens. Matter 2002, 320, 122–126. [Google Scholar] [CrossRef]
- Rahimi, M.; Kameli, P.; Ranjbar, M.; Salamati, H. The effect of polyvinyl alcohol (PVA) coating on structural, magnetic properties and spin dynamics of Ni0.3Zn0.7Fe2O4 ferrite nanoparticles. J. Magn. Magn. Mater. 2013, 347, 139–145. [Google Scholar] [CrossRef]
- Eshraghi, M.; Kameli, P. Structural and Magnetic Properties of La0.9Sr0.1MnO3 Micro and Nanometer-Sized Manganite Samples. J. Mater. Sci. 2014, 3, 1. [Google Scholar]

| x | a (Å) | V (Å3) | DXRD (nm) |
|---|---|---|---|
| 0.00 | 8.3378 | 579.6451 | 34.7 |
| 0.01 | 8.3397 | 580.0333 | 33.1 |
| 0.03 | 8.3413 | 580.3630 | 34.7 |
| 0.05 | 8.3424 | 580.3463 | 30.8 |
| 0.07 | 8.3473 | 579.3824 | 32.3 |
| 0.09 | 8.3470 | 579.9142 | 33.1 |
| 0.10 | 8.3473 | 580.9998 | 24.3 |
| x | Assignment of Sites | I.S. (±0.002) (mm/s) | Q.S. (±0.004) (mm/s) | Bhf (±0.02) (T) | W (±0.01) (mm/s) | RA (%) | Cation Distribution |
|---|---|---|---|---|---|---|---|
| 0.01 | Sx-A: Fe3+ | 0.368 | 0.005 | 52.045 | 0.218 | 17.298 | (Ni0.65Fe0.35)A [Ni0.35 Dy0.01Fe1.64]BO4 |
| Sx-B: Fe3+ | 0.438 | 0.097 | 49.407 | 0.401 | 35.575 | ||
| Sx-B1: Fe3+ | 0.202 | 0.011 | 48.566 | 0.37 | 46.375 | ||
| Db: Fe+3+ | 0.226 | 0.717 | − | 0.399 | 0.752 | ||
| 0.03 | Sx-A: Fe3+ | 0.364 | 0 | 52.009 | 0.205 | 17.358 | (Ni0.66Fe0.34)A [Ni0.34Dy0.03Fe1.63]BO4 |
| Sx-B: Fe3+ | 0.455 | 0.119 | 49.337 | 0.383 | 34.389 | ||
| Sx-B1: Fe3+ | 0.204 | 0.09 | 48.55 | 0.38 | 48.253 | ||
| 0.05 | Sx-A: Fe3+ | 0.365 | 0.008 | 51.941 | 0.257 | 16.783 | (Ni0.67Fe0.33)A [Ni0.33Dy0.05Fe1.62]BO4 |
| Sx-B: Fe3+ | 0.438 | 0.071 | 49.379 | 0.395 | 35.528 | ||
| Sx-B1: Fe3+ | 0.231 | −0.018 | 48.559 | 0.402 | 47.689 | ||
| 0.07 | Sx-A: Fe3+ | 0.366 | −0.008 | 52.057 | 0.242 | 17.866 | (Ni0.65Fe0.35)A [Ni0.35Dy0.07Fe1.58]BO4 |
| Sx-B: Fe3+ | 0.464 | 0.072 | 49.737 | 0.466 | 25.675 | ||
| Sx-B1: Fe3+ | 0.218 | −0.023 | 48.76 | 0.422 | 54.952 | ||
| Db: Fe3+ | 0.345 | 0.625 | − | 0.725 | 1.5067 | ||
| 0.09 | Sx-A: Fe3+ | 0.365 | 0.004 | 52.119 | 0.219 | 19.981 | (Ni0.62Fe0.38)A [Ni0.38Dy0.09Fe1.53]BO4 |
| Sx-B: Fe3+ | 0.424 | 0.066 | 49.614 | 0.445 | 35.589 | ||
| Sx-B1: Fe3+ | 0.209 | −0.005 | 48.766 | 0.394 | 45.43 | ||
| 0.10 | Sx-A: Fe3+ | 0.37 | −0.004 | 52.123 | 0.239 | 20.331 | (Ni0.6Fe0.4)A [Ni0.4Dy0.1Fe1.5]BO4 |
| Sx-B: Fe3+ | 0.441 | 0.053 | 49.544 | 0.397 | 31.53 | ||
| Sx-B1: Fe3+ | 0.198 | −0.02 | 48.825 | 0.413 | 46.22 | ||
| Db: Fe3+ | 0.379 | 0.481 | − | 0.696 | 1.9186 |
| Models | Parameters | Values | |||
|---|---|---|---|---|---|
| Peak (TB) | Peak (TS) | ||||
| x = 0.00 | x = 0.03 | x = 0.00 | x = 0.03 | ||
| Neel–Arrhenius | (s) | 1.05 × 10−70 | 1.68 × 10⁻³² | 1.69 × 10⁻¹⁶ | 1.26 × 10−392 |
| (K) | 49,083 | 17,403 | 2150 | 184,793 | |
| (erg/cm3) | 3.09 × 10⁵ | 1.09 × 10⁵ | 1.35 × 10⁴ | 1.16 × 10⁶ | |
| Vogel–Fulcher | (s) | 5.45 × 10⁻¹⁰ | 1.32 × 10⁻⁹ | 8.00 × 10⁻⁷ | 6.06 × 10−46 |
| (K) | 367.57 | 621.53 | 100.38 | 2188.95 | |
| (K) | 292.71 | 216.76 | 58.82 | 183.84 | |
| (erg/cm3) | 2.32 × 10³ | 3.92 × 10³ | 6.34 × 10² | 1.38 × 10⁴ | |
| Critical slowing down | (s) | **** | **** | 2.88 × 10⁻⁹ | 2.50 × 10⁻¹² |
| (K) | **** | **** | 58.39 | 205.55 | |
| **** | **** | 5.77 | 3.95 | ||
© 2019 by the authors. Licensee MDPI, Basel, Switzerland. This article is an open access article distributed under the terms and conditions of the Creative Commons Attribution (CC BY) license (http://creativecommons.org/licenses/by/4.0/).
Share and Cite
Almessiere, M.A.; Slimani, Y.; Güngüneş, H.; Ali, S.; Manikandan, A.; Ercan, I.; Baykal, A.; Trukhanov, A.V. Magnetic Attributes of NiFe2O4 Nanoparticles: Influence of Dysprosium Ions (Dy3+) Substitution. Nanomaterials 2019, 9, 820. https://doi.org/10.3390/nano9060820
Almessiere MA, Slimani Y, Güngüneş H, Ali S, Manikandan A, Ercan I, Baykal A, Trukhanov AV. Magnetic Attributes of NiFe2O4 Nanoparticles: Influence of Dysprosium Ions (Dy3+) Substitution. Nanomaterials. 2019; 9(6):820. https://doi.org/10.3390/nano9060820
Chicago/Turabian StyleAlmessiere, Munirah Abdullah, Y. Slimani, H. Güngüneş, S. Ali, A. Manikandan, I. Ercan, A. Baykal, and A.V. Trukhanov. 2019. "Magnetic Attributes of NiFe2O4 Nanoparticles: Influence of Dysprosium Ions (Dy3+) Substitution" Nanomaterials 9, no. 6: 820. https://doi.org/10.3390/nano9060820
APA StyleAlmessiere, M. A., Slimani, Y., Güngüneş, H., Ali, S., Manikandan, A., Ercan, I., Baykal, A., & Trukhanov, A. V. (2019). Magnetic Attributes of NiFe2O4 Nanoparticles: Influence of Dysprosium Ions (Dy3+) Substitution. Nanomaterials, 9(6), 820. https://doi.org/10.3390/nano9060820