Highly Optimized Nitrogen-Doped MWCNTs through In-Depth Parametric Study Using Design of Experiments


Abstract
1. Introduction
2. Materials and Methods
2.1. Materials
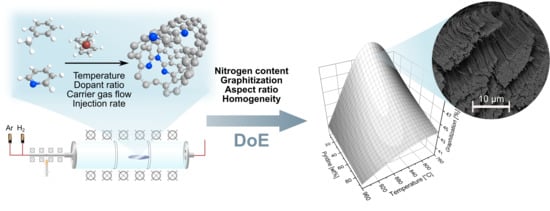
2.2. Synthesis of Nitrogen-Doped MWCNTs
2.3. Sample Characterization
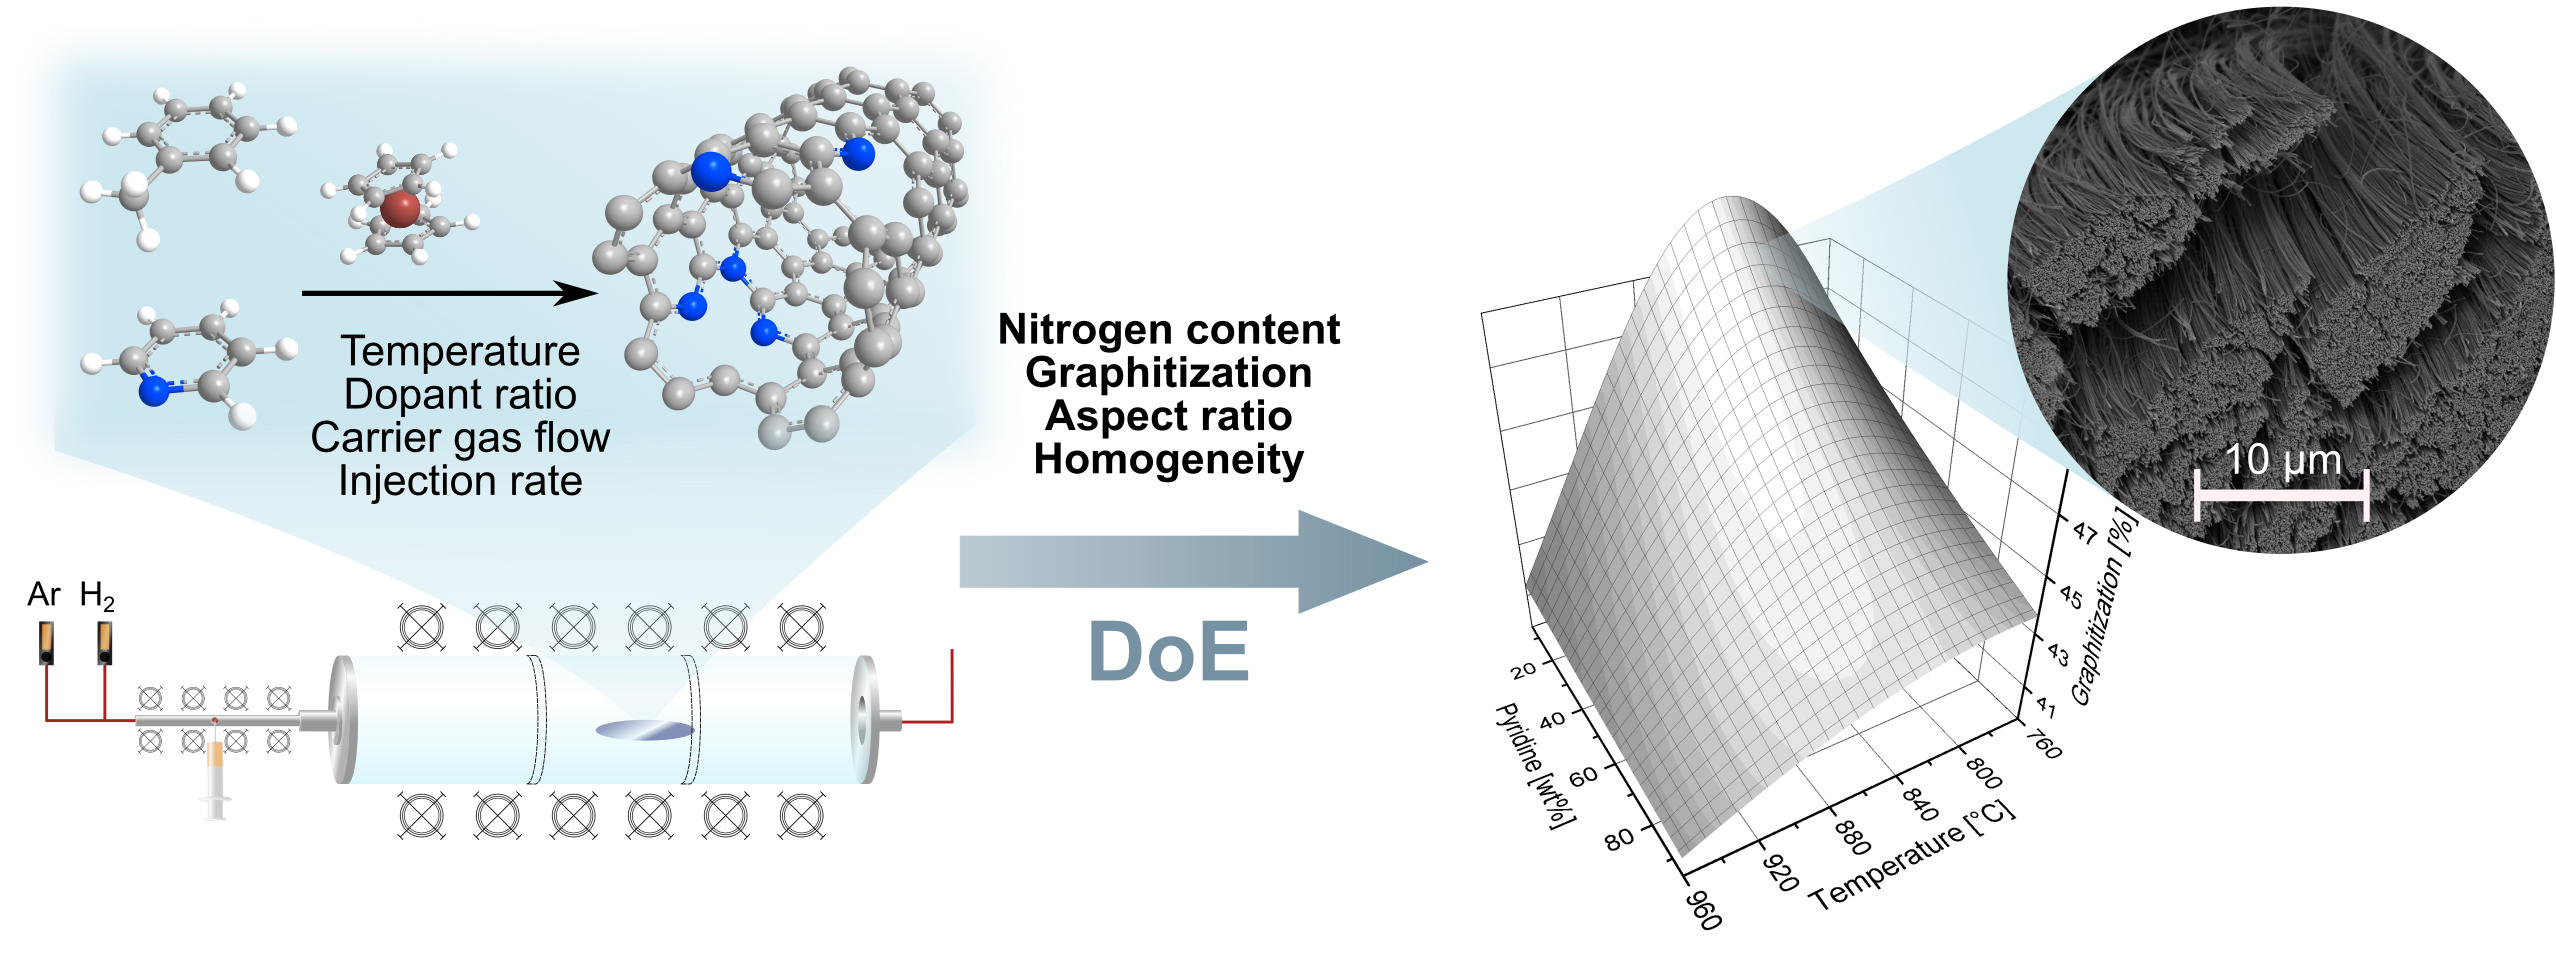
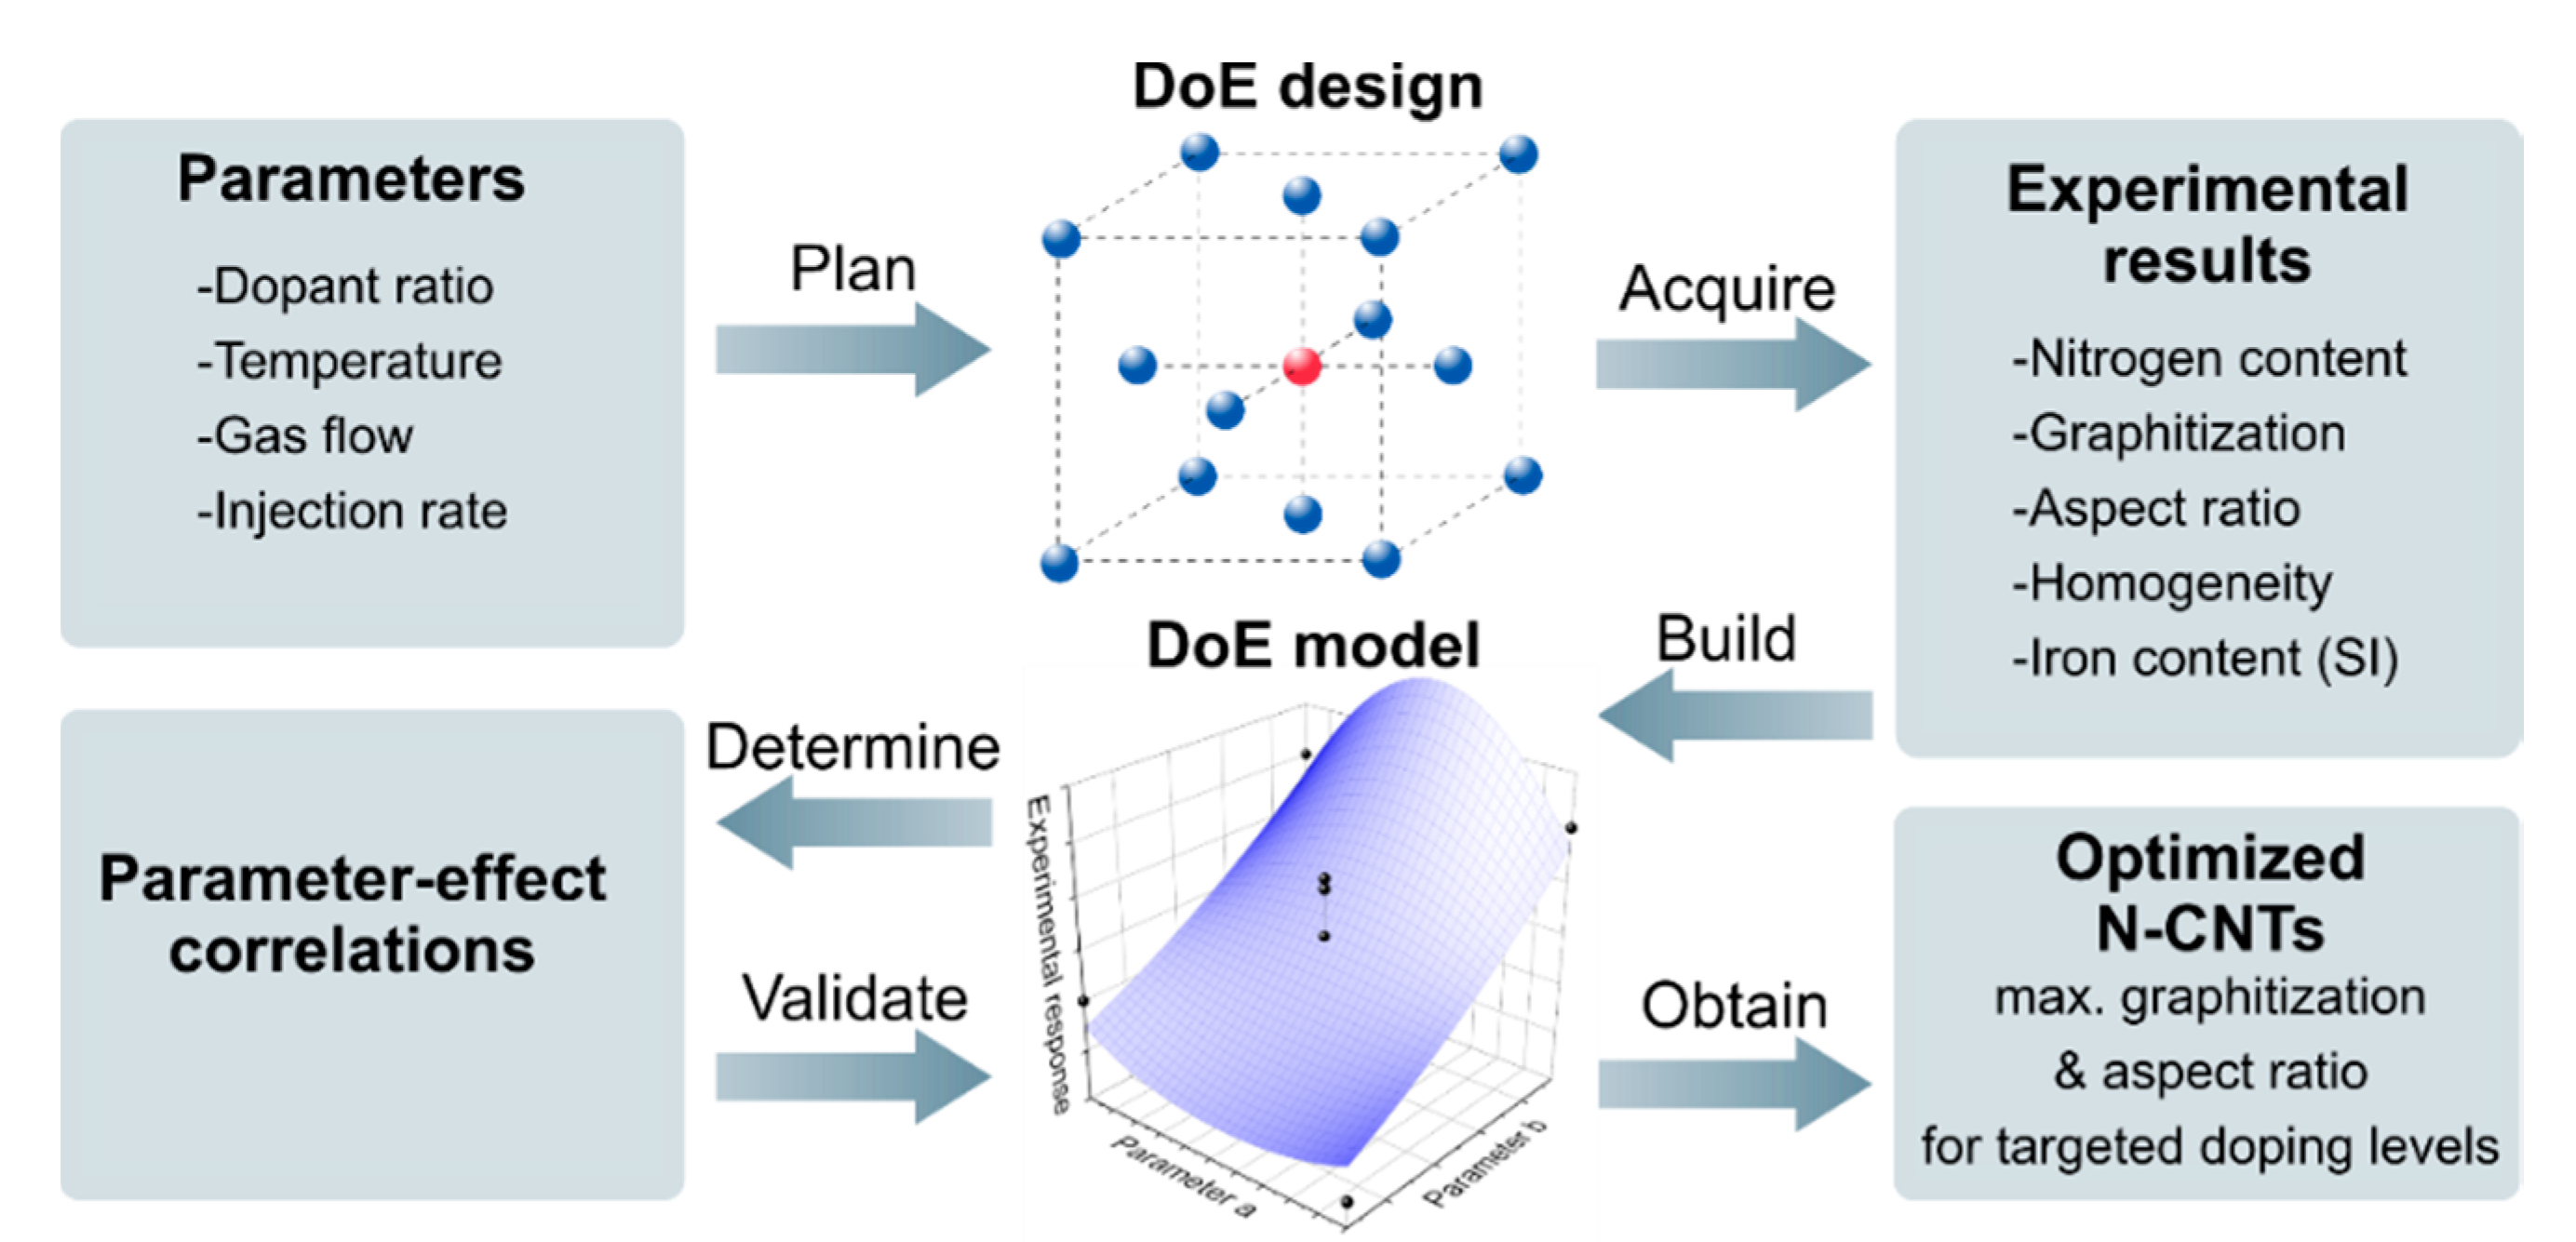
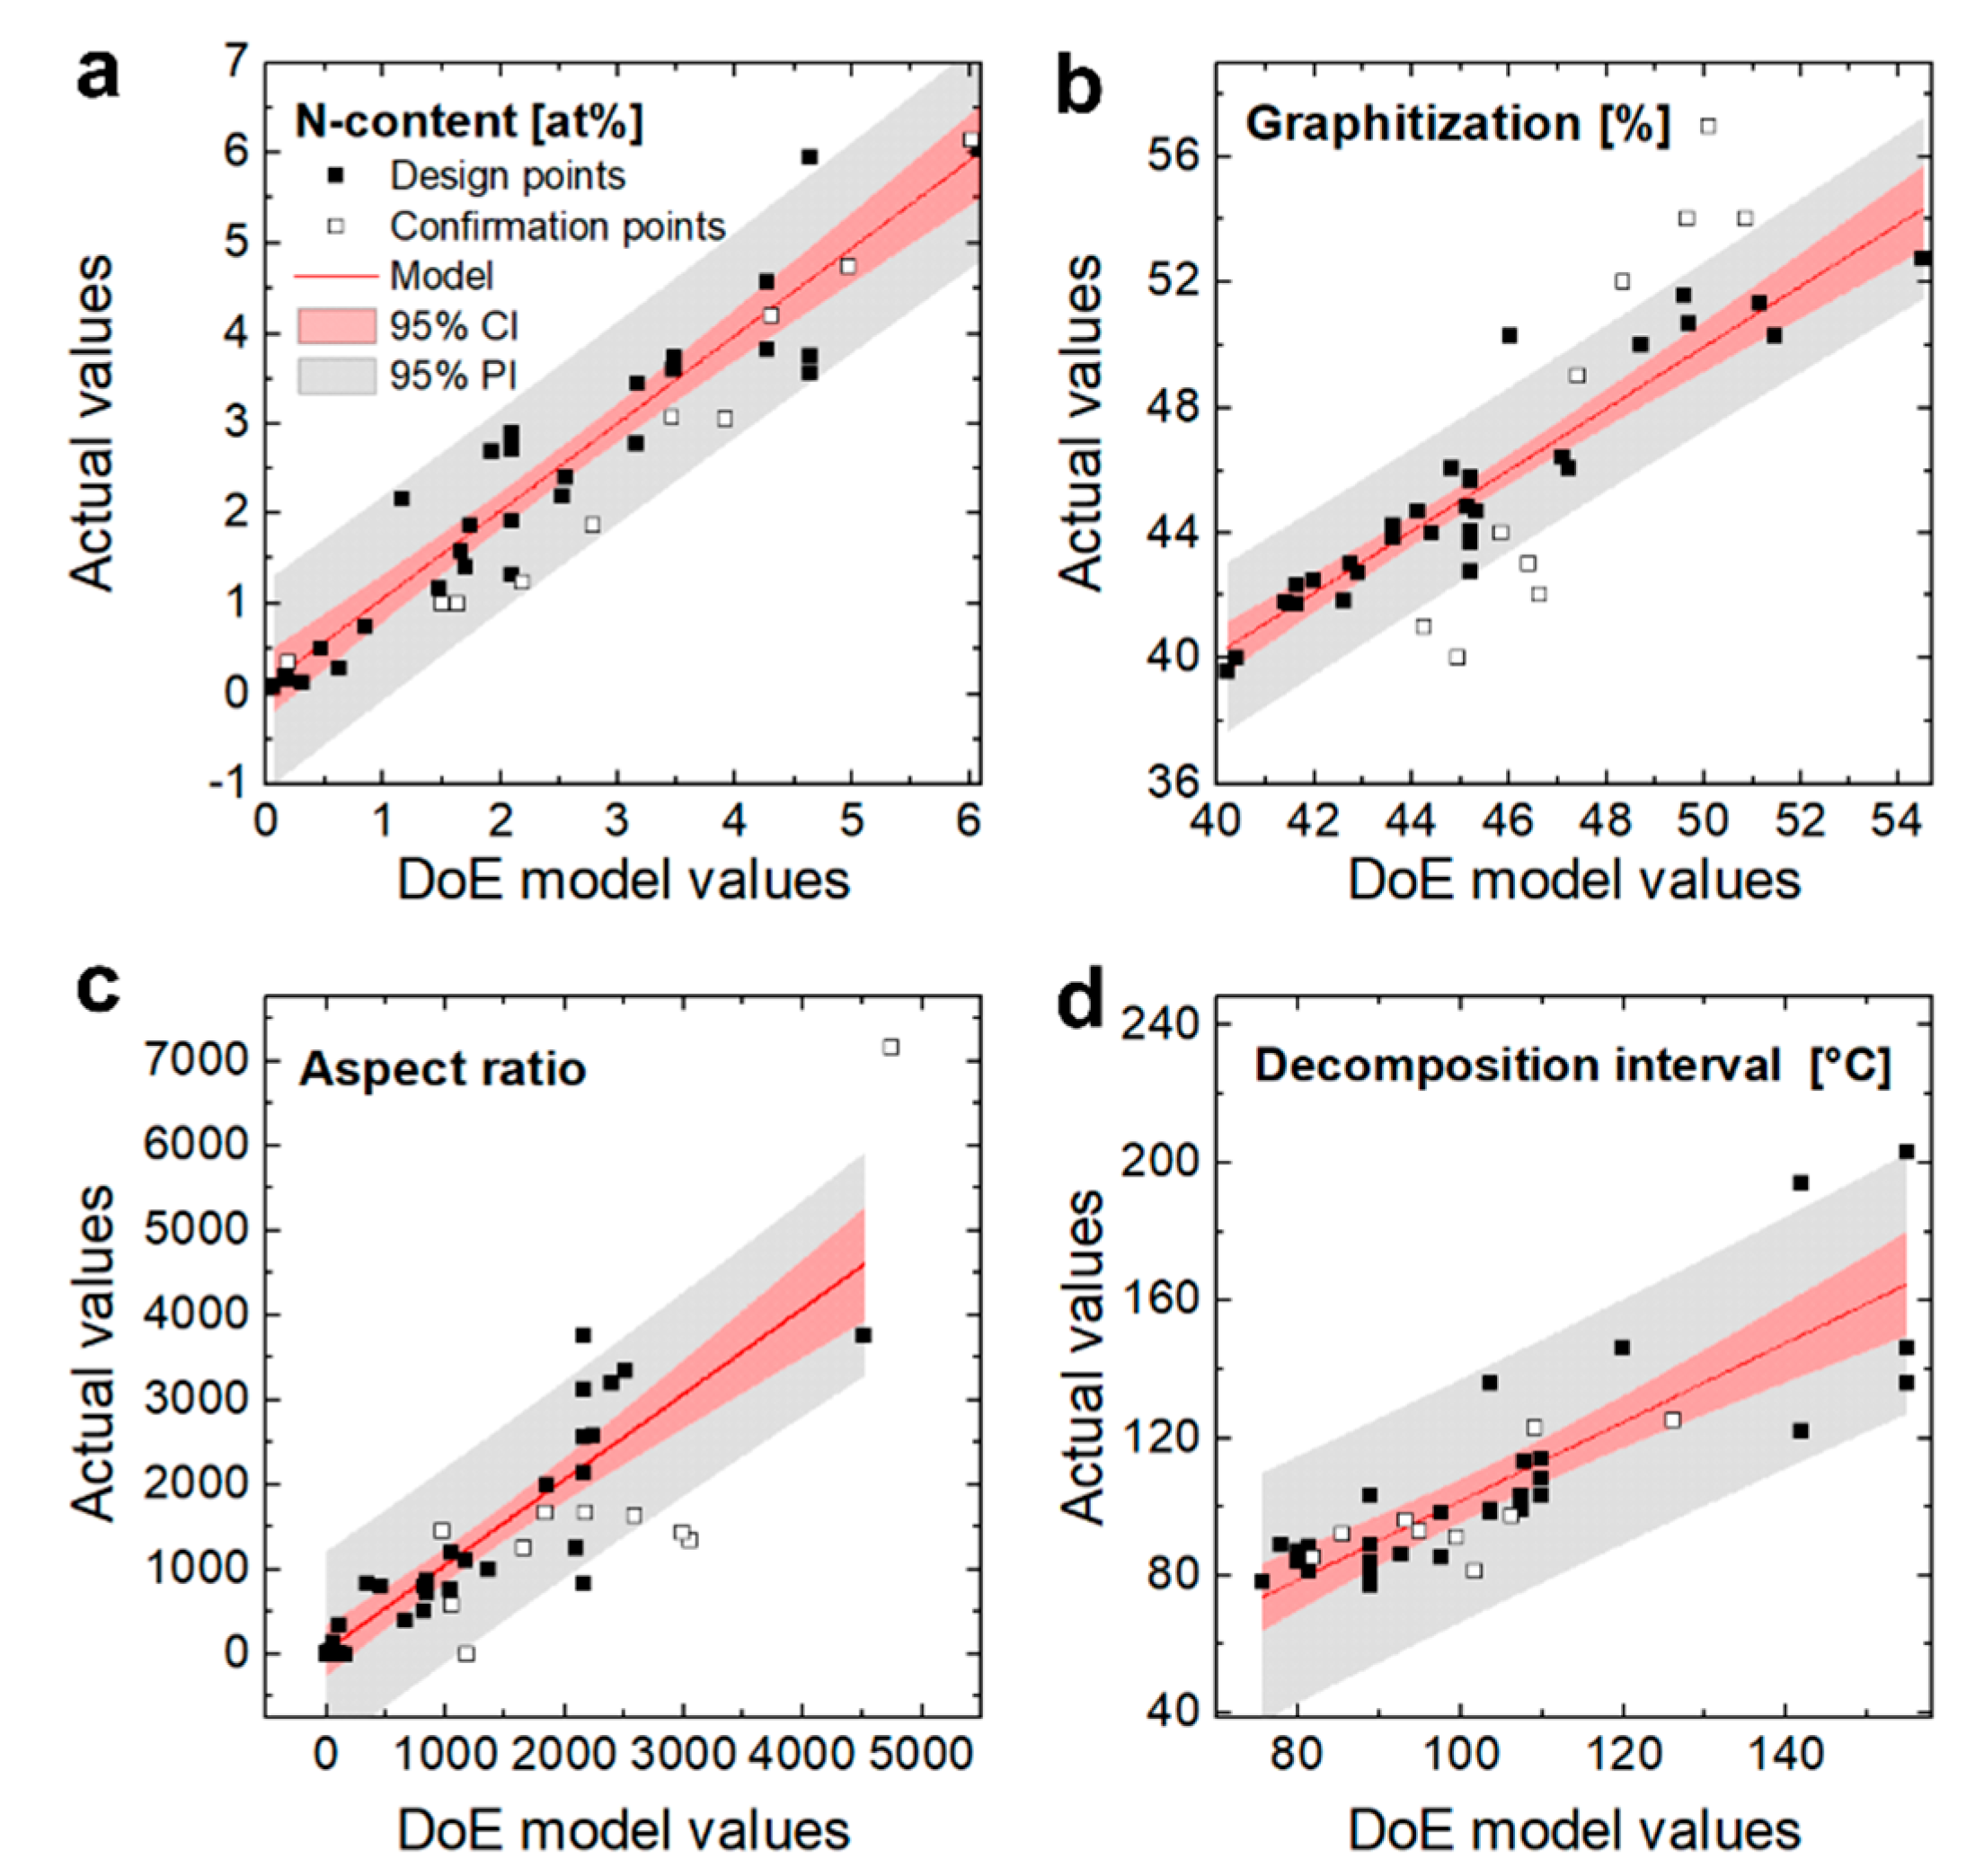
2.4. Design of Experiments and Model Calculation
3. Results and Discussion
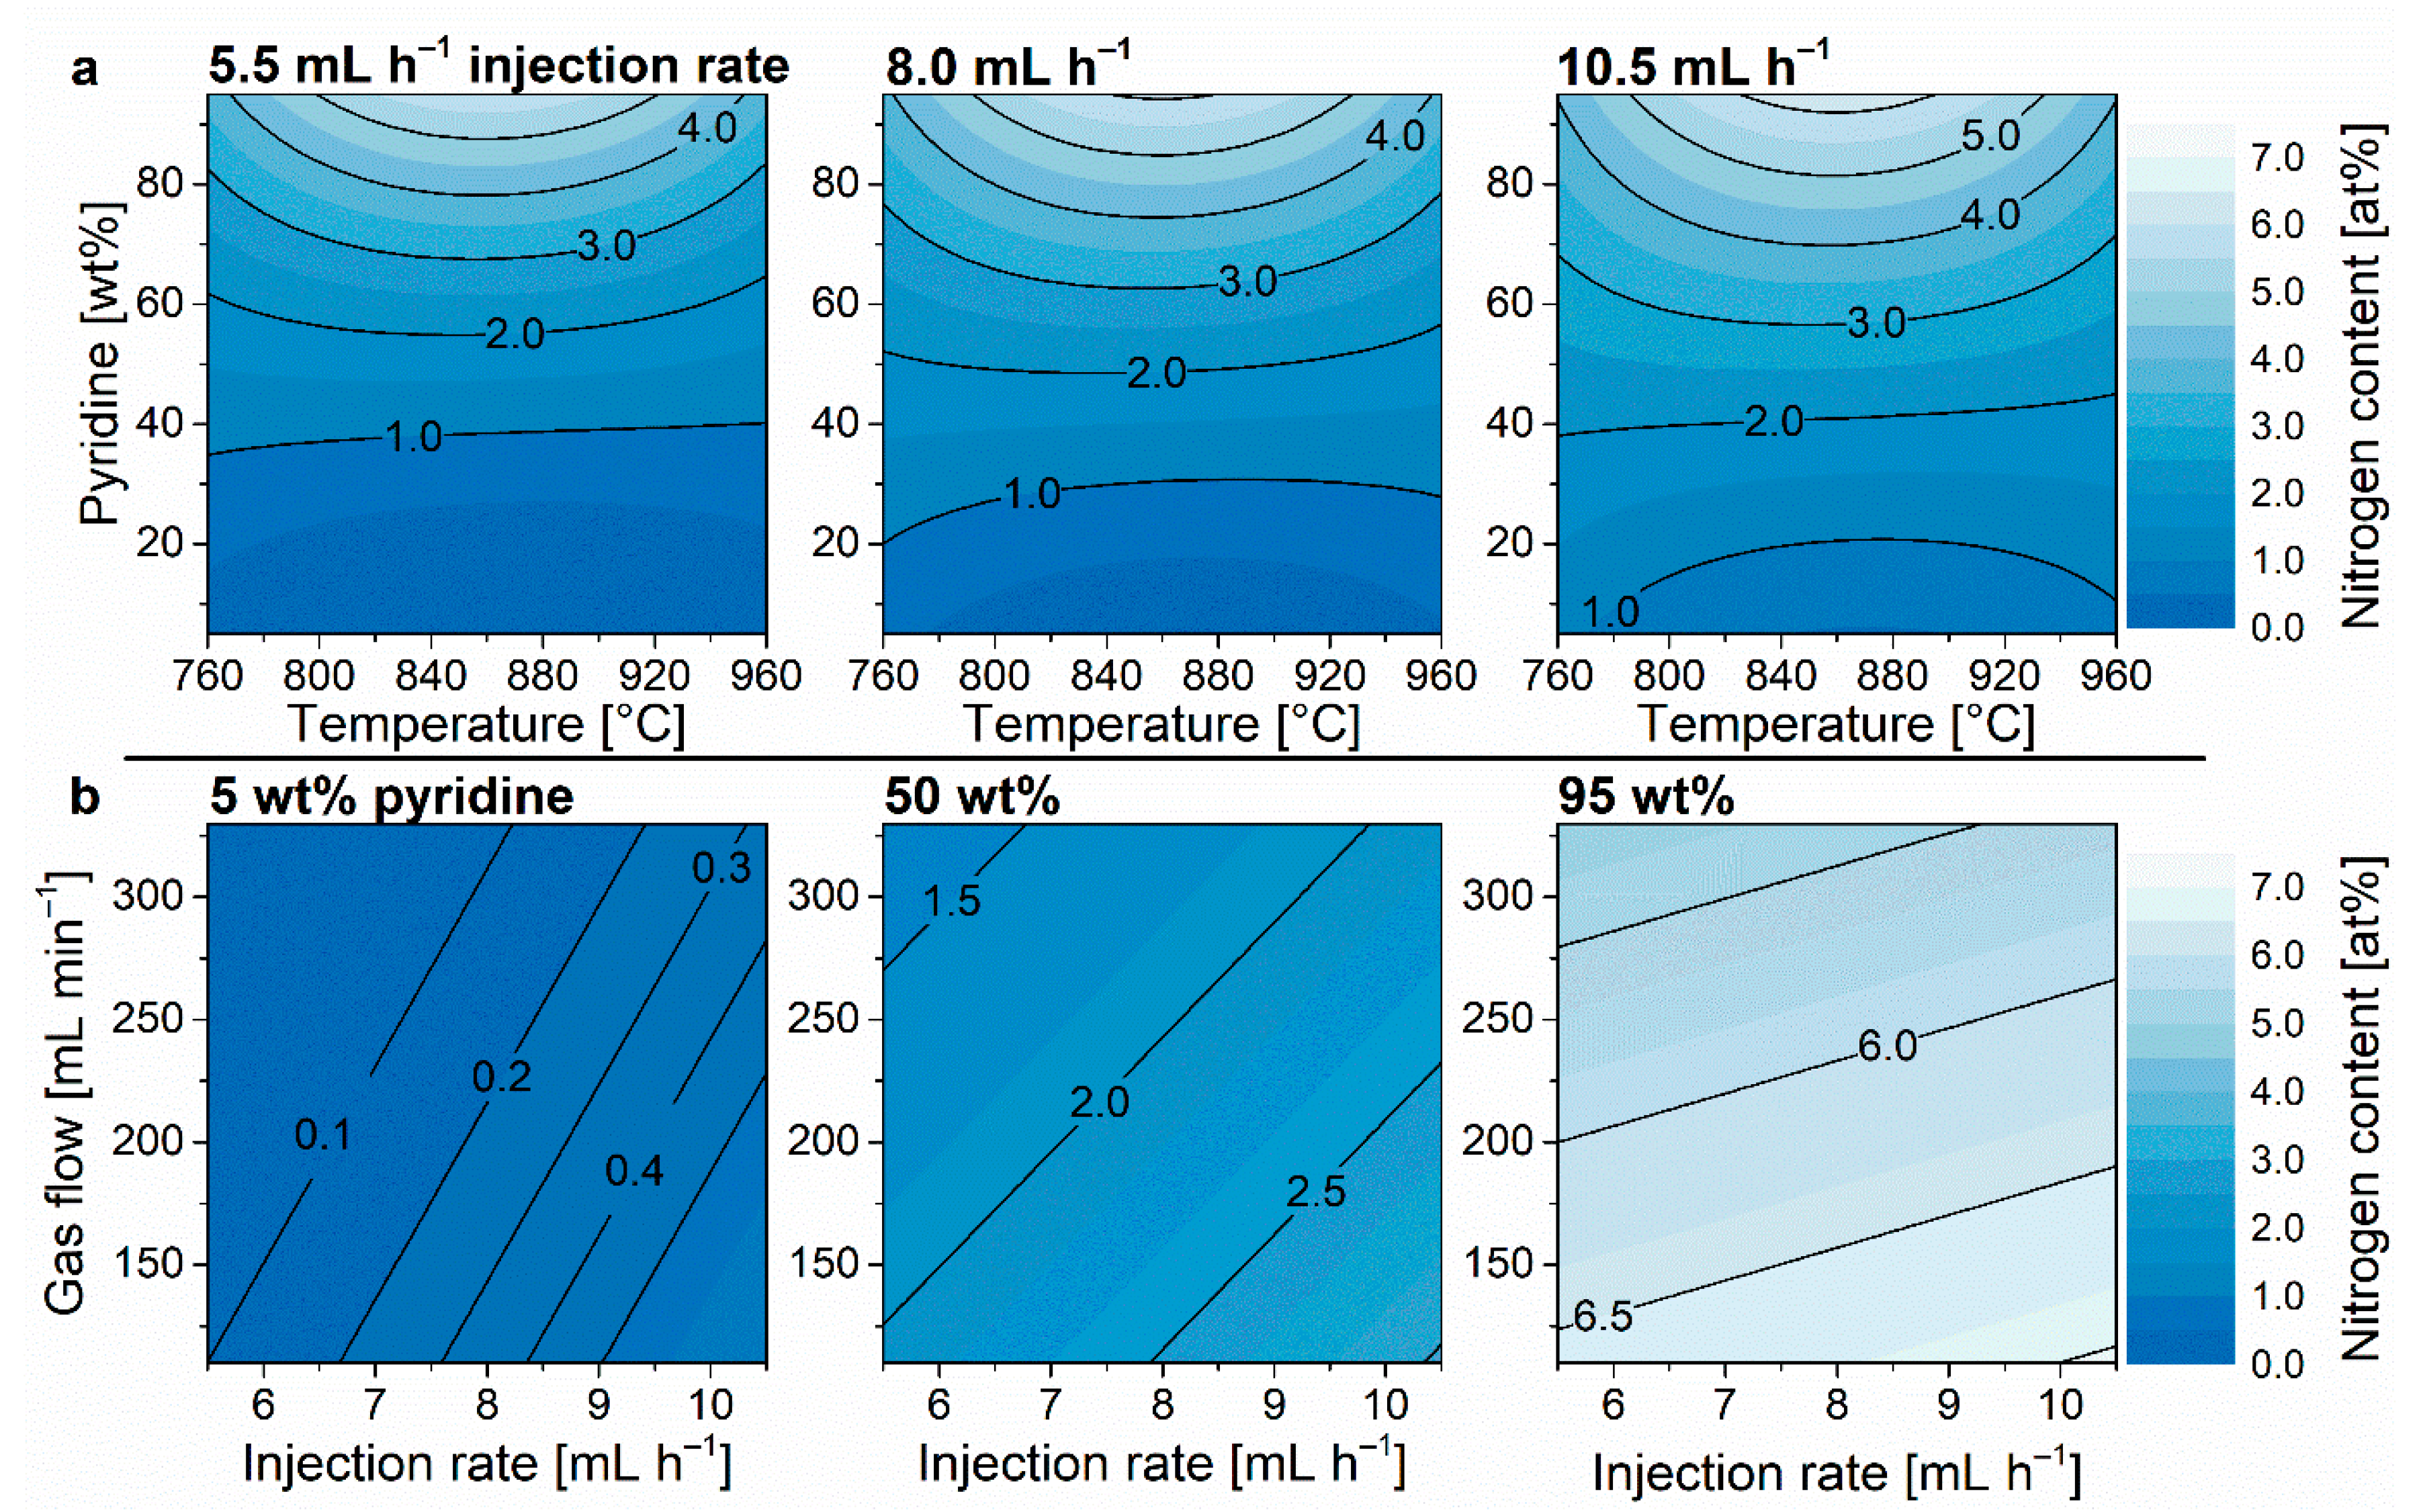
3.1. Nitrogen Content
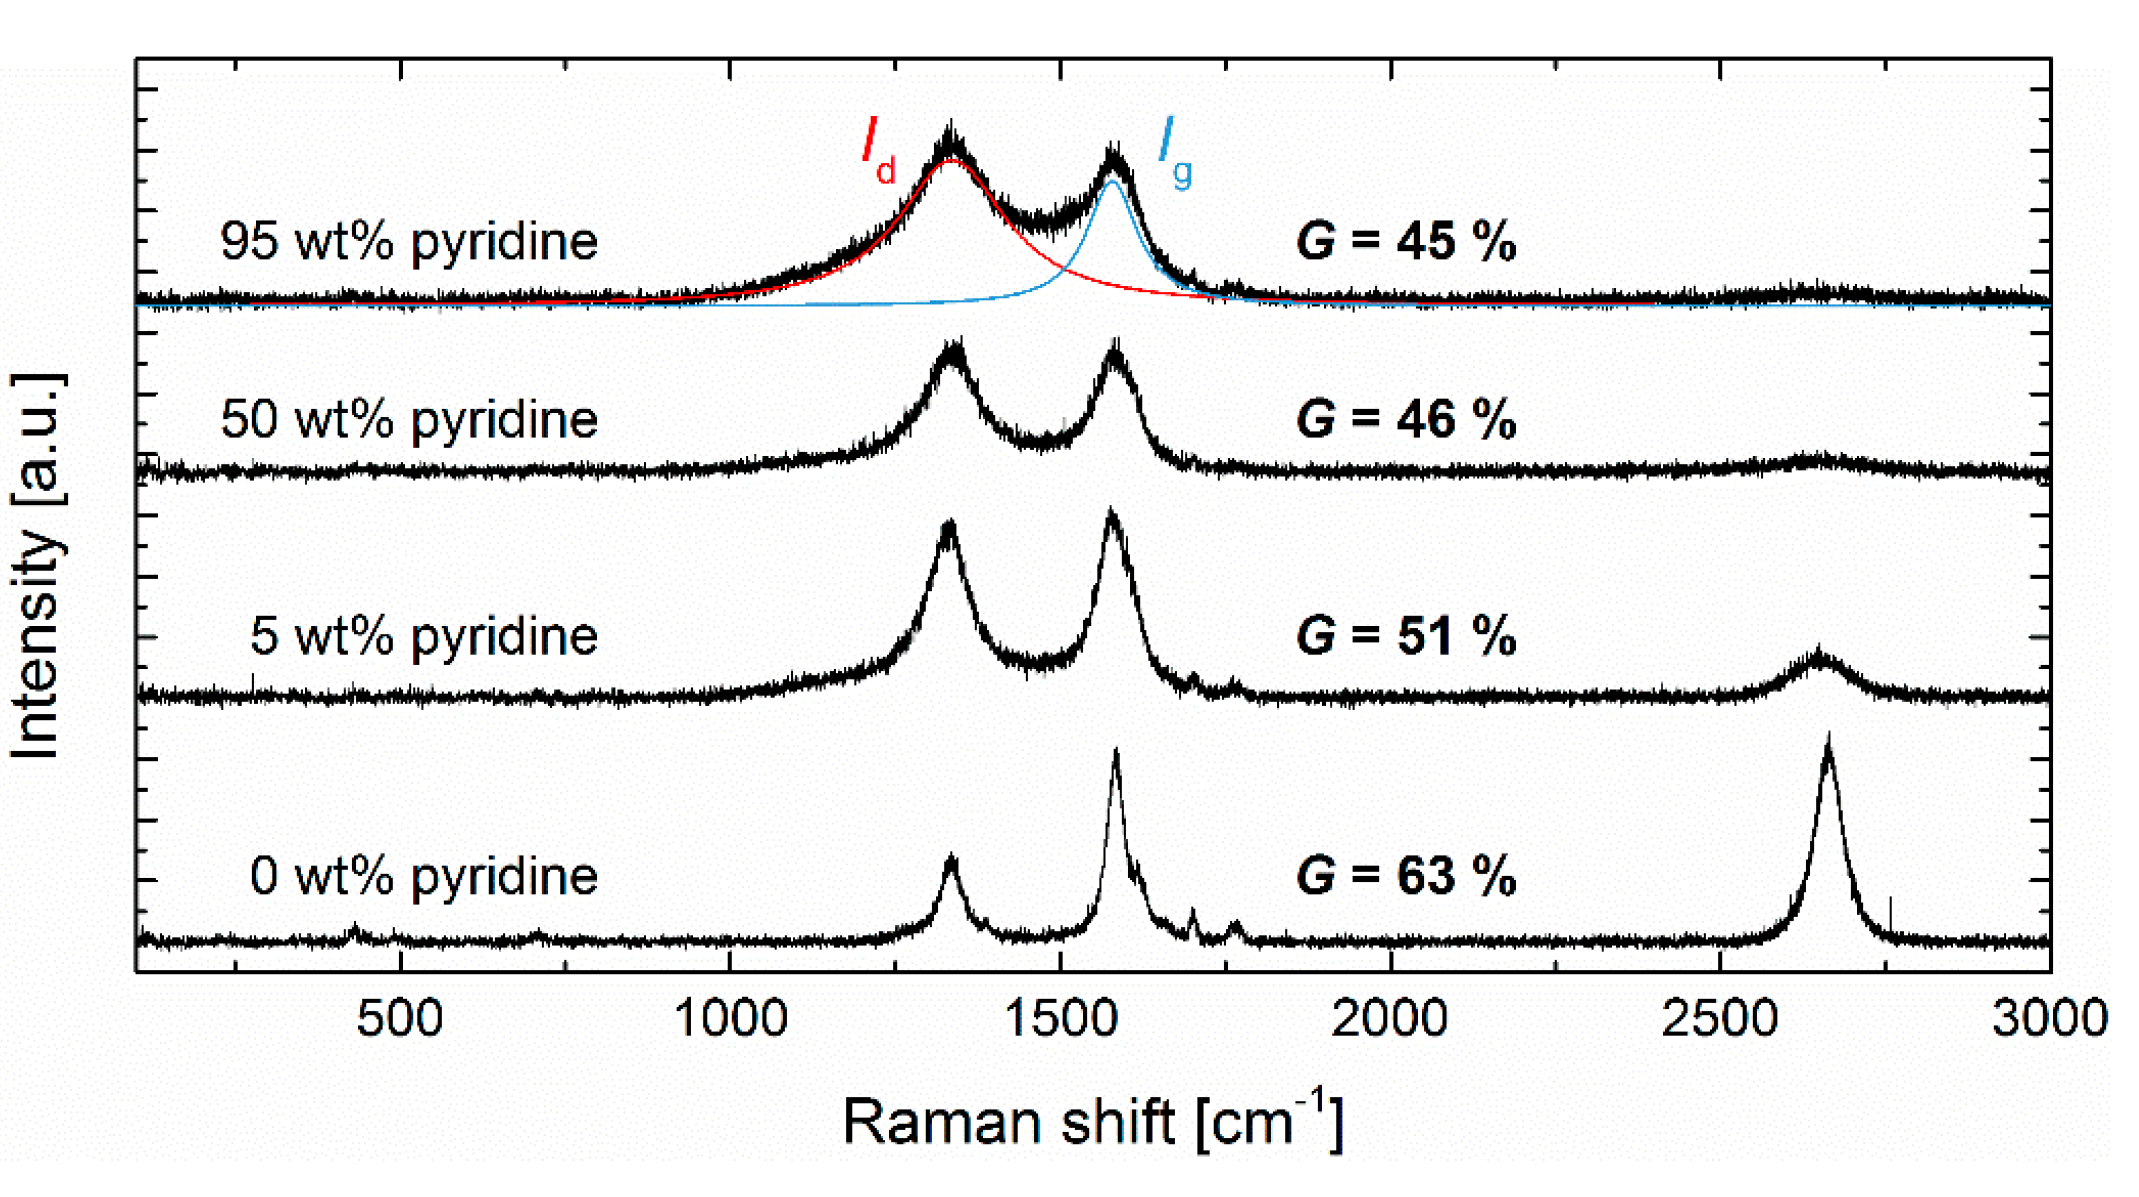
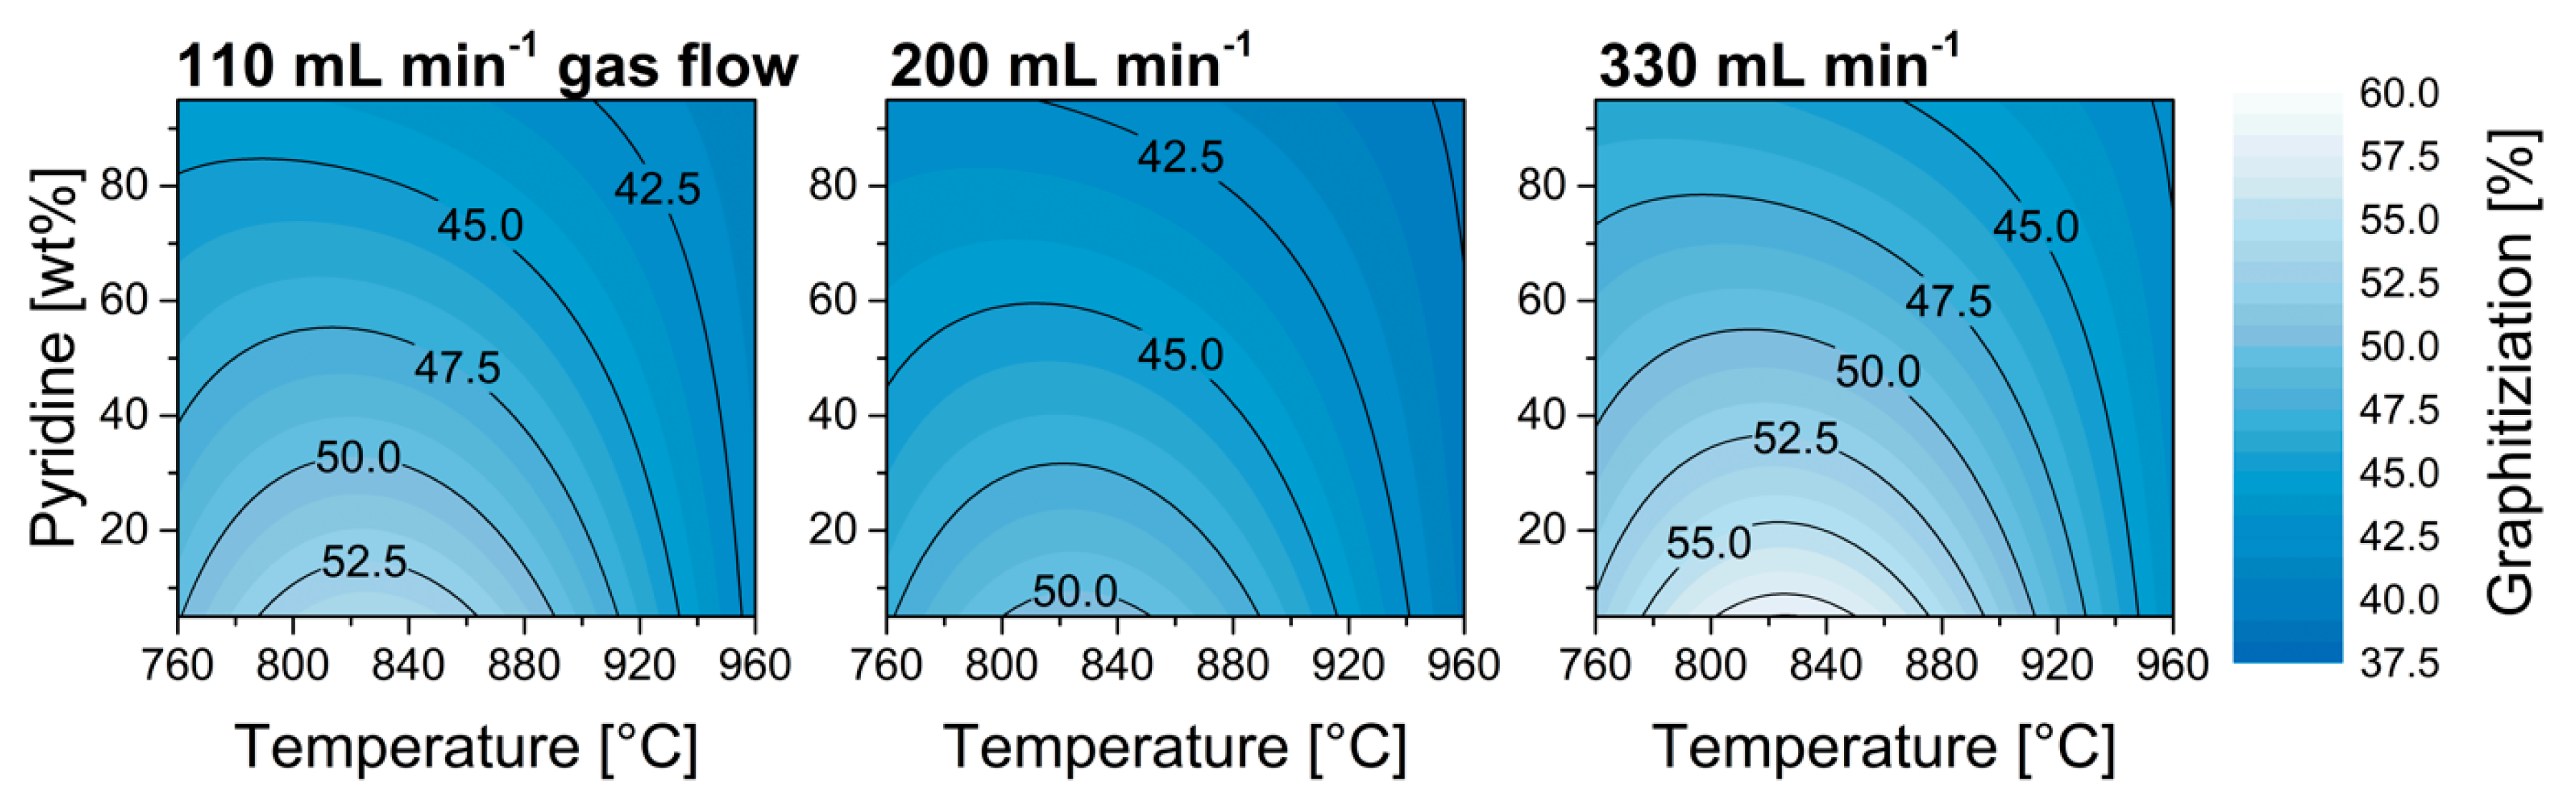
3.2. Graphitization
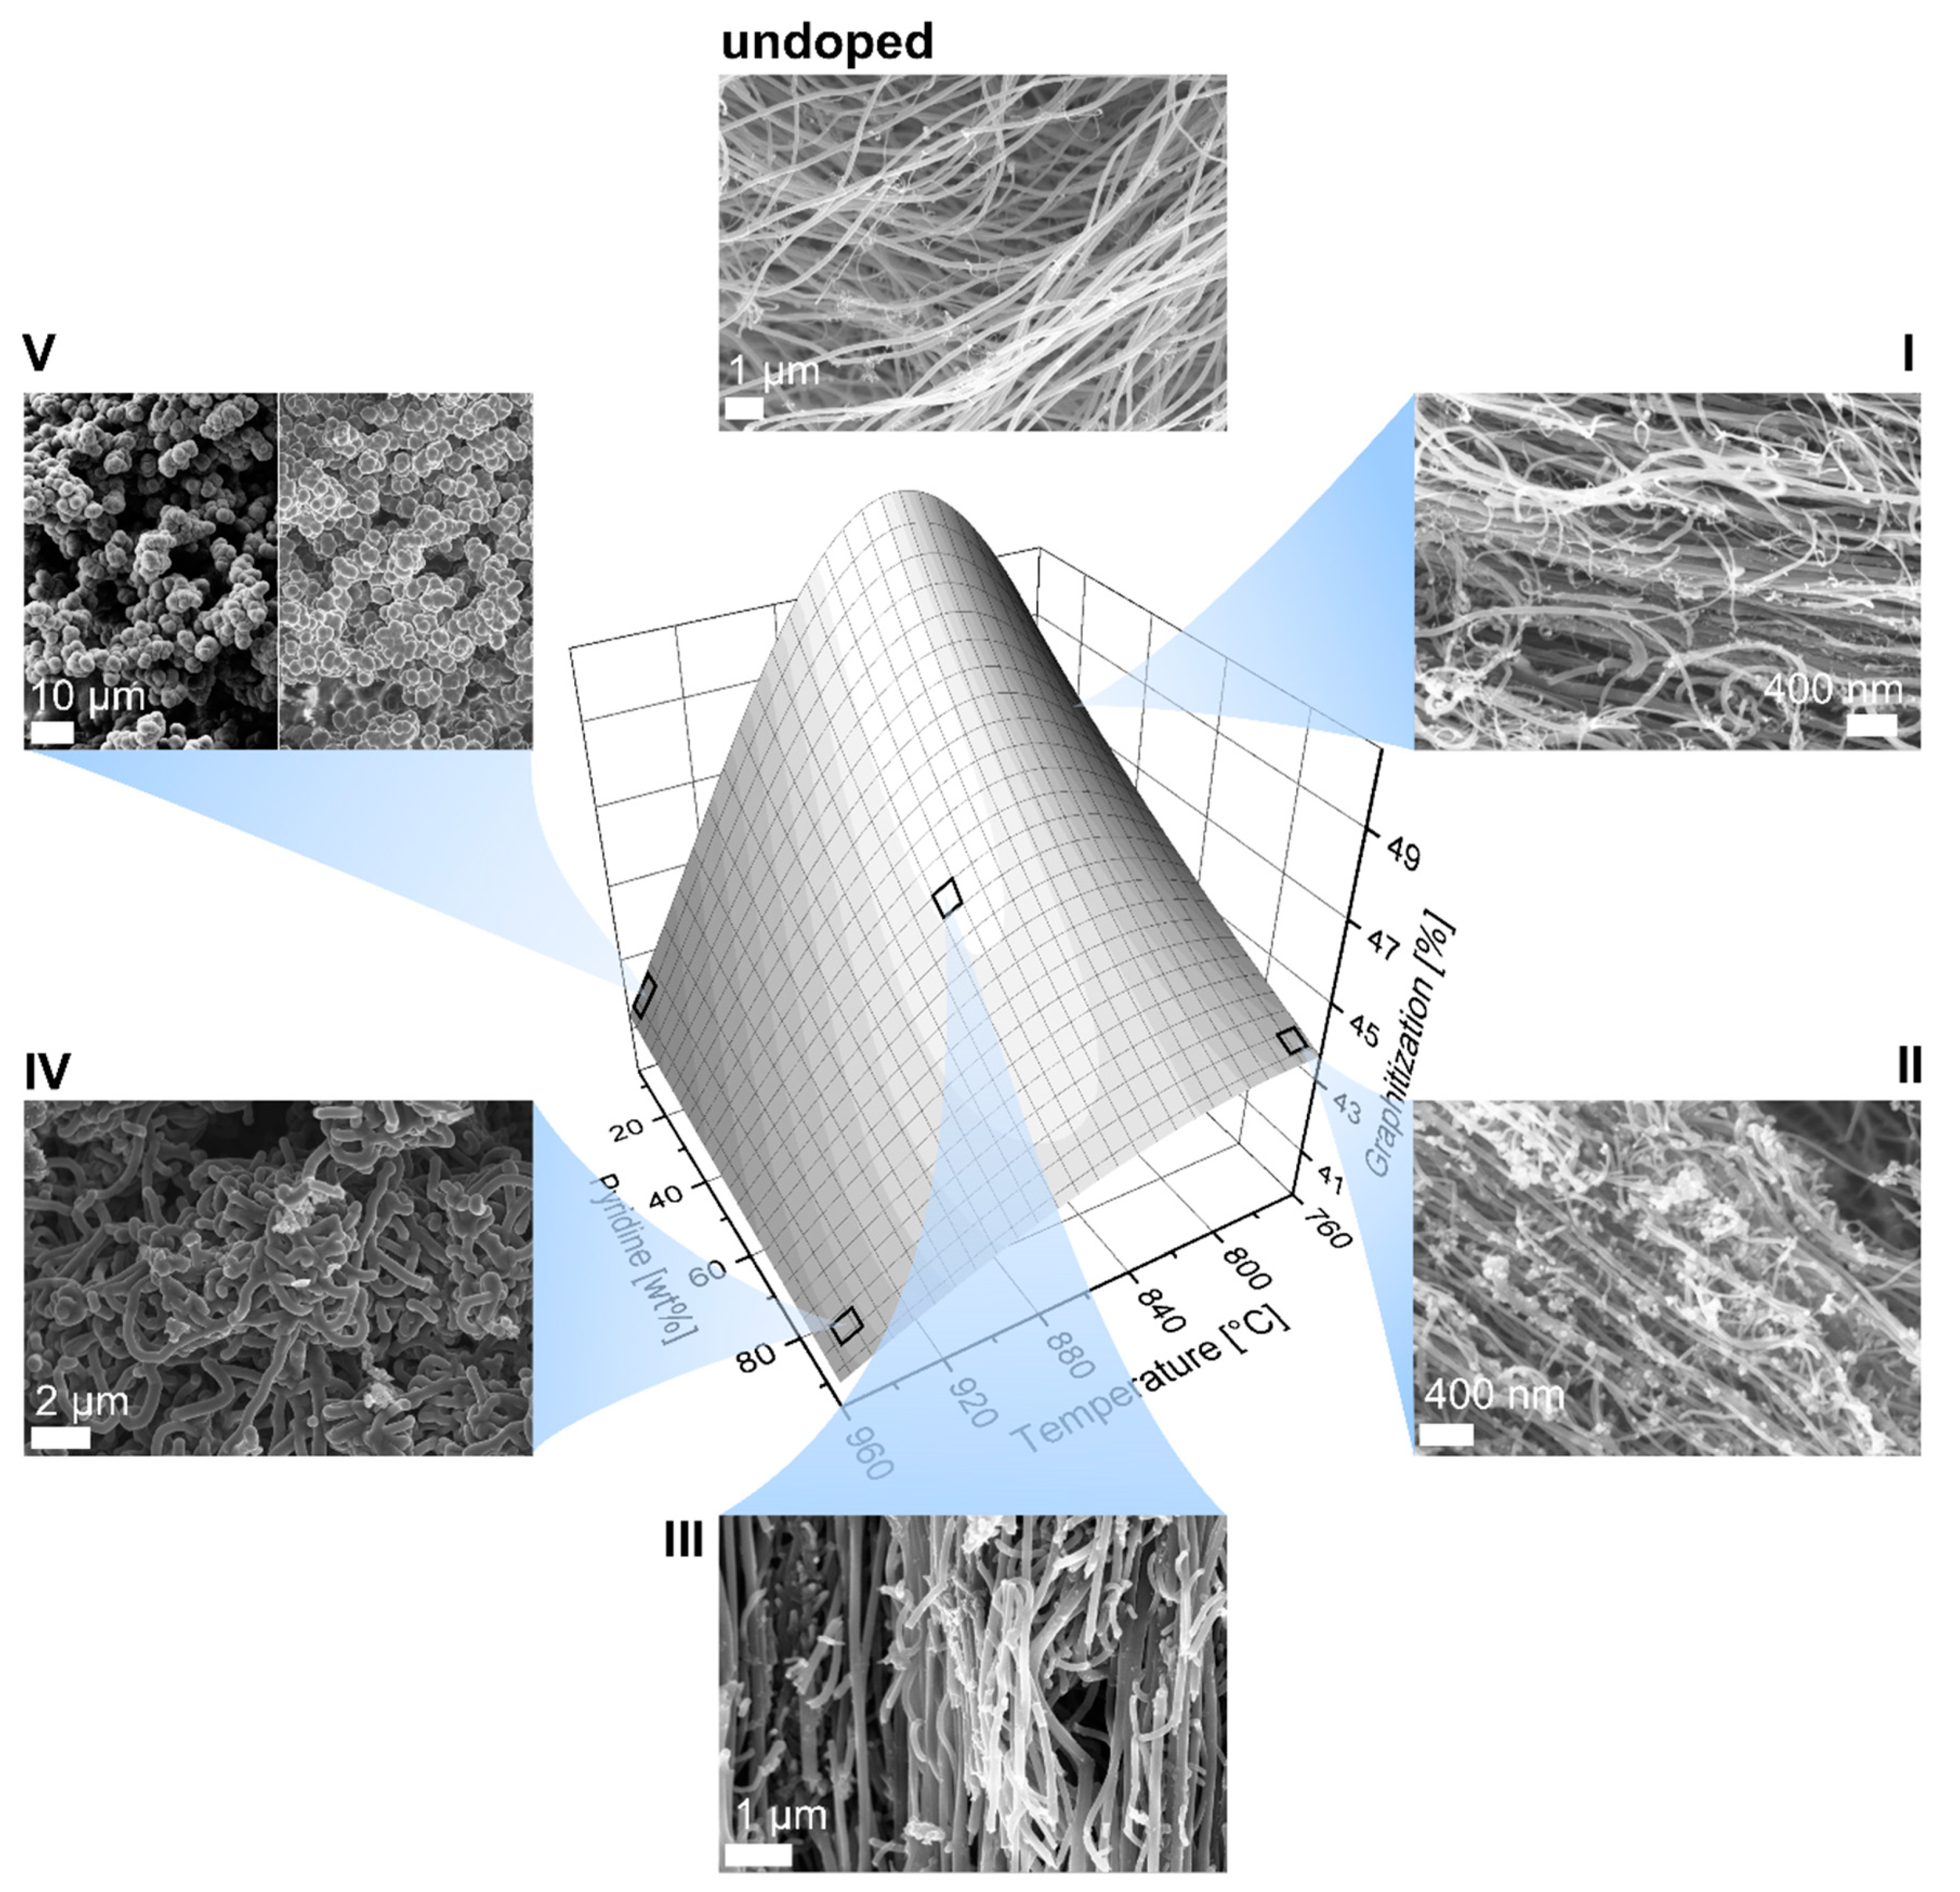
3.3. Aspect Ratio
3.4. Homogeneity
3.5. Optimized N-CNTs
4. Conclusions
Supplementary Materials
Author Contributions
Funding
Acknowledgments
Conflicts of Interest
References
- Bellucci, S. Carbon nanotubes: Physics and applications. Phys. Stat. Sol. C 2005, 2, 34–47. [Google Scholar] [CrossRef]
- Avouris, P.; Freitag, M.; Perebeinos, V. Carbon-nanotube photonics and optoelectronics. Nat. Photonics 2008, 2, 341–350. [Google Scholar] [CrossRef]
- Bystrzejewski, M.; Huczko, A.; Byszewski, P.; Domańska, M.; Rümmeli, M.H.; Gemming, T.; Lange, H. Systematic studies on carbon nanotubes synthesis from aliphatic alcohols by the CVD Floating catalyst method. Fuller. Nanotub. Carbon Nanostructures 2009, 17, 298–307. [Google Scholar] [CrossRef]
- Chaisitsak, S.; Nukeaw, J.; Tuantranont, A. Parametric study of atmospheric-pressure single-walled carbon nanotubes growth by ferrocene–ethanol mist CVD. Diam. Relat. Mater. 2007, 16, 1958–1966. [Google Scholar] [CrossRef]
- Chizari, K.; Sundararaj, U. The effects of catalyst on the morphology and physicochemical properties of nitrogen-doped carbon nanotubes. Mater. Lett. 2014, 116, 289–292. [Google Scholar] [CrossRef]
- Chizari, K.; Vena, A.; Laurentius, L.; Sundararaj, U. The effect of temperature on the morphology and chemical surface properties of nitrogen-doped carbon nanotubes. Carbon 2014, 68, 369–379. [Google Scholar] [CrossRef]
- Kim, N.S.; Lee, Y.T.; Park, J.; Han, J.B.; Choi, Y.S.; Choi, S.Y.; Choo, J.; Lee, G.H. Vertically Aligned carbon nanotubes grown by pyrolysis of iron, cobalt, and nickel phthalocyanines. J. Phys. Chem. B 2003, 107, 9249–9255. [Google Scholar] [CrossRef]
- Hernadi, K.; Couteau, E.; Umek, P.; Mikoacute, C.; Seo, J.W.; Laszlo, F.; Croci, M.; Klinke, C.; Chavin, P.; Bonard, J.-M. Controlled growth and applications of carbon nanotubes. Nanosci. Nanotechnol. 2002, 56, 547–552. [Google Scholar] [CrossRef]
- Li, X.; He, Y.; Zhang, T.; Que, L. Aluminum oxide nanostructure-based substrates for fluorescence enhancement. Opt. Express 2012, 20, 21272–21277. [Google Scholar] [CrossRef]
- Ordoñez-Casanova, E.G.; Román-Aguirre, M.; Aguilar-Elguezabal, A.; Espinosa-Magaña, F. Synthesis of carbon nanotubes of few walls using aliphatic alcohols as a carbon source. Materials 2013, 6, 2534–2542. [Google Scholar] [CrossRef]
- Arenal, R.; March, K.; Ewels, C.P.; Rocquefelte, X.; Kociak, M.; Loiseau, A.; Odile, S. Atomic configuration of nitrogen-doped single-walled carbon nanotubes. Nano Lett. 2014, 14, 5509–5516. [Google Scholar] [CrossRef] [PubMed]
- Misra, A.; Tyagi, P.K.; Singh, M.K.; Misra, D.S. FTIR studies of nitrogen doped carbon nanotubes. Diam. Relat. Mater. 2006, 15, 385–388. [Google Scholar] [CrossRef]
- Lehman, J.H.; Terrones, M.; Mansfield, E.; Hurst, K.E.; Meunier, V. Evaluating the characteristics of multiwall carbon nanotubes. Carbon 2011, 49, 2581–2602. [Google Scholar] [CrossRef]
- Ordonez-Casanova, E.; Roman-Aguirre, M.; Aguilar-Elguezabal, A.; Espinosa-Magana, F. Characterization of few-walled carbon nanotubes using alcohols aliphatic as carbon source. Microsc. Microanal. 2013, 19, 1608–1609. [Google Scholar] [CrossRef]
- Wepasnick, K.A.; Smith, B.A.; Schrote, K.E.; Wilson, H.K.; Diegelmann, S.R.; Fairbrother, D.H. Surface and structural characterization of multi-walled carbon nanotubes following different oxidative treatments. Carbon 2011, 49, 24–36. [Google Scholar] [CrossRef]
- Ewels, C.; Glerup, M. Nitrogen doping in carbon nanotubes. J. Nanosci. Nanotechnol. 2005, 5, 1345–1363. [Google Scholar] [CrossRef] [PubMed]
- Jana, D.; Sun, C.-L.; Chen, L.-C.; Chen, K.-H. Effect of chemical doping of boron and nitrogen on the electronic, optical, and electrochemical properties of carbon nanotubes. Prog. Mater. Sci. 2013, 58, 565–635. [Google Scholar] [CrossRef]
- Liu, Y.; Shen, Y.; Sun, L.; Li, J.; Liu, C.; Ren, W.; Li, F.; Gao, L.; Chen, J.; Liu, F.; et al. Elemental superdoping of graphene and carbon nanotubes. Nat. Commun. 2016, 7, 10921. [Google Scholar] [CrossRef] [PubMed]
- Tasis, D.; Tagmatarchis, N.; Bianco, A.; Prato, M. Chemistry of carbon nanotubes. Chem. Rev. 2006, 106, 1105–1136. [Google Scholar] [CrossRef]
- Ayala, P.; Arenal, R.; Rümmeli, M.; Rubio, A.; Pichler, T. The doping of carbon nanotubes with nitrogen and their potential applications. Carbon 2010, 48, 575–586. [Google Scholar] [CrossRef]
- Klinke, C.; Hannon, J.B.; Afzali, A.; Avouris, P. Field-effect transistors assembled from functionalized carbon nanotubes. Nano Lett. 2006, 6, 906–910. [Google Scholar] [CrossRef] [PubMed]
- Kunadian, I.; Andrews, R.; Pinar Mengüç, M.; Qian, D. Thermoelectric power generation using doped MWCNTs. Carbon 2009, 47, 589–601. [Google Scholar] [CrossRef]
- Prehn, K. Synthese Gerichteter CNTs zur Anwendung in Polymer-Elektrolyt Brennstoffzellen. Ph.D. Thesis, Hamburg University of Technology, Hamburg, Germany, 2009. [Google Scholar]
- Prehn, K.; Adelung, R.; Heinen, M.; Nunes, S.P.; Schulte, K. Catalytically active CNT–polymer-membrane assemblies: From synthesis to application. J. Membr. Sci. 2008, 321, 123–130. [Google Scholar] [CrossRef][Green Version]
- Thostenson, E.T.; Ren, Z.; Chou, T.-W. Advances in the science and technology of carbon nanotubes and their composites: A review. Compos. Sci. Technol. 2001, 61, 1899–1912. [Google Scholar] [CrossRef]
- Hwang, S.K.; Lee, J.M.; Kim, S.; Park, J.S.; Park, H.I.; Ahn, C.W.; Lee, K.J.; Lee, T.; Kim, S.O. Flexible multilevel resistive memory with controlled charge trap B- and N-doped carbon nanotubes. Nano Lett. 2012, 12, 2217–2221. [Google Scholar] [CrossRef] [PubMed]
- Zheng, X.F.; Liu, C.X.; Yan, Y.Y.; Wang, Q. A review of thermoelectrics research—Recent developments and potentials for sustainable and renewable energy applications. Renew. Sustain. Energy Rev. 2014, 32, 486–503. [Google Scholar] [CrossRef]
- Brownlie, L.; Shapter, J. Advances in carbon nanotube n-type doping: Methods, analysis and applications. Carbon 2018, 126, 257–270. [Google Scholar] [CrossRef]
- Lee, W.J.; Maiti, U.N.; Lee, J.M.; Lim, J.; Han, T.H.; Kim, S.O. Nitrogen-doped carbon nanotubes and graphene composite structures for energy and catalytic applications. Chem. Commun. 2014, 50, 6818–6830. [Google Scholar] [CrossRef]
- Yadav, R.M.; Dobal, P.S.; Shripathi, T.; Katiyar, R.S.; Srivastava, O.N. Effect of growth temperature on bamboo-shaped carbon-nitrogen (C-N) nanotubes synthesized using ferrocene acetonitrile precursor. Nanoscale Res. Lett. 2009, 4, 197–203. [Google Scholar] [CrossRef] [PubMed]
- Boncel, S.; Pattinson, S.W.; Geiser, V.; Shaffer, M.S.P.; Koziol, K.K.K. En route to controlled catalytic CVD synthesis of densely packed and vertically aligned nitrogen-doped carbon nanotube arrays. Beilstein J. Nanotechnol. 2014, 5, 219–233. [Google Scholar] [CrossRef]
- Bauhofer, W.; Kovacs, J.Z. A review and analysis of electrical percolation in carbon nanotube polymer composites. Compos. Sci. Technol. 2009, 69, 1486–1498. [Google Scholar] [CrossRef]
- Meeuw, H.; Viets, C.; Liebig, W.V.; Schulte, K.; Fiedler, B. Morphological influence of carbon nanofillers on the piezoresistive response of carbon nanoparticle/epoxy composites under mechanical load. Eur. Polym. J. 2016, 85, 198–210. [Google Scholar] [CrossRef]
- Montoro, L.A.; Corio, P.; Rosolen, J.M. A comparative study of alcohols and ketones as carbon precursor for multi-walled carbon nanotube growth. Carbon 2007, 45, 1234–1241. [Google Scholar] [CrossRef]
- Guo, T.; Nikolaev, P.; Thess, A.; Colbert, D.T.; Smalley, R.E. Catalytic growth of single-walled manotubes by laser vaporization. Chem. Phys. Lett. 1995, 243, 49–54. [Google Scholar] [CrossRef]
- Rao, C.N.R.; Sen, R. Large aligned-nanotube bundles from ferrocene pyrolysis. Chem. Commun. 1998, 1525–1526. [Google Scholar] [CrossRef]
- Ando, Y.; Zhao, X. Synthesis of carbon nanotubes by arc-discharge method. New Diam. Front. Carbon Technol. 2006, 16, 123–138. [Google Scholar]
- Brukh, R.; Mitra, S. Mechanism of carbon nanotube growth by CVD. Chem. Phys. Lett. 2006, 424, 126–132. [Google Scholar] [CrossRef]
- Kuwana, K.; Saito, K. Modeling ferrocene reactions and iron nanoparticle formation: Application to CVD synthesis of carbon nanotubes. Proc. Combust. Inst. 2007, 31, 1857–1864. [Google Scholar] [CrossRef]
- Mohammad, S.N. Systematic investigation of the growth mechanisms for conventional, doped and bamboo-shaped nanotubes. Carbon 2014, 75, 133–148. [Google Scholar] [CrossRef]
- Li, B.; Goh, C.F.; Zhou, X.; Lu, G.; Tantang, H.; Chen, Y.; Xue, C.; Boey, F.Y.C.; Zhang, H. Patterning colloidal metal nanoparticles for controlled growth of carbon nanotubes. Adv. Mater. 2008, 20, 4873–4878. [Google Scholar] [CrossRef]
- Liu, J.; Webster, S.; Carroll, D.L. Temperature and flow rate of NH3 effects on nitrogen content and doping environments of carbon nanotubes grown by injection CVD method. J. Phys. Chem. B 2005, 109, 15769–15774. [Google Scholar] [CrossRef] [PubMed]
- Dean, A.; Voss, D.; Draguljić, D. Design and Analysis of Experiments, 2nd ed.; Springer: New York, NY, USA, 1999. [Google Scholar]
- Hicks, C.R.; Turner, K.V. Fundamental Concepts in the Design of Experiments; Oxford University Press: New York, NY, USA, 1999. [Google Scholar]
- Myers, R.H.; Montgomery, D.C. Response Surface Methodology: Process and Product Optimization using Designed Experiments; Wiley: New York, NY, USA, 1995. [Google Scholar]
- Kukovecz, Á.; Méhn, D.; Nemes-Nagy, E.; Szabó, R.; Kiricsi, I. Optimization of CCVD synthesis conditions for single-wall carbon nanotubes by statistical design of experiments (DoE). Carbon 2005, 43, 2842–2849. [Google Scholar] [CrossRef]
- Sakia, R.M. The box-cox transformation technique: A Review. Statistician 1992, 41, 169. [Google Scholar] [CrossRef]
- Lee, S.-H.; Park, J.; Kim, H.-R.; Lee, T.; Lee, J.; Im, Y.-O.; Lee, C.-H.; Cho, H.; Lee, H.; Jun, C.-H.; et al. Synthesis of carbon nanotube fibers using the direct spinning process based on design of experiment (DOE). Carbon 2016, 100, 647–655. [Google Scholar] [CrossRef]
- Oliver, C.R.; Polsen, E.S.; Meshot, E.R.; Tawfick, S.; Park, S.J.; Bedewy, M.; Hart, A.J. Statistical analysis of variation in laboratory growth of carbon nanotube forests and recommendations for improved consistency. ACS Nano 2013, 7, 3565–3580. [Google Scholar] [CrossRef] [PubMed]
- Hore, N.R.; Russell, D.K. Radical pathways in the thermal decomposition of pyridine and diazines: A laser pyrolysis and semi-empirical study. J. Chem. Soc. Perkin Trans. 2 1998, 2, 269–276. [Google Scholar] [CrossRef]
- Brouwer, L.D.; Müller-Markgraf, W.; Troe, J. Thermal decomposition of toluene: A comparison of thermal and laser-photochemical activation experiments. J. Phys. Chem. 1988, 92, 4905–4914. [Google Scholar] [CrossRef]
- Mhlanga, S.D.; Nxumalo, E.N.; Coville, N.J.; Srinivasu, V.V. Nitrogen doping of CVD multiwalled carbon nanotubes: Observation of a large g-factor shift. Mater. Chem. Phys. 2011, 130, 1182–1186. [Google Scholar] [CrossRef]
- Vázquez-Santos, M.B.; Geissler, E.; László, K.; Rouzaud, J.-N.; Martínez-Alonso, A.; Tascón, J.M.D. Comparative XRD, raman, and TEM study on graphitization of PBO-derived carbon fibers. J. Phys. Chem. C 2012, 116, 257–268. [Google Scholar] [CrossRef]
- Gojny, F.H.; Wichmann, M.H.G.; Fiedler, B.; Kinloch, I.A.; Bauhofer, W.; Windle, A.H.; Schulte, K. Evaluation and identification of electrical and thermal conduction mechanisms in carbon nanotube/epoxy composites. Polymer 2006, 47, 2036–2045. [Google Scholar] [CrossRef]
- Mecklenburg, M. Ultra-Hoch Gefüllte und Orientierte CNT- und 3D-Vernetzte Aerographit Epoxidkomposite: Synthese, Herstellung und Eigenschaften. Ph.D. Thesis, Hamburg University of Technology, Hamburg, Germany, 2017. [Google Scholar]
- Nxumalo, E.N.; Nyamori, V.O.; Coville, N.J. CVD synthesis of nitrogen doped carbon nanotubes using ferrocene/aniline mixtures. J. Organomet. Chem. 2008, 693, 2942–2948. [Google Scholar] [CrossRef]
- Kim, K.K.; Park, J.S.; Kim, S.J.; Geng, H.Z.; An, K.H.; Yang, C.-M.; Sato, K.; Saito, R.; Lee, Y.H. Dependence of Raman spectra G′ band intensity on metallicity of single-wall carbon nanotubes. Phys. Rev. B 2007, 76, 27. [Google Scholar] [CrossRef]
- Nath, M.; Satishkumar, B.C.; Govindaraj, A.; Vinod, C.P.; Rao, C.N.R. Production of bundles of aligned carbon and carbon–nitrogen nanotubes by the pyrolysis of precursors on silica-supported iron and cobalt catalysts. Chem. Phys. Lett. 2000, 322, 333–340. [Google Scholar] [CrossRef]
- Panchakarla, L.S.; Govindaraj, A.; Rao, C.N.R. Nitrogen- and boron-doped double-walled carbon nanotubes. ACS Nano 2007, 1, 494–500. [Google Scholar] [CrossRef] [PubMed]
- Sen, R.; Satishkumar, B.C.; Govindaraj, A.; Harikumar, K.R.; Renganathan, M.K.; Rao, C.N.R. Nitrogen-containing carbon nanotubes. J. Mater. Chem. 1997, 7, 2335–2337. [Google Scholar] [CrossRef]
- Sen, R.; Satishkumar, B.C.; Govindaraj, A.; Harikumar, K.R.; Raina, G.; Zhang, J.-P.; Cheetham, A.K.; Rao, C.N.R. B–C–N, C–N and B–N nanotubes produced by the pyrolysis of precursor molecules over Co catalysts. Chem. Phys. Lett. 1998, 287, 671–676. [Google Scholar] [CrossRef]
- Sharifi, T.; Nitze, F.; Barzegar, H.R.; Tai, C.-W.; Mazurkiewicz, M.; Malolepszy, A.; Stobinski, L.; Wågberg, T. Nitrogen doped multi walled carbon nanotubes produced by CVD-correlating XPS and Raman spectroscopy for the study of nitrogen inclusion. Carbon 2012, 50, 3535–3541. [Google Scholar] [CrossRef]
- Terrones, M.; Redlich, P.; Grobert, N.; Trasobares, S.; Hsu, W.-K.; Terrones, H.; Zhu, Y.-Q.; Hare, J.P.; Reeves, C.L.; Cheetham, A.K.; et al. Carbon Nitride nanocomposites: Formation of Aligned CxNy nanofibers. Adv. Mater. 1999, 11, 655–658. [Google Scholar] [CrossRef]


 | ||||
|---|---|---|---|---|
| Coded Value | TR | ωpyridine | Qgas | QI |
| [°C] | [wt%] | [mL min−1] | [mL h−1] | |
| −1 | 760 | 5 | 110 | 5.5 |
| +1 | 960 | 95 | 330 | 10.5 |
| −α | 760 | 5 | 110 | 5.5 |
| +α | 960 | 95 | 330 | 10.5 |
| Measured Properties | Input Values | |||||||
|---|---|---|---|---|---|---|---|---|
| xN | G | Id/Ig | η | ωFe | ωpyridine | Qgas | QI | TR |
| [at%] | [%] | [wt%] | [wt%] | [mL min−1] | [mL h−1] | [°C] | ||
| undoped | 63 | 0.60 | 6500 | 4.9 | 0.0 | 220 | 5.5 | 760 |
| 0.3 | 54 | 0.86 | 7143 | 2.3 | 5.0 | 175 | 7.4 | 843 |
| 0.8 ± 0.2 | 57 ± 2 | 0.77 ± 0.05 | 1333 ± 63 | 6.3 ± 0.5 | 22.0 | 110 | 10.5 | 820 |
| 1.0 | 54 | 0.87 | 1429 | 5.2 | 25.6 | 110 | 10.5 | 826 |
| 1.2 | 52 | 0.95 | 1625 | 5.0 | 36.3 | 110 | 10.5 | 834 |
| 1.9 | 49 | 1.04 | 1667 | 5.0 | 46.1 | 110 | 10.5 | 824 |
| 3.1 | 44 | 1.06 | 1250 | 5.6 | 62.1 | 110 | 10.5 | 831 |
| 4.7 | 42 | 1.40 | 593 | 3.5 | 95.0 | 330 | 5.5 | 828 |
| 6.1 | 40 | 1.48 | 888 | 3.7 | 93.0 | 110 | 5.5 | 823 |
© 2019 by the authors. Licensee MDPI, Basel, Switzerland. This article is an open access article distributed under the terms and conditions of the Creative Commons Attribution (CC BY) license (http://creativecommons.org/licenses/by/4.0/).
Share and Cite
Plunkett, A.; Kröning, K.; Fiedler, B. Highly Optimized Nitrogen-Doped MWCNTs through In-Depth Parametric Study Using Design of Experiments. Nanomaterials 2019, 9, 643. https://doi.org/10.3390/nano9040643
Plunkett A, Kröning K, Fiedler B. Highly Optimized Nitrogen-Doped MWCNTs through In-Depth Parametric Study Using Design of Experiments. Nanomaterials. 2019; 9(4):643. https://doi.org/10.3390/nano9040643
Chicago/Turabian StylePlunkett, Alexander, Katharina Kröning, and Bodo Fiedler. 2019. "Highly Optimized Nitrogen-Doped MWCNTs through In-Depth Parametric Study Using Design of Experiments" Nanomaterials 9, no. 4: 643. https://doi.org/10.3390/nano9040643
APA StylePlunkett, A., Kröning, K., & Fiedler, B. (2019). Highly Optimized Nitrogen-Doped MWCNTs through In-Depth Parametric Study Using Design of Experiments. Nanomaterials, 9(4), 643. https://doi.org/10.3390/nano9040643