Fabrication and Adsorption Behavior of Magnesium Silicate Hydrate Nanoparticles towards Methylene Blue


Abstract
:
1. Introduction
2. Experimental
2.1. Materials
2.2. Preparation of Magnesium Silicate Hydrate
2.3. Characterization
2.4. Surface Charge Studies
2.5. Adsorption Experiments
3. Results and Discussion
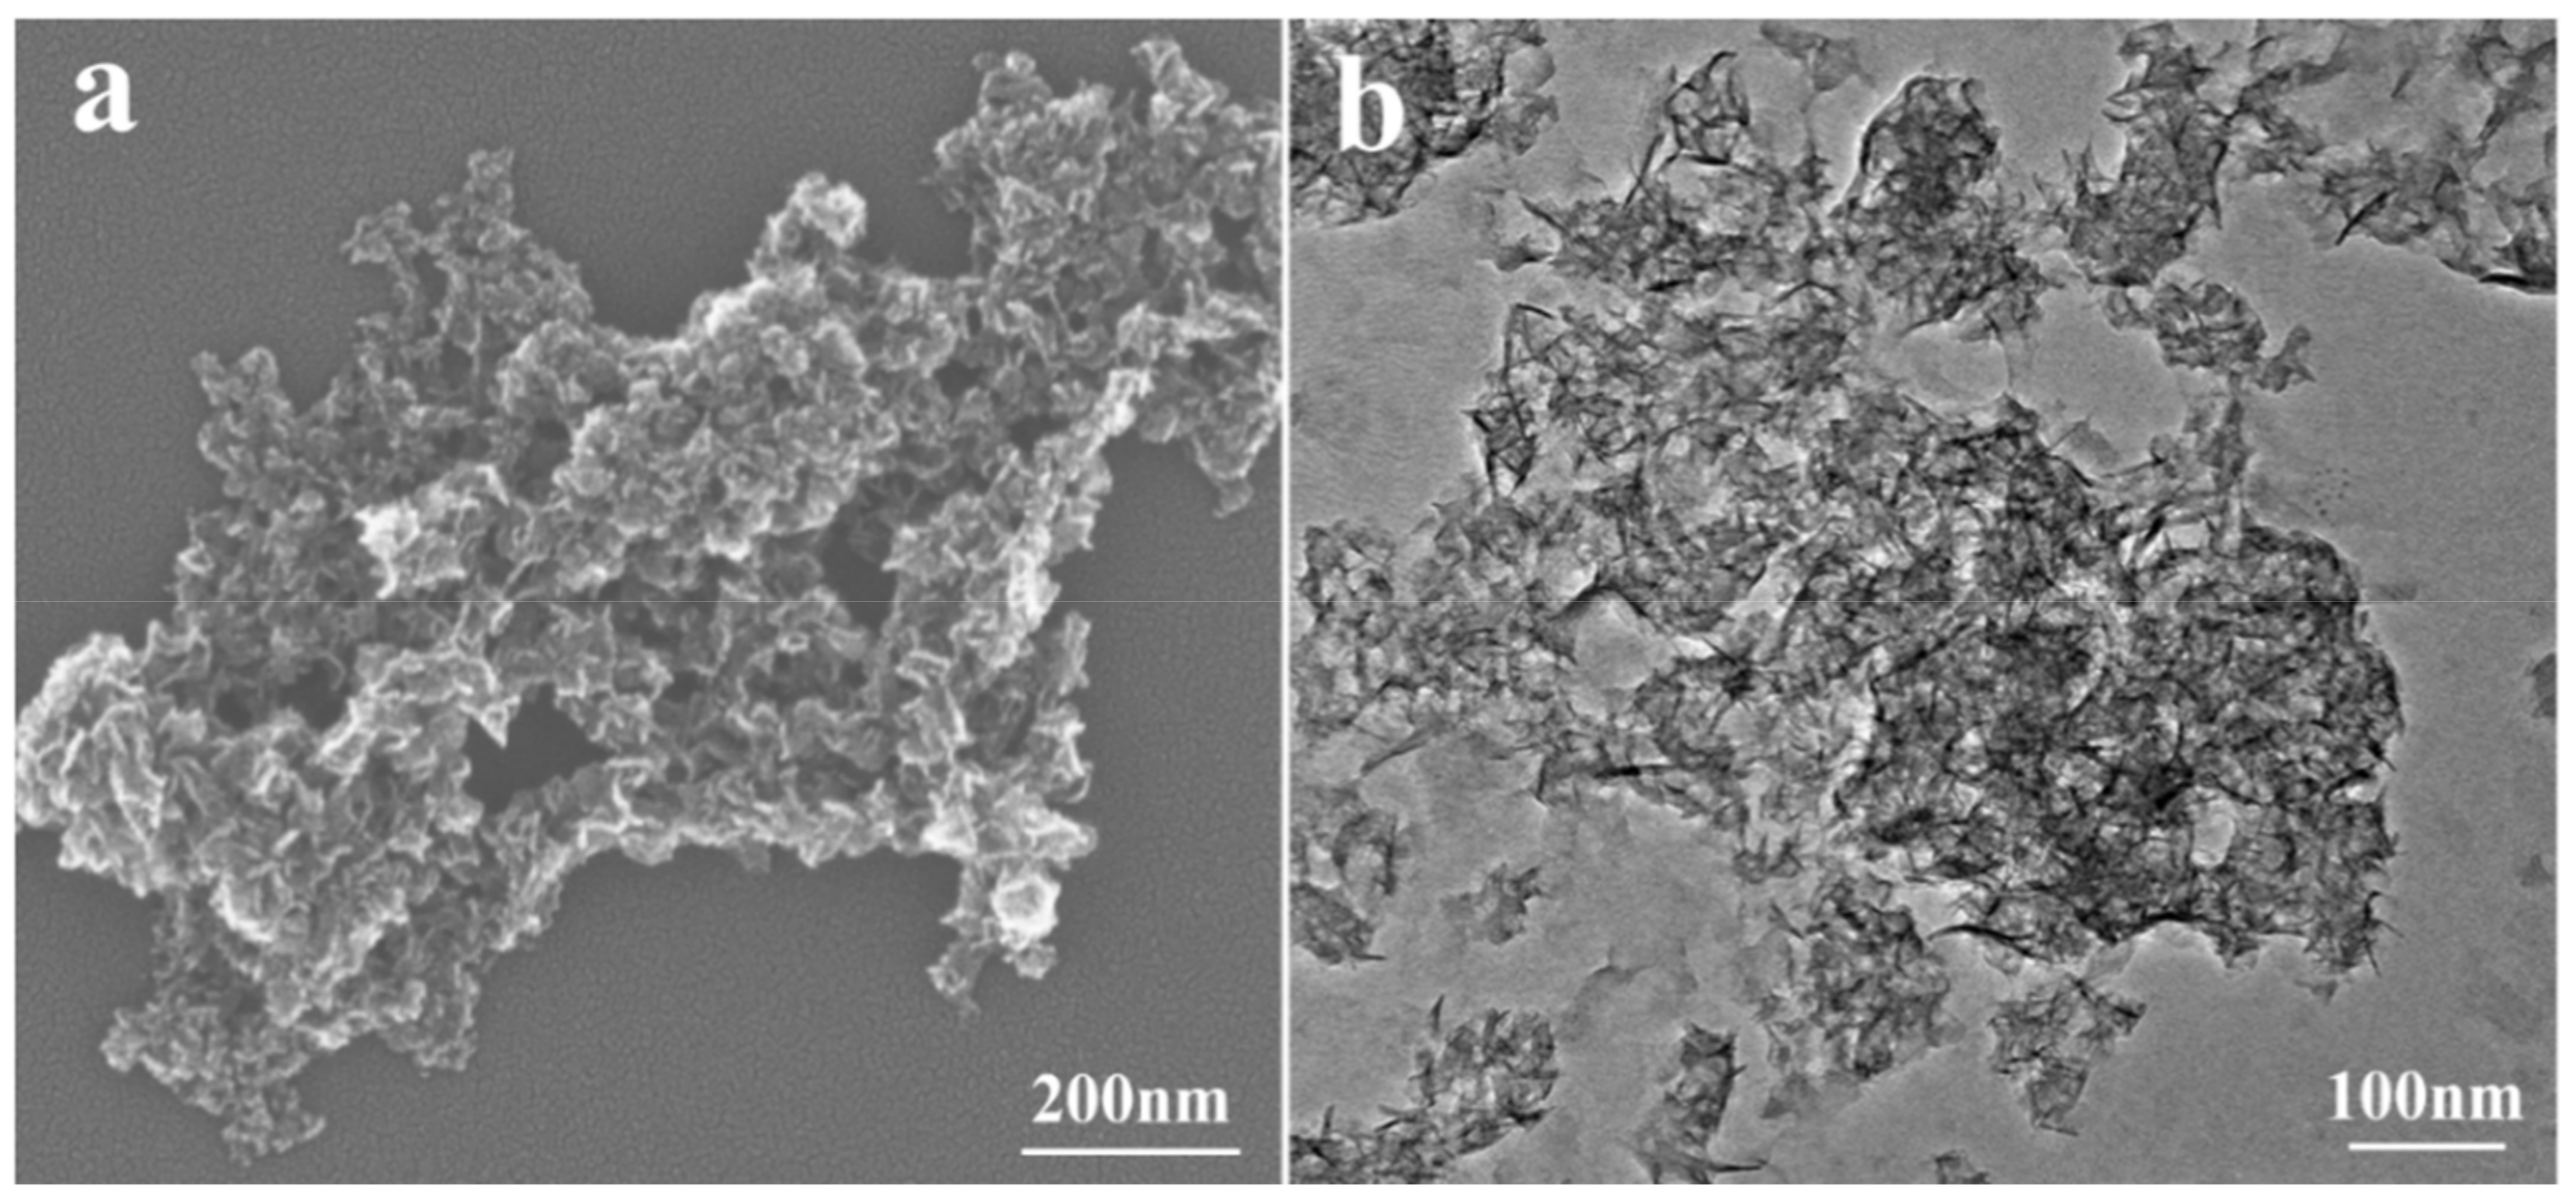
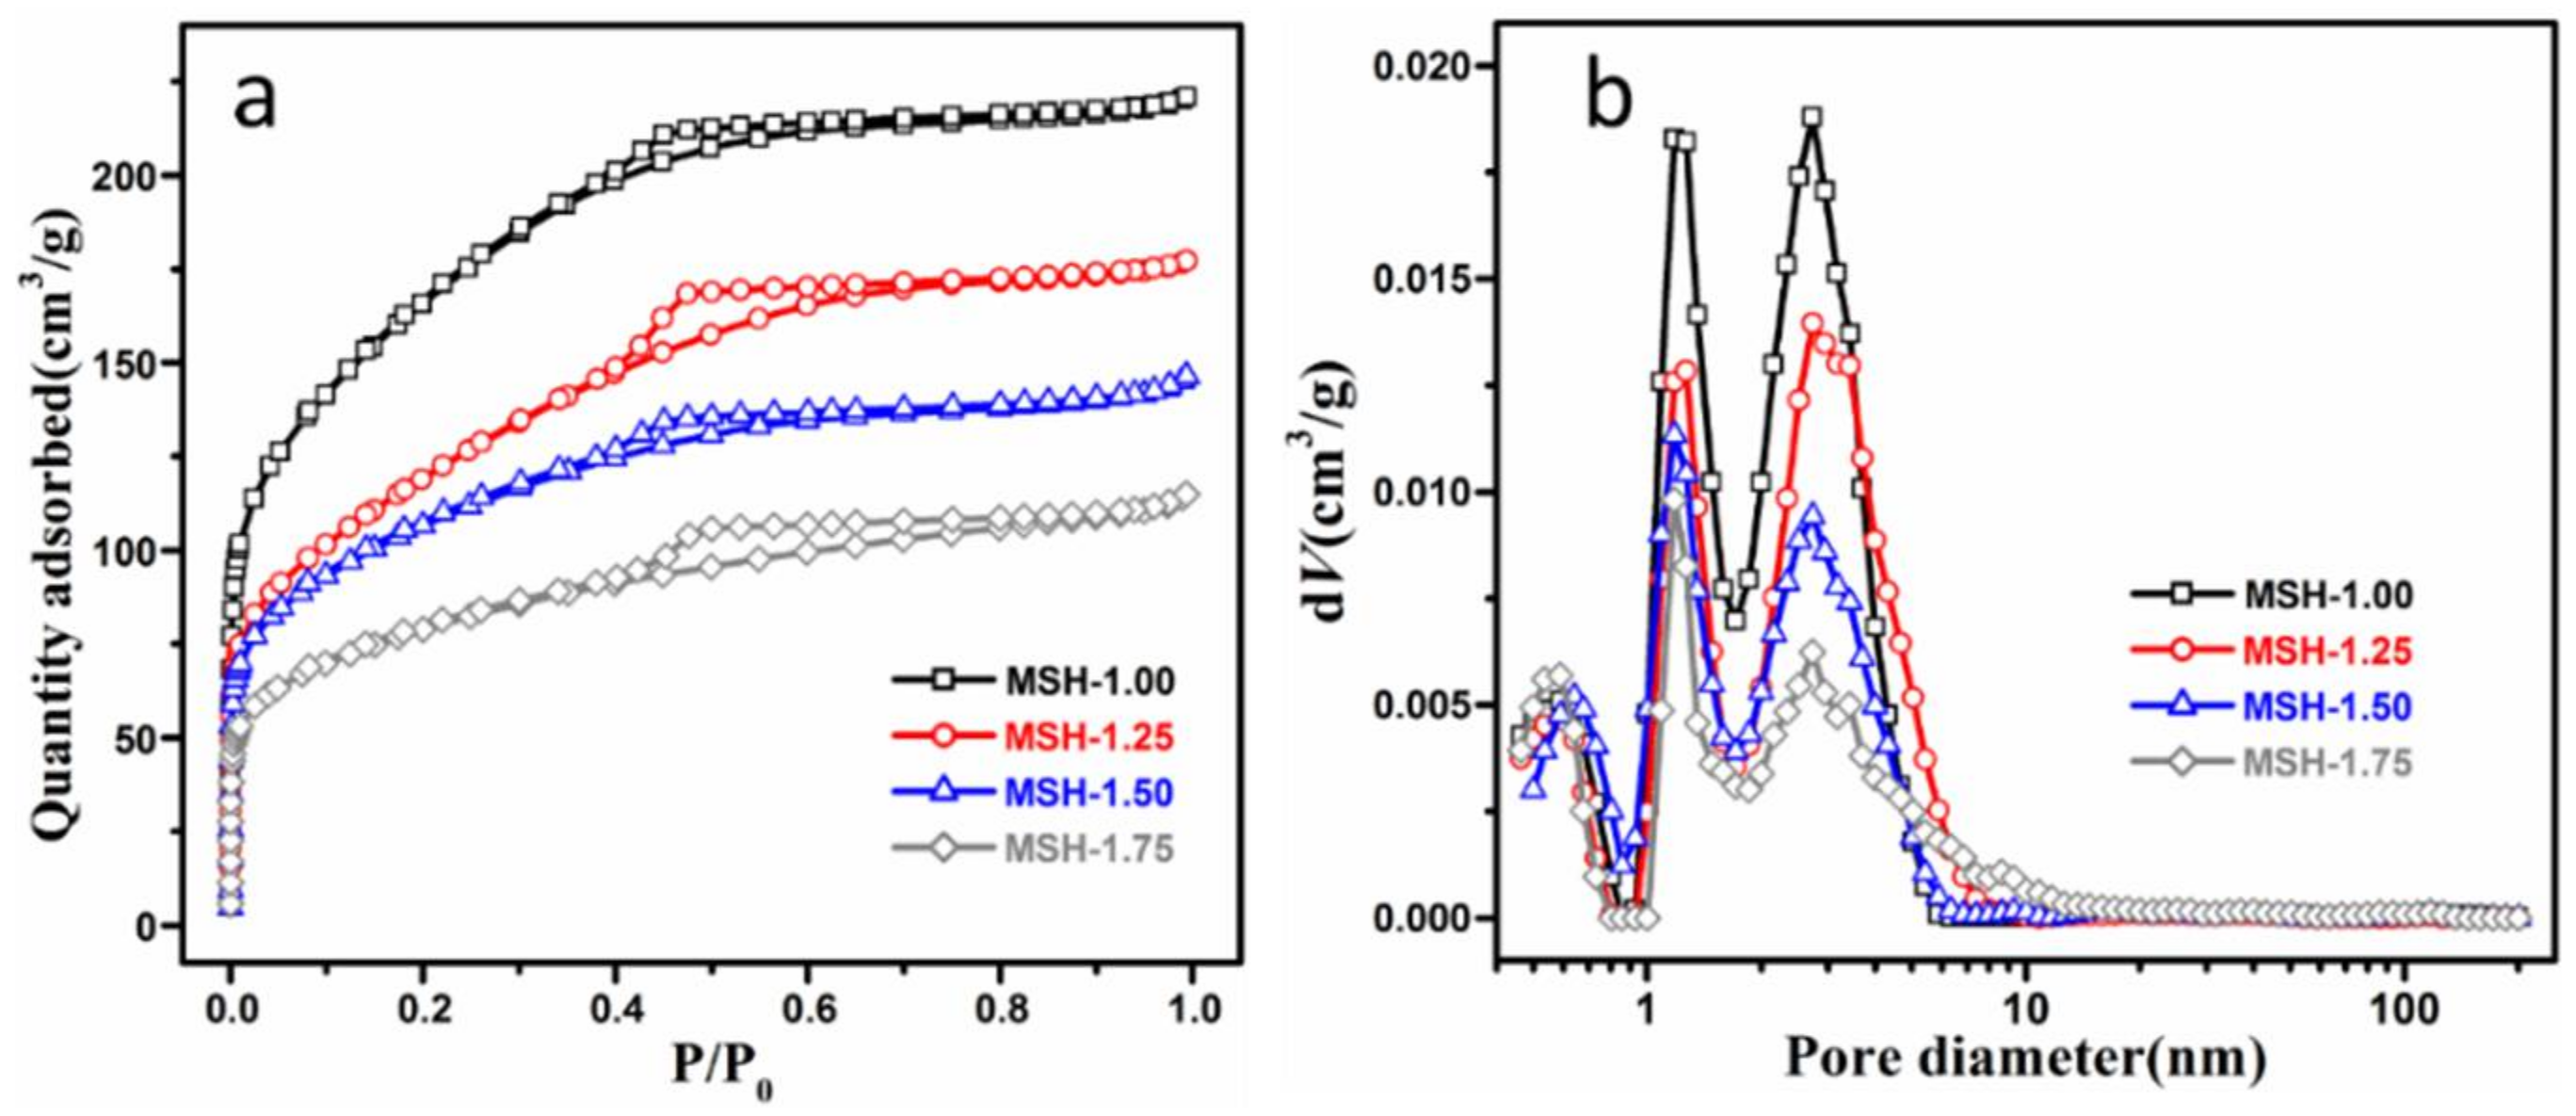
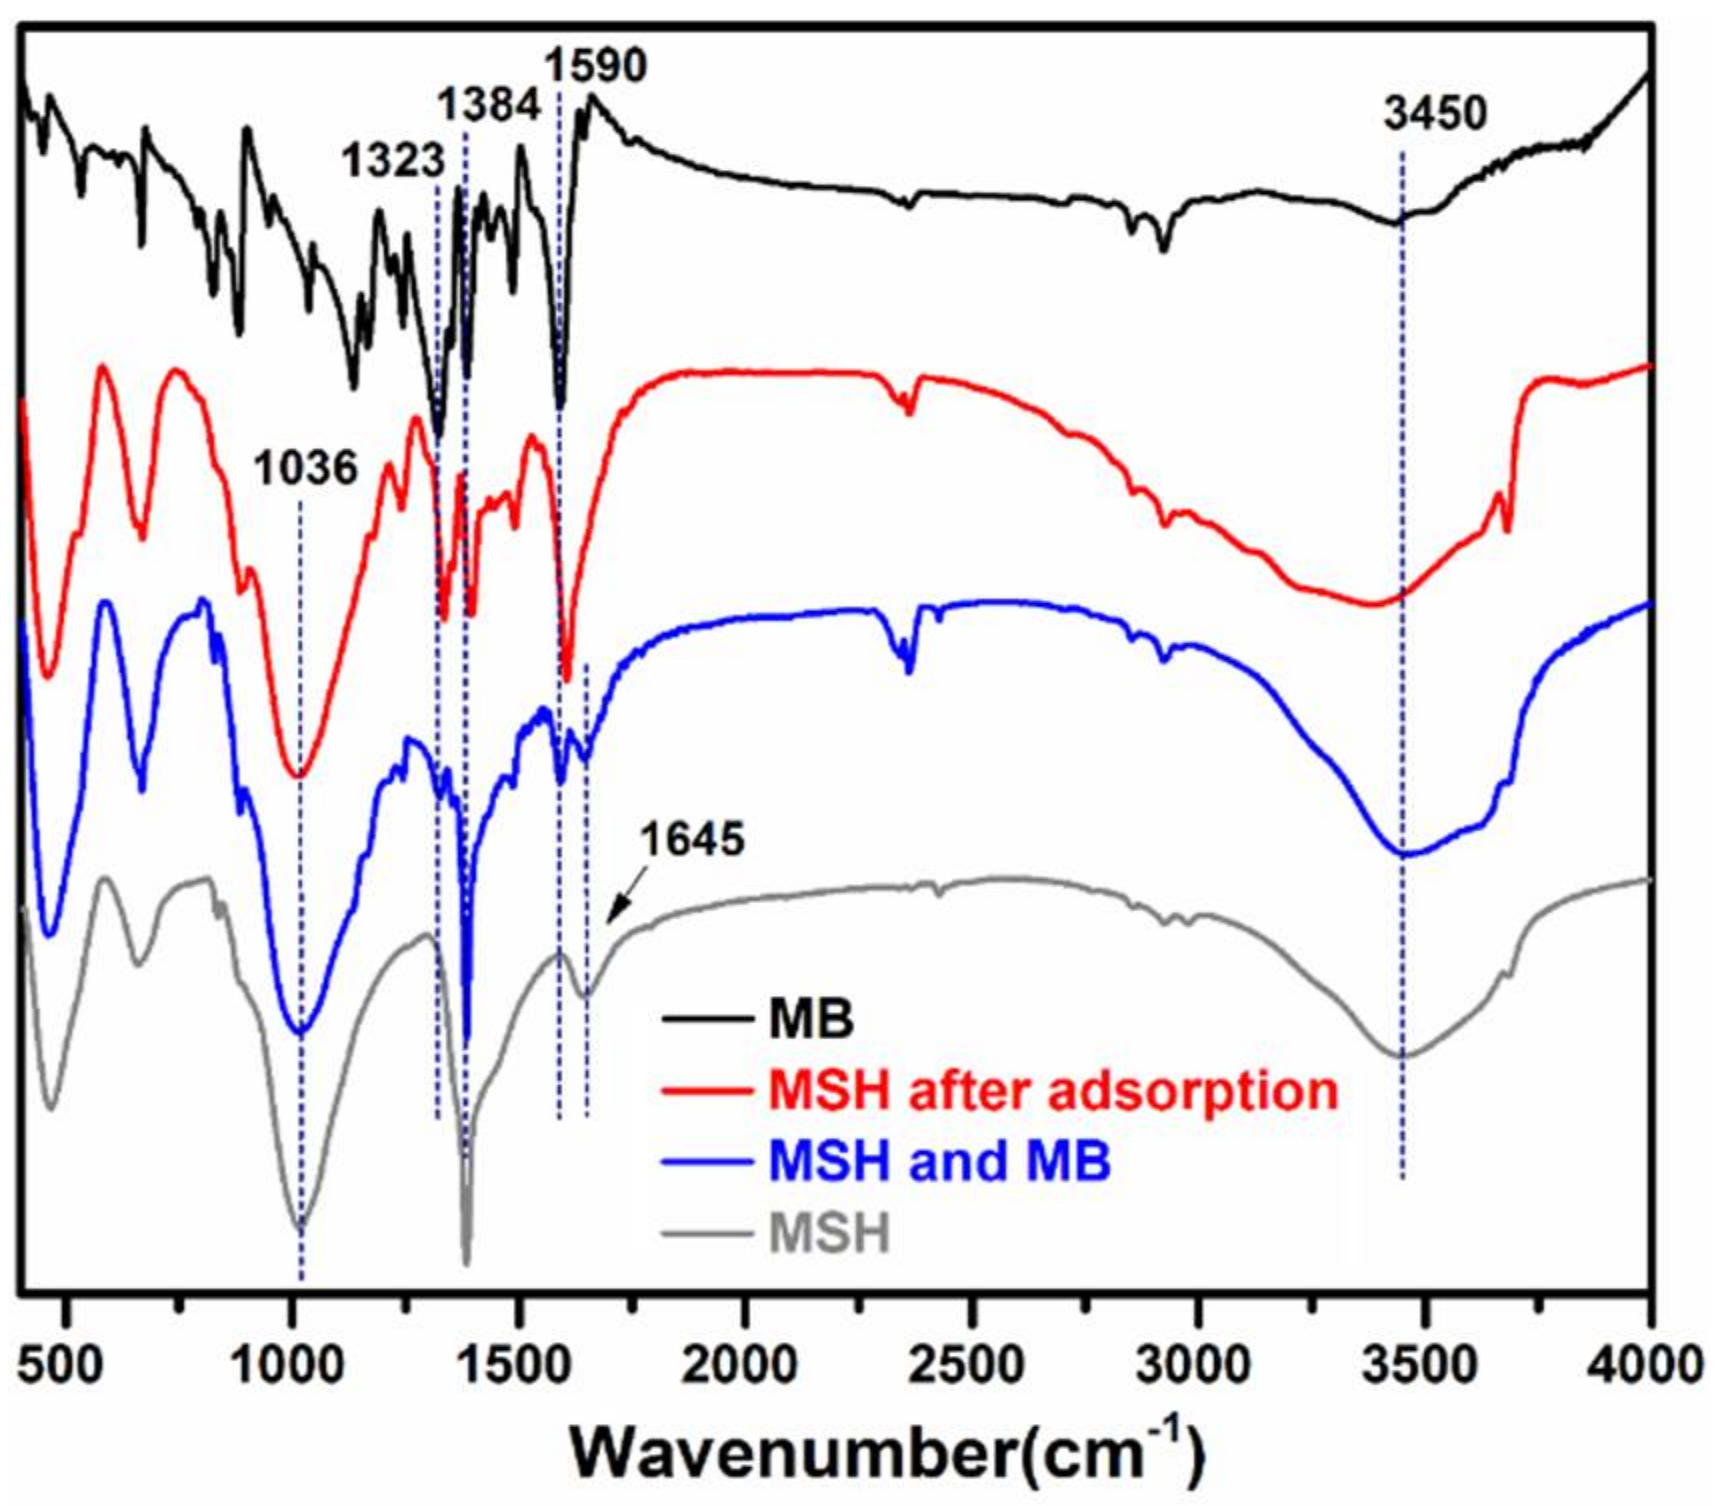
3.1. Characterization
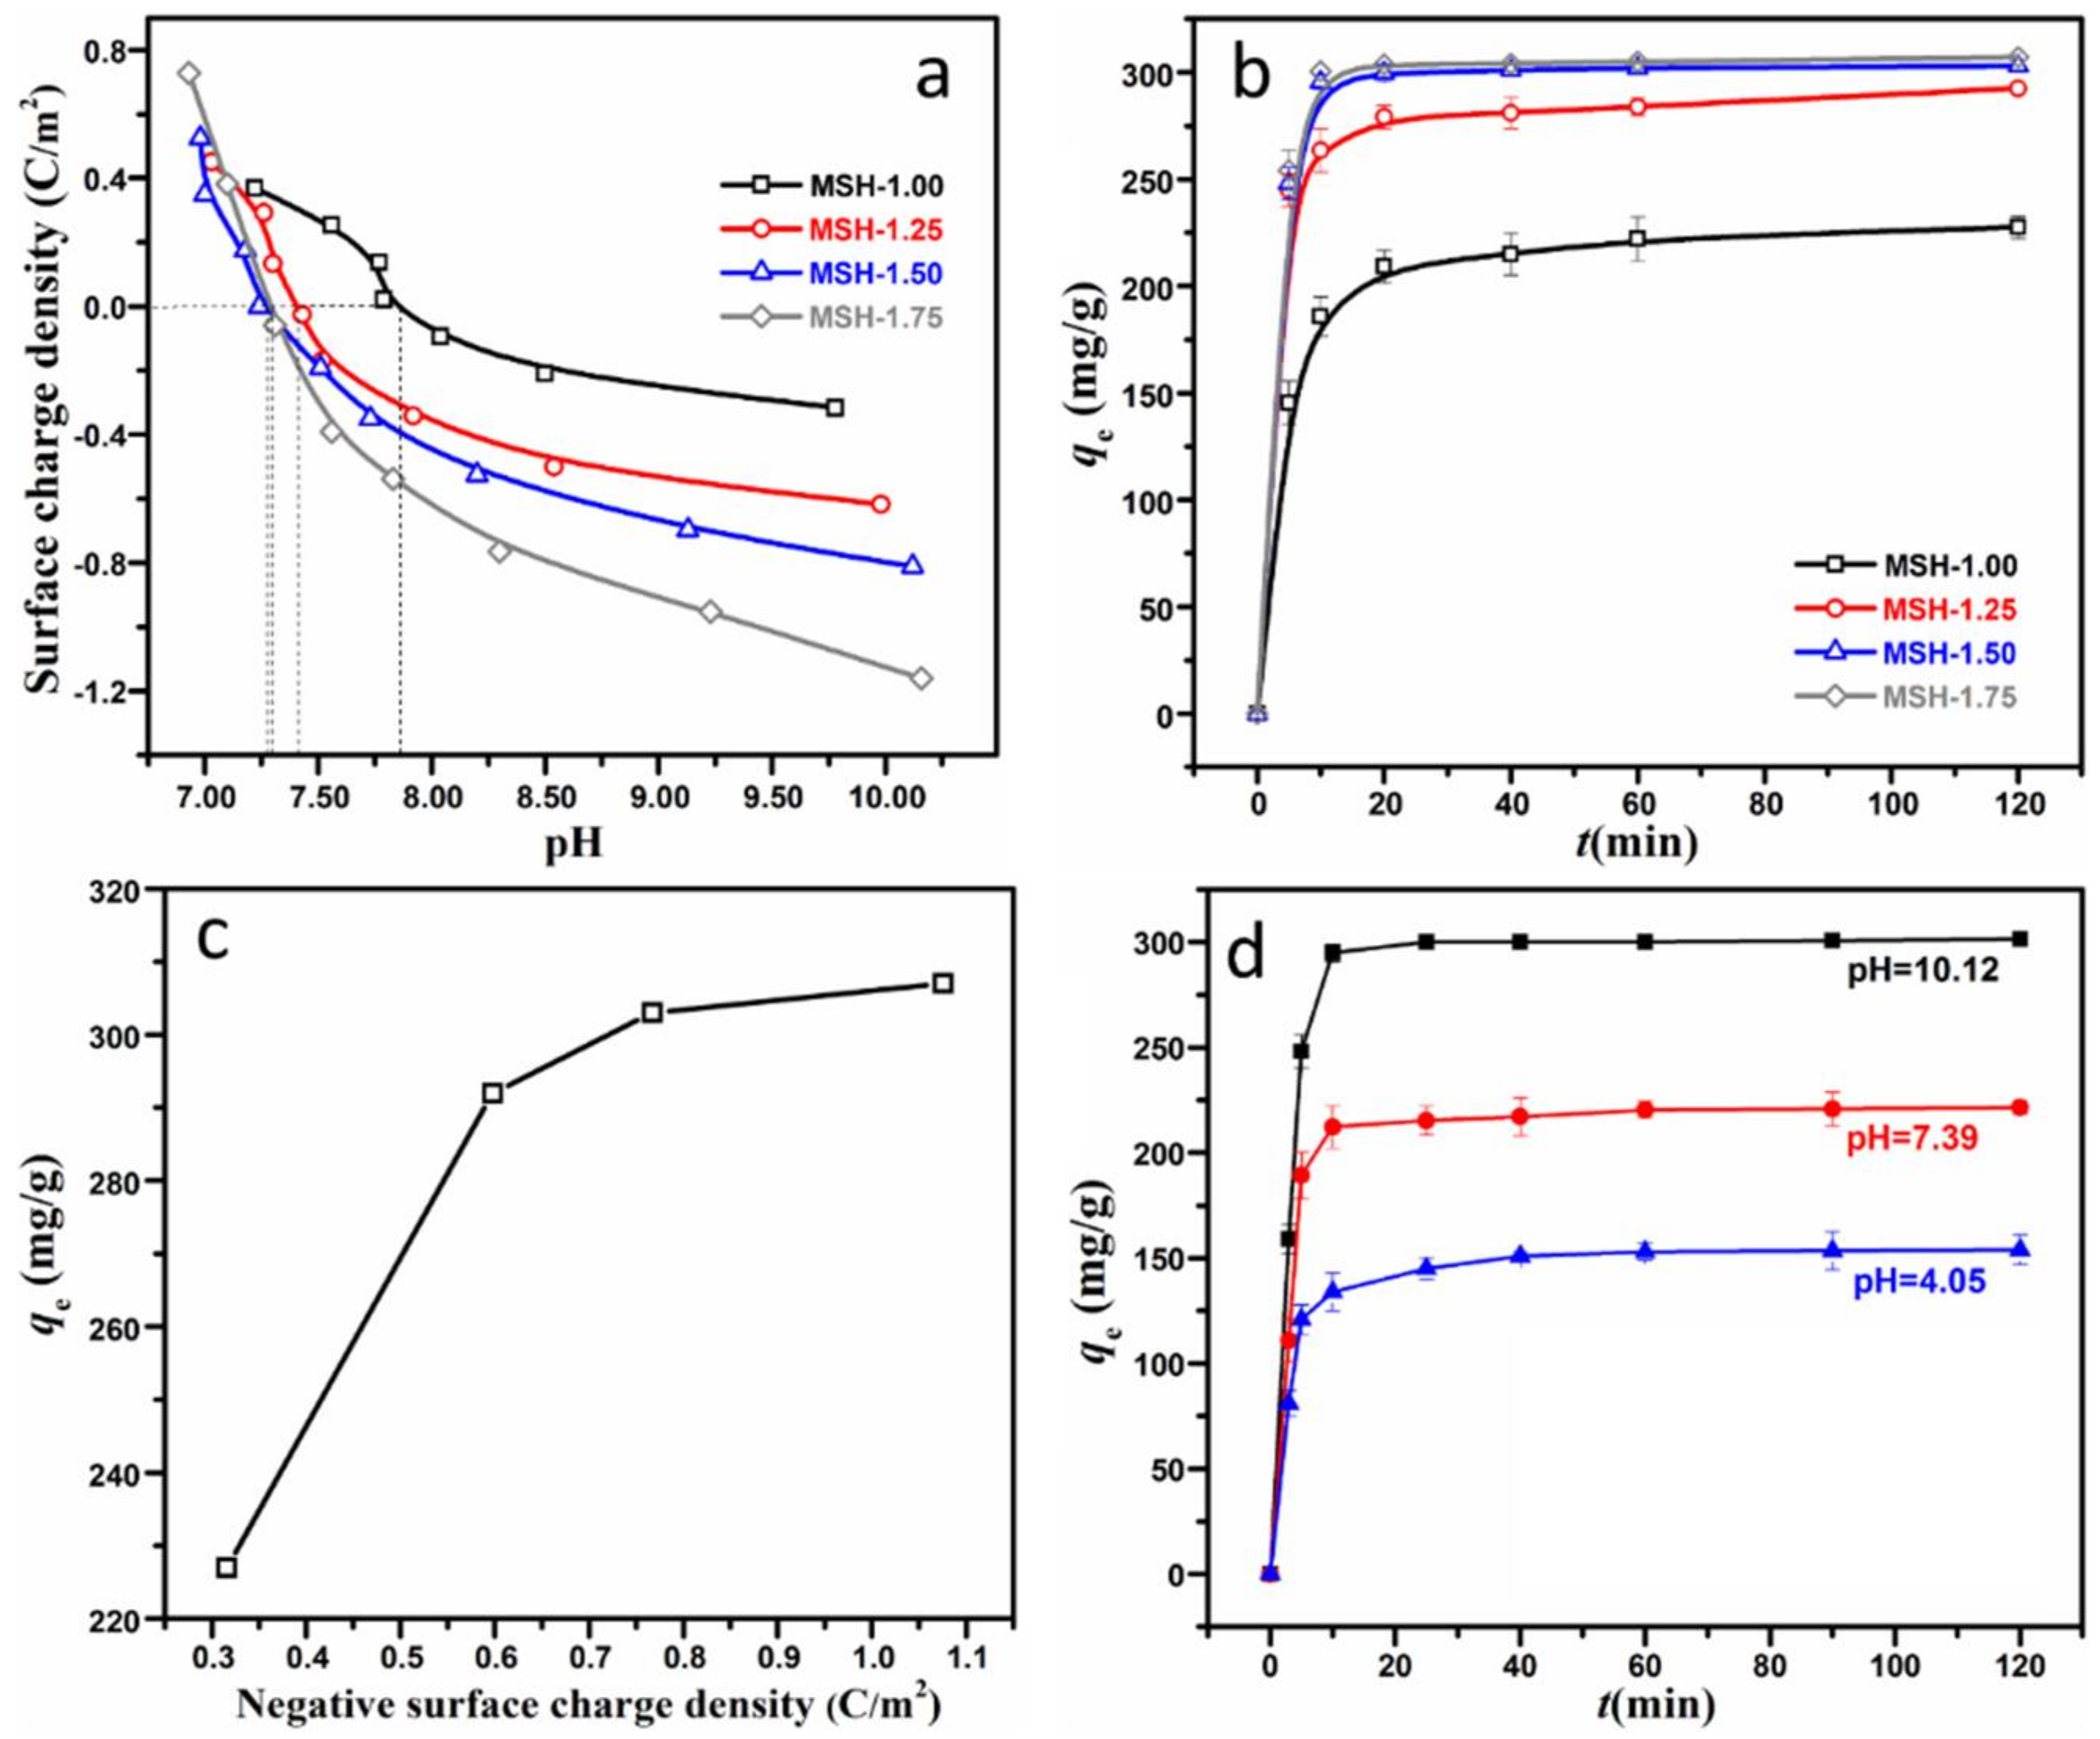
3.2. Surface Charge and Adsorption Behavior
4. Conclusions
Supplementary Materials
Author Contributions
Acknowledgments
Conflicts of Interest
References
- Rane, N.R.; Chandanshive, V.V.; Khandare, R.V.; Gholave, A.R.; Yadav, S.R.; Govindwar, S.P. Green Remediation of Textile Dyes Containing Wastewater by Ipomoea hederifolia L. RSC Adv. 2014, 4, 36623–36632. [Google Scholar] [CrossRef]
- Extremera, R.; Pavlovic, I.; Pérez, M.R.; Barriga, C. Removal of Acid Orange 10 by Calcined Mg/Al Layered Double Hydroxides from Water and Recovery of the Adsorbed Dye. Chem. Eng. J. 2012, 213, 392–400. [Google Scholar] [CrossRef]
- Razali, M.; Kim, J.F.; Attfield, M.; Budd, P.M.; Drioli, E.; Lee, Y.M.; Szekely, G. Sustainable Wastewater Treatment and Recycling in Membrane Manufacturing. Green Chem. 2015, 17, 5196–5205. [Google Scholar] [CrossRef]
- Qu, J.; Li, W.; Cao, C.-Y.; Yin, X.-J.; Zhao, L.; Bai, J.; Qin, Z.; Song, W.-G. Metal Silicate Nanotubes with Nanostructured Walls as Superb Adsorbents for Uranyl Ions and Lead Ions in Water. J. Mater. Chem. 2012, 22, 17222–17226. [Google Scholar] [CrossRef]
- Özcan, A.; Öncü, E.M.; Özcan, A.S. Kinetics, Isotherm and Thermodynamic Studies of Adsorption of Acid Blue 193 from Aqueous Solutions onto Natural Sepiolite. Colloids Surf. A 2006, 277, 90–97. [Google Scholar] [CrossRef]
- Lu, Q.; Li, Q.; Zhang, J.; Li, J.; Lu, J. Facile Mesoporous Template-Assisted Hydrothermal Synthesis of Ordered Mesoporous Magnesium Silicate as an Efficient Adsorbent. Appl. Surf. Sci. 2016, 360, 889–895. [Google Scholar] [CrossRef]
- Huang, R.; Wu, M.; Zhang, T.; Li, D.; Tang, P.; Feng, Y. Template-Free Synthesis of Large-Pore-Size Porous Magnesium Silicate Hierarchical Nanostructures for High-Efficiency Removal of Heavy Metal Ions. ACS Sustain. Chem. Eng. 2017, 5, 2774–2780. [Google Scholar] [CrossRef]
- Narasimharao, K.; Ali, T.T.; Bawaked, S.; Basahel, S. Effect of Si Precursor on Structural and Catalytic Properties of Nanosize Magnesium Silicates. Appl. Catal. A Gen. 2014, 488, 208–218. [Google Scholar] [CrossRef]
- Gui, C.X.; Wang, Q.Q.; Hao, S.M.; Qu, J.; Huang, P.P.; Cao, C.Y.; Song, W.G.; Yu, Z.Z. Sandwichlike Magnesium Silicate/Reduced Graphene Oxide Nanocomposite for Enhanced Pb2+ and Methylene Blue Adsorption. ACS Appl. Mater. Interfaces 2014, 6, 14653–14659. [Google Scholar] [CrossRef] [PubMed]
- Cao, C.Y.; Wei, F.; Qu, J.; Song, W.G. Programmed Synthesis of Magnetic Magnesium Silicate Nanotubes with High Adsorption Capacities for Lead and Cadmium Ions. Chem. Eur. J. 2013, 19, 1558–1562. [Google Scholar] [CrossRef] [PubMed]
- Zheng, J.; Cheng, C.; Yan, R.-W.; Fang, W.-J.; Chen, C.; Huai, H.-X.; Wang, C.-C. Synthesis of Yolk–Shell Magnetic Magnesium Silicate with Tunable Yolk Morphology for Removal of Methylene Blue in Water. J. Alloys Compd. 2014, 596, 5–9. [Google Scholar] [CrossRef]
- Yari, S.; Abbasizadeh, S.; Mousavi, S.E.; Moghaddam, M.S.; Moghaddam, A.Z. Adsorption of Pb(II) and Cu(II) Ions from Aqueous Solution by an Electrospun CeO2 Nanofiber Adsorbent Functionalized with Mercapto Groups. Process Saf. Environ. 2015, 94, 159–171. [Google Scholar] [CrossRef]
- Tripathi, S.; Bose, R.; Roy, A.; Nair, S.; Ravishankar, N. Synthesis of Hollow Nanotubes of Zn2SiO4 or SiO2: Mechanistic Understanding and Uranium Adsorption Behavior. ACS Appl. Mater. Interfaces 2015, 7, 26430–26436. [Google Scholar] [CrossRef] [PubMed]
- Homaeigohar, S.; Zillohu, A.U.; Abdelaziz, R.; Hedayati, M.K.; Elbahri, M. A Novel Nanohybrid Nanofibrous Adsorbent for Water Purification from Dye Pollutants. Materials 2016, 9, 848. [Google Scholar] [CrossRef] [PubMed]
- Janaki, V.; Oh, B.-T.; Shanthi, K.; Lee, K.-J.; Ramasamy, A.K.; Kamala-Kannan, S. Polyaniline/Chitosan Composite: An Eco-Friendly Polymer for Enhanced Removal of Dyes from Aqueous Solution. Synth. Met. 2012, 162, 974–980. [Google Scholar] [CrossRef]
- Dogan, M.; Alkan, M.; Turkyilmaz, A.; Ozdemir, Y. Kinetics and Mechanism of Removal of Methylene Blue by Adsorption onto Perlite. J. Hazard. Mater. 2004, 109, 141–148. [Google Scholar] [PubMed]
- Ferrero, F. Adsorption of Methylene Blue on Magnesium Silicate: Kinetics, Equilibria and Comparison with Other Adsorbents. J. Environ. Sci. 2010, 22, 467–473. [Google Scholar] [CrossRef]
- Ravikovitch, P.I.; Haller, G.L.; Neimark, A.V. Density Functional Theory Model for Calculating Pore Size Distributions: Pore Structure of Nanoporous Catalysts. Adv. Colloid Interface Sci. 1998, 76–77, 203–226. [Google Scholar] [CrossRef]
- Al-Ghouti, M.A.; Khraisheh, M.A.M.; Allen, S.J.; Ahmad, M.N. The Removal of Dyes from Textile Wastewater: A Study of the Physical Characteristics and Adsorption Mechanisms of Diatomaceous Earth. J. Environ. Manag. 2003, 69, 229–238. [Google Scholar] [CrossRef]
- Wang, W.; Tian, G.; Zhang, Z.; Wang, A. A Simple Hydrothermal Approach to Modify Palygorskite for High-Efficient Adsorption of Methylene Blue and Cu(II) Ions. Chem. Eng. J. 2015, 265, 228–238. [Google Scholar] [CrossRef]
- Cottet, L.; Almeida, C.A.P.; Naidek, N.; Viante, M.F.; Lopes, M.C.; Debacher, N.A. Adsorption Characteristics of Montmorillonite Clay Modified with Iron Oxide with Respect to Methylene Blue in Aqueous Media. Appl. Clay Sci. 2014, 95, 25–31. [Google Scholar] [CrossRef]
- Zhang, J.; Dang, L.; Zhang, M.; Lu, Q.; Zhao, S. Characterization of Mesoporous Magnesium Silicate with Hierarchical Structure and Its Adsorption Performance for Dye and Lead Ion. Surf. Interfaces 2017, 8, 112–118. [Google Scholar] [CrossRef]
- Brew, D.R.M.; Glasser, F.P. Synthesis and Characterisation of Magnesium Silicate Hydrate Gels. Cem. Concr. Res. 2005, 35, 85–98. [Google Scholar] [CrossRef]
- Bernard, E.; Lothenbach, B.; Rentsch, D.; Pochard, I.; Dauzères, A. Formation of Magnesium Silicate Hydrates (M-S-H). Phys. Chem. Earth 2017, 99, 142–157. [Google Scholar] [CrossRef]
- Wu, Z.; Zhong, H.; Yuan, X.; Wang, H.; Wang, L.; Chen, X.; Zeng, G.; Wu, Y. Adsorptive Removal of Methylene Blue by Rhamnolipid-Functionalized Graphene Oxide from Wastewater. Water Res. 2014, 67, 330–344. [Google Scholar] [CrossRef] [PubMed]
- Zhang, M.; Song, L.; Jiang, H.; Li, S.; Shao, Y.; Yang, J.; Li, J. Biomass Based Hydrogel as An Adsorbent for the Fast Removal of Heavy Metal Ions from Aqueous Solutions. J. Mater. Chem. A 2017, 5, 3434–3446. [Google Scholar] [CrossRef]
- Yu, R.; Shi, Y.; Yang, D.; Liu, Y.; Qu, J.; Yu, Z.Z. Graphene Oxide/Chitosan Aerogel Microspheres with Honeycomb-Cobweb and Radially Oriented Microchannel Structures for Broad-Spectrum and Rapid Adsorption of Water Contaminants. ACS Appl. Mater. Interfaces 2017, 9, 21809–21819. [Google Scholar] [CrossRef] [PubMed]
- Chen, Y.; He, M.; Wang, C.; Wei, Y. A Novel Polyvinyltetrazole-Grafted Resin with High Capacity for Adsorption of Pb(II), Cu(II) and Cr(III) Ions from Aqueous Solutions. J. Mater. Chem. A 2014, 2, 10444–10453. [Google Scholar] [CrossRef]
- Ghaemi, A.; Torab-Mostaedi, M.; Ghannadi-Maragheh, M. Characterizations of Strontium(II) and Barium(II) Adsorption from Aqueous Solutions Using Dolomite Powder. J. Hazard. Mater. 2011, 190, 916–921. [Google Scholar] [CrossRef] [PubMed]
- Pan, Y.; Liu, Z.; Wang, W.; Peng, C.; Shi, K.; Ji, X. Highly Efficient Macroporous Adsorbents for Toxic Metal Ions in Water Systems Based on Polyvinyl Alcohol–Formaldehyde Sponges. J. Mater. Chem. A 2016, 4, 2537–2549. [Google Scholar] [CrossRef]
- Kupai, J.; Razali, M.; Buyuktiryaki, S.; Kecili, R.; Szekely, G. Long-Term Stability and Reusability of Molecularly Imprinted Polymers. Polym. Chem. 2017, 8, 666–673. [Google Scholar] [CrossRef] [PubMed]
- Wang, Y.; Wang, G.; Wang, H.; Liang, C.; Cai, W.; Zhang, L. Chemical-Template Synthesis of Micro/Nanoscale Magnesium Silicate Hollow Spheres for Waste-Water Treatment. Chem. Eur. J. 2010, 16, 3497–3503. [Google Scholar] [CrossRef] [PubMed]
- Kumar, P.S.; Ramalingam, S.; Sathishkumar, K. Removal of Methylene Blue Dye from Aqueous Solution by Activated Carbon Prepared from Cashew Nut Shell as a New Low-Cost Adsorbent. Korean J. Chem. Eng. 2010, 28, 149–155. [Google Scholar] [CrossRef]
- Sui, Z.; Meng, Q.; Zhang, X.; Ma, R.; Cao, B. Green Synthesis of Carbon Nanotube–Graphene Hybrid Aerogels and Their Use as Versatile Agents for Water Purification. J. Mater. Chem. 2012, 22, 8767–8771. [Google Scholar] [CrossRef]
- Zhang, M.; Wang, B.; Zhang, Y.; Li, W.; Gan, W.; Xu, J. Facile Synthesis of Magnetic Hierarchical Copper Silicate Hollow Nanotubes for Efficient Adsorption and Removal of Hemoglobin. Dalton Trans. 2016, 45, 922–927. [Google Scholar] [CrossRef] [PubMed]
- Chen, Y.; Chen, L.; Bai, H.; Li, L. Graphene Oxide–Chitosan Composite Hydrogels as Broad-Spectrum Adsorbents for Water Purification. J. Mater. Chem. A 2013, 1, 1992–2001. [Google Scholar] [CrossRef]


| Samples | Si/Mg Molar Ratio Tested by ICP | Si/Mg Molar Ratio Tested by EDX | Surface Area (m2·g−1) | Average Pore Diameter (nm) |
|---|---|---|---|---|
| MS-1.00 | 1.06 | 1.09 | 597 | 2.28 |
| MS-1.25 | 1.20 | 1.23 | 428 | 2.56 |
| MS-1.50 | 1.41 | 1.43 | 381 | 2.37 |
| MS-1.75 | 1.66 | 1.73 | 283 | 2.51 |
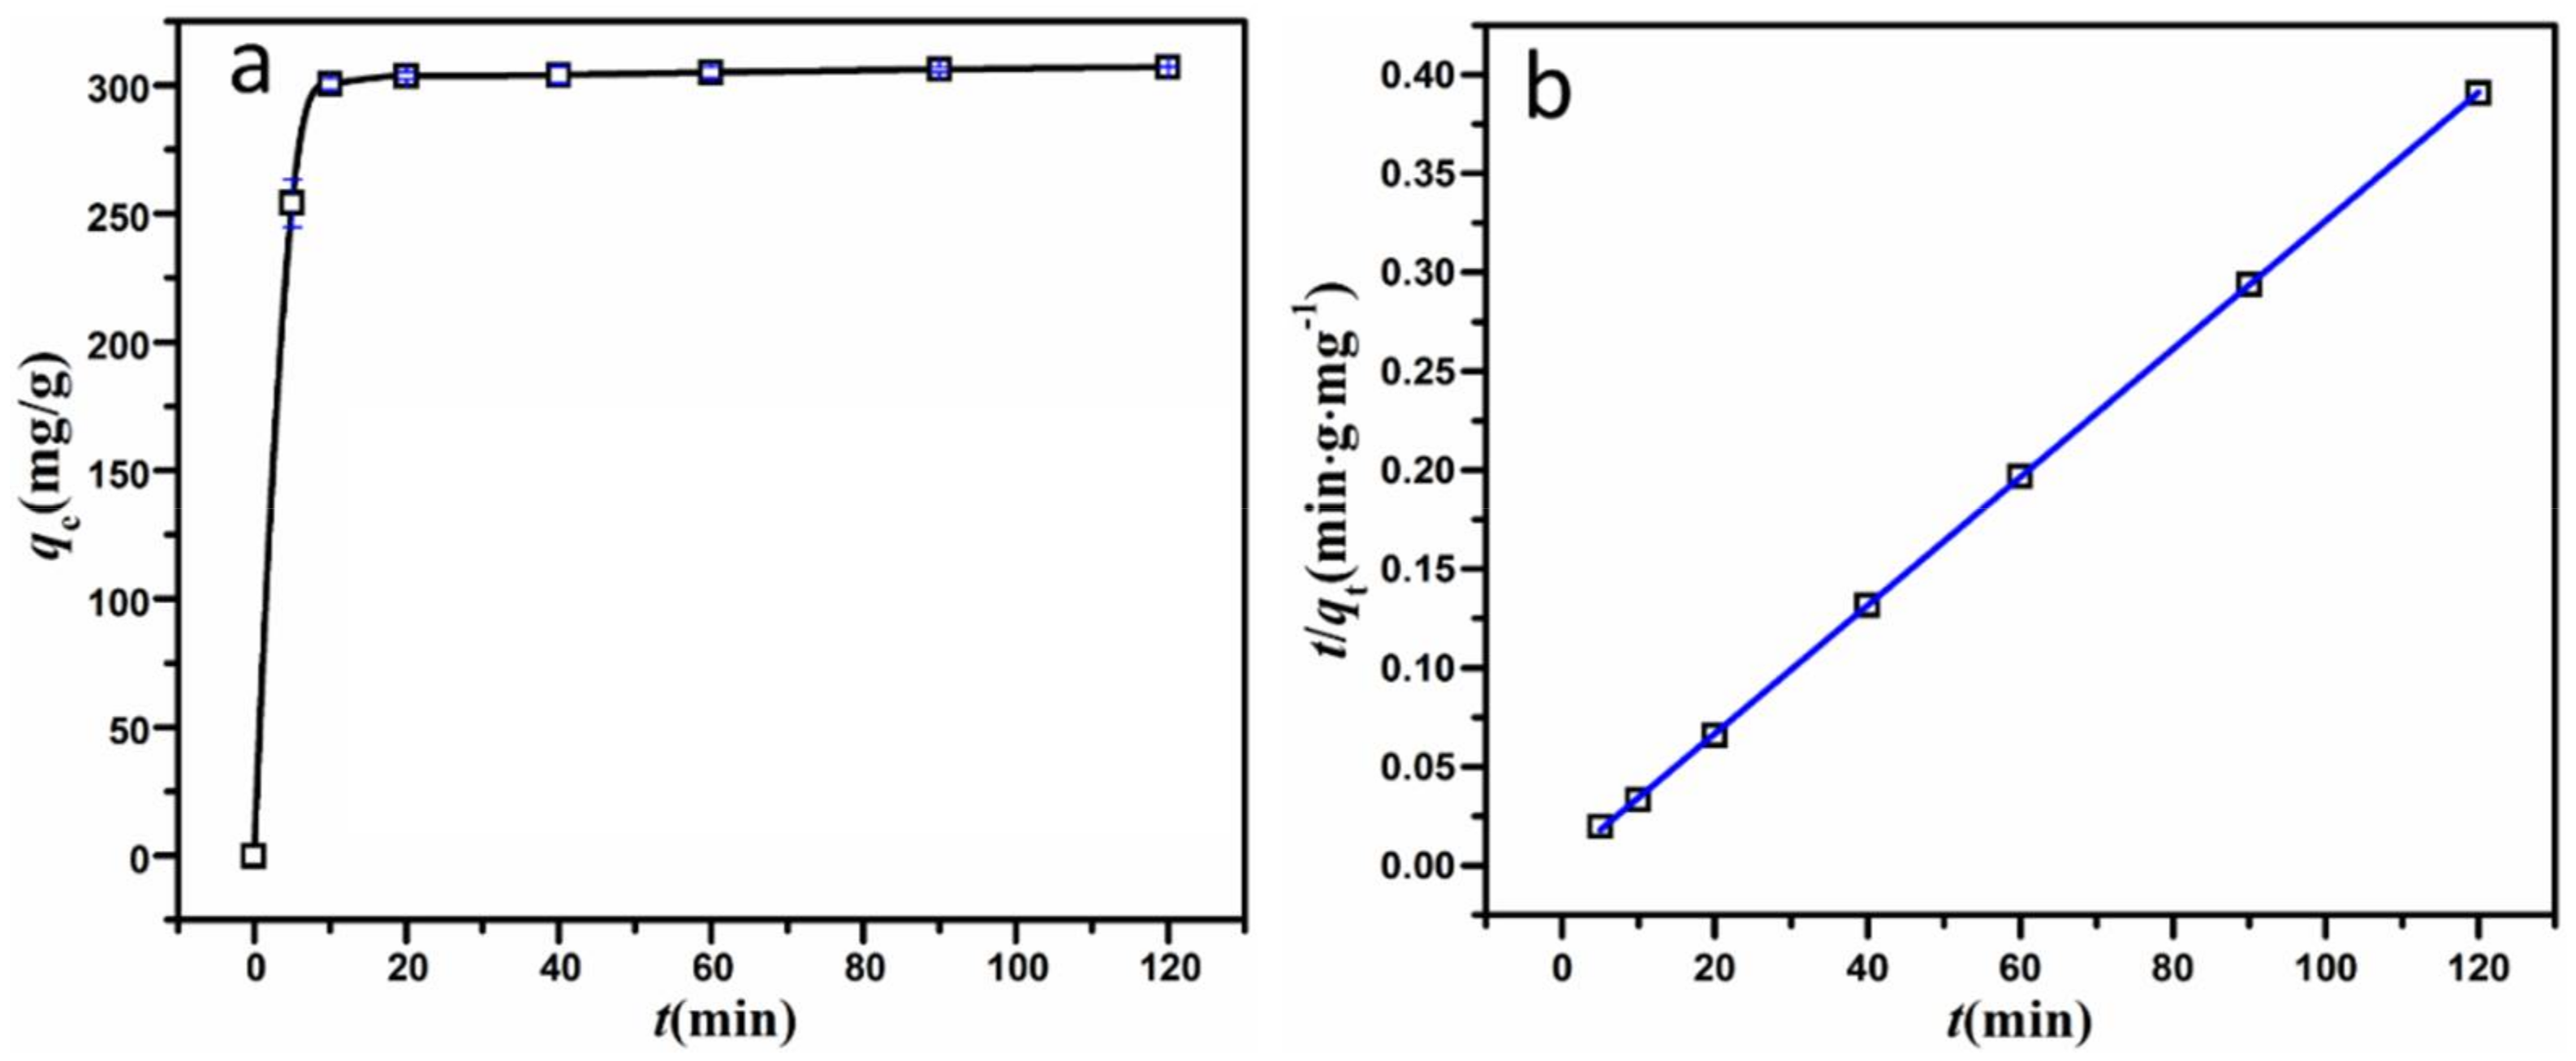
| Sample | qe,exp (mg·g−1) | Pseudo-First-Order Model | Pseudo-Second-Order Model | ||||
|---|---|---|---|---|---|---|---|
| qe,cal (mg·g−1) | k1 | R2 | qe,cal (mg·g−1) | k2 | R2 | ||
| MSH-1.75 | 307 | 50.3 | 0.941 | 0.786 | 308 | 0.00552 | 0.999 |
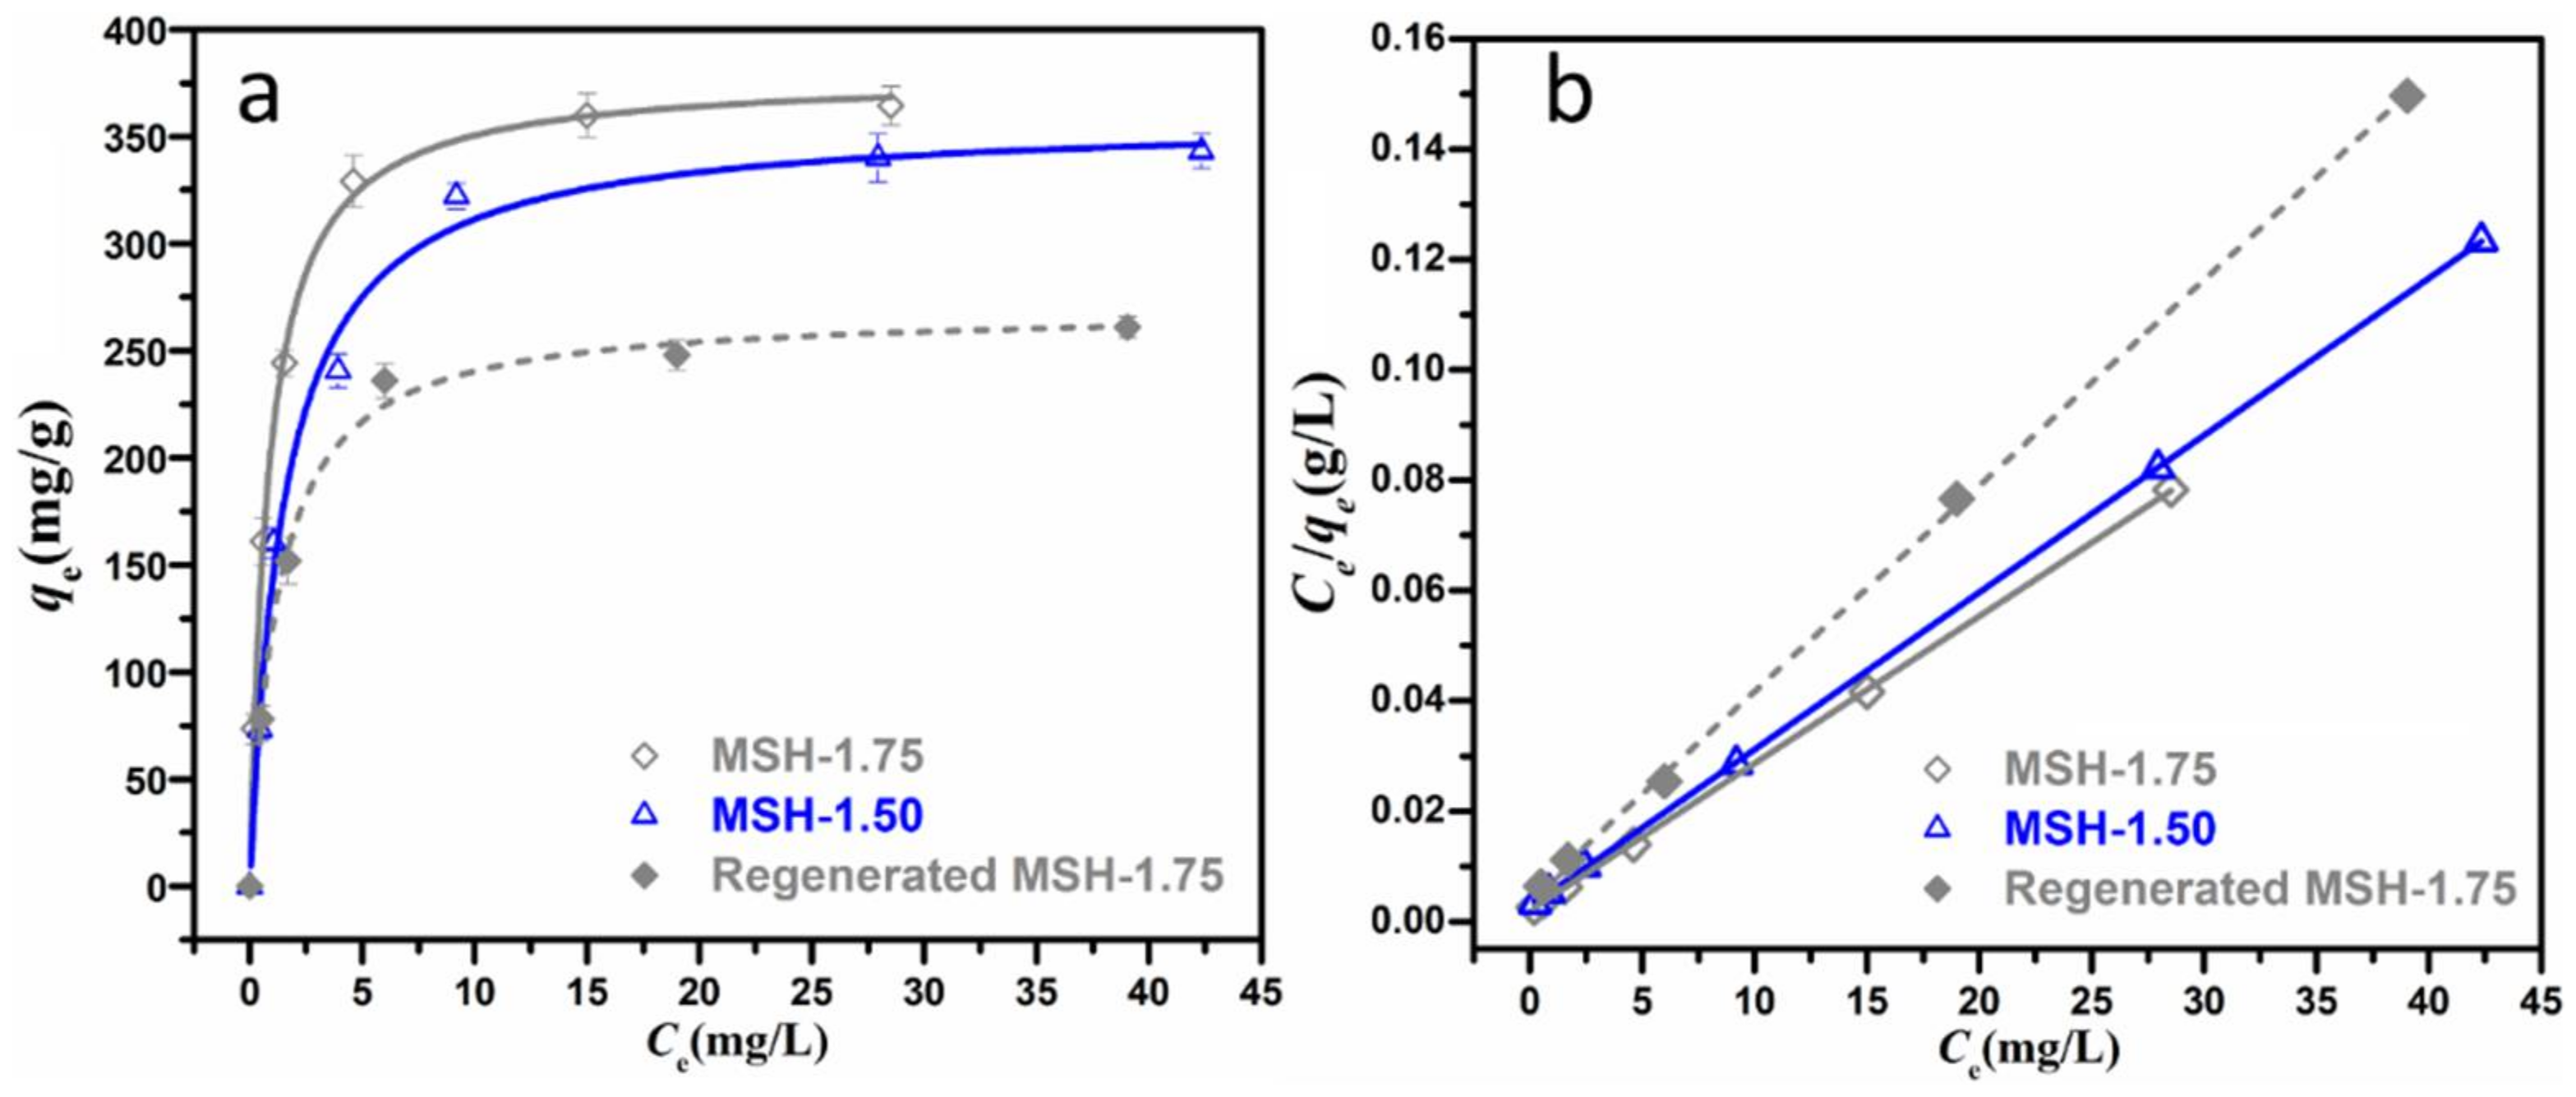
| Sample | Langmuir | Freundlich | ||||
|---|---|---|---|---|---|---|
| qm | KL | R2 | n | KF | R2 | |
| MSH-1.50 | 351 | 1.04 | 0.999 | 3.59 | 146 | 0.834 |
| MSH-1.75 | 374 | 1.34 | 0.999 | 3.31 | 166 | 0.820 |
| Regenerated MSH-1.75 | 268 | 0.84 | 0.999 | - | - | - |
| Adsorbents | Equilibrium Time | pH Value | Surface Area (m2·g−1) | Adsorption Capacity (mg·g−1) | Ref. |
|---|---|---|---|---|---|
| MgSi hollow spheres | 30 min | - | 521 | 207 | [32] |
| Florisil | 4 h | - | 250 | 149.3 | [17] |
| t-yolk-shell magnetic MgSi | 15 h | - | 293 | 188 | [11] |
| MgSi nanotubes | - | - | 649 | 276 | [4] |
| Diatomite | 48 h | 11 | 27.8 | 198 | [19] |
| Activated carbon | 90 min | - | 984 | 68.72 | [33] |
| Graphene-c-MWCNT hybrid aerogel | - | - | 435 | 190.0 | [34] |
| Copper silicate hollow nanotubes | - | - | 518 | 173 | [35] |
| Modified montmorillonite clays | - | - | - | 71 | [21] |
| GO-CS hydrogels | 58 h | 6.5 | - | 350 | [36] |
| MSH-1.75 | 2 h | 10.1 | 283 | 374 | this work |
© 2018 by the authors. Licensee MDPI, Basel, Switzerland. This article is an open access article distributed under the terms and conditions of the Creative Commons Attribution (CC BY) license (http://creativecommons.org/licenses/by/4.0/).
Share and Cite
Huang, R.; He, L.; Zhang, T.; Li, D.; Tang, P.; Zhao, Y.; Feng, Y. Fabrication and Adsorption Behavior of Magnesium Silicate Hydrate Nanoparticles towards Methylene Blue. Nanomaterials 2018, 8, 271. https://doi.org/10.3390/nano8050271
Huang R, He L, Zhang T, Li D, Tang P, Zhao Y, Feng Y. Fabrication and Adsorption Behavior of Magnesium Silicate Hydrate Nanoparticles towards Methylene Blue. Nanomaterials. 2018; 8(5):271. https://doi.org/10.3390/nano8050271
Chicago/Turabian StyleHuang, Renyao, Li He, Tao Zhang, Dianqing Li, Pinggui Tang, Yingying Zhao, and Yongjun Feng. 2018. "Fabrication and Adsorption Behavior of Magnesium Silicate Hydrate Nanoparticles towards Methylene Blue" Nanomaterials 8, no. 5: 271. https://doi.org/10.3390/nano8050271
APA StyleHuang, R., He, L., Zhang, T., Li, D., Tang, P., Zhao, Y., & Feng, Y. (2018). Fabrication and Adsorption Behavior of Magnesium Silicate Hydrate Nanoparticles towards Methylene Blue. Nanomaterials, 8(5), 271. https://doi.org/10.3390/nano8050271