Article

Preparation of g-C3N4/Graphene Composite for Detecting NO2 at Room Temperature

1
Department of Physics, Dongguk University, Seoul 04620, Korea
2
School of Materials Science and Engineering, Harbin University of Science and Technology, Harbin 150040, China
*
Author to whom correspondence should be addressed.
Nanomaterials 2017, 7(1), 12; https://doi.org/10.3390/nano7010012
Submission received: 8 November 2016 / Revised: 18 December 2016 / Accepted: 4 January 2017 / Published: 12 January 2017
(This article belongs to the Special Issue Nanocomposite Coatings)

Abstract

:
Graphitic carbon nitride (g-C3N4) nanosheets were exfoliated from bulk g-C3N4 and utilized to improve the sensing performance of a pure graphene sensor for the first time. The role of hydrochloric acid treatment on the exfoliation result was carefully examined. The exfoliated products were characterized by X-ray diffraction (XRD) patterns, scanning electron microscopy (SEM), atomic force microscopy (AFM), and UV-Vis spectroscopy. The exfoliated g-C3N4 nanosheets exhibited a uniform thickness of about 3–5 nm and a lateral size of about 1–2 µm. A g-C3N4/graphene nanocomposite was prepared via a self-assembly process and was demonstrated to be a promising sensing material for detecting nitrogen dioxide gas at room temperature. The nanocomposite sensor exhibited better recovery as well as two-times the response compared to pure graphene sensor. The detailed sensing mechanism was then proposed.

1. Introduction

Gas sensors are devices that able to respond to specific gasses and they play an important role in industrial chemical processing, environmental monitoring, agriculture, medicine, public safety, and indoor air quality control [1]. Up to now, most commercial gas sensors have been based on metal oxide semiconductors due to their numerous advantages such as low cost, simplicity in measurements, high sensitivity towards various gases with ease of fabrication, and high compatibility with other processes [2,3,4]. However, these conventional sensors generally require high working temperatures (200 °C to 500 °C); this not only degrades the long-term sensing performance but also greatly limits their applications, e.g., wearable devices [5,6,7].
Recent studies have revealed that two-dimensional (2D) materials, especially graphene, have the potential to detect numerous gases at room temperature owing to their large surface area, high carrier mobility, and low noise. However, many reports have also demonstrated that pristine graphene has a poor gas sensing property owing to the absence of dangling bonds in the structure [8,9]. In order to solve this problem, a doping process and defect engineering have been conducted to improve the gas adsorption of graphene [10,11]. On the other hand, compositing methods such as decorating graphene with metal and metal oxide nanoparticles, as well as with polymers, have also been studied. Compared to pristine graphene, sensors based on graphene compositing with nanoparticles of metals or metal oxides have demonstrated highly sensitive and selective sensing behavior [12,13,14,15], which could be attributed to the excellent catalytic properties and synergistic effects of the partner materials [16,17,18].
On the other hand, graphitic carbon nitride (g-C3N4), as another emerging component with a two-dimensional characteristic structure has attracted considerable attention recently, due to the tri-s-triazine units that are connected by amino groups in each layer and the weak van der Waals forces between layers. The presence of nitrogen atoms in the graphene-like layered g-C3N4 structure gives g-C3N4 its unique properties, such as semiconductor properties, solid alkalinity, and complexing ability, thus endowing it with better performance than graphene in some aspects [19,20]. g-C3N4 has been extensively used as a polymeric photo-catalyst for solar hydrogen production and environmental purification, as well as oxygen reduction and evolution [21,22,23]. A few recent studies have also reported that nanostructured g-C3N4 exhibits excellent gas sensing properties owing to its excellent catalytic property [24,25]. Considering the similar 2D structures as well as the complementary properties between g-C3N4 and graphene, a synergetic effect in sensing performance could be expected if the two components are composited as a gas sensor material.
In this study, we investigated the gas sensing performance of the g-C3N4/graphene composite at room temperature. g-C3N4 nanosheets were prepared using an acid treatment enhanced liquid-phase exfoliation process. The effect of acid treatment time on exfoliation was carefully investigated. The obtained g-C3N4 nanosheets were mixed with exfoliated graphene nanosheets to form a composite which was then tested with NO2. The results demonstrated that compositing g-C3N4 with graphene greatly improves the sensing performance of pure graphene. The sensing mechanism was carefully discussed.

2. Results and Discussion

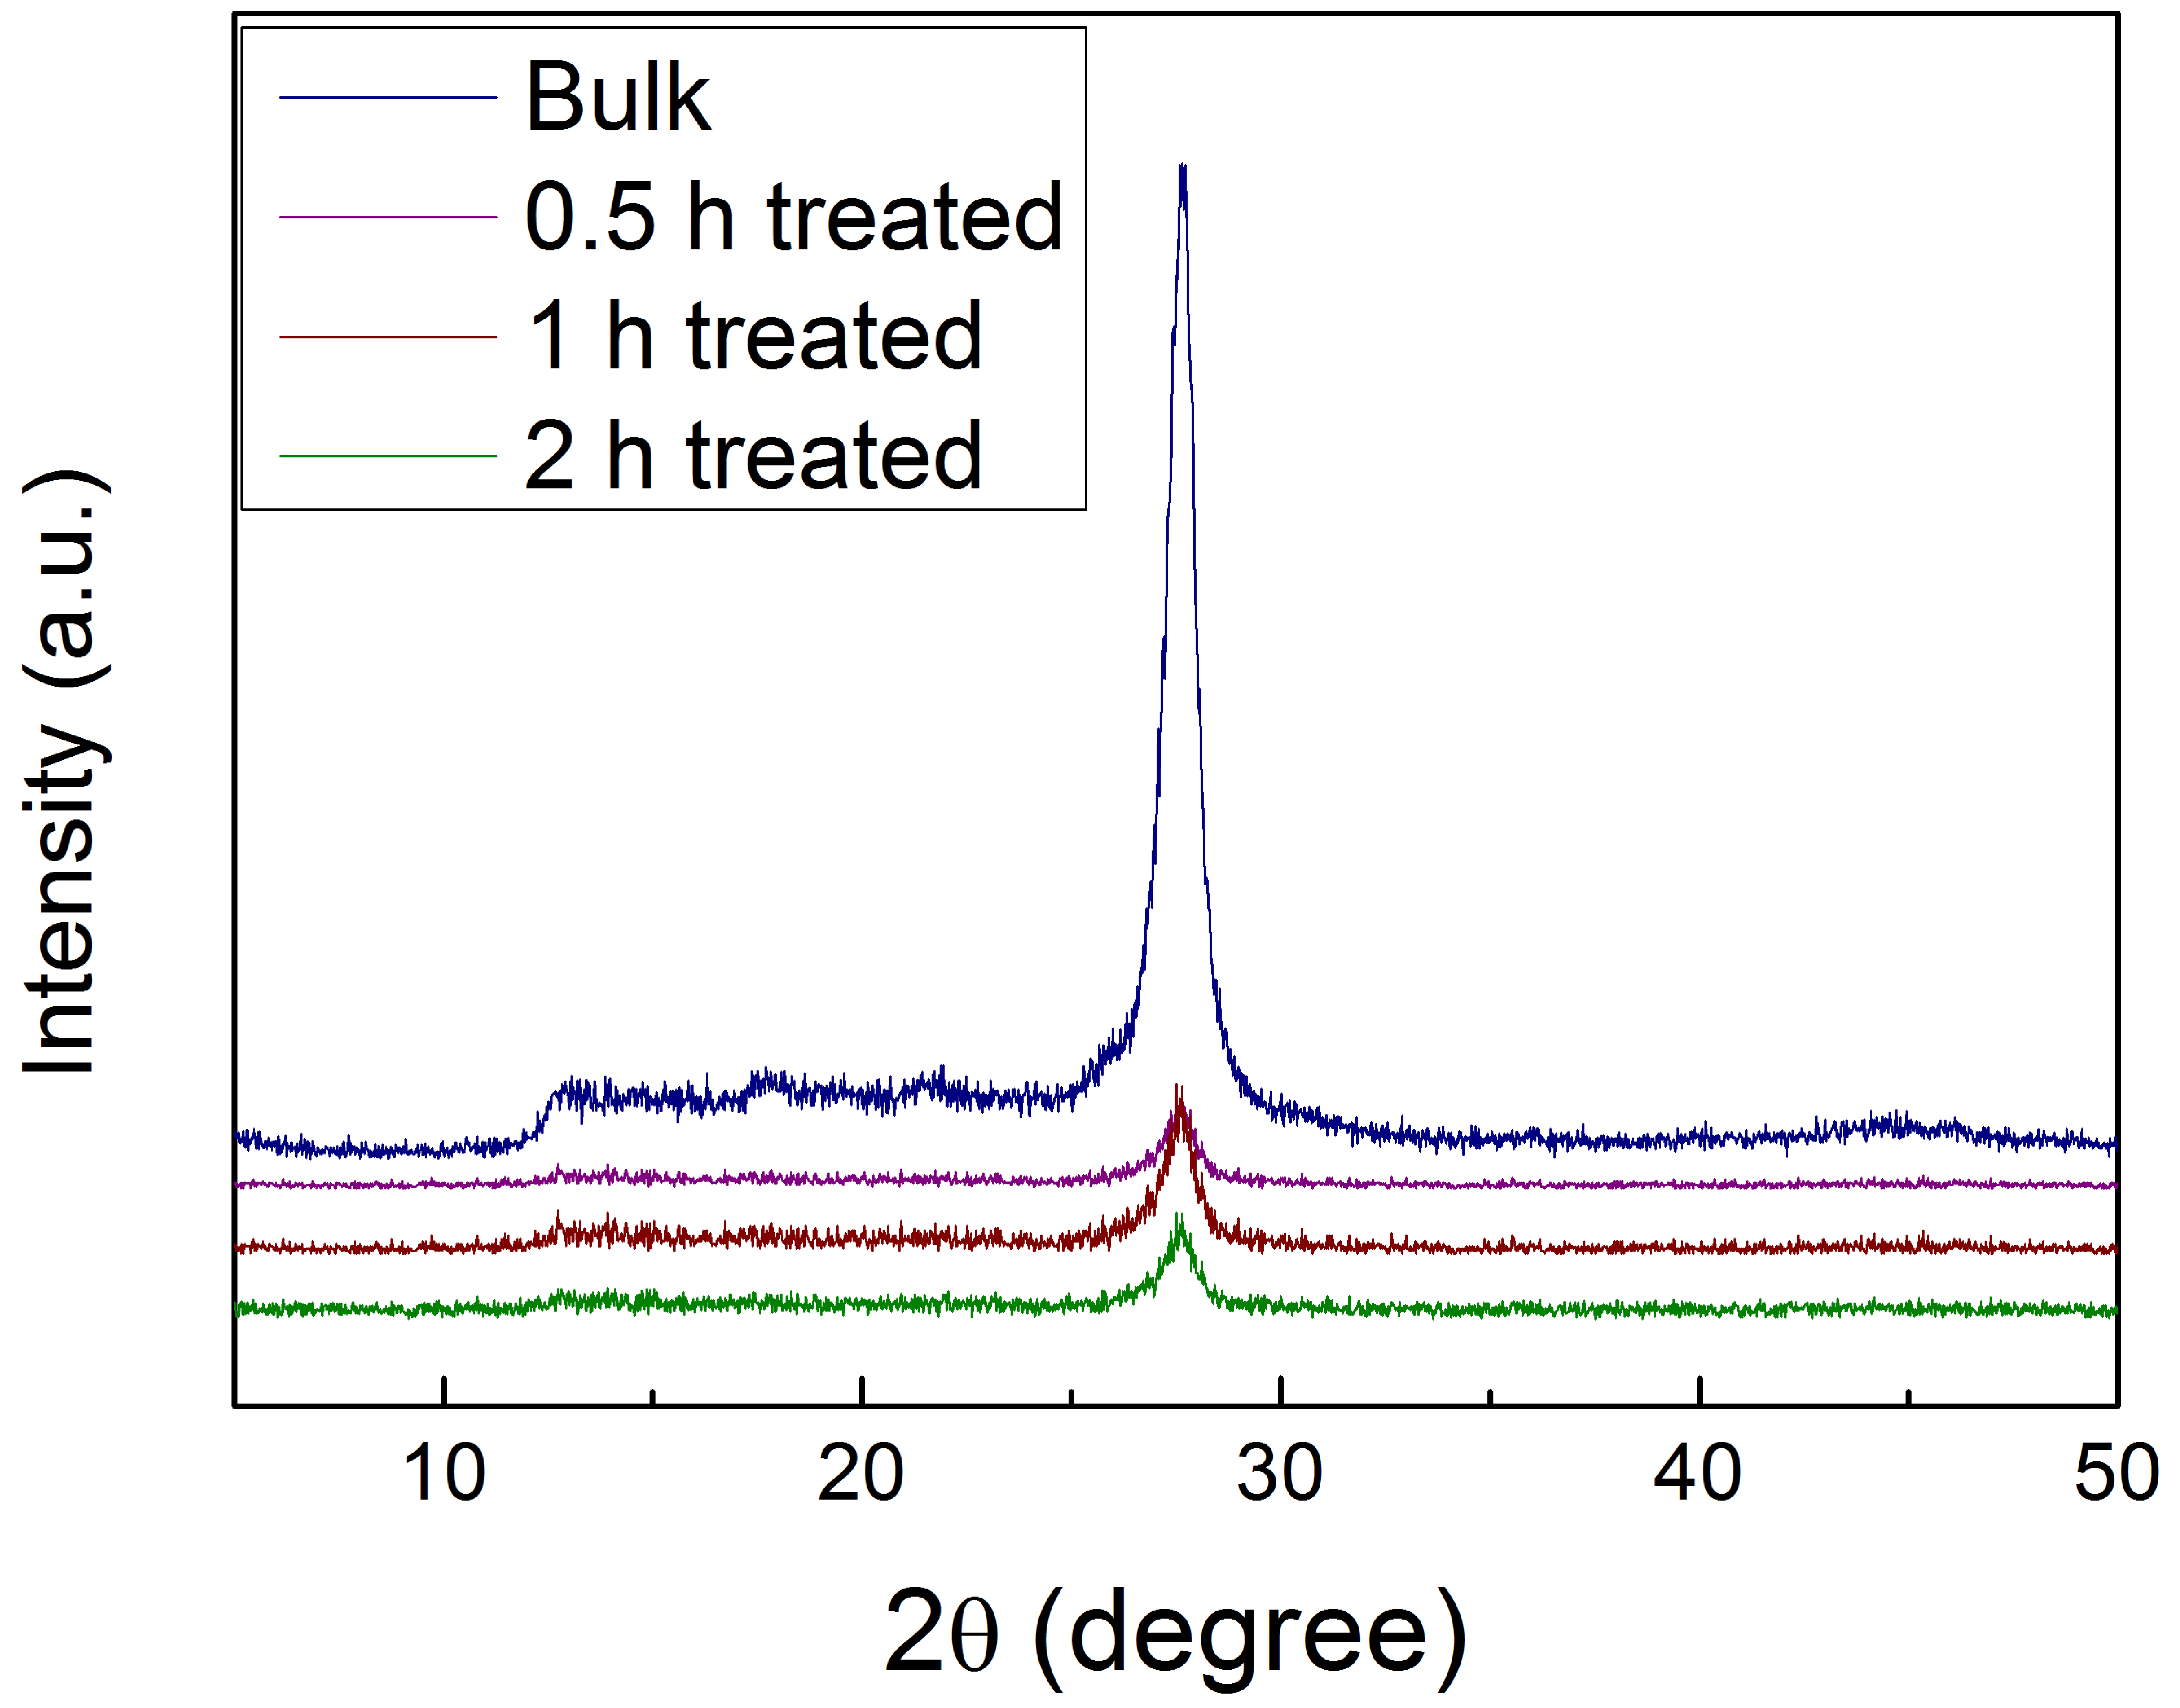
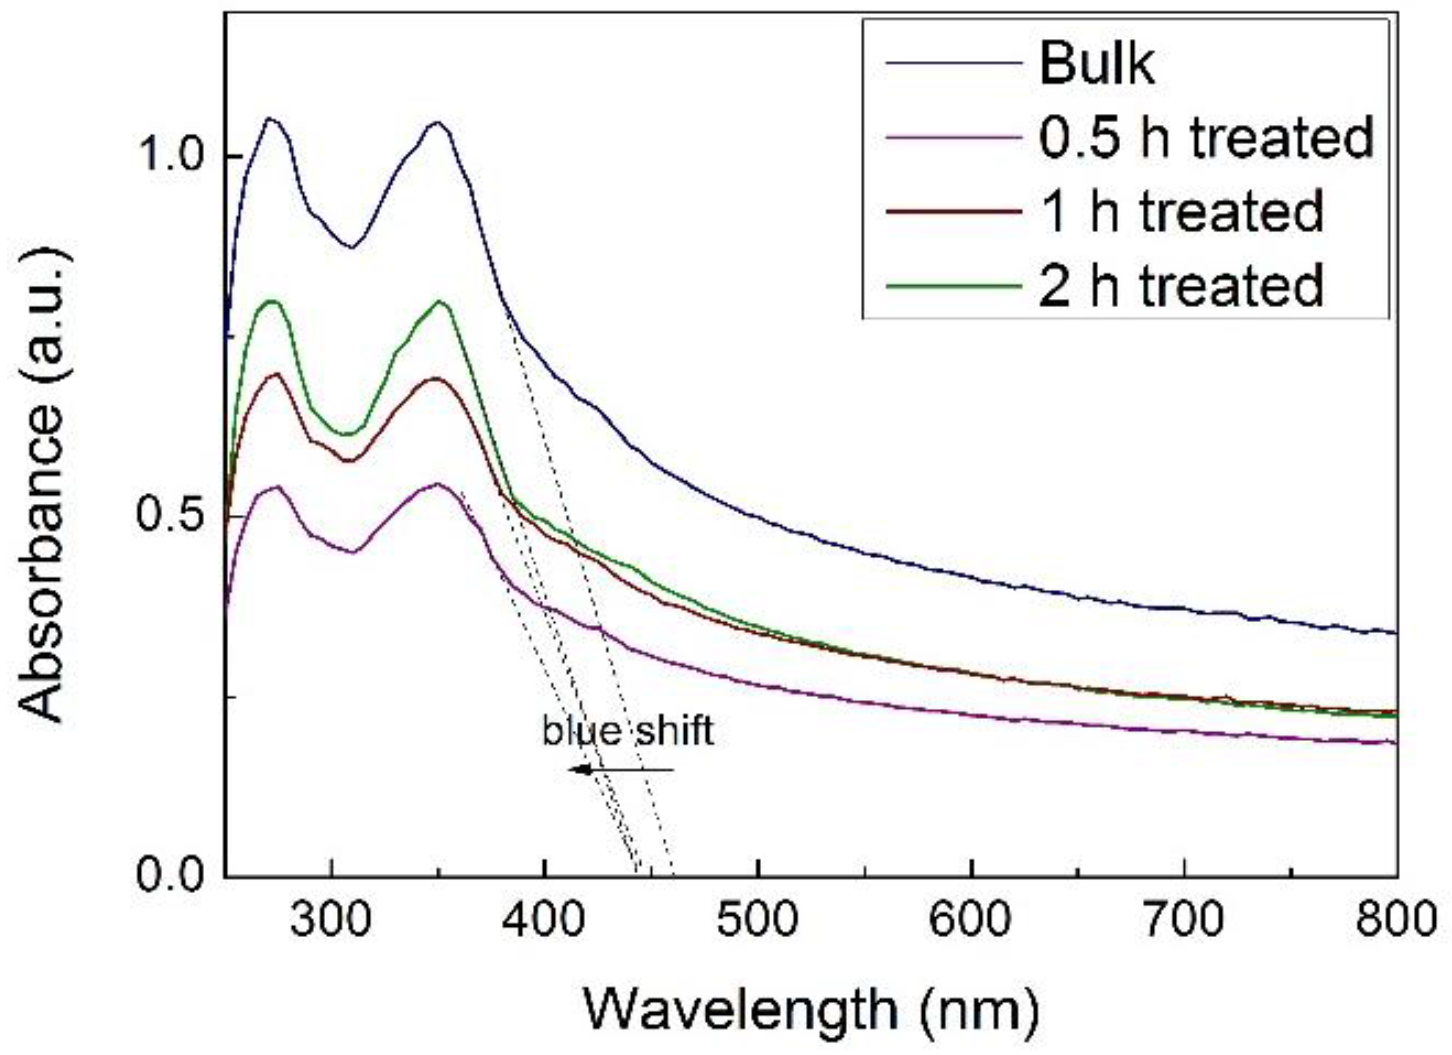
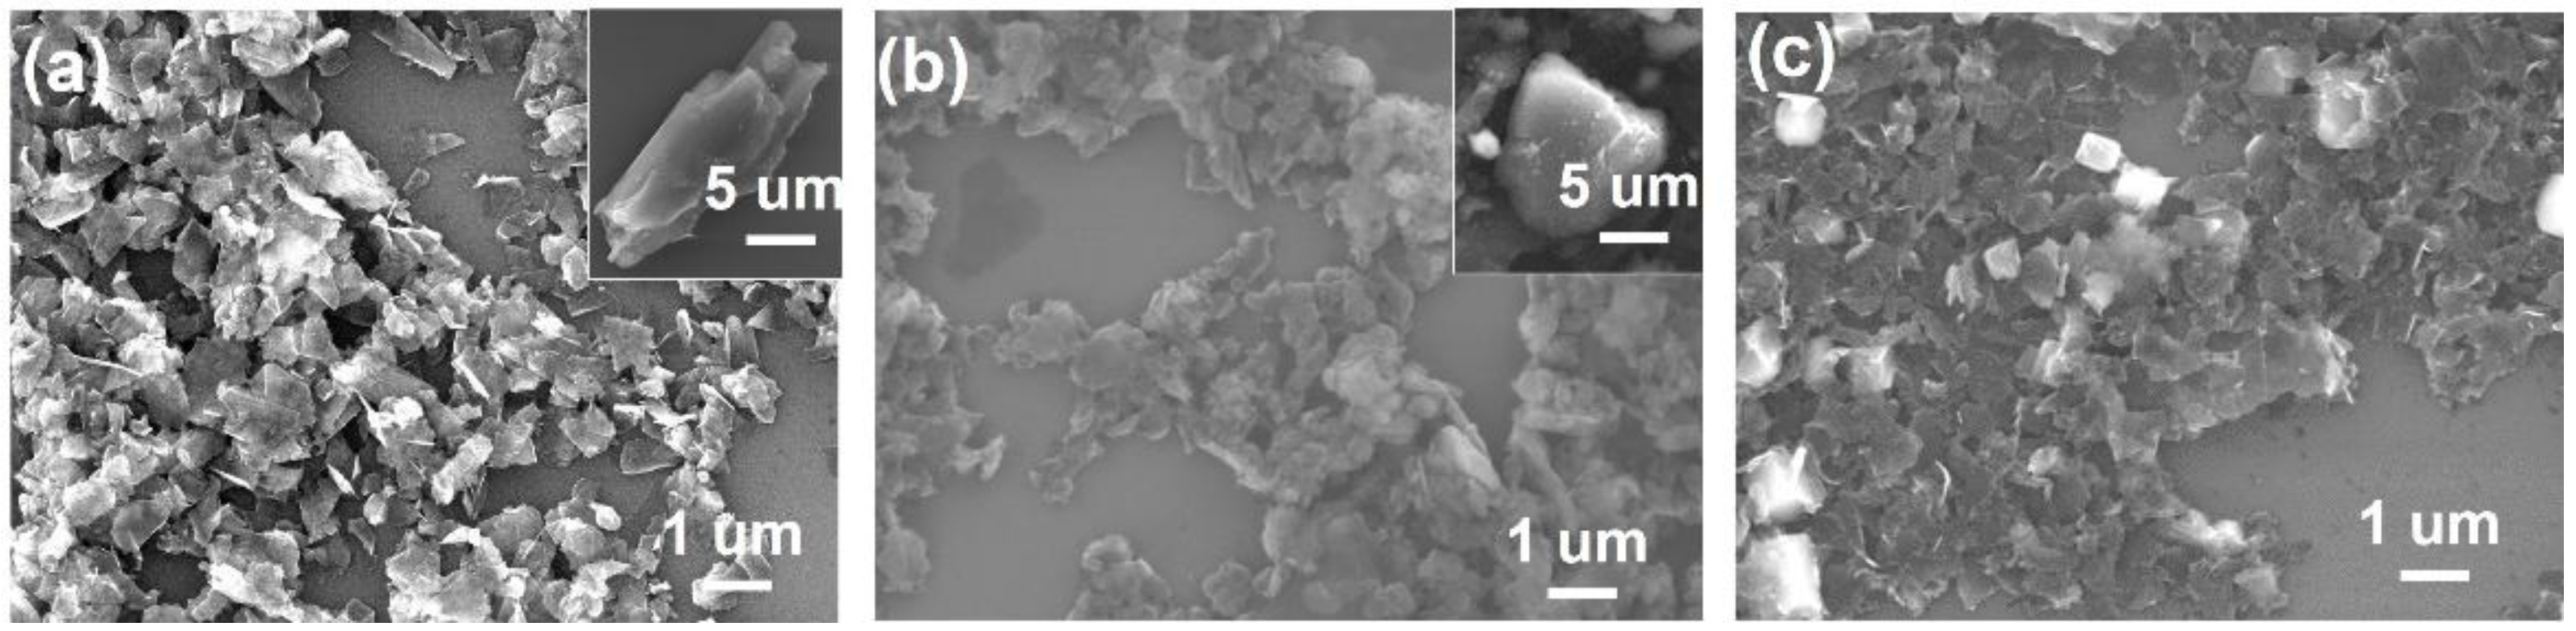
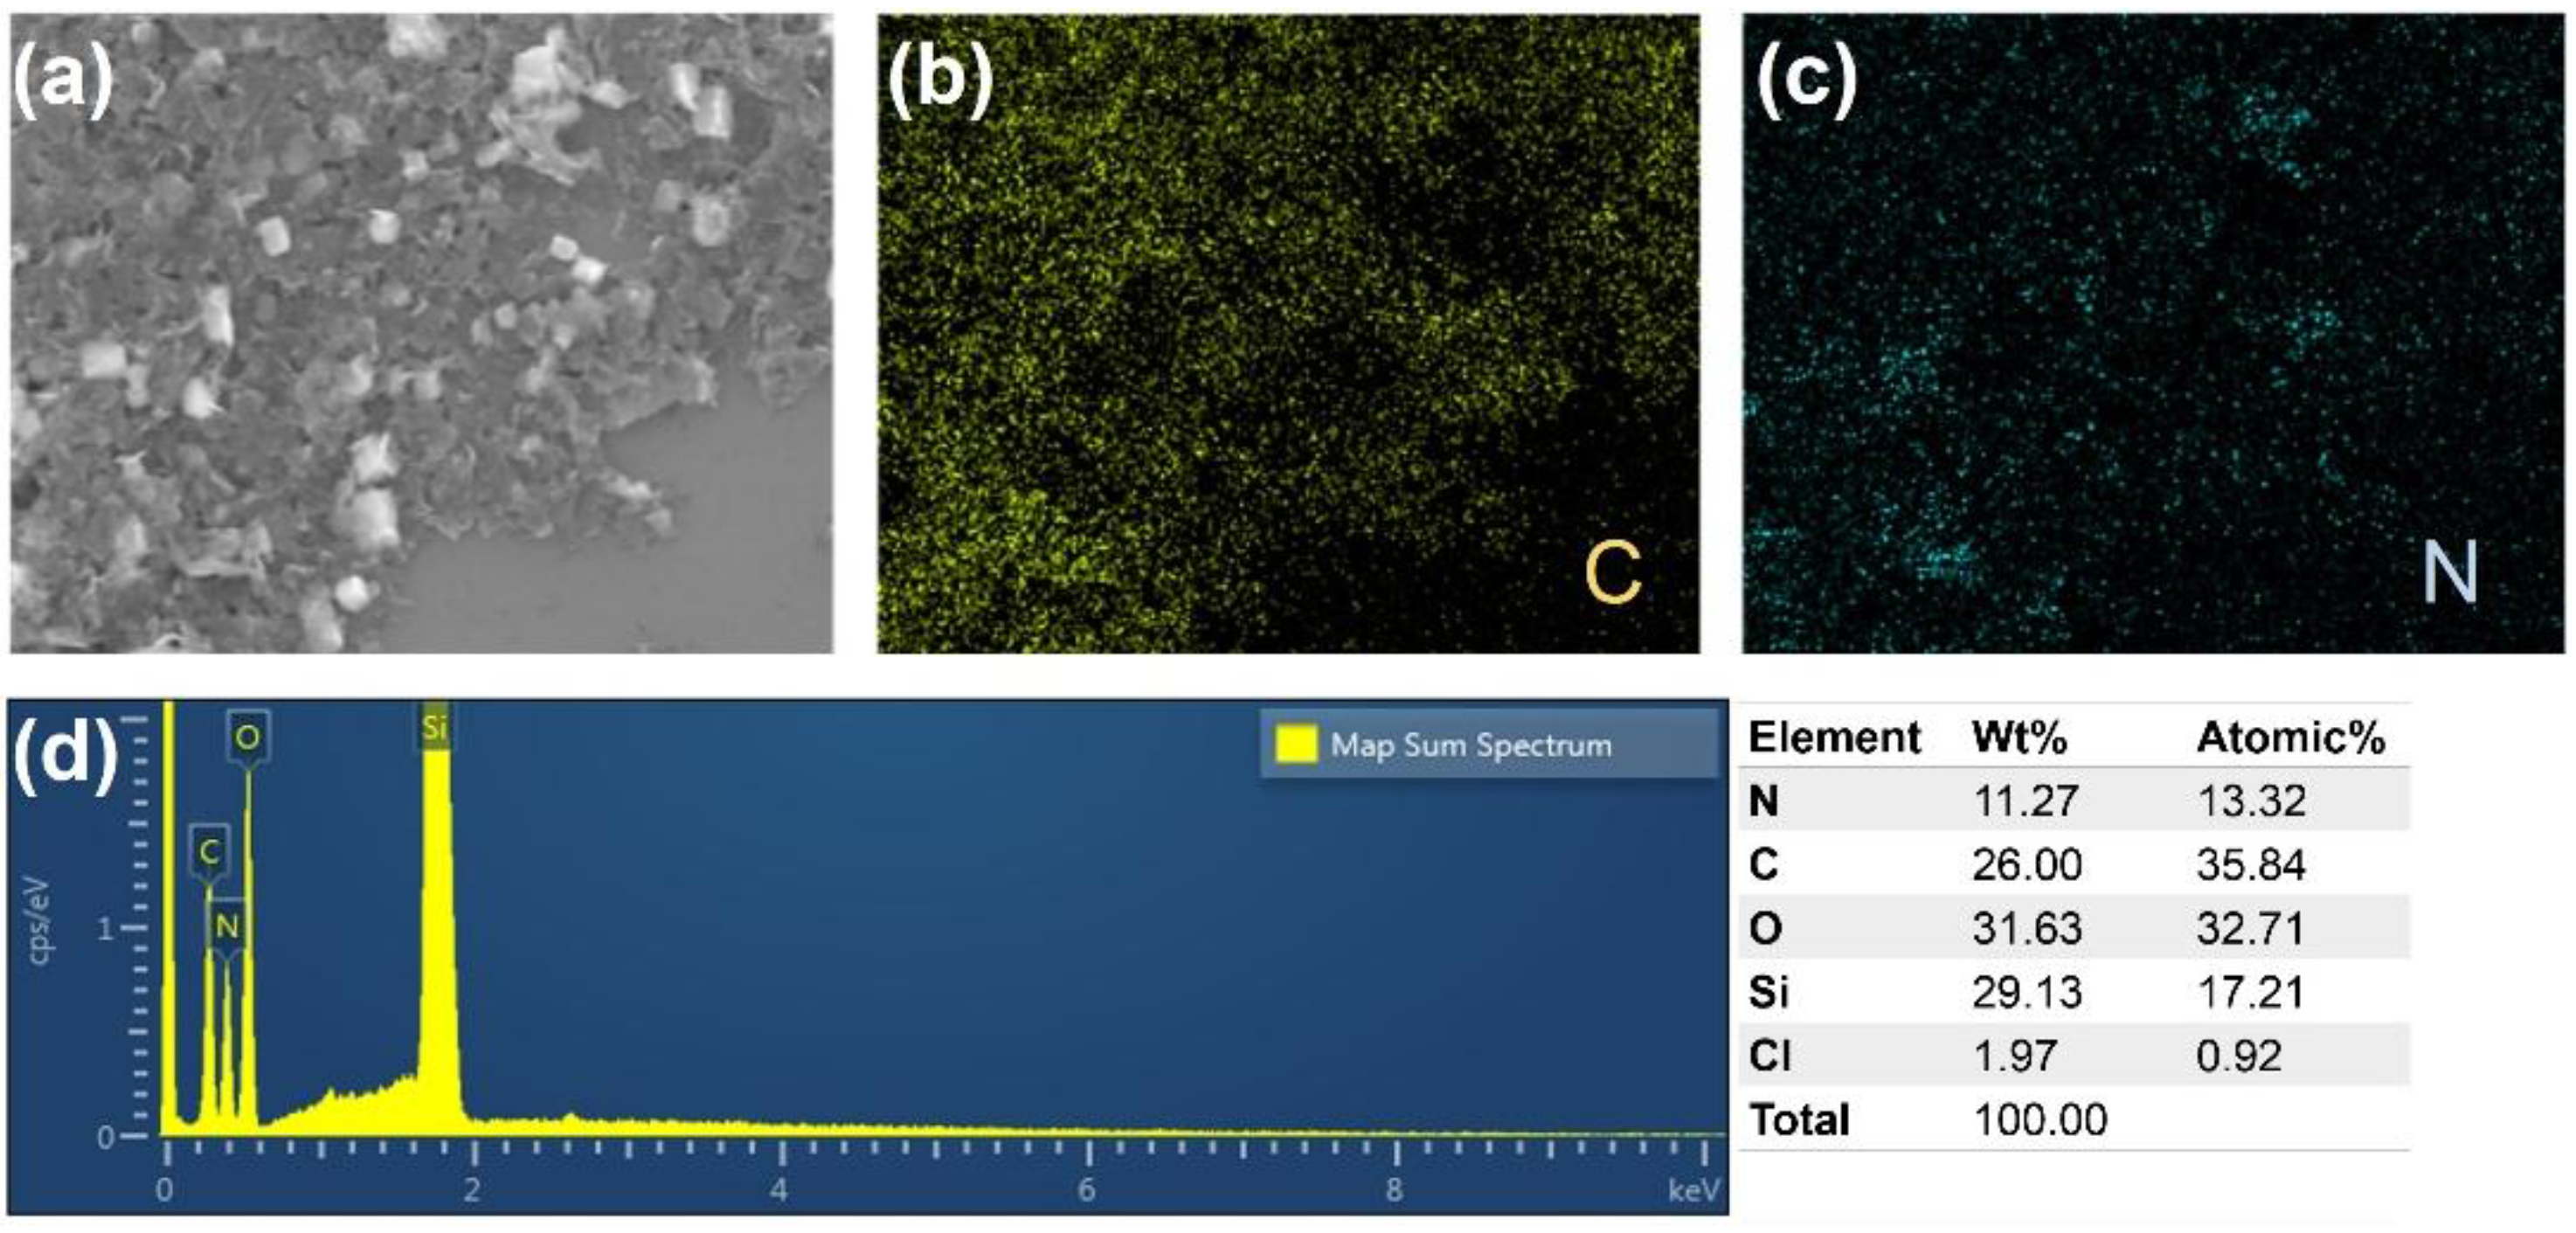
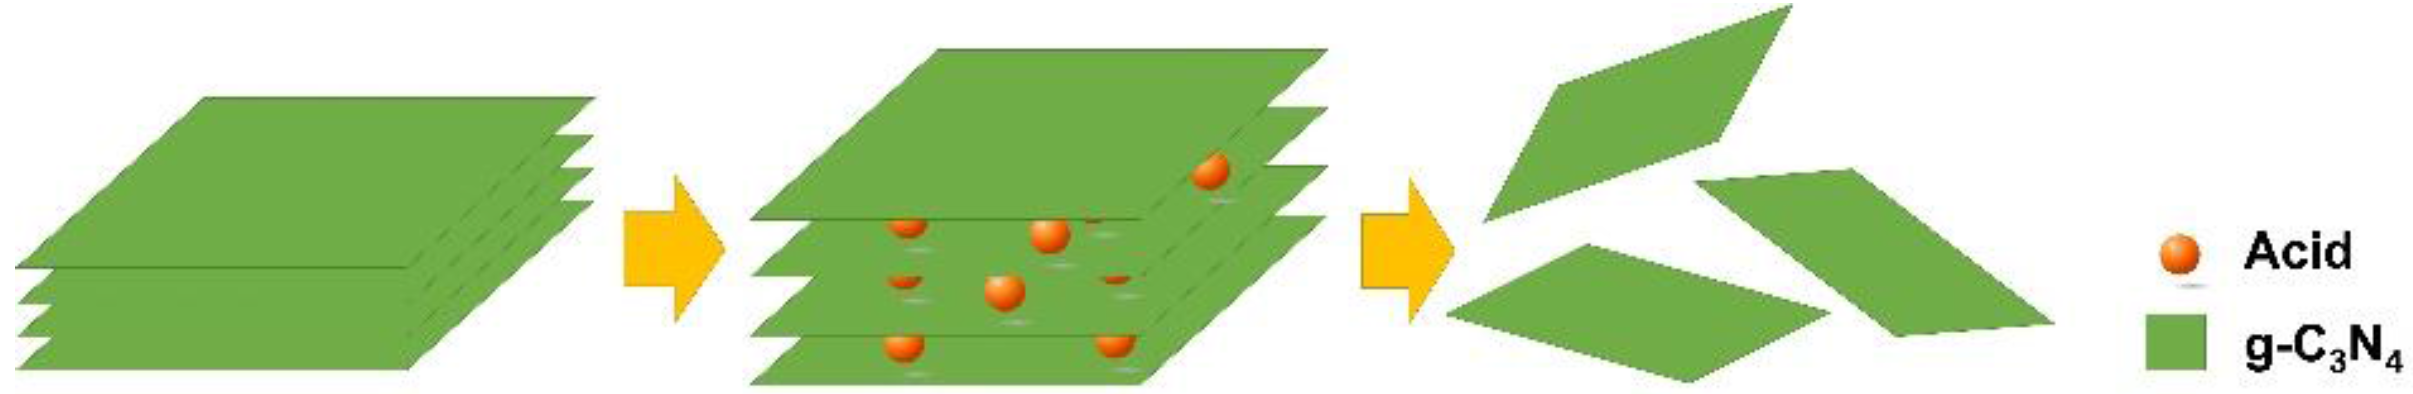
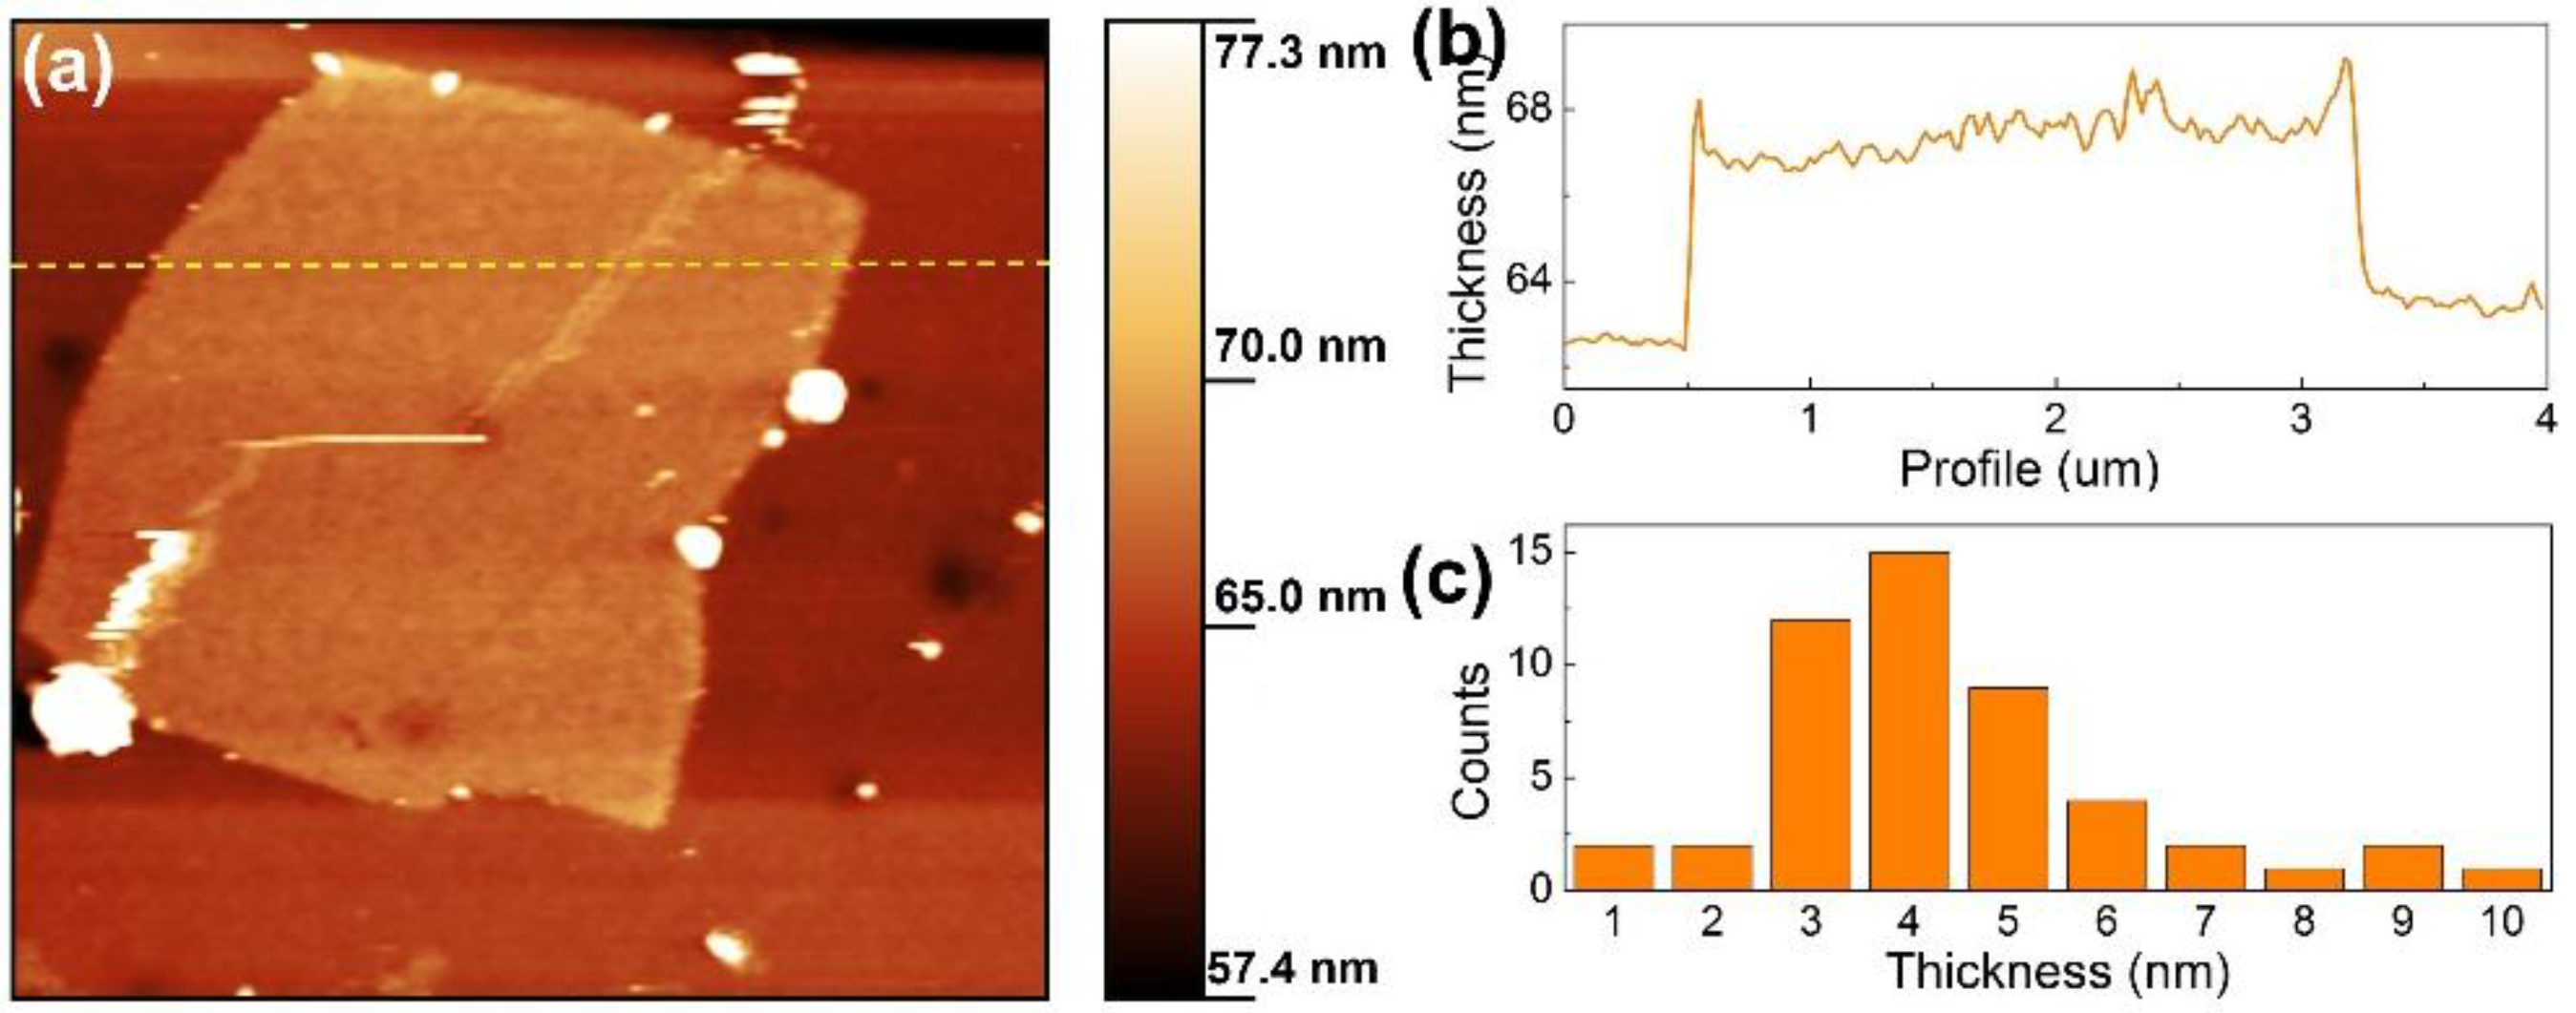
2.1. Acid Treatment Enhanced Exfoliation

Up to now, the lack of a simple approach to producing 2D nanomaterials at a large scale has been the main obstacle to achieving wide application of 2D graphene-like materials. The feasibility of the recently developed ultrasound-assisted liquid-phase exfoliation method has been demonstrated for producing ultrathin nanosheets from bulk 2D material. The cavitation effect induced by the collapse of ultrasonic-produced bubbles generates liquid jets with high temperature, pressure, and speed, which would overcome the interlayer van der Waals force and break up the layered structure to yield individual nanosheets. However, this method is still not robust enough owing to the low yield and re-aggregation tendency after exfoliation. To address these issues, a possible route is the optimization of the solvent. It is reported that the maximization of exfoliation efficiency is related to the surface energy of the solvent. The comparative surface energy between the solvent and the 2D structured solute is favorable for the delamination. Xie and her co-researchers revealed that the surface energy of water matches well with that of g-C3N4. Their works demonstrated that the high dispersion of g-C3N4 individual layers can be realized in water [26]. Another alternative strategy is chemical modification, which involves redox reactions, intercalation, or an ion-exchange process. Typically, as shown in Figure 1, the intercalation of foreign molecules into the interlayer gallery of g-C3N4 would cause the interplanar space to swell, weakening the interlayer reaction, and thus facilitating the exfoliation. In several previous studies, sulphuric acid (H2SO4) or nitric acid (HNO3) was adopted to intercalate the acid ions into the interlayer space of g-C3N4 followed by an ultrasonic treatment, and ultrathin g-C3N4 nanosheets were successfully synthesized [27,28]. However, these strong oxidants might incur structural damage to the products. Mild non-oxidant hydrochloric acid (HCl) would be more suitable for preserving the intrinsic structure of g-C3N4. Moreover, in these previous studies, the controlling factors in the exfoliation process, such as acid treatment time, were rarely considered.
The crystal structures of bulk g-C3N4 and g-C3N4 products exfoliated with different HCl acid treatment times were examined by X-ray diffraction (XRD) patterns. As shown in Figure 2, after exfoliation, both bulk g-C3N4 and the resultant g-C3N4 products remain substantially the same except for some minor changes. No obvious difference was observed between the exfoliated products. All the samples presented a characteristic peak near 27.7°, which can be indexed to the (002) facet caused by the interlayer stacking reflection of conjugated aromatic systems. It was found that the (002) peaks of exfoliated g-C3N4 presented a slight left shift from 27.7° to 27.5°, suggesting loose packing in the exfoliated g-C3N4 product. It is worth noting that the intensity of the (002) peak decreased significantly in the exfoliated sample compared with the bulk sample, demonstrating the successful exfoliation of bulk g-C3N4. It was also observed that the sensitivity of the diffraction peak at 12.74°, which represents the period tri-s-triazine group, was reduced in the exfoliated g-C3N4 compared with the bulk g-C3N4. This could be attributed to the downgrade of the planar size after exfoliation.
The light absorbance of the samples was studied by UV-Vis spectroscopy. As shown in Figure 3, g-C3N4 displayed photoabsorption from ultraviolet to visible light. The bulk g-C3N4 has a band edge at approximately 460 nm corresponding to 2.70 eV. For comparison, all the exfoliated g-C3N4 samples have a band edge at approximately 450 nm, corresponding to a bandgap of 2.74 eV, indicating a slight blue shift of 0.04 eV. The increase of bandgap after exfoliation can be attributed to the well-known quantum confinement effect. When the thickness of the g-C3N4 product after exfoliation becomes ultrathin, approaching the dimension of the de Broglie wavelength, the motion of electrons is confined, leading to the splitting of energy levels, and thus the conduction and valence bands shift in opposite directions, resulting in the increase of the bandgap energy.
The UV-Vis absorption spectra of the samples also provide information of the concentration of the g-C3N4 products. According to the Lambert-Beer law of A/l = αC, where α is absorption coefficient, A is the absorbance, l is light path length, and C is the concentration of solute, the absorption of light is directly proportional to both the concentration of the solute and the thickness of the medium in the light path. Given that the light path was fixed throughout the measurement, the concentration of g-C3N4 could be estimated from the intensity of absorption. As observed from Figure 3, the g-C3N4 product with 0.5 h acid treatment exhibited the lowest concentration. The concentration increased considerably as the acid treatment time extended to 1 h, and then slightly increased as the time further increased to 2 h, suggesting the exfoliation approached saturation.
The morphology of the exfoliated g-C3N4 with 1 h HCl acid treatment was investigated using atomic force microscopy (AFM). As shown in Figure 4a, a well-defined sheet-like g-C3N4 nanostructure was observed. The thickness of the g-C3N4 nanosheet was estimated to be about 4 nm (Figure 4b). Considering the theoretical thickness of monolayer g-C3N4 is about 0.3–0.4 nm [20], this AFM result suggests the obtained g-C3N4 nanosheet comprises about 10 layers. A total of more than 50 AFM samples have been examined and the statistical thickness distribution is shown in Figure 4c. The figure shows that, for over 70% of the product, the thickness ranges from 3 to 5 nm.
The microstructures of the graphene and g-C3N4 nanosheets, and their composite were investigated through field emission scanning electron microscopy (FE-SEM). Figure 5a,b presents the SEM images of exfoliated graphene and g-C3N4, respectively. A large number of loosely stacked graphene nanosheets could be observed, suggesting successful exfoliation. On the other hand, the exfoliated g-C3N4 nanosheets exhibited a severe restacking, whereby it is difficult to identify an individual nanosheet. In the case of the composite, as shown in Figure 5c, porous g-C3N4/graphene film was observed. Remarkably, the restacking phenomenon of g-C3N4 was greatly alleviated, which could be attributed to the self-assembly process between g-C3N4 and graphene [23]. This finding reveals that compositing 2D materials would be favorable in preventing the restacking of the components. It was noted that the evidence of compositing is difficult find even by high-resolution SEM (Figure S1), owing to the resemblance of 2D nanomaterials. Other characterization methods would be required to further examine the g-C3N4/graphene composite.
Energy-dispersive X-ray spectroscopy (EDS) analysis and elemental mapping were also utilized to investigate the elemental composition and distribution of the g-C3N4/graphene composite, respectively. The elemental mapping analysis, as shown in Figure 6a–c, shows that the C and N elements are homogeneously dispersed, indicating the successful formation of the nanocomposite. According to the EDS spectrum in Figure 6d, besides the Si and O elements contributed by the oxidized silicon wafer, the main elements of the nanocomposite were N and C. The atomic ratio of both N and C was about 1:3, which is consistent with the starting ratio. Besides, it is noted that a neglectable amount of Cl element was observed in the composite. This was originated from the strongly bonded Cl on the defective sites of g-C3N4 [29].
X-ray photoelectron spectroscopy (XPS) measurement was carried out to further study the chemical composition and element binding energies of g-C3N4/graphene nanocomposite, as displayed in Figure S2. The survey XPS spectra (Figure S2a) obviously indicated the co-existence of the elements C, N, and a small amount of O. No Cl component was observed, suggesting that most of the Cl ions were removed in the washing process. The emergence of element O may be attributed to the adventitiously adsorbed contaminant, such as surface adsorbed H2O [30,31,32]. The C1s spectrum displayed in Figure S2b can be deconvoluted into three peaks with binding energies of 288.2, 286, and 284.7 eV, which are assigned to N–C=N, N–C, and sp2 C=C, respectively [24,29]. No C–O or C=O bond were observed revealing that the graphene preserved its structure and no oxidation occurred throughout the process. On the other hand, the N1s XPS spectra (Figure S2b) displayed two peaks at 400.3 and 398.7 eV, which are assigned to C–N and C=N–C, respectively. The C=N–C represents the sp2 hybridized aromatic N bonded to carbon atoms (C=N–C) existed in g-C3N4, which was known as the reactive pyridine N. Besides, the surface N/C ratio in nanocomposite was determined to be 0.27, which is closed to that in EDS analysis. The above XPS results further demonstrated the formation of g-C3N4/graphene nanocomposite.

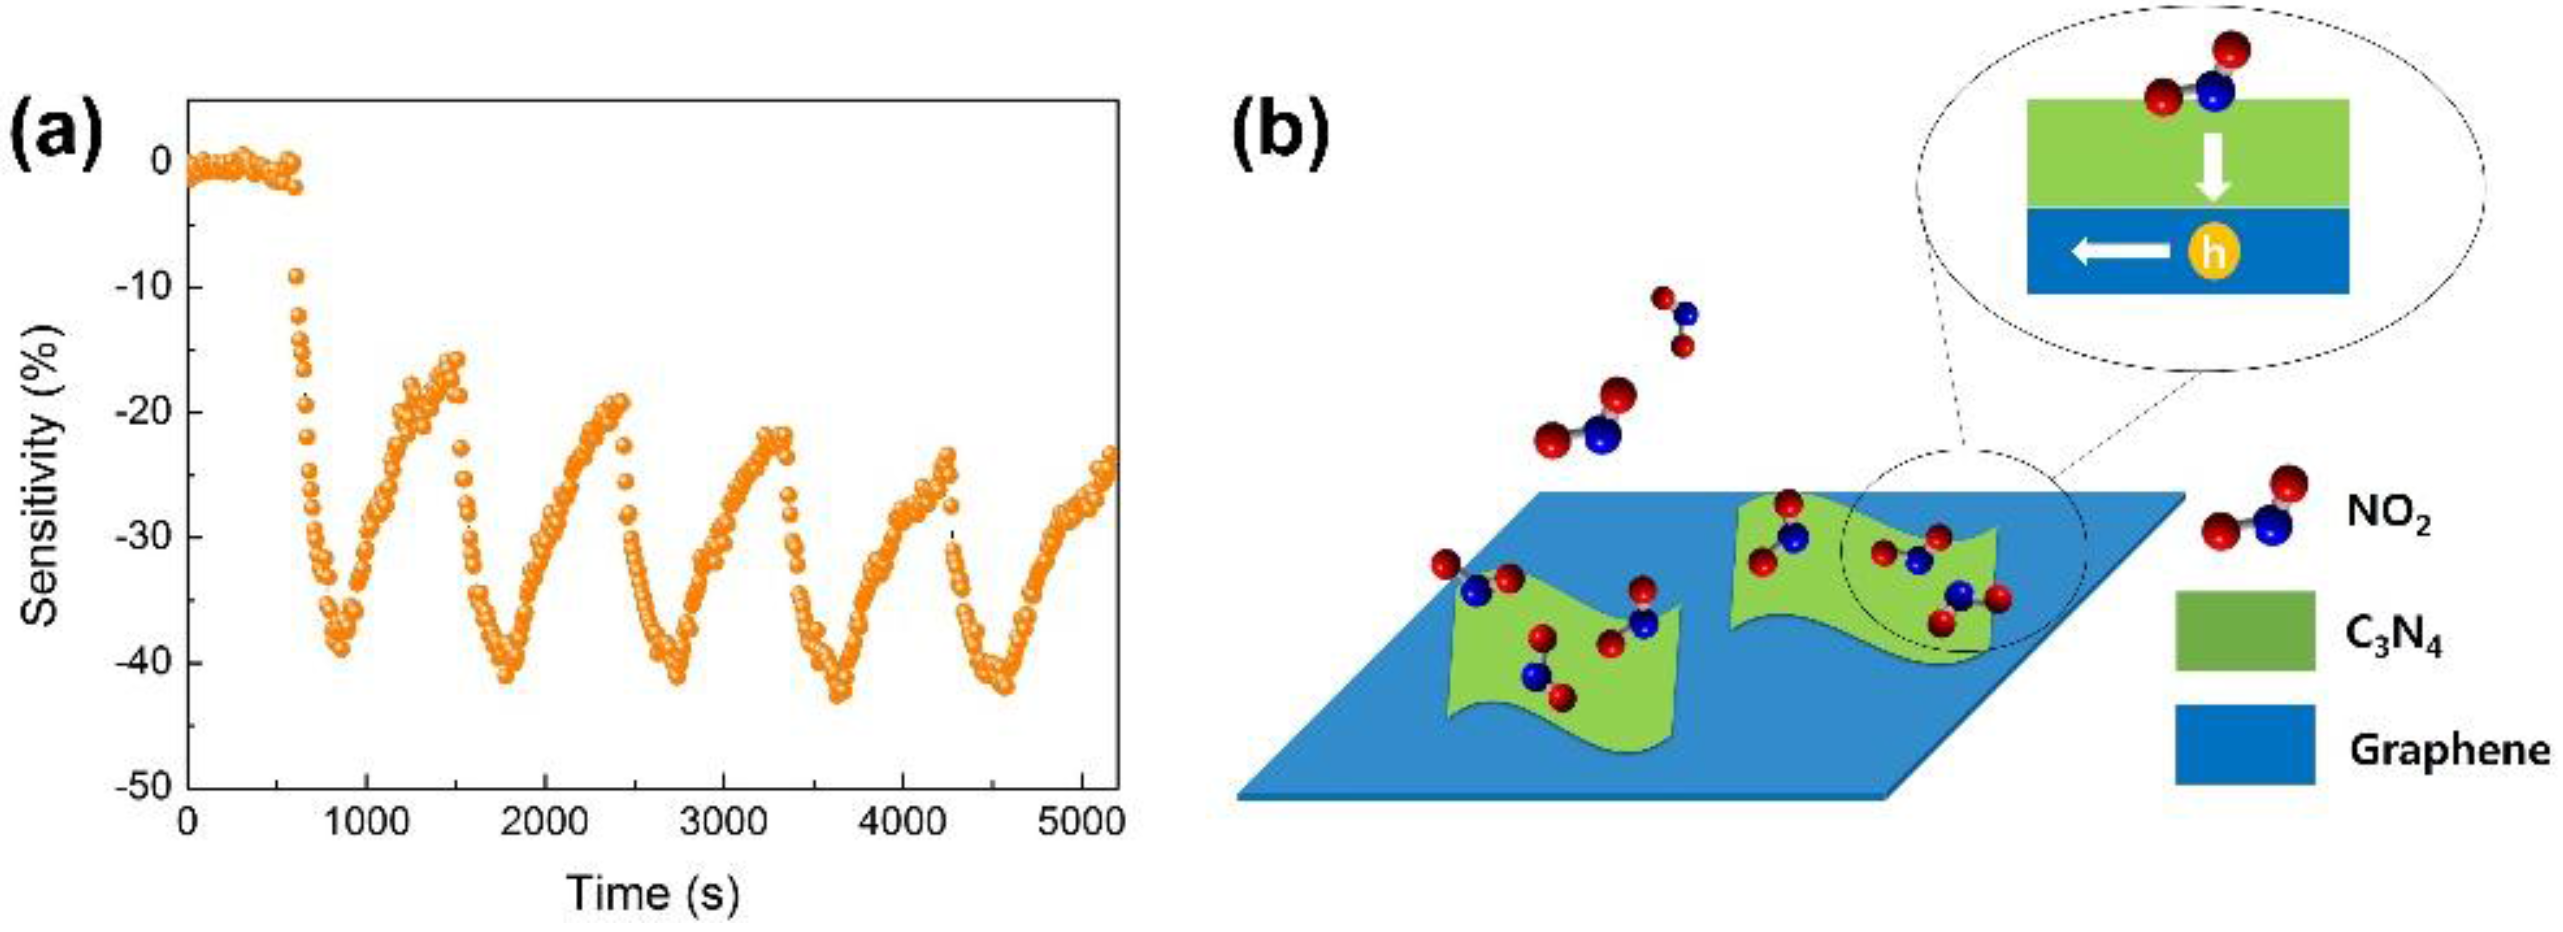
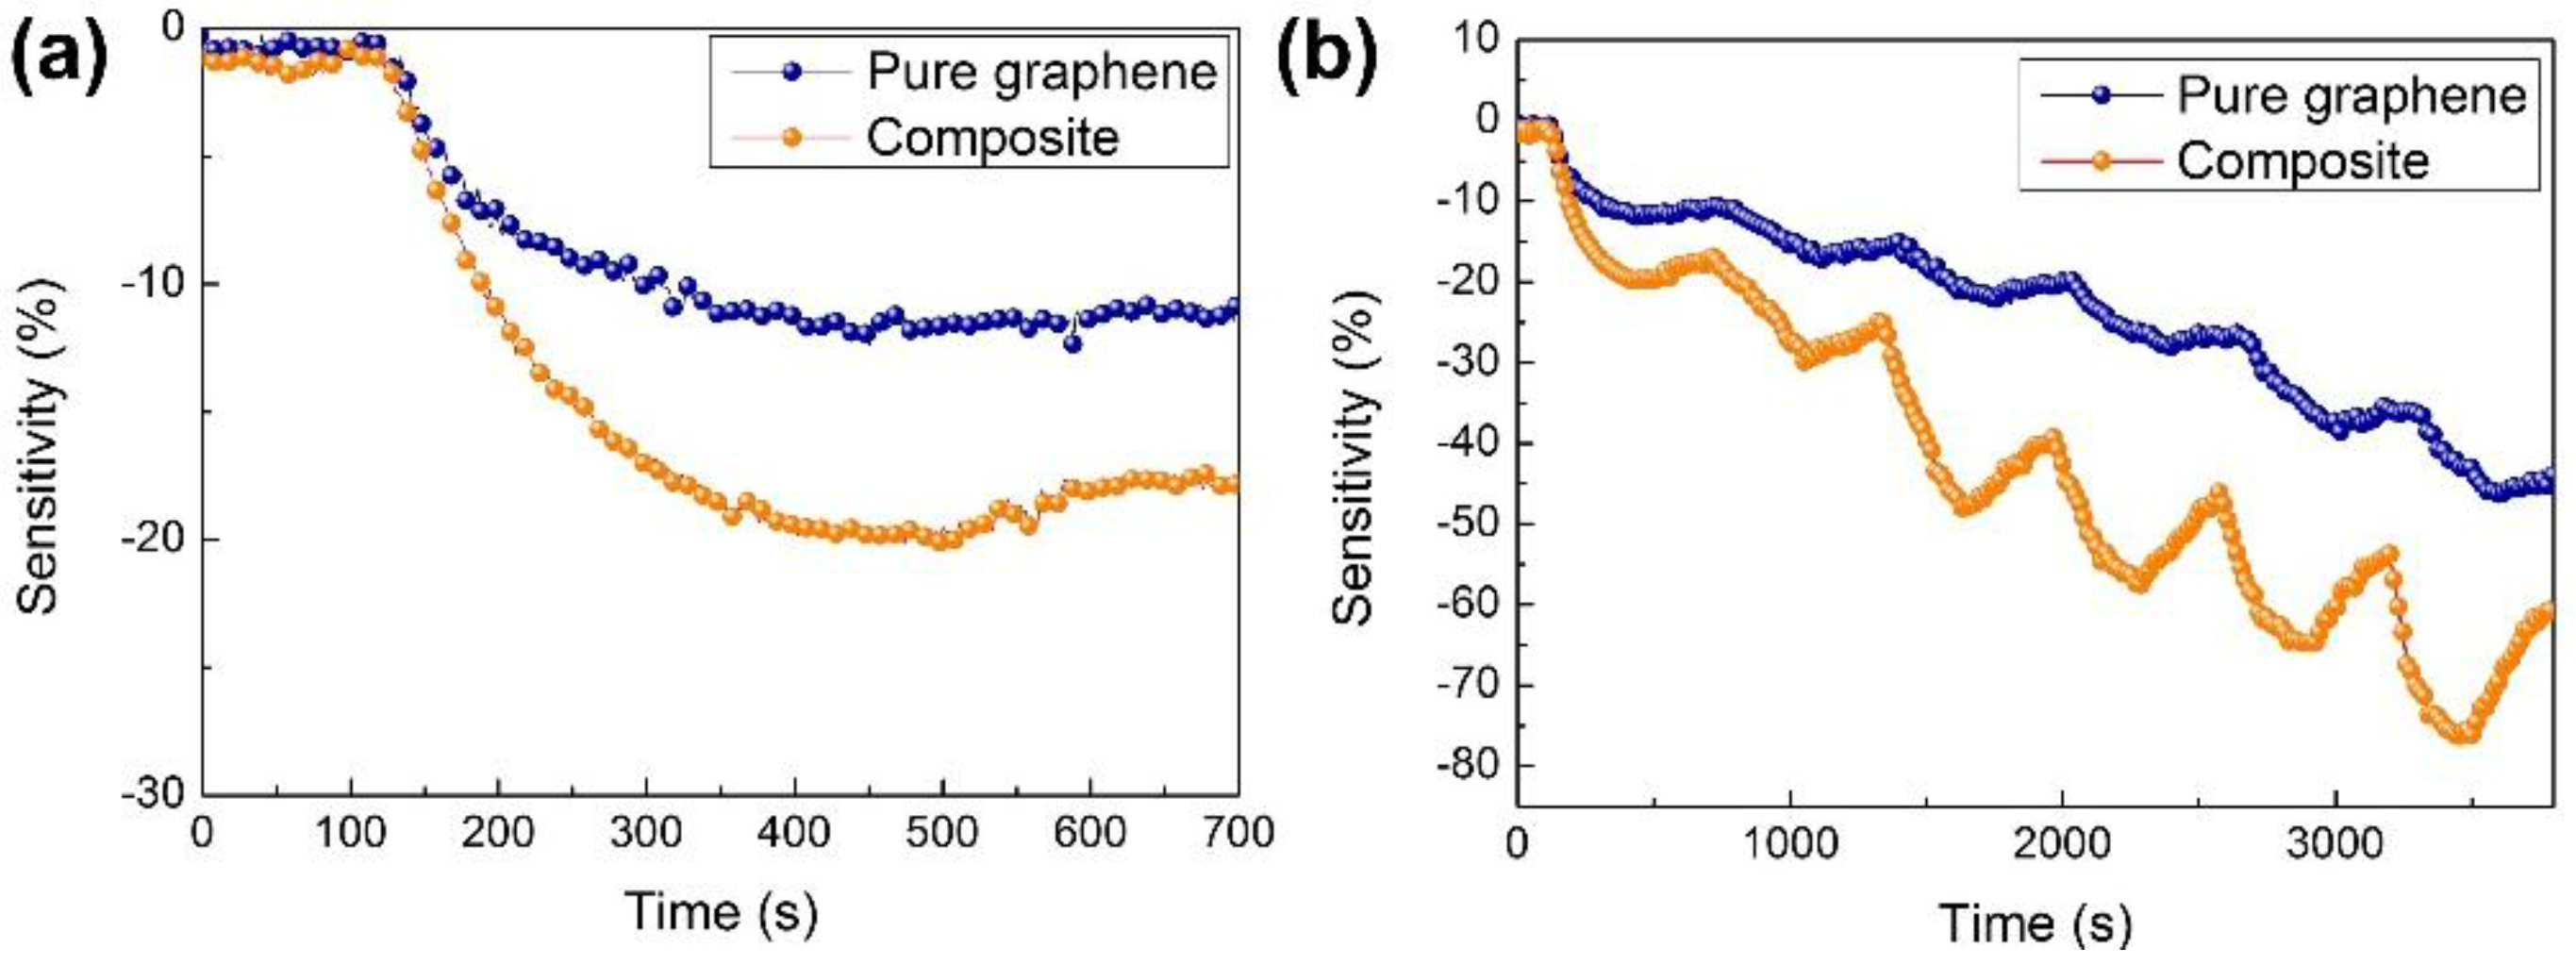
2.2. Gas Sensing Performance

The performance of the g-C3N4/graphene composite gas sensor was examined with NO2 gas. The pure graphene sensor as a control sample was also tested simultaneously. Figure 7a shows the typical response curve of the sensors upon exposure to 5 ppm of NO2 at room temperature. As observed, upon exposure to NO2 gas, the resistance of both sensors decreased, suggesting a p-type behavior. It is known that NO2 as a typical electron withdrawer would increase the hole concentration of the sensor materials, and thus decrease (or increase) the resistance of p-type (or n-type) semiconductors. Remarkably, the composite sensor exhibited two-times the response of pure graphene, indicating that the incorporation of g-C3N4 would benefit the sensing performance of the graphene sensor.
It is well-known that intrinsic graphene shows poor recovery, partially due to the strong adsorption energy of the gas molecule. Thus, heating at an elevated temperature or vacuum treatments are required to clean the graphene sensor [33,34,35]. As observed in Figure 7a, it is noted that the pure graphene sensor barely showed recovery when the NO2 gas was removed, while about 20% recovery was observed in the composite sensor within 200 s. This is possibly attributed to the thermal excitation of g-C3N4 that introduced active carriers and facilitated the desorption process of NO2 gas molecules. Our results indicate that the incorporation of specific semiconductors can achieve full recovery of the graphene sensor without the need for a complicated heating or vacuum process.
Figure 7b shows the dynamic response of pure graphene and g-C3N4/graphene composite sensors toward NO2 ranging from 5 to 200 ppm. The sensors responded well with the target gas. The responses increased monodirectionally as the concentration of NO2 increased. No obvious saturation state was observed in the composite sensor, suggesting a broad detection range. Remarkably, the composite sensor showed two-times more response than the other sensors to pure graphene in all the tests. The stability property of our nanocomposite sensor was also examined as shown in Figure 8a. The nanocomposite sensor responded repeatedly upon cycled exposure to 20 ppm of NO2, suggesting an excellent repeatability.
The sensing mechanism of the g-C3N4/graphene composite sensor is proposed, as schematically shown Figure 8b. On the one hand, the triazine structure of g-C3N4 nanosheet behaves similarly to a base that is ready to interact with the oxidized NO2 gas molecules. This characteristic of g-C3N4 nanosheet as well as its excellent catalytic property endows it with a promising capacity for the adsorption of NO2 molecules. On the other hand, graphene with superior carrier mobility would act similarly to a signal highway in the sensing process. Upon adsorption, the oxidized NO2 gas molecule with strong electron affinity deposits a hole in the g-C3N4 nanosheet. These hole carriers are then rapidly conducted by the graphene. In short, the complementary natures of g-C3N4 and graphene in the sensing process introduce a synergetic effect that contributes to the excellent sensing property of the nanocomposite sensor. In addition, considering the different roles of both materials in the sensing process, a tradeoff on the sensing performance would be expected if the composition of the composite is changed. Through systematic investigation, an optimized ratio of g-C3N4 and graphene could be achieved to obtain a high-performance sensor with excellent sensitivity and promising recovery property. This is the expected direction in the future research.

3. Materials and Methods

3.1. Preparation of Bulk g-C3N4

Raw melamine purchased from Sigma-Aldrich Korea Ltd. (Yongin, Korea) was used as received. The fabrication process was modified from the reported methods [36,37,38]. Typically, a certain amount of melamine was placed into a crucible with a cover and heated to 600 °C with a heating rate of 1 °C/min in air, and then maintained for 4 h. After natural cooling to ambient temperature, a yellow product was obtained. The obtained yellow product was subsequently ground thoroughly for further processing and characterization.

3.2. Acid Treatment Enhanced Exfoliation of g-C3N4

In a typical synthesis, 0.5 g of yellow bulk g-C3N4 powder was added to 25 mL hydrochloric acid (HCl, 36.46%, Deajung Korea Ltd., Siheum, Korea) and stirred for 1 h. The obtained transparent yellow dispersion was then filtrated and washed repeatedly with water until the pH value became neutral, followed by a drying process at 100 °C for 6 h. This acid-treated powder was re-dispersed in 200 mL deionized (DI) water, followed by sonication treatment for 2 h in an ultrasonic bath (200 W, NXPC-2010, Sonics & Materials, Inc., Newtown, CT, USA). Subsequently, the mixture was centrifuged at 8000 rpm for 10 min to remove the residual un-exfoliated g-C3N4 particles. Finally, a light white suspension was obtained. In order to determine the concentration of the product, 100 mL of g-C3N4 dispersion was transferred to a pre-weighted vial and dried in an oven at 100 °C for 24 h. The concentration of g-C3N4 in dispersion after 1 h acid treatment was determined to be about 50 μg/mL.

3.3. Preparation of Graphene

Graphene was prepared following the process developed in our previous work [39]. Briefly, 4 g of graphite powder (Sigma-Aldrich Korea Ltd., Yongin, Korea, 20 µm) was dispersed in 200 mL of an aqueous mixture containing 20 vol % acetone and 68 vol % tetrahydrofuran. The dispersion was then ultrasonically treated for 1 h using a horn probe sonic tip (Sonic VCX 750, Sonics & Materials, Inc., Newtown, CT, USA). A cooling water system was used to keep the processing temperature below 5 °C throughout. The ultrasonic power was set to 600 W with a pulse for 20 s on and 10 s off. After the ultrasonic treatment, the black dispersion was centrifuged at 1500 rpm for 30 min. The supernatant was then carefully decanted and retained for the next process. The concentration of the graphene was estimated to be around 250 µg/mL.

3.4. Fabrication of g-C3N4/Graphene Composite Sensor

Two as-prepared dispersions containing equivalent weights of g-C3N4 and graphene were mixed with ultrasonic treatment for 1 h to achieve complete mixing. After mixing, the mixture was evaporated in an oven for 24 h at a moderate temperature (~60 °C) to improve the concentration of solute without introducing severe aggregation. Alumina substrates (4 × 4 mm) with interdigital Pt electrodes were carefully cleaned and placed on a hot-plate with a temperature of about 100 °C. Concentrated solution was then drop-casted onto the sensor substrates using micro-pipettes. The thickness of the thin films was about 1 µm and was controlled by the volume of the solution in the micro-pipettes. After coating, the alumina substrates were heated at 100 °C in an oven for 1 h to eliminate the remaining solvent and then sintered at 200 °C in Ar gas for 1 h to improve the adhesion and contact. Pure graphene-based sensor as the control sample was also prepared using the same method.

3.5. Measurement of g-C3N4/Graphene Composite Sensor

The sensors were placed in a stainless chamber having a total volume of 10 cm3. Nitrogen gas was used as the carrier gas. NO2 gas with a starting concentration of 500 ± 1 ppm in nitrogen was used as the target gas. The accurate concentration control of the target gas was achieved by using a mixing system equipped with mass flow controllers (MFC, Tylan 2900, Mykrolis Corporation, Billerica, MA, USA) and mass flow meters. All the measurements were conducted under ambient condition. The total gas flow of the carrier and target gases was kept at 250 sccm throughout the measurement process. The electrical conductance signal of the sensors was collected and recorded by data acquisition (Agilent 34970A, Keysight Technologies, Santa Rosa, CA, USA) through a customized clamp and wire connector. The sensing response was defined as:
S ( % ) = R G R N R N × 100 ,
where RN and RG represented the resistance of the sensors upon exposure to nitrogen and target gas, respectively.

3.6. Material Characterization

For material characterization, samples were prepared by drop-casting the solution containing g-C3N4 or g-C3N4/graphene nanocomposite onto an oxidized silicon wafer, followed by a drying process at 80 °C for 12 h. X-ray diffraction (XRD) was performed using a Rigaku RINT2200 X-ray diffractometer (Rigaku Corporation, Tokyo, Japan) with monochromatized Cu-Kα radiation. Atomic force microscopy (AFM) measurements were carried out on a Bruker MutiMode-8 system (Bruker Corporation, Billerica, MA, USA). The microstructure, morphology, and elemental distribution of the samples were systematically investigated by Raman spectroscopy (Horiba LabRAM HR Evolution systems, Horiba, Ltd., Kyoto, Japan, operating at a wavelength of 785 nm), Scanning Electron Microscopy (SEM, JSM-7100FA, Hitachi, Ltd., Tokyo, Japan), and Energy-dispersive X-ray spectroscopy (EDS) mapping (co-equipped with SEM) (Hitachi, Ltd., Tokyo, Japan), respectively. Chemical compositions and element binding energies were analyzed using X-ray photoelectron spectroscopy (XPS) on an Ulvac-phi Veresprobe II system (Ulvac-Phi, Inc., Chigasaki, Japan) with monochromatic Al Kα as an excitation source. The absorption spectroscopy measurements were performed using a Varian Cary 6000i and a 1 cm cuvette.

4. Conclusions

In summary, we successfully prepared g-C3N4 nanosheets from bulk g-C3N4 using a facile HCl acid treatment followed by an ultrasonic process. The effect of acid treatment on the exfoliation result was carefully examined. The exfoliated g-C3N4 nanosheets exhibited a uniform thickness of about 3–5 nm and a lateral size of about 1–2 µm. g-C3N4/graphene nanocomposite was prepared via a self-assembly process. Remarkably, the restacking phenomenon of g-C3N4 was greatly alleviated after compositing with graphene. A promising sensing performance of g-C3N4/graphene nanocomposite toward NO2 gas at room temperature was demonstrated. The nanocomposite sensor exhibited better recovery as well as two-times the response compared to the pure graphene sensor. The promising performance of the nanocomposite sensor was attributed to a synergetic effect in which the graphene with superior carrier mobility acts as the signal pathway, while the g-C3N4 nanosheet, with an active surface, plays the role of analyte acceptor.

Supplementary Materials

The following are available online at https://www.mdpi.com/2079-4991/7/1/12/s1.

Acknowledgments

This research was supported by the Basic Science Research Program through the National Research Foundation (NRF) of Korea funded by the Ministry of Education (MOE) (Nos. 2015R11A1A01058991 and 2014R1A1A2059913).

Author Contributions

Shaolin Zhang and Woochul Yang conceived and designed the experiments; Shaolin Zhang and Nguyen Thuy Hang performed the experiments; Shaolin Zhang, Zhijun Zhang, and Hongyan Yue analyzed the data; and Shaolin Zhang and Nguyen Thuy Hang wrote the paper.

Conflicts of Interest

The authors declare no conflicts of interest.

Abbreviations

The following abbreviations are used in this manuscript:
g-C3N4Graphitic Carbon Nitride
HClHydrochloric Acid
DI WaterDeionized Water
NO2Nitrogen Dioxide
2D MaterialTwo Dimensional Material
H2SO4Sulphuric Acid
HNO3Nitric Acid
EDSEnergy-dispersive X-ray Spectroscopy
XRDX-ray Diffraction
FE-SEMField Emission Scanning Electron Microscopy
AFMAtomic Force Microscopy
UV-Vis spectroscopyUltraviolet-visible Spectroscopy
MFCMass Flow Controllers

References

  1. Hjiri, M.; El Mir, L.; Leonardi, S.G.; Donato, N.; Neri, G. CO and NO2 Selective Monitoring by ZnO-Based Sensors. Nanomaterials 2013, 3, 357–369. [Google Scholar] [CrossRef]
  2. Arafat, M.M.; Dinan, B.; Akbar, S.A.; Haseeb, A.S.M.A. Gas Sensors Based on One Dimensional Nanostructured Metal-Oxides: A Review. Sensors 2012, 12, 7207–7258. [Google Scholar] [CrossRef] [PubMed]
  3. Tomchenko, A.A.; Harmer, G.P.; Marquis, B.T.; Allen, J.W. Semiconducting metal oxide sensor array for the selective detection of combustion gases. Sens. Actuators B 2003, 93, 126–134. [Google Scholar] [CrossRef]
  4. Wu, C.S. Hydrothermal Fabrication of WO3 Hierarchical Architectures: Structure, Growth and Response. Nanomaterials 2015, 5, 1250–1255. [Google Scholar] [CrossRef]
  5. Endres, H.E.; Gottler, W.; Hartinger, R.; Drost, S.; Hellmich, W.; Muller, G.; BoschvonBraunmuhl, C.; Krenkow, A.; Perego, C.; Sberveglieri, G. A thin-film SnO2 sensor system for simultaneous detection of CO and NO2 with neural signal evaluation. Sens. Actuators B 1996, 36, 353–357. [Google Scholar] [CrossRef]
  6. Barsan, N.; Weimar, U. Conduction model of metal oxide gas sensors. J. Electroceram. 2001, 7, 143–167. [Google Scholar] [CrossRef]
  7. Capone, S.; Forleo, A.; Francioso, L.; Rella, R.; Siciliano, P.; Spadavecchia, J.; Presicce, D.S.; Taurino, A.M. Solid state gas sensors: State of the art and future activities. J. Optoelectron. Adv. Mater. 2003, 5, 1335–1348. [Google Scholar] [CrossRef]
  8. Varghese, S.S.; Varghese, S.H.; Swaminathan, S.; Singh, K.K.; Mittal, V. Two-Dimensional Materials for Sensing: Graphene and Beyond. Electronics 2015, 4, 651–687. [Google Scholar] [CrossRef]
  9. Zanjani, S.M.M.; Sadeghi, M.M.; Holt, M.; Chowdhury, S.F.; Tao, L.; Akinwande, D. Enhanced sensitivity of graphene ammonia gas sensors using molecular doping. Appl. Phys. Lett. 2016, 108, 033106. [Google Scholar] [CrossRef]
  10. Lv, R.; Li, Q.; Botello-Mendez, A.R.; Hayashi, T.; Wang, B.; Berkdemir, A.; Hao, Q.Z.; Elias, A.L.; Cruz-Silva, R.; Gutierrez, H.R.; et al. Nitrogen-doped graphene: Beyond single substitution and enhanced molecular sensing. Sci. Rep. 2012, 2, 586. [Google Scholar] [CrossRef] [PubMed]
  11. Niu, F.; Liu, J.M.; Tao, L.M.; Wang, W.; Song, W.G. Nitrogen and silica co-doped graphene nanosheets for NO2 gas sensing. J. Mater. Chem. A 2013, 1, 6130–6133. [Google Scholar] [CrossRef]
  12. Zhang, Z.Y.; Zou, X.M.; Xu, L.; Liao, L.; Liu, W.; Ho, J.; Xiao, X.H.; Jiang, C.Z.; Li, J.C. Hydrogen gas sensor based on metal oxide nanoparticles decorated graphene transistor. Nanoscale 2015, 7, 10078–10084. [Google Scholar] [CrossRef] [PubMed]
  13. Zhou, L.S.; Shen, F.P.; Tian, X.K.; Wang, D.H.; Zhang, T.; Chen, W. Stable Cu2O nanocrystals grown on functionalized graphene sheets and room temperature H2S gas sensing with ultrahigh sensitivity. Nanoscale 2013, 5, 1564–1569. [Google Scholar] [CrossRef] [PubMed]
  14. Cho, B.; Yoon, J.; Hahm, M.G.; Kim, D.H.; Kim, A.R.; Kahng, Y.H.; Park, S.W.; Lee, Y.J.; Park, S.G.; Kwon, J.D.; et al. Graphene-based gas sensor: Metal decoration effect and application to a flexible device. J. Mater. Chem. C 2014, 2, 5280–5285. [Google Scholar] [CrossRef]
  15. Jiang, Z.X.; Li, J.; Aslan, H.; Li, Q.; Li, Y.; Chen, M.L.; Huang, Y.D.; Froning, J.P.; Otyepka, M.; Zboril, R.; et al. A high efficiency H2S gas sensor material: Paper like Fe2O3/graphene nanosheets and structural alignment dependency of device efficiency. J. Mater. Chem. A 2014, 2, 6714–6717. [Google Scholar] [CrossRef]
  16. Yang, W.; Gan, L.; Li, H.; Zhai, T. Two-dimensional layered nanomaterials for gas-sensing applications. Inorg. Chem. Front. 2016, 3, 433. [Google Scholar] [CrossRef]
  17. Li, W.W.; Geng, X.M.; Guo, Y.F.; Rong, J.Z.; Gong, Y.P.; Wu, L.Q.; Zhang, X.M.; Li, P.; Xu, J.B.; Cheng, G.S.; et al. Reduced Graphene Oxide Electrically Contacted Graphene Sensor for Highly Sensitive Nitric Oxide Detection. ACS Nano 2011, 5, 6955–6961. [Google Scholar] [CrossRef] [PubMed]
  18. Huang, Q.W.; Zeng, D.W.; Li, H.Y.; Xie, C.S. Room temperature formaldehyde sensors with enhanced performance, fast response and recovery based on zinc oxide quantum dots/graphene nanocomposites. Nanoscale 2012, 4, 5651–5658. [Google Scholar] [CrossRef] [PubMed]
  19. Ma, T.Y.; Dai, S.; Jaroniec, M.; Qiao, S.Z. Graphitic Carbon Nitride Nanosheet-Carbon Nanotube Three-Dimensional Porous Composites as High-Performance Oxygen Evolution Electrocatalysts. Angew. Chem. Int. Ed. 2014, 53, 7281–7285. [Google Scholar] [CrossRef] [PubMed]
  20. Wang, X.C.; Maeda, K.; Thomas, A.; Takanabe, K.; Xin, G.; Carlsson, J.M.; Domen, K.; Antonietti, M. A metal-free polymeric photocatalyst for hydrogen production from water under visible light. Nat. Mater. 2009, 8, 76–80. [Google Scholar] [CrossRef] [PubMed]
  21. Chen, H.Y.; Qiu, L.G.; Xiao, J.D.; Ye, S.; Jiang, X.; Yuan, Y.P. Inorganic-organic hybrid NiO-g-C3N4 photocatalyst for efficient methylene blue degradation using visible light. Rsc. Adv. 2014, 4, 22491–22496. [Google Scholar] [CrossRef]
  22. Sun, L.M.; Zhao, X.; Jia, C.J.; Zhou, Y.X.; Cheng, X.F.; Li, P.; Liu, L.; Fan, W.L. Enhanced visible-light photocatalytic activity of g-C3N4-ZnWO4 by fabricating a heterojunction: Investigation based on experimental and theoretical studies. J. Mater. Chem. 2012, 22, 23428–23438. [Google Scholar] [CrossRef]
  23. Tian, J.Q.; Ning, R.; Liu, Q.; Asiri, A.M.; Al-Youbi, A.O.; Sun, X.P. Three-Dimensional Porous Supramolecular Architecture from Ultrathin g-C3N4 Nanosheets and Reduced Graphene Oxide: Solution Self-Assembly Construction and Application as a Highly Efficient Metal-Free Electrocatalyst for Oxygen Reduction Reaction. ACS Appl. Mater. Interfaces 2014, 6, 1011–1017. [Google Scholar] [CrossRef] [PubMed]
  24. Wang, D.H.; Gu, W.; Zhang, Y.W.; Hu, Y.; Zhang, T.; Tao, X.M.; Chen, W. Novel C-rich carbon nitride for room temperature NO2 gas sensors. RSC Adv. 2014, 4, 18003–18006. [Google Scholar] [CrossRef]
  25. Jung, J.; Lee, S.P. Physical Properties of Nano-Structured Carbon Nitride Film for Integrated Humidity Sensors. J. Nanosci. Nanotechnol. 2013, 13, 7030–7032. [Google Scholar] [CrossRef] [PubMed]
  26. Zhang, X.D.; Xie, X.; Wang, H.; Zhang, J.J.; Pan, B.C.; Xie, Y. Enhanced Photoresponsive Ultrathin Graphitic-Phase C3N4 Nanosheets for Bioimaging. J. Am. Chem. Soc. 2013, 135, 18–21. [Google Scholar] [CrossRef] [PubMed]
  27. Xu, J.; Zhang, L.W.; Shi, R.; Zhu, Y.F. Chemical exfoliation of graphitic carbon nitride for efficient heterogeneous photocatalysis. J. Mater. Chem. A 2013, 1, 14766–14772. [Google Scholar] [CrossRef]
  28. Lin, L.S.; Cong, Z.X.; Li, J.; Ke, K.M.; Guo, S.S.; Yang, H.H.; Chen, G.N. Graphitic-phase C3N4 nanosheets as efficient photosensitizers and pH-responsive drug nanocarriers for cancer imaging and therapy. J. Mater. Chem. B 2014, 2, 1031–1037. [Google Scholar] [CrossRef]
  29. Zhang, Y.C.; Zhang, Q.; Shi, Q.W.; Cai, Z.Y.; Yang, Z.J. Acid-treated g-C3N4 with improved photocatalytic performance in the reduction of aqueous Cr(VI) under visible-light. Sep. Purif. Technol. 2015, 142, 251–257. [Google Scholar] [CrossRef]
  30. Chang, C.; Fu, Y.; Hu, M.; Wang, C.; Shan, G. Photodegradation of bisphenol A by highly stable palladium-doped mesoporous graphite carbon nitride (Pd/mpg-C3N4) under simulated solar light irradiation. Appl. Catal. B 2013, 142–143, 553–560. [Google Scholar] [CrossRef]
  31. Cao, S.W.; Liu, X.F.; Yuan, Y.P.; Zhang, Z.Y. Solar-to-fuels conversion over In2O3/g-C3N4 hybrid photocatalysts. Appl. Catal. B 2014, 147, 940–946. [Google Scholar] [CrossRef]
  32. Liu, J.; Zhang, T.; Wang, Z.; Dawson, G.; Chen, W. Simple pyrolysis of urea into graphitic carbon nitride with recyclable adsorption and photocatalytic activity. J. Mater. Chem. 2011, 21, 14398–14401. [Google Scholar] [CrossRef]
  33. Romero, H.E.; Joshi, P.; Gupta, A.K.; Gutierrez, H.R.; Cole, M.W.; Tadigadapa, S.A.; Eklund, P.C. Adsorption of ammonia on graphene. Nanotechnology 2009, 20, 245501. [Google Scholar] [CrossRef] [PubMed]
  34. Chen, C.W.; Hung, S.C.; Yang, M.D.; Yeh, C.W.; Wu, C.H.; Chi, G.C.; Ren, F.; Pearton, S.J. Oxygen sensors made by monolayer graphene under room temperature. Appl. Phys. Lett. 2011, 99, 243502. [Google Scholar] [CrossRef]
  35. Chen, G.; Paronyan, T.M.; Harutyunyan, A.R. Sub-ppt gas detection with pristine graphene. Appl. Phys. Lett. 2012, 101, 053119. [Google Scholar] [CrossRef]
  36. Zhong, Y.J.; Wang, Z.Q.; Feng, J.Y.; Yan, S.C.; Zhang, H.T.; Li, Z.S.; Zou, Z.G. Improvement in photocatalytic H2 evolution over g-C3N4 prepared from protonated melamine. Appl. Surf. Sci. 2014, 295, 253–259. [Google Scholar] [CrossRef]
  37. Martín-Ramos, P.; Martín-Gil, J.; Dante, R.C.; Vaquero, F.; Navarro, R.M.; Fierro, J.L.G. A simple approach to synthesize g-C3N4 with high visible light photoactivity for hydrogen production. Int. J. Hydrog. Energy 2015, 40, 7273–7281. [Google Scholar] [CrossRef]
  38. Dante, R.C.; Martín-Ramos, P.; Correa-Guimaraes, A.; Martín-Gil, J. Synthesis of graphitic carbon nitride by reaction of melamine and uric acid. Mater. Chem. Phys. 2011, 130, 1094–1102. [Google Scholar] [CrossRef]
  39. Zhang, S.L.; Zhang, Z.J.; Yang, W.C. High-yield exfoliation of graphene using ternary-solvent strategy for detecting volatile organic compounds. Appl. Surf. Sci. 2016, 360, 323–328. [Google Scholar] [CrossRef]
Figure 1. Schematic of the acid treatment enhanced liquid-phase exfoliation process from bulk g-C3N4 to ultrathin nanosheets.
Nanomaterials 07 00012 g001
Figure 2. X-ray diffraction (XRD) patterns of bulk g-C3N4 and g-C3N4 nanosheets exfoliated at different acid treatment times.
Nanomaterials 07 00012 g002
Figure 3. UV-Vis absorption spectra of diluted bulk g-C3N4 and as prepared g-C3N4 nanosheets exfoliated at different acid treatment times.
Nanomaterials 07 00012 g003
Figure 4. (a) Typical atomic force microscopy (AFM) image; (b) corresponding thickness profile along the yellow dashed line in (a), and (c) thickness distribution of the exfoliated g-C3N4 with 1 h acid treatment.
Nanomaterials 07 00012 g004
Figure 5. Field emission scanning electron microscopy (FE-SEM) images of exfoliated (a) graphene; (b) g-C3N4; and (c) g-C3N4/graphene composite. The insets in (a,b) are SEM images of their bulk counterparts.
Nanomaterials 07 00012 g005
Figure 6. (a) Low-magnification SEM image of g-C3N4/graphene nanocomposite; (b) Carbon and (c) nitrogen elemental mapping captured in (a); (d) Energy-dispersive X-ray spectroscopy (EDS) pattern and elemental composition of nanocomposite.
Nanomaterials 07 00012 g006
Figure 7. (a) Typical response of pure graphene and g-C3N4/graphene composite sensors toward 5 ppm of NO2 gas at room temperature; (b) Dynamic response of pure graphene and g-C3N4/graphene composite sensors toward various concentrations of NO2 gas at room temperature.
Nanomaterials 07 00012 g007
Figure 8. (a) Cyclic response of g-C3N4/graphene composite sensor toward 20 ppm of NO2; (b) Proposed sensing mechanism of g-C3N4/graphene composite sensor.
Nanomaterials 07 00012 g008

