Effect of Porosity and Concentration Polarization on Electrolyte Diffusive Transport Parameters through Ceramic Membranes with Similar Nanopore Size


 , and
, and
Abstract
:1. Introduction
2. Results and Discussion
2.1. Microstructure and Morphological Parameters of Alumina Membranes
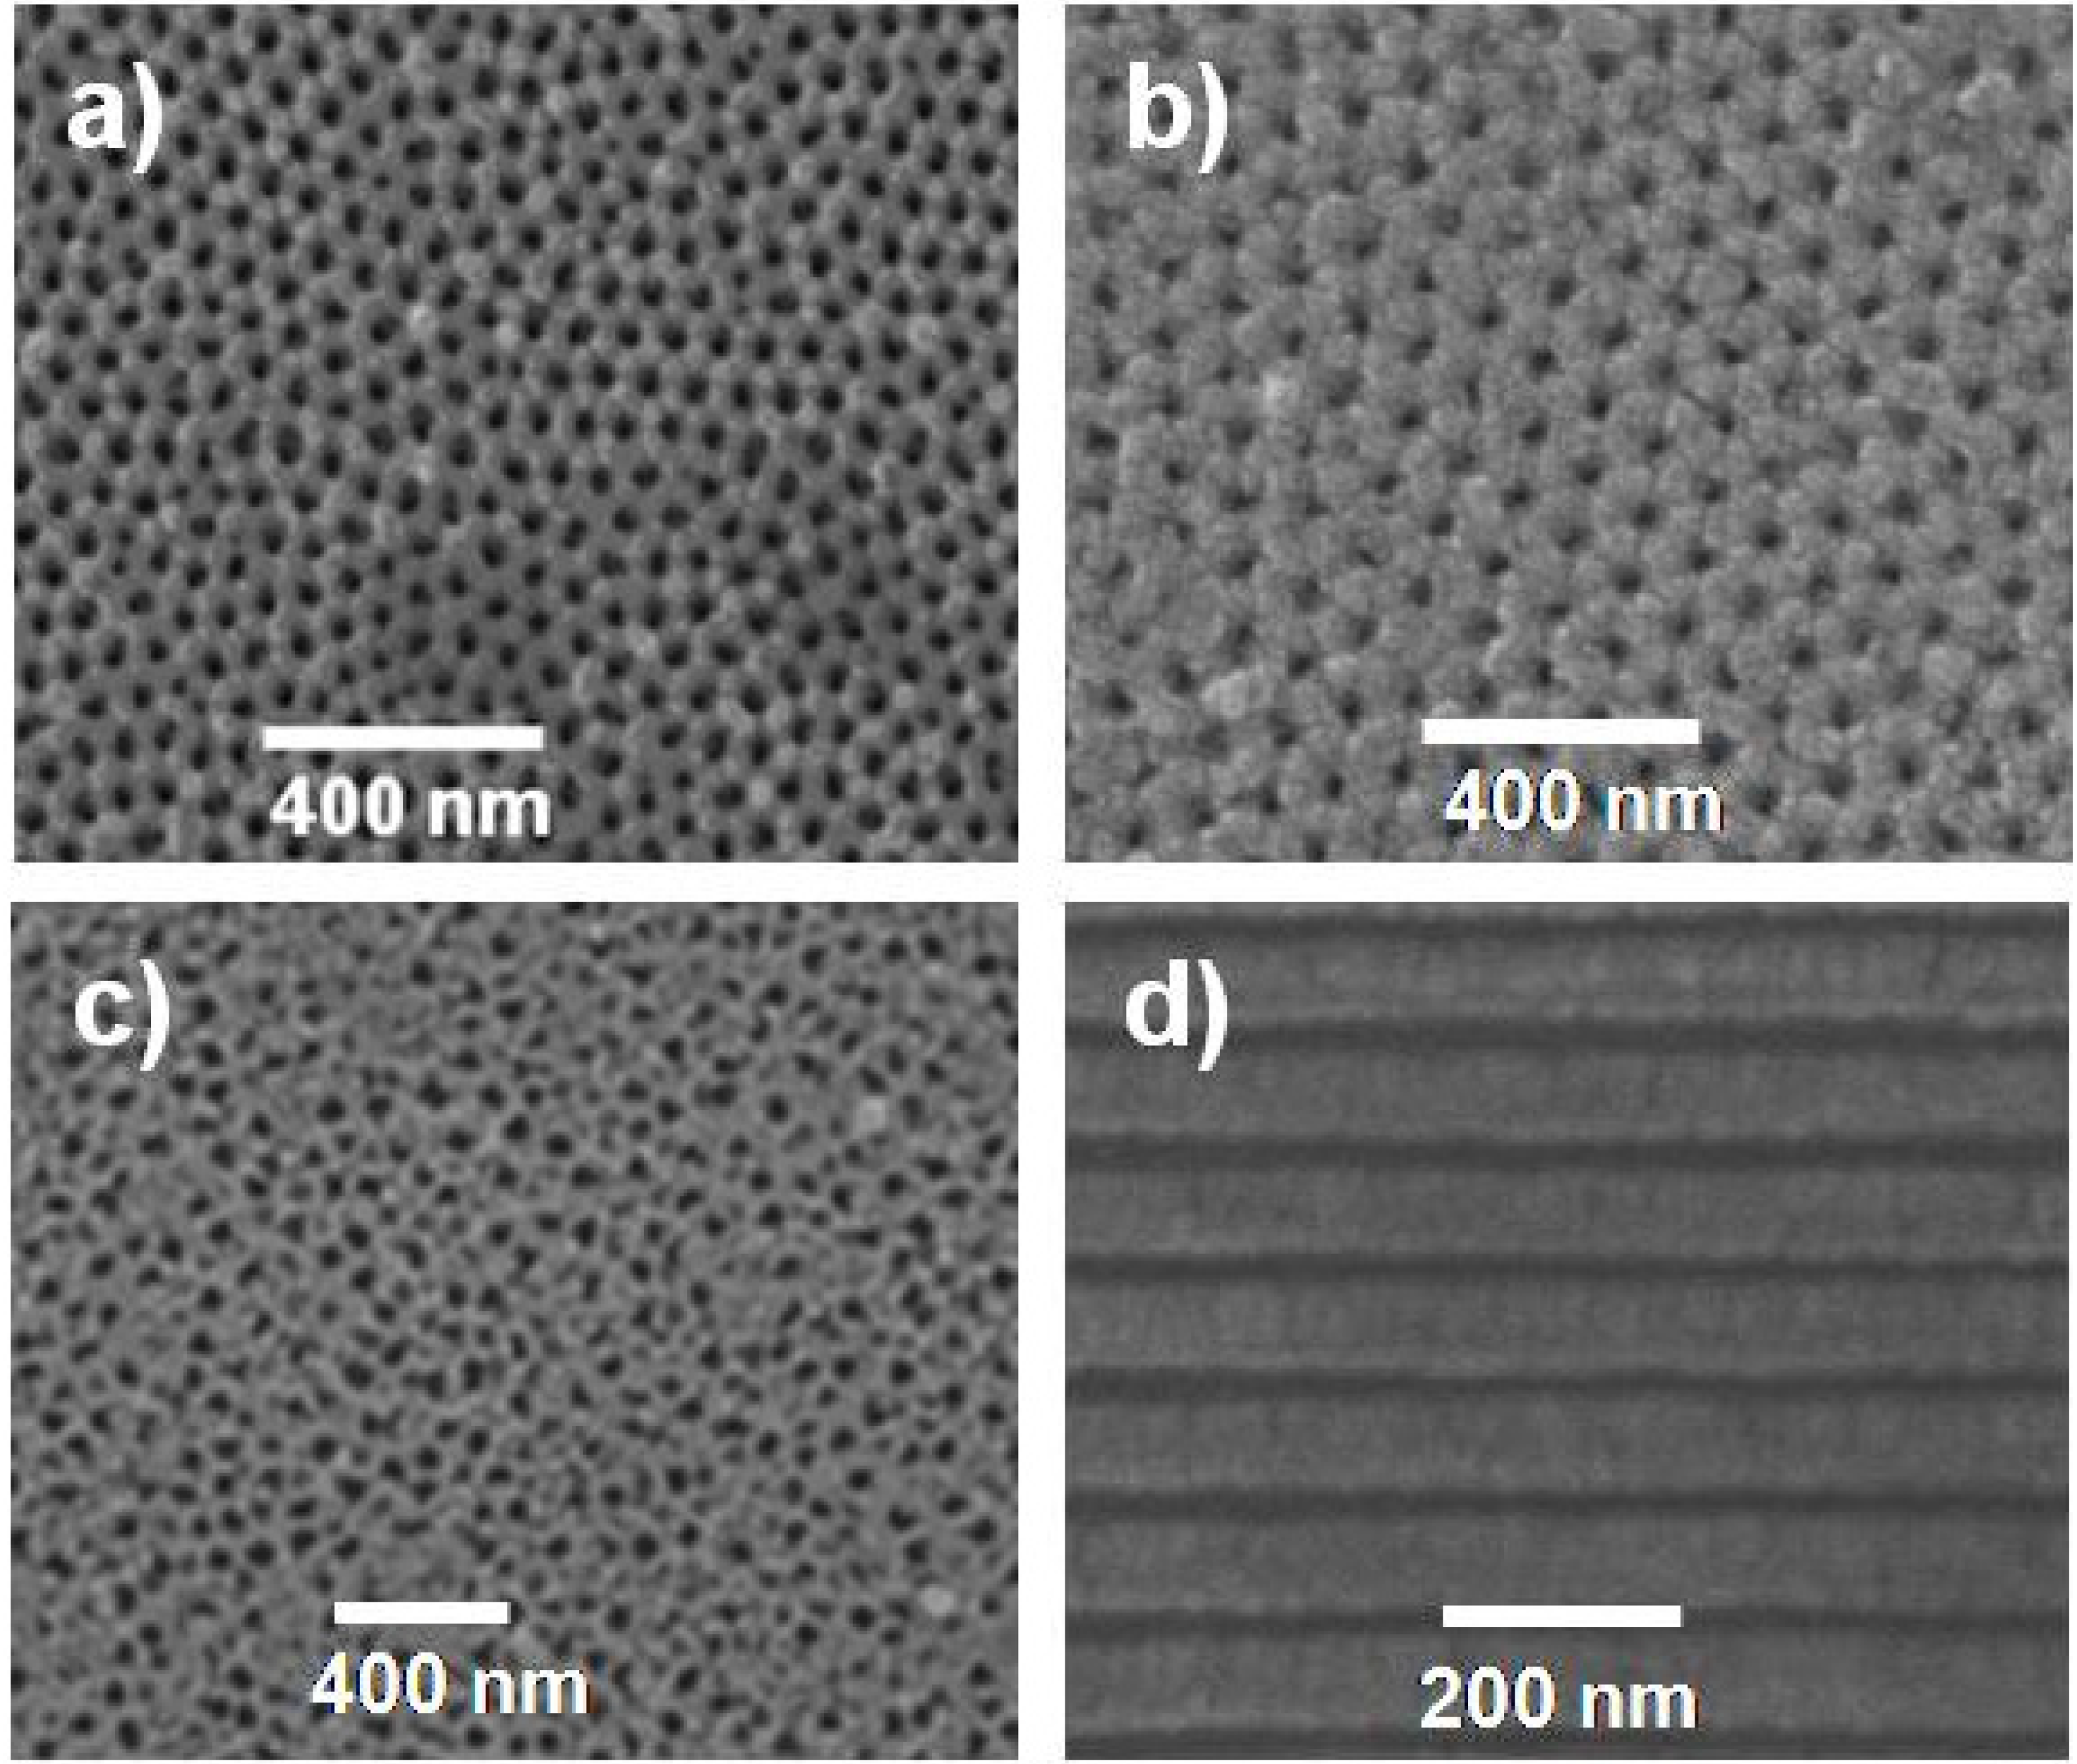
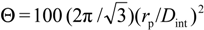 . The estimated average porosity values (<Θ>) have been obtained by considering the porosity from both, top and bottom, SEM surface images.
| Sample | rp (nm) | Dint (nm) | (<Θ>) (%) |
|---|---|---|---|
| Al-Sf | 12 ± 2 | 65 ± 2 | 15 |
| Al-Ox + Al2O3 | 11 ± 3 | 105 ± 3 | 5 |
| Al-Ox + SiO2 | 11 ± 3 | 105 ± 3 | 5 |
2.2. Characterization of Diffusive Transport across the Nanoporous Membranes
- -
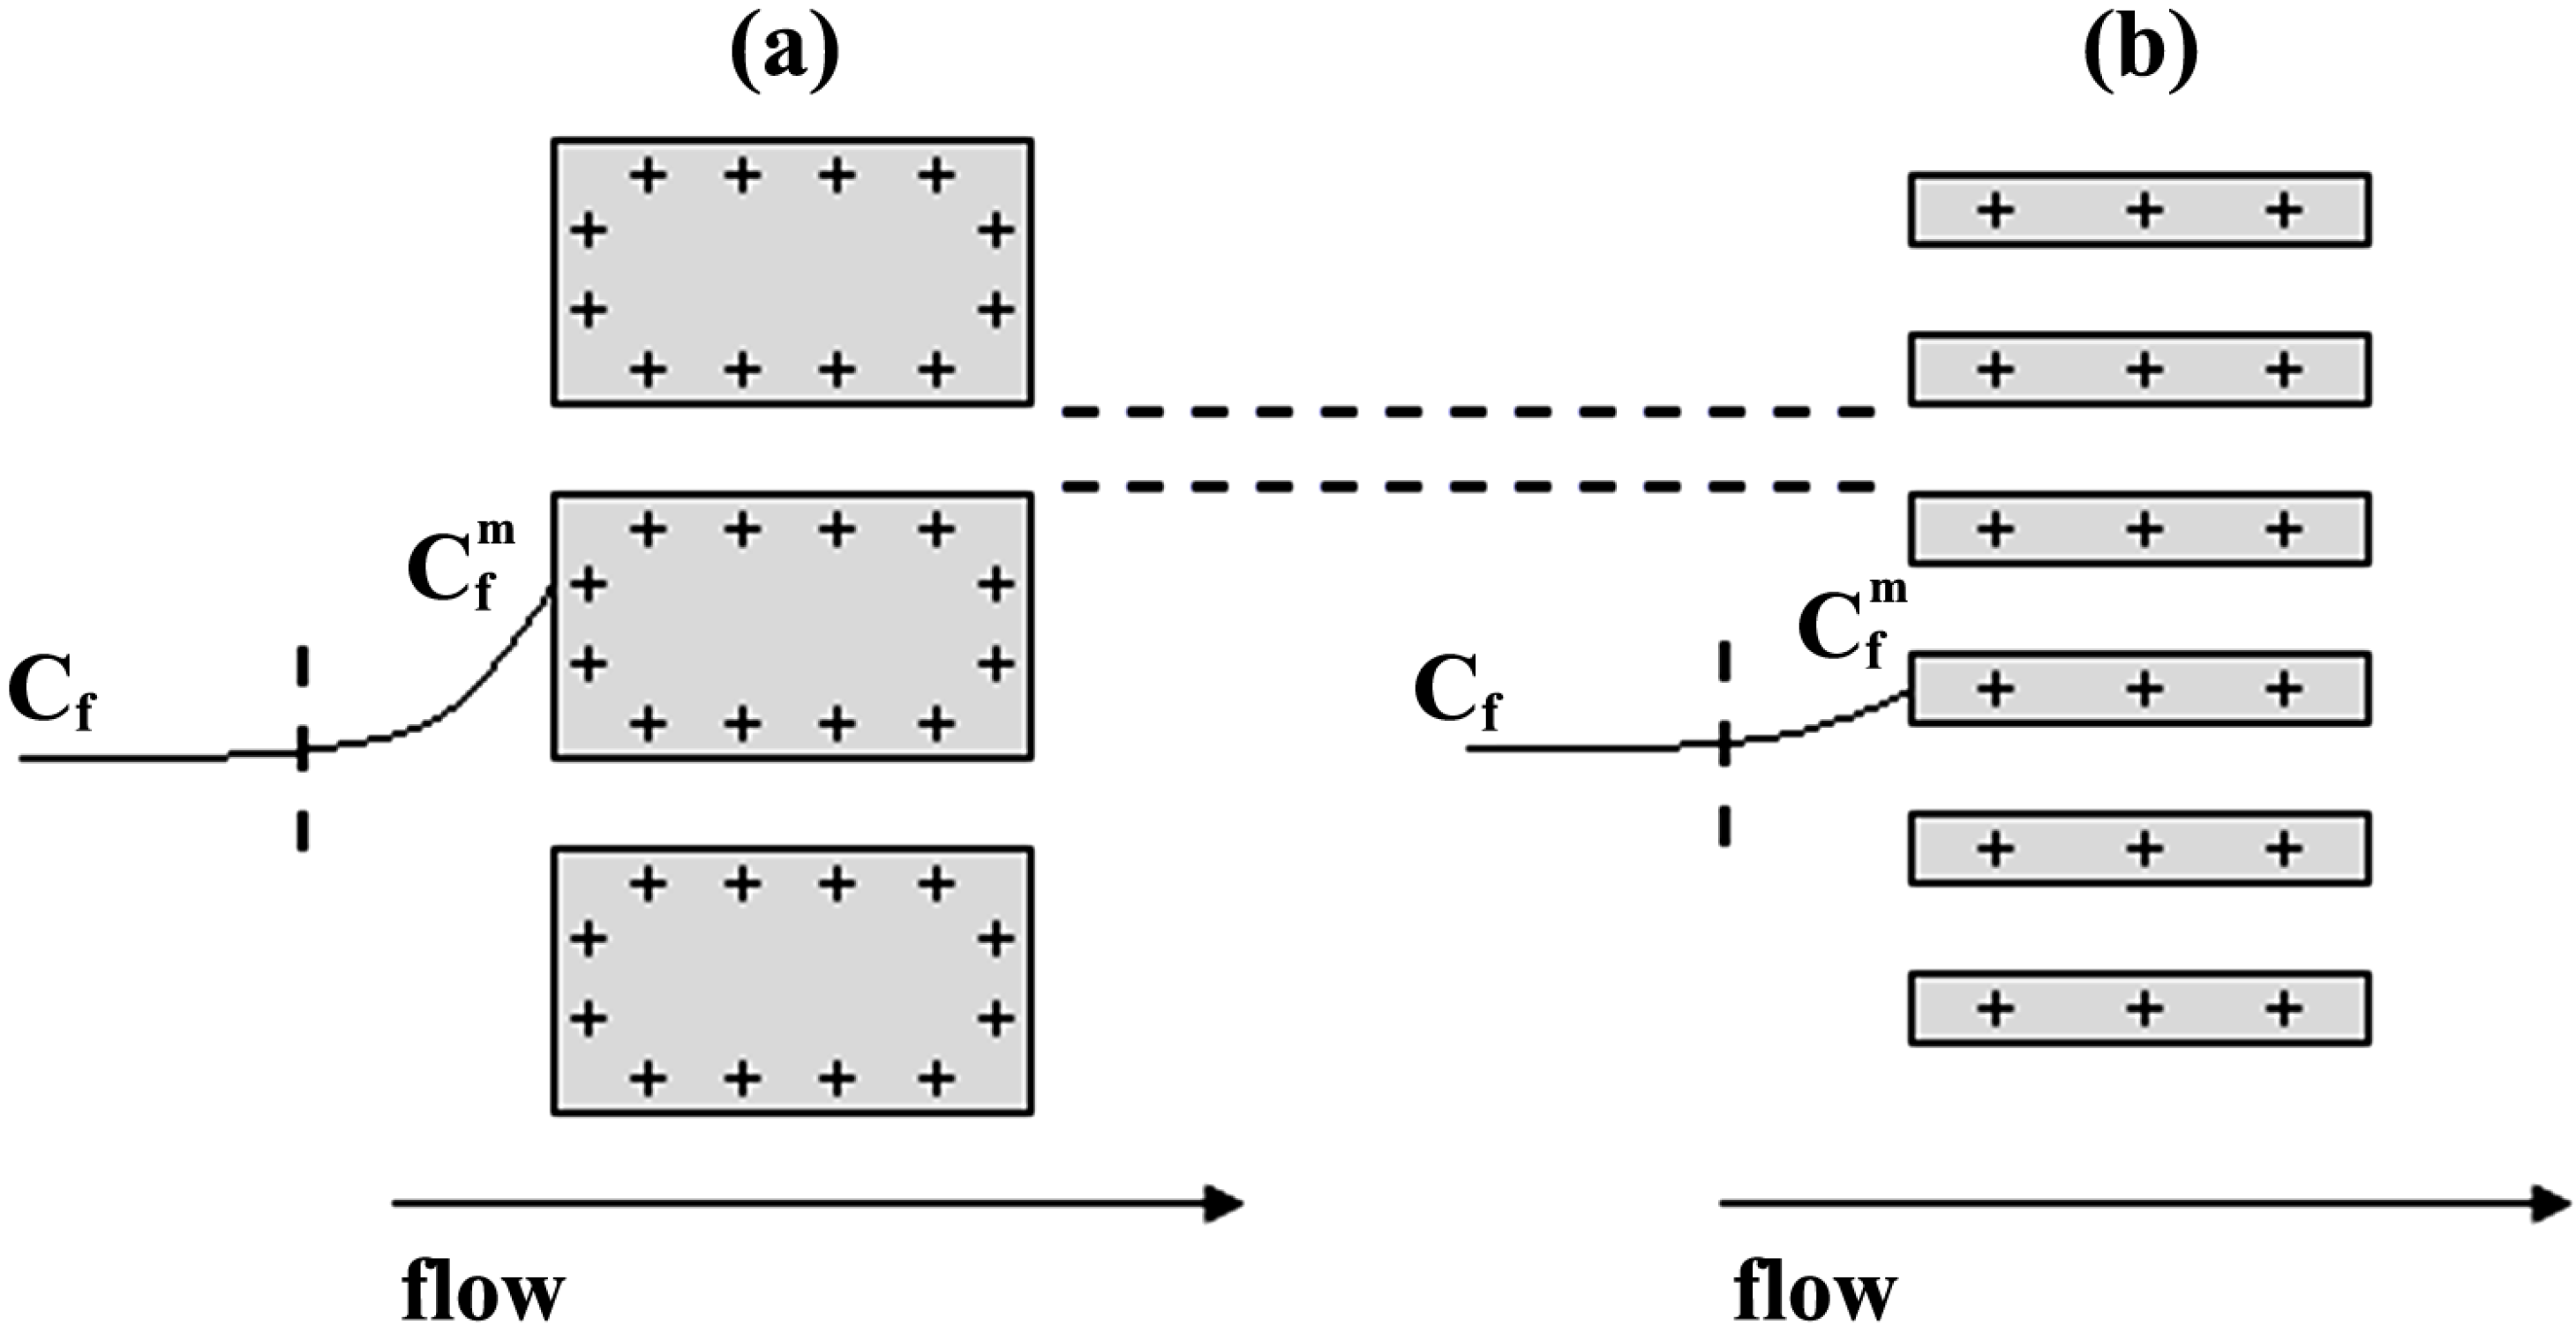
- The Donnan potential for a positively charged membrane with effective fixed charge Xef in contact with an electrolyte solution of concentration C can be expressed as [16]:where R and F correspond to the gas and Faraday constants, and T is the temperature of the system, while Cm represents the concentration in the membrane, related with Xef and C by the electroneutrality condition [16]: Xef + z+∆øDon(I) = (RT/F)ln[Cm / C] = (RT /F)ln[(Xef / 2C) + [(Xef / 2C)2 + 1]1/2]
![Nanomaterials 04 00700 i002]() = z−
= z− ![Nanomaterials 04 00700 i003]() .
. - -
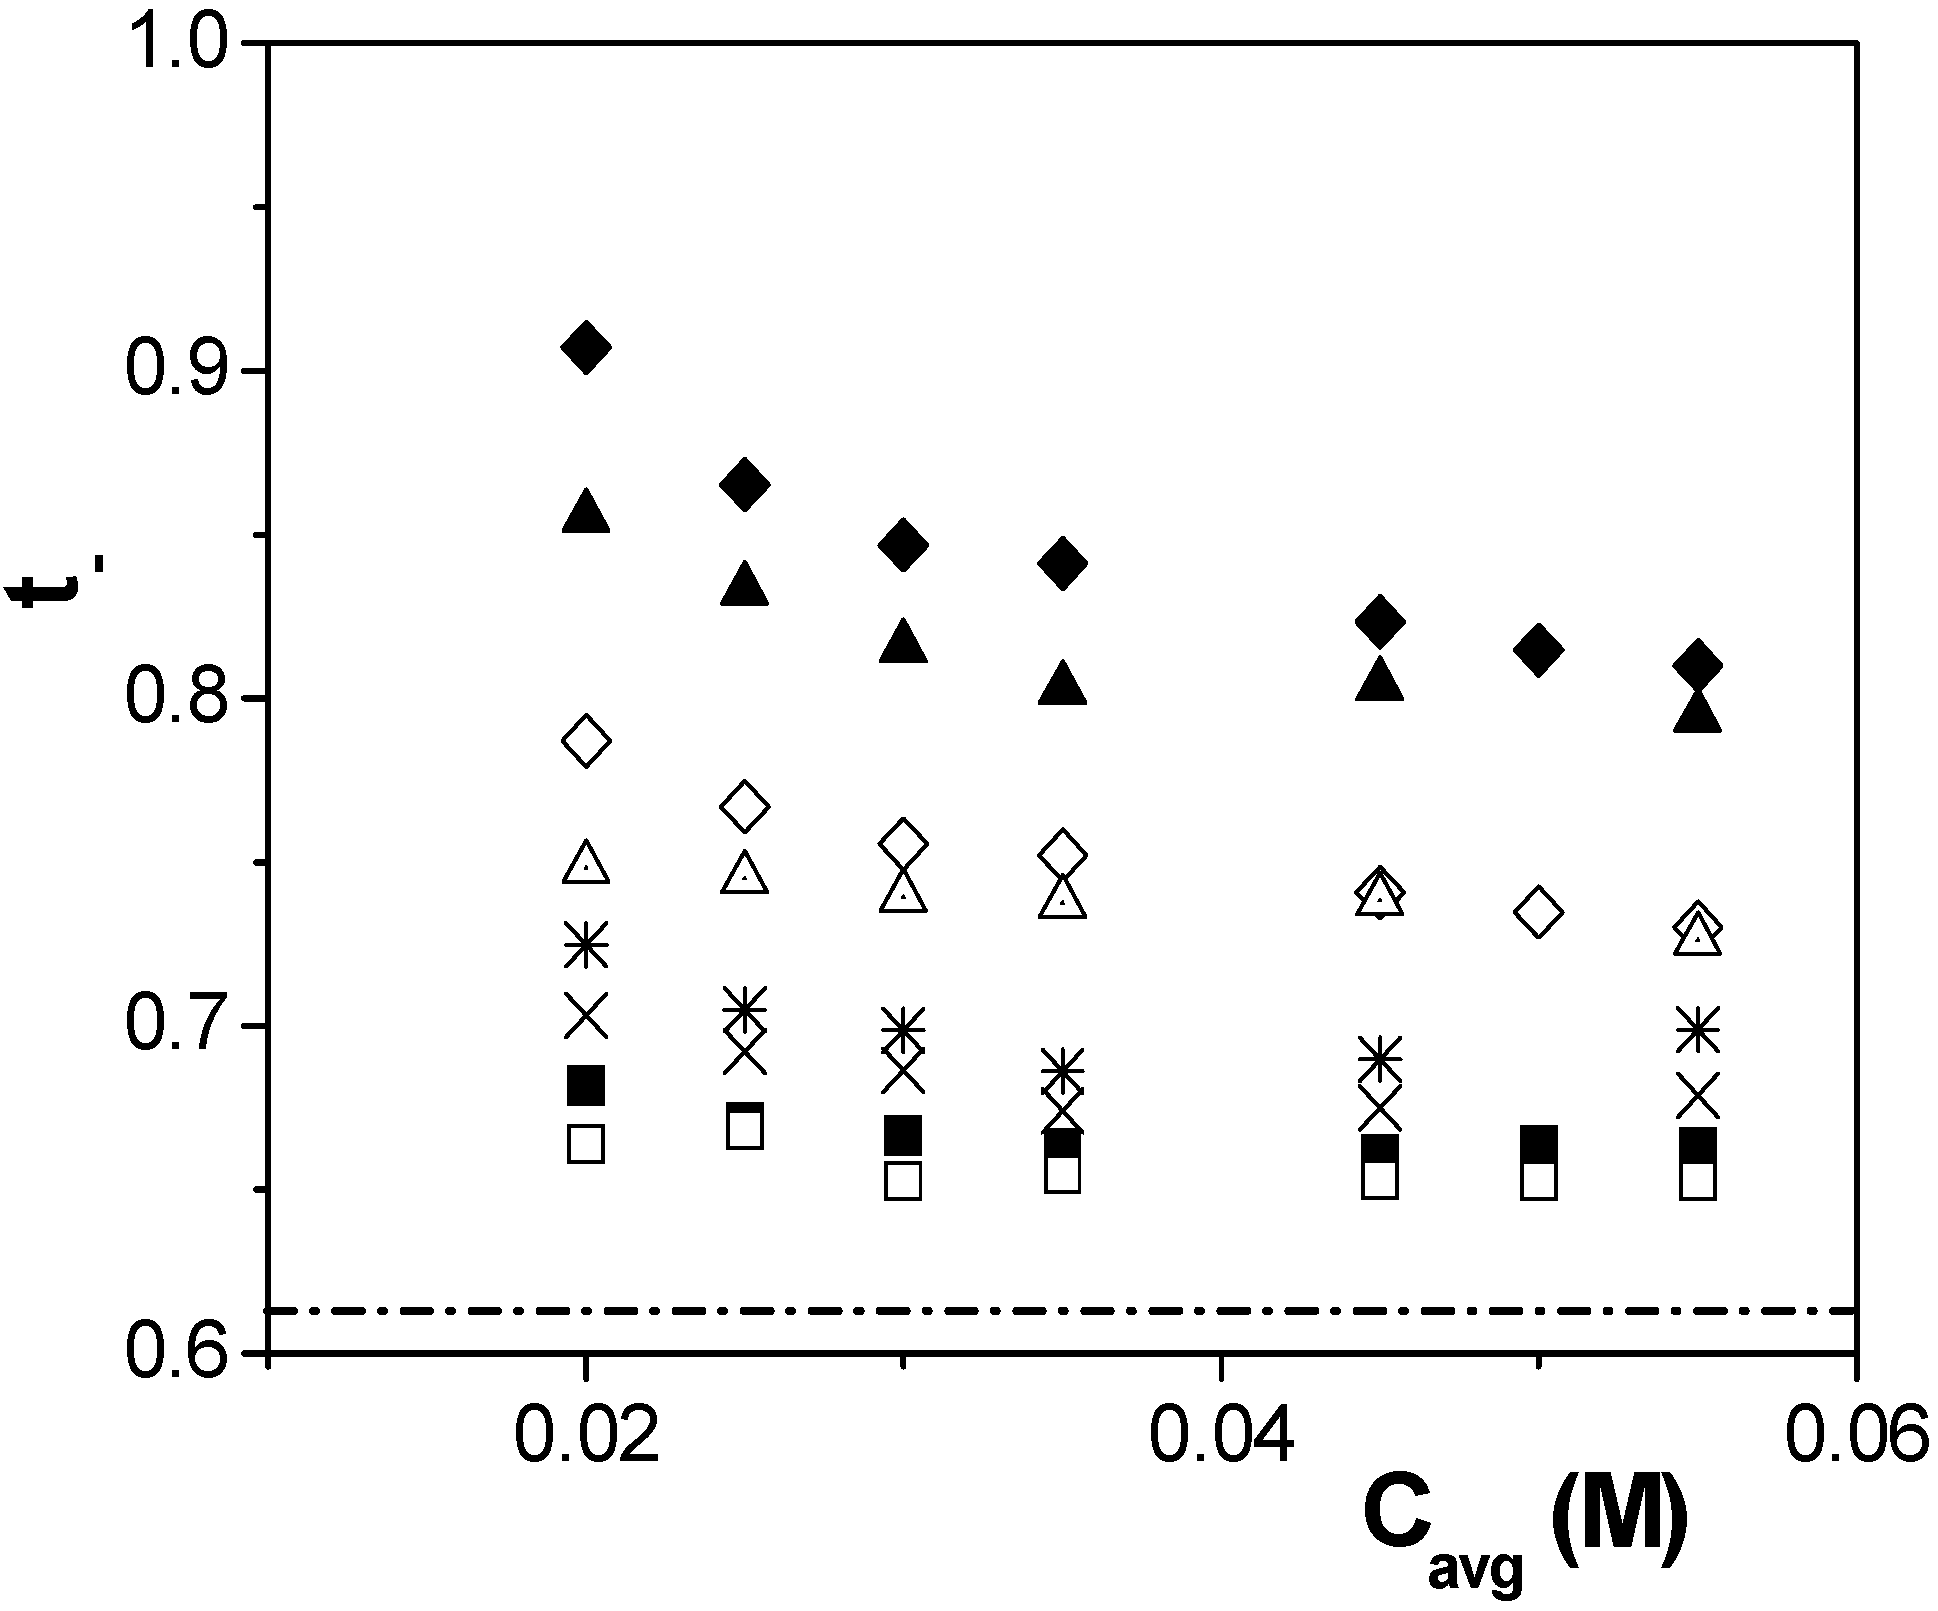
- The diffusion potential is given by [16]:where t+ and t− are the cation and anion transport numbers in the membrane, respectively. According to transport number definition, t+ + t− = 1, and for single salts: t− = 1 − t+.∆ødif = (RT/F)ln[(t− − t+)]ln(Cc/Cv) = (RT/F)[(2t − 1)]ln(Cc/Cv)


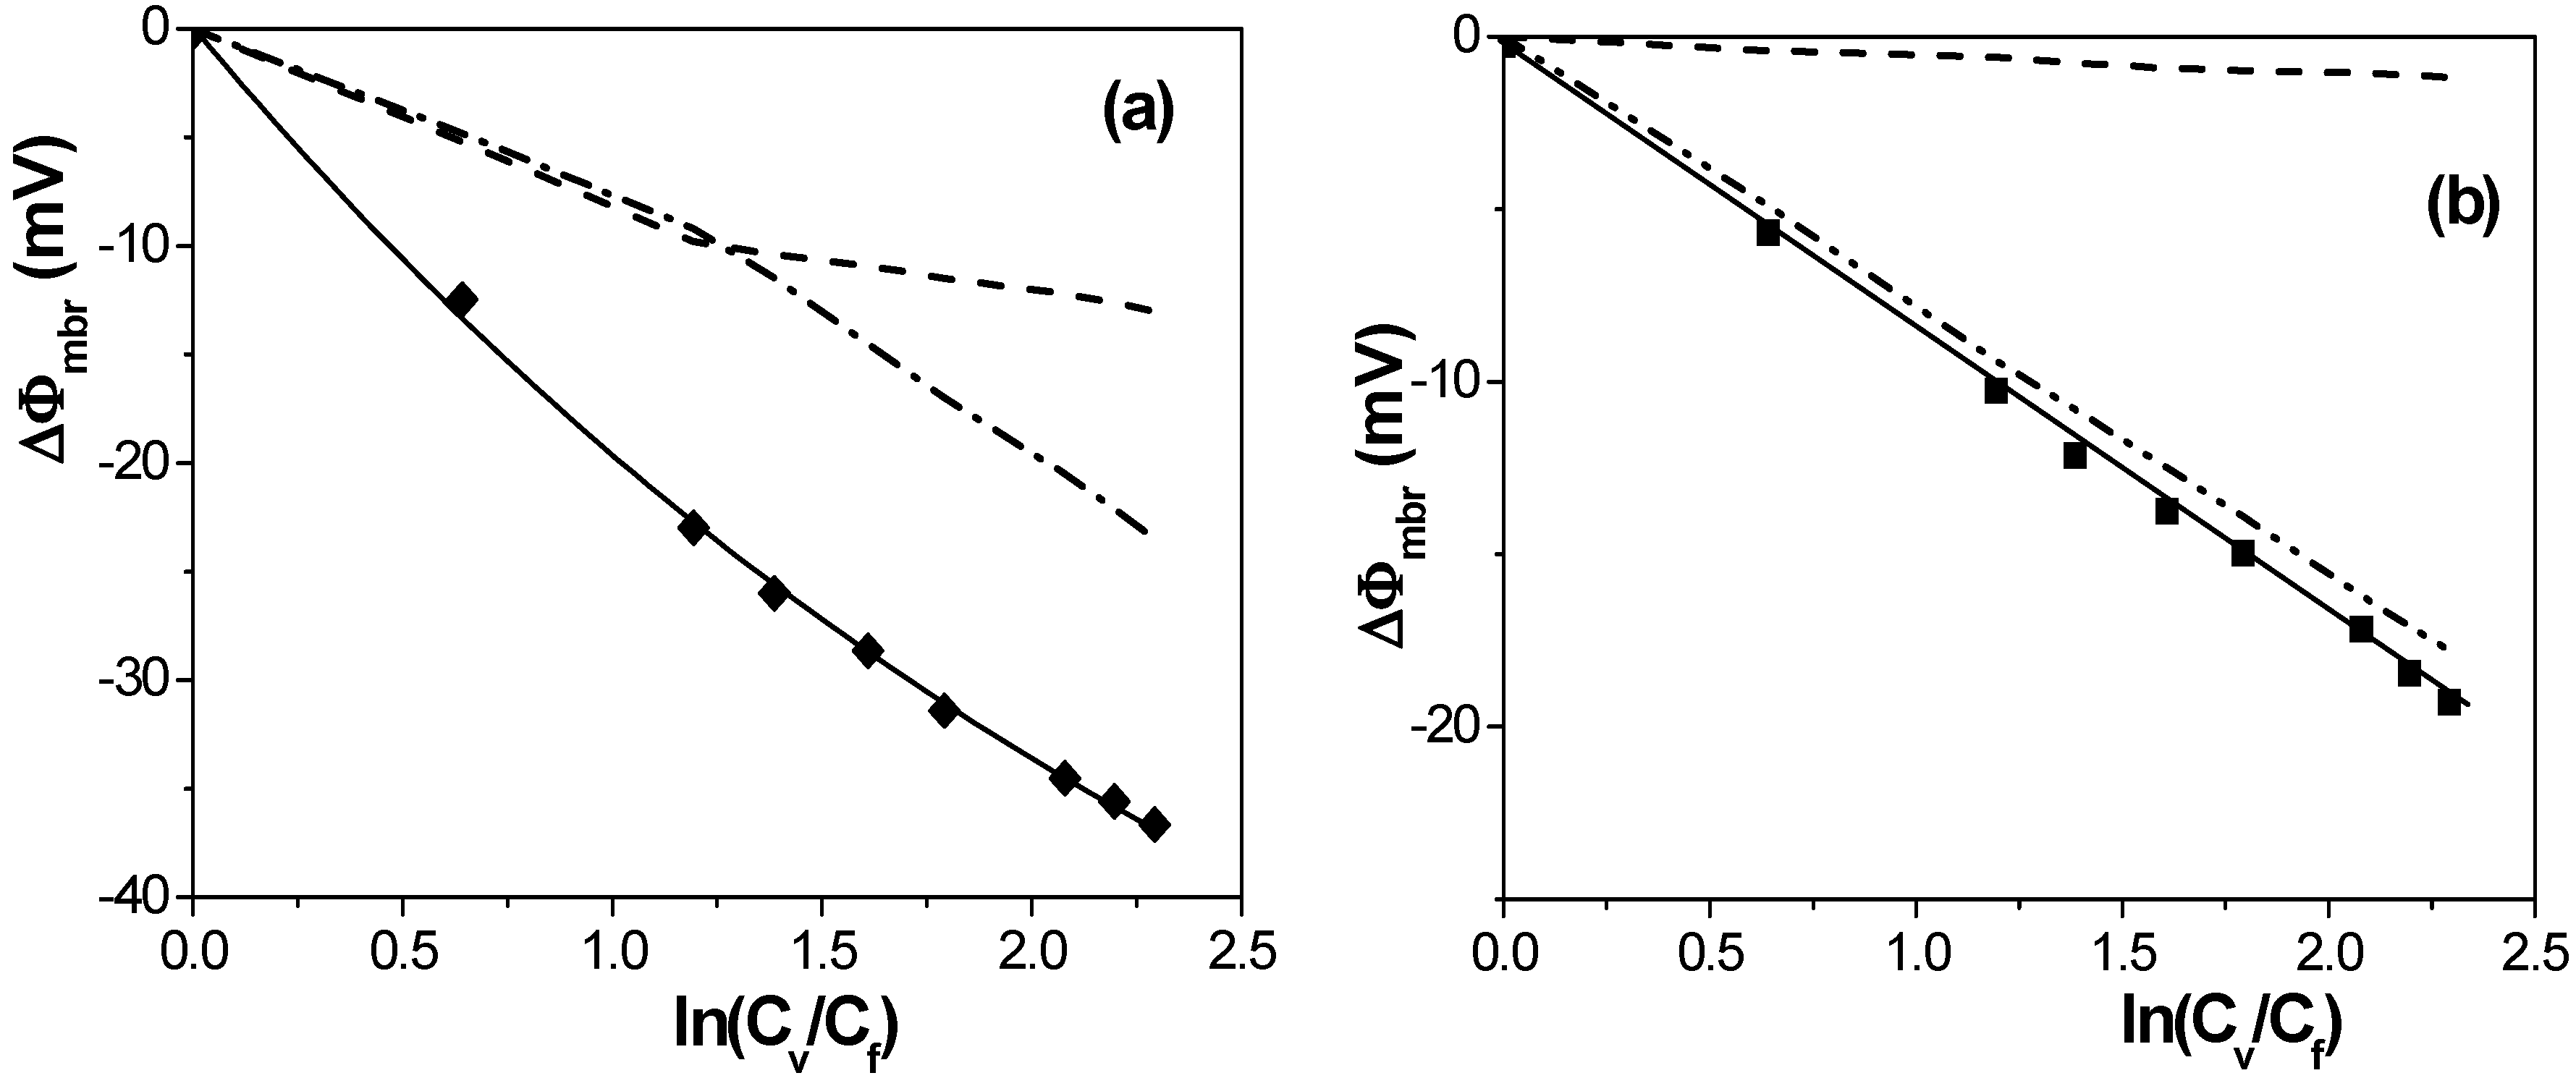
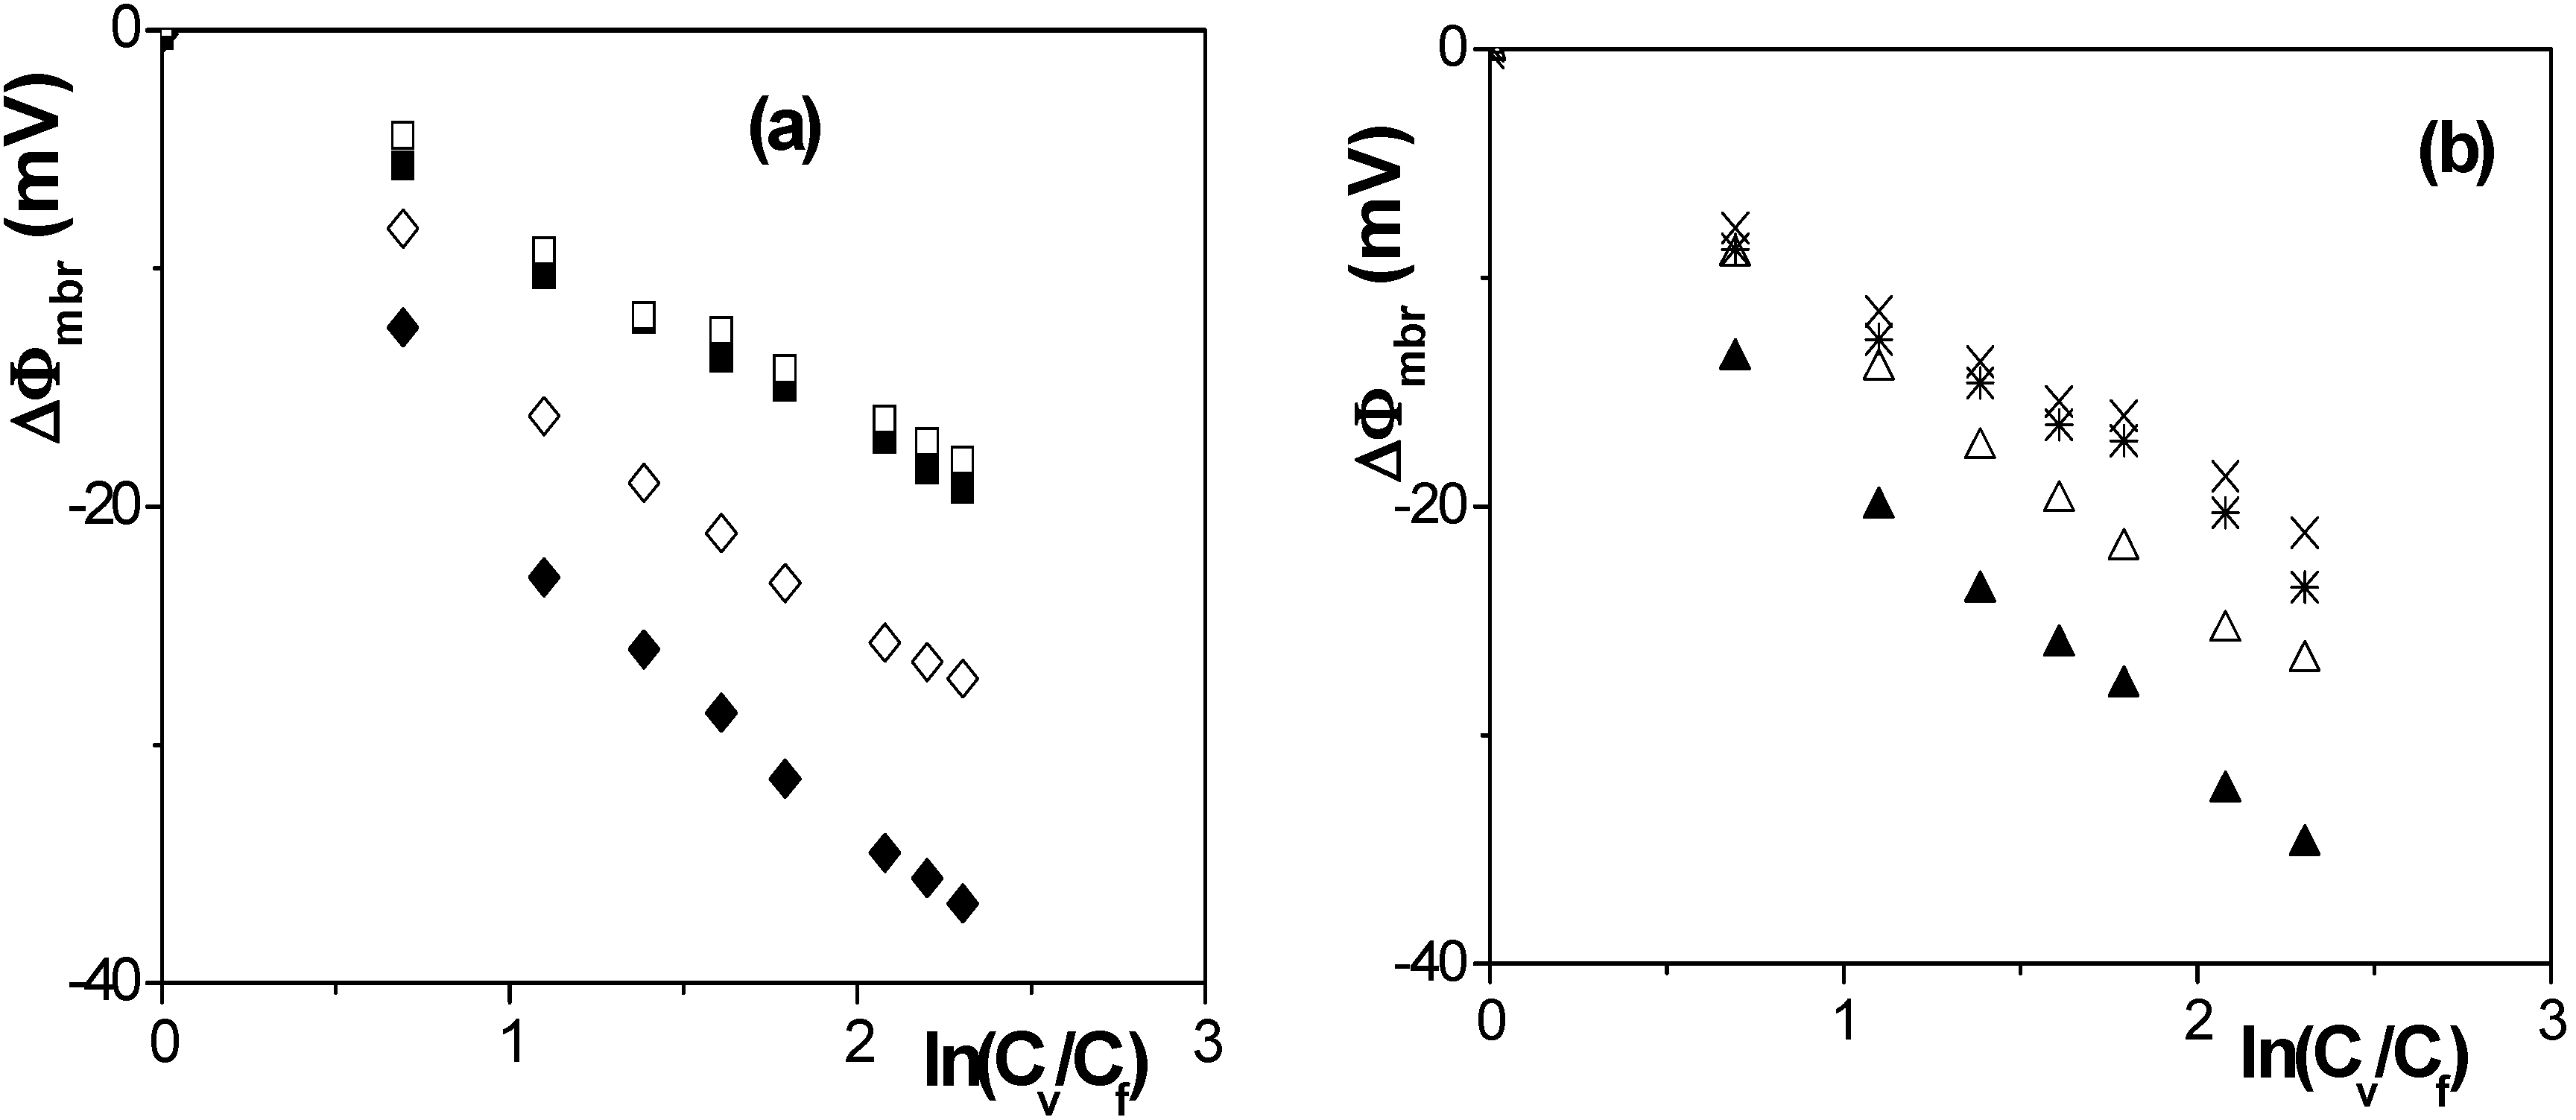
 [17] in the case of solution diffusion potentials. As it can be observed, significant differences in ∆Фmbr values were obtained depending on both membrane porosity and surface nature (consequently, different ions-membrane electroaffinity). Particularly, very similar membrane potentials have been obtained for Al-Sf and Al-Ox/Al2O3 samples, that is, for nanoporous membranes with alumina surfaces, similar pore radii and low porosity (15% and 5%, respectively); however, much lower ∆Фmbr values for the same concentration ratio were obtained for the alumina membrane with higher porosity (30%), and they are very similar to the solution diffusion potential, which is an indication of the small barrier effect of the Anopore membrane to the transport of ions. On the other hand, similar values were also obtained for the SiO2 coated surface sample (Al-Ox/SiO2 membrane), with significantly lower porosity (5%), and in this case they might be associated to a reduction in the electrolyte/membrane electrical interactions as a result of the SiO2 coating.
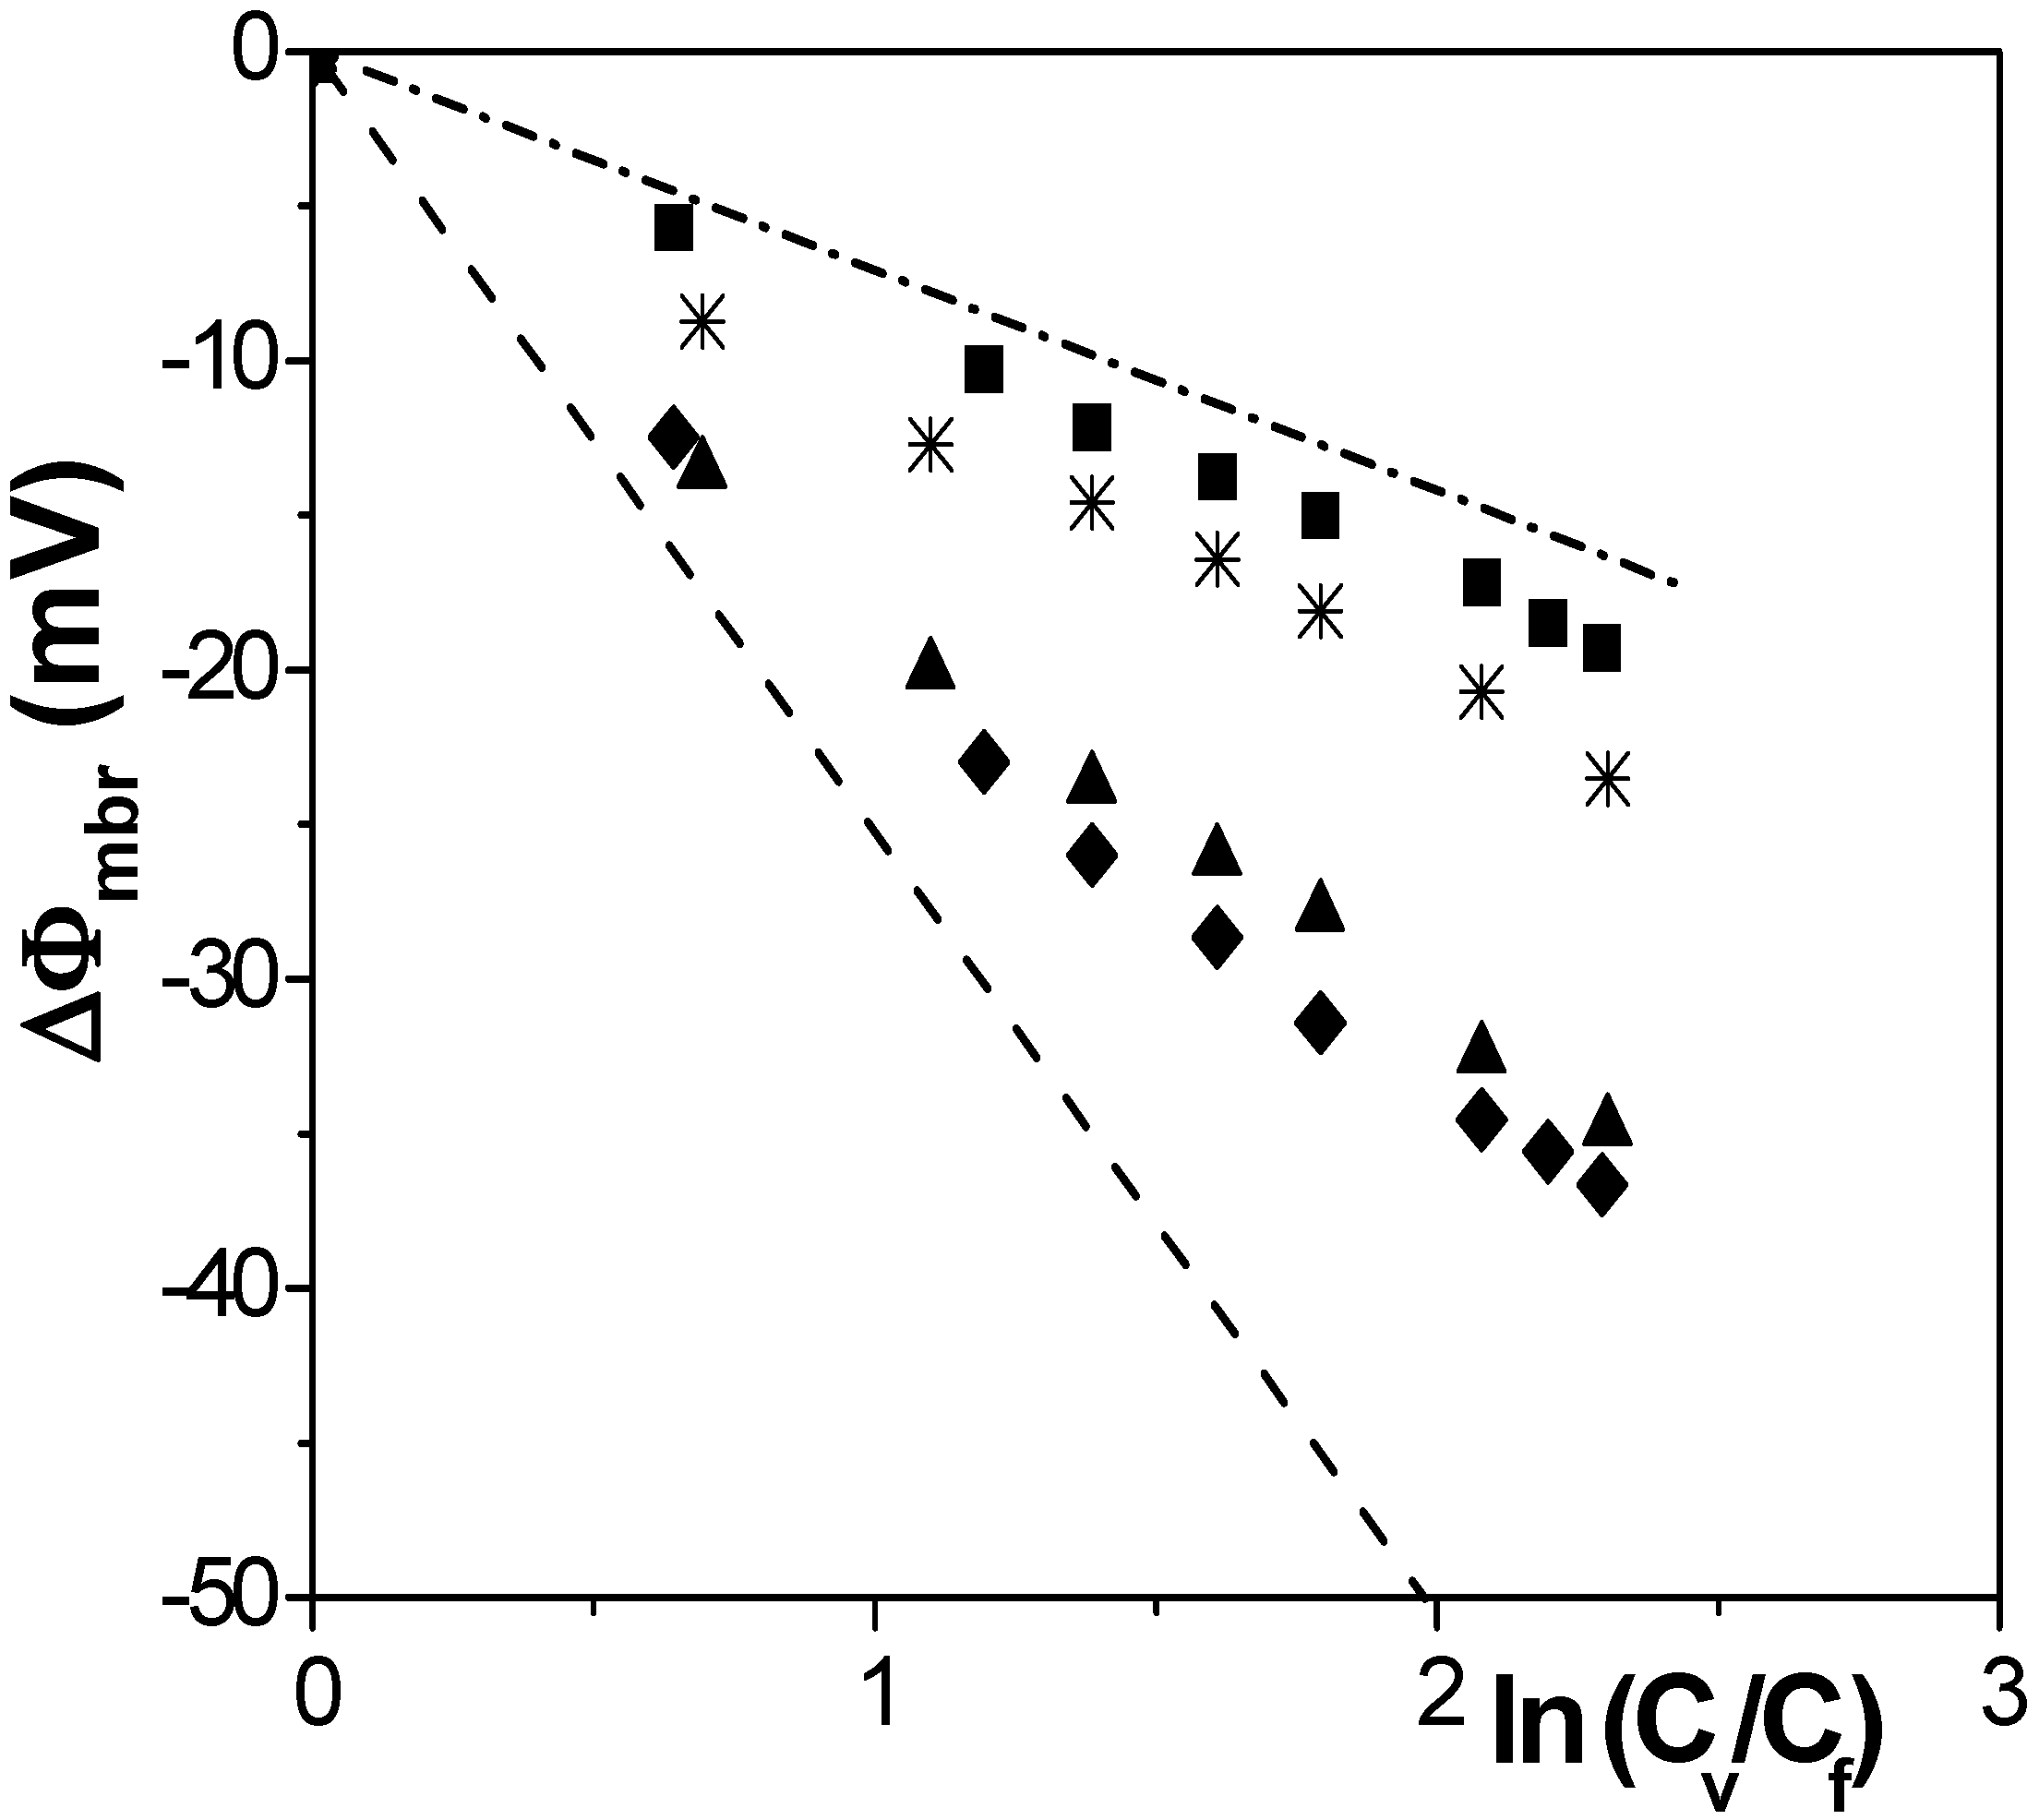
 = 0.615 ± 0.004 [17]), which is an indication of the electropositive character of all the samples. Taking into account the relationship between ion transport numbers and diffusion coefficients [17]: ti = Di/(D+ + D−), ion diffusion ratio for each membrane (D−/D+ = t−/t+) was also estimated and their values are also indicated in Table 2. It should be pointed out that the value of cation diffusion coefficient through the Al-Sf membrane hardly differs from that previously reported for this sample and determined from radiotracer (22Na+) diffusion measurement (DNa+Al-sf = 2.8 × 10⁻¹⁰ m2/s, [18]), which confirms the reliability of the obtained results.
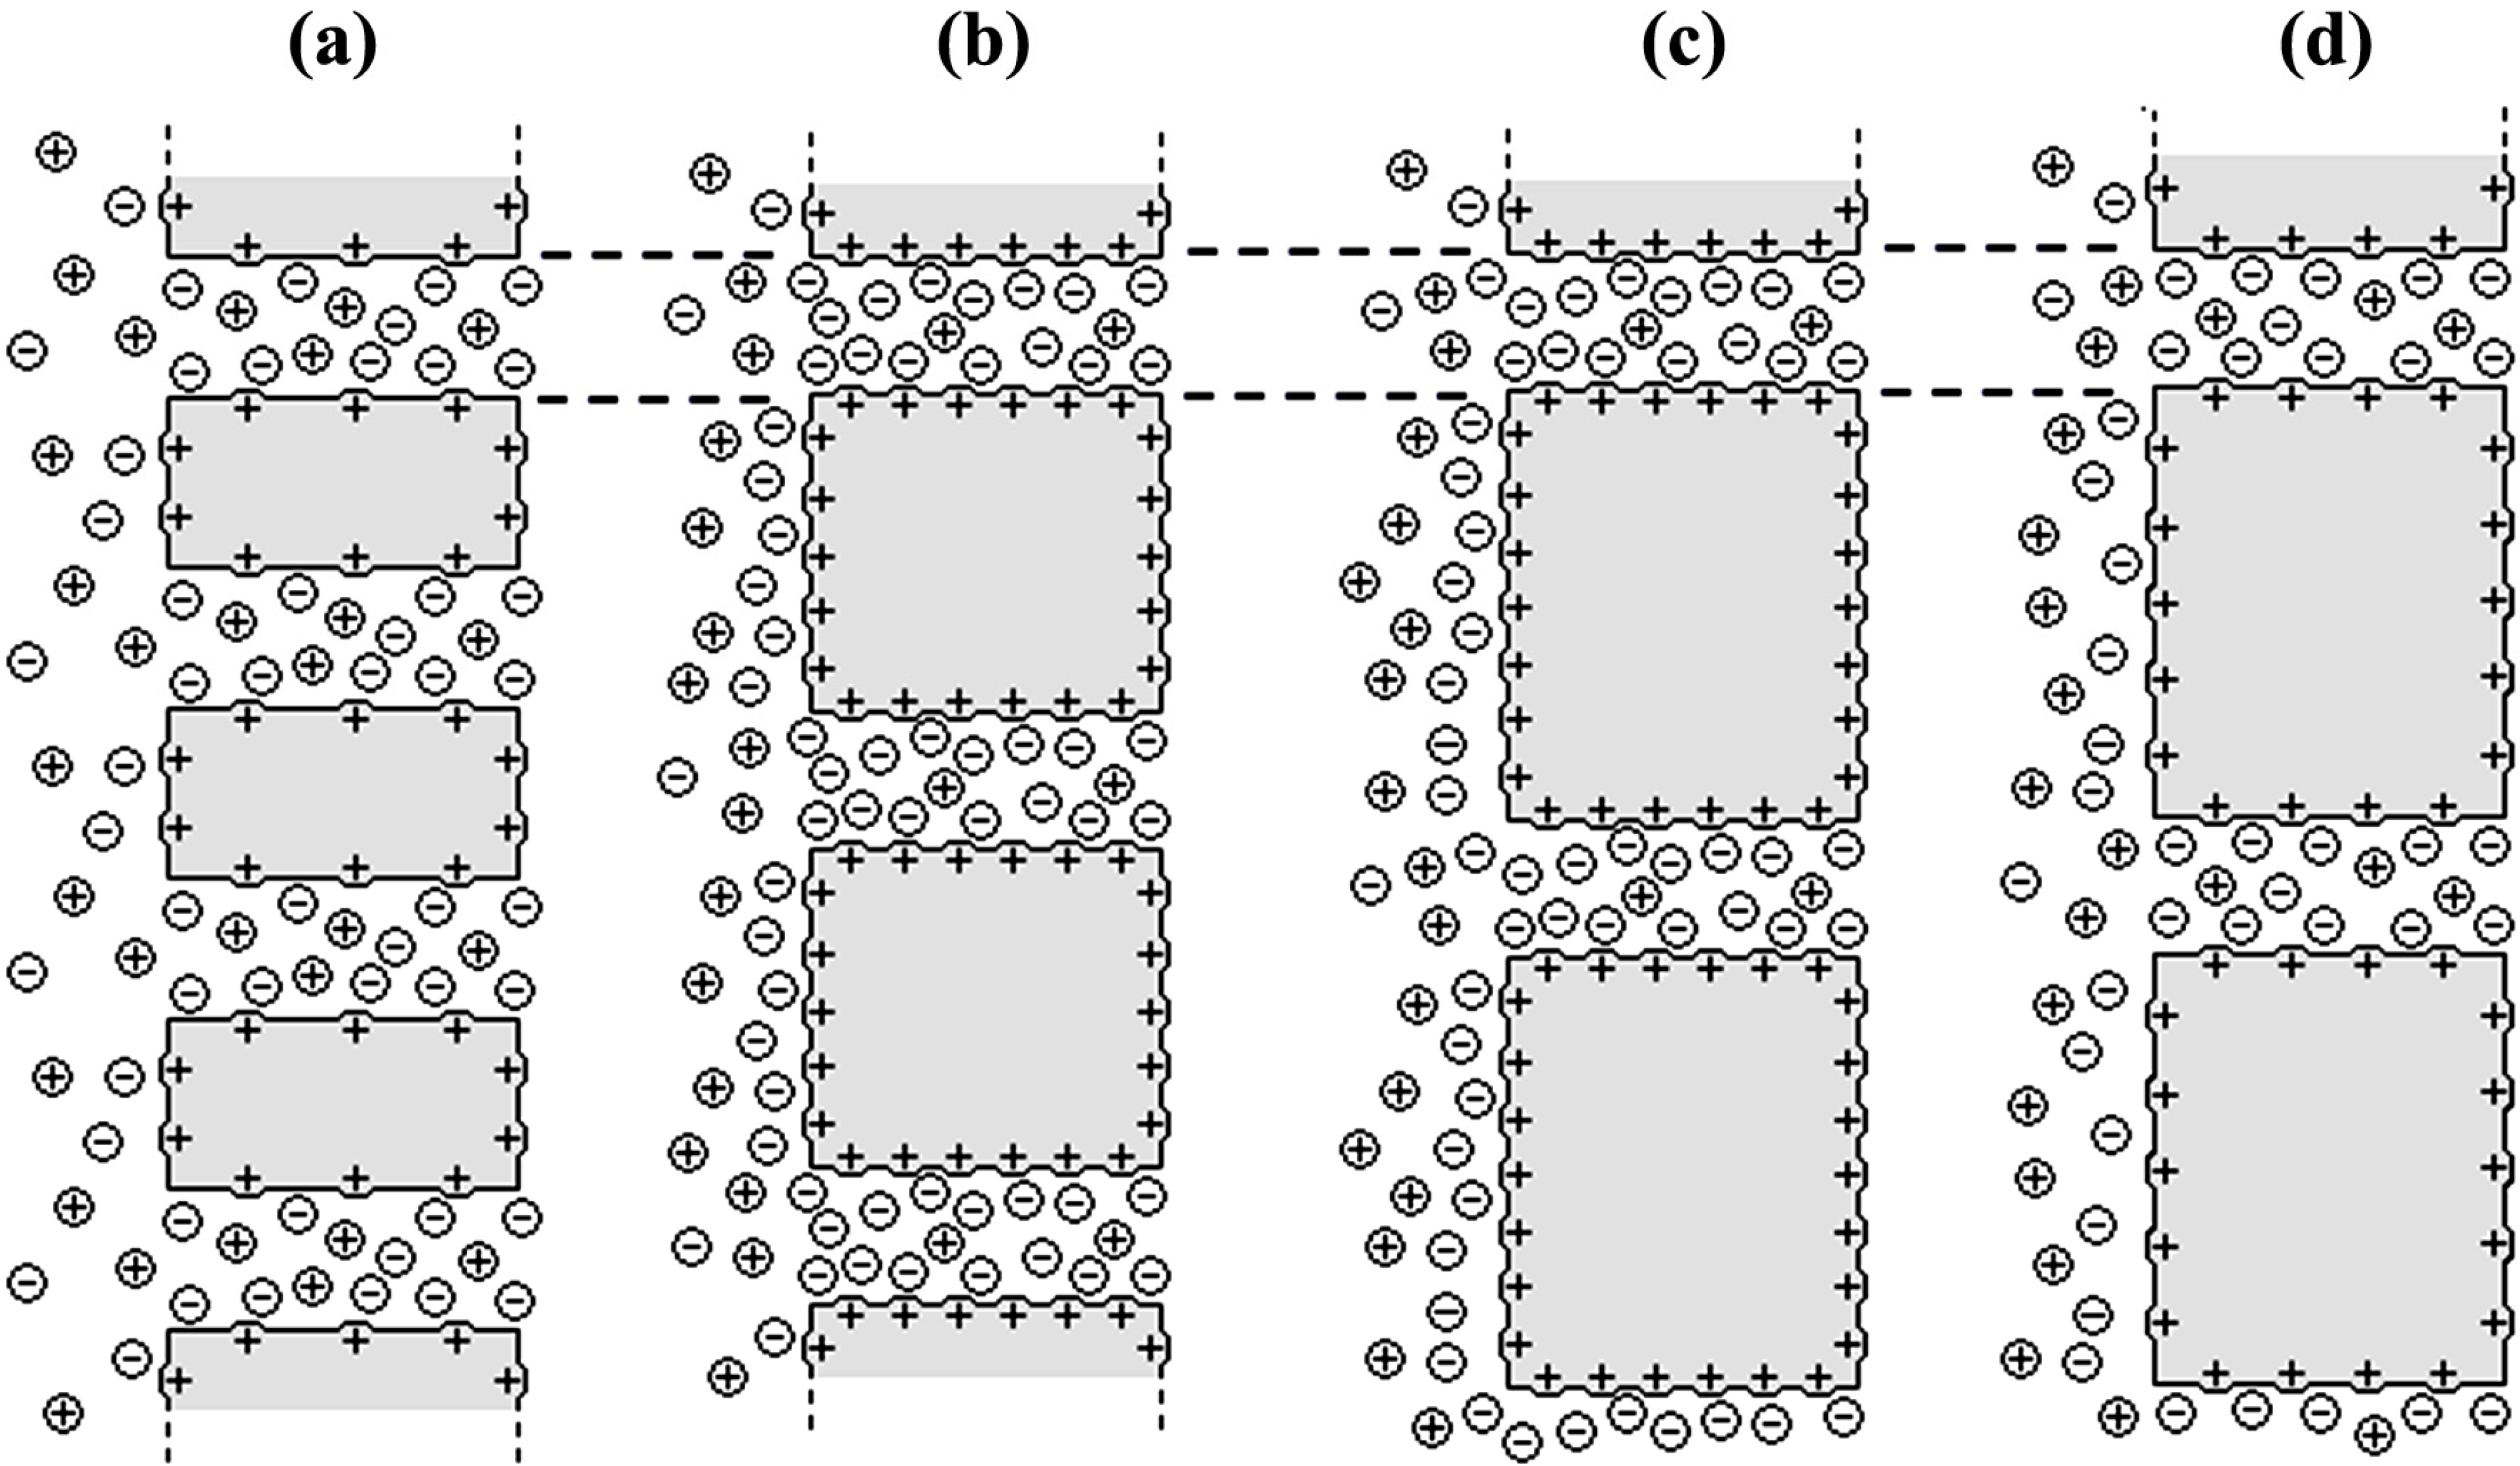
| Sample | Xef (M) | t− | D−/D+ | D− (m2/s) | D+ (m2/s) |
|---|---|---|---|---|---|
| Anopore | 0.001 | 0.655 | 1.90 | 1.9 × 10⁻⁹ | 1.0 × 10⁻⁹ |
| Al-Sf | 0.012 | 0.751 | 3.02 | 9.8 × 10⁻¹⁰ | 3.3 × 10⁻¹⁰ |
| Al-Ox/Al2O3 | 0.012 | 0.724 | 2.66 | 9.0 × 10⁻¹⁰ | 3.4 × 10⁻¹⁰ |
| Al-Ox + SiO2 | 0.003 | 0.668 | 2.01 | 1.4 × 10⁻⁹ | 7.0 × 10⁻¹⁰ |


3. Experimental Section
3.1. Membranes
3.2. Surface Characterization by SEM
3.3. Membrane Potential Measurements
4. Conclusions
Acknowledgments
Author Contributions
Conflicts of Interest
References
- Martin, J.; Manzano, C.V.; Martin-Gonzalez, M. In-depth study of self-ordered porous alumina in the 140–400 nm pore diameter range. Microporous Mesoporous Mater. 2012, 151, 311–316. [Google Scholar] [CrossRef]
- Petukhov, D.I.; Napolskii, K.S.; Elisev, A.A. Permeability of anodic alumina membranes with branched channels. Nanotechnology 2012, 23. [Google Scholar] [CrossRef]
- Penumetcha, S.S.; Kona, R.; Hardin, J.L.; Molder, A.L.; Steinle, E.D. Monitoring transport across modified nanoporous alumina membranes. Sensors 2007, 7, 2942–2952. [Google Scholar] [CrossRef]
- Losic, D.; Cole, M.A.; Dollmann, B.; Vasilev, K.; Griesser, H.J. Surface modification of nanoporous alumina membranes by plasma polymerization. Nanotechnology 2008, 19. [Google Scholar] [CrossRef]
- Mo, Y.; Fei, T. Nanoporous membrane for biosensing applications. Nano LIFE 2012, 2. [Google Scholar] [CrossRef]
- Adiga, S.P.; Jin, C.; Curtiss, L.A.; Monteiro-Riviere, N.A.; Narayan, R.J. Nanoporous membranes for medical and biological applications. Wiley Interdiscip. Rev. Nanomed. Nanobiotechnol. 2009, 1, 568–581. [Google Scholar] [CrossRef]
- Liu, Z.-B.; Zhang, Y.; Yu, J.-J.; Mak, A.F.-T.; Li, Y.; Yang, M. A microfluidic chip with poly(ethylene glycol) hydrogel microarray on nanoporous alumina membrane for cell patterning and drug testing. Sens. Actuators B Chem. 2010, 143, 776–783. [Google Scholar] [CrossRef]
- Romero, V.; Vega, V.; García, J.; Zierold, R.; Nielsch, K.; Prida, V.M.; Hernando, B.; Benavente, J. Changes in morphology and ionic transport induced by ALD SiO2 coating of nanoporous alumina membranes. ACS Appl. Mater. Interfaces 2013, 5, 3556–3563. [Google Scholar] [CrossRef]
- Bluhm, E.A.; Bauer, E.; Chamberlin, R.M.; Abney, K.D.; Young, J.S.; Jarvine, G.D. Surface effects on cation transport across porous alumina membranes. Langmuir 1999, 15, 8668–8672. [Google Scholar] [CrossRef]
- Romero, V.; Vega, V.; García, J.; Zierold, R.; Nielsch, K.; Prida, V.M.; Hernando, B.; Benavente, J. Effect of Porosity and Surface Material in the Transport of Ions across Nanoporous Alumina Membranes. In Proceedings of the 5th Iberian Meeting on Colloids and Interfaces (RICI5), San Sebastian, Spain, 26–28 June 2013.
- Nielsch, K.; Choi, J.; Schwirn, K.; Wehrspohn, R.B.; Gösele, U. Self-ordering regimes of porous alumina: The 10% porosity rule. Nano Lett. 2002, 2, 677–680. [Google Scholar] [CrossRef]
- Helfferich, F. Ion Exchange Membranes; McGraw-Hill: New York, NY, USA, 1962; pp. 330–420. [Google Scholar]
- Sollner, K. The electrochemistry of porous membranes, with particular reference to ion exchange membranes and their use in model studies of biophysical interest. J. Macromol. Sci. Part A Chem. 1969, 3, 1–86. [Google Scholar] [CrossRef]
- Meyer, K.H.; Sievers, J.F. La perméabilité des membranes I. Théorie de la perméabilité ionique. Helv. Chim. Acta 1936, 19, 649–664. (in French). [Google Scholar] [CrossRef]
- Teorell, T. Transport phenomena in membranes eighth Spiers Memorial Lecture. Discuss. Faraday Soc. 1956, 21, 9–26. [Google Scholar] [CrossRef]
- Lakshminarayanaiah, N. Transport Phenomena in Membranes; Academic Press: New York, NY, USA, 1969; pp. 195–205. [Google Scholar]
- Robinson, R.A.; Stokes, R.H. Electrolyte Solutions; Butterworths: London, UK, 1959; p. 158. [Google Scholar]
- Romero, V.; Vázquez, M.I.; Cañete, S.; Vega, V.; García, J.; Prida, V.M.; Hernando, B.; Benavente, J. Frictional and electrical effects involved in the diffusive transport through a nanoporous alumina membrane. J. Phys. Chem. C 2013, 117, 25513–25518. [Google Scholar] [CrossRef]
- Baker, R.W. Membrane Technology and Applications, 2nd ed.; John Wiley & Sons Ltd.: West Sussex, UK, 2004. [Google Scholar]
- Masuda, H.; Fukuda, K. Ordered metal nanohole arrays made by a two-step replication of honeycomb structures of anodic alumina. Science 1995, 268, 1466–1468. [Google Scholar]
- Prida, V.M.; Pirota, K.R.; Navas, D.; Asenjo, A.; Hernández-Vélez, M.; Vázquez, M. Self-organized magnetic nanowire arrays based on alumina and titania templates. J. Nanosci. Nanotechnol. 2007, 7, 272–285. [Google Scholar]
- Bachman, J.; Zierold, R.; Chong, Y.T.; Hauert, R.; Sturm, C.; Schmidt-Grund, R.; Rheinländer, B.; Grundmann, M.; Gösele, U.; Nielsch, K. A practical, self-catalytic, atomic layer deposition of silicon dioxide. Angew. Chem. Int. Ed. 2008, 47, 6177–6179. [Google Scholar] [CrossRef]
- Schneider, C.A.; Rasband, W.S.; Eliceiri, K.W. NIH Image to ImageJ: 25 years of image analysis. Nat. Methods 2012, 9, 671–675. [Google Scholar] [CrossRef]
- Horcas, I.; Fernandez, R.; Gomez-Rodriguez, J.M.; Colchero, J.; Gomez-Herrero, J.; Baro, A.M. WSXM: A software for scanning probe microscopy and a tool for nanotechnology. Rev. Sci. Instrum. 2007, 78. [Google Scholar] [CrossRef]
- Mínguez-Bacho, I.; Rodríguez-López, S.; Asenjo, A.; Vázquez, M.; Hernández-Vélez, M. Self-correlation function for determination of geometrical parameters in nanoporous anodic alumina films. Appl. Phys. A 2012, 106, 105–112. [Google Scholar] [CrossRef]
- Pelaez, L.; Vázquez, M.I.; Benavente, J. Interfacial and fouling effects on diffusional permeability across a composite ceramic membrane. Ceram. Int. 2010, 36, 797–801. [Google Scholar] [CrossRef]
© 2014 by the authors; licensee MDPI, Basel, Switzerland. This article is an open access article distributed under the terms and conditions of the Creative Commons Attribution license (http://creativecommons.org/licenses/by/3.0/).
Share and Cite
Romero, V.; Vega, V.; García, J.; Prida, V.M.; Hernando, B.; Benavente, J. Effect of Porosity and Concentration Polarization on Electrolyte Diffusive Transport Parameters through Ceramic Membranes with Similar Nanopore Size. Nanomaterials 2014, 4, 700-711. https://doi.org/10.3390/nano4030700
Romero V, Vega V, García J, Prida VM, Hernando B, Benavente J. Effect of Porosity and Concentration Polarization on Electrolyte Diffusive Transport Parameters through Ceramic Membranes with Similar Nanopore Size. Nanomaterials. 2014; 4(3):700-711. https://doi.org/10.3390/nano4030700
Chicago/Turabian StyleRomero, Virginia, Victor Vega, Javier García, Victor M. Prida, Blanca Hernando, and Juana Benavente. 2014. "Effect of Porosity and Concentration Polarization on Electrolyte Diffusive Transport Parameters through Ceramic Membranes with Similar Nanopore Size" Nanomaterials 4, no. 3: 700-711. https://doi.org/10.3390/nano4030700
APA StyleRomero, V., Vega, V., García, J., Prida, V. M., Hernando, B., & Benavente, J. (2014). Effect of Porosity and Concentration Polarization on Electrolyte Diffusive Transport Parameters through Ceramic Membranes with Similar Nanopore Size. Nanomaterials, 4(3), 700-711. https://doi.org/10.3390/nano4030700