1. Introduction
Harmful gases such as nitrogen oxides (NO
x), sulfur dioxide (SO
2), hydrogen cyanide (HCN), and hydrogen sulfide (H
2S) pose serious threats to both human health and the environment [
1]. Among them, SO
2 and NO
x are primarily released from fossil fuel combustion in power plants and industrial processes, contributing to acid rain and ecological degradation. Toxic gases like HCN and H
2S are known for their flammable, corrosive, and irritating nature, leading to severe health hazards even at low concentrations. Therefore, the development of effective and sensitive gas sensors, particularly those based on two-dimensional (2D) nanomaterials, has become a crucial research focus for real-time monitoring and early warning of hazardous gases.
2D layered nanomaterials have attracted significant attention for gas sensing applications due to their high surface-to-volume ratios, abundant reactive edge sites, and easily tunable electronic properties [
2,
3,
4]. Their sensing performance can be effectively modulated through surface engineering approaches such as doping or defect introduction. Among various candidates, tin diselenide (SnSe
2), a typical member of the metal dichalcogenide (MDC) family, features a layered structure, strong in-plane anisotropy, and high carrier mobility. In the realm of gas sensing, SnSe
2-based materials have shown great potential. Other studies have demonstrated enhanced gas sensing performance through elemental doping and vacancy engineering. Notably, numerous first-principles calculation studies have demonstrated that its sensing capabilities can be further enhanced via elemental doping and vacancy engineering, as summarized in
Table 1.
In experiments, Cao et al. synthesized SnSe
2 and its derived heterojunctions (e.g., SnO
2/SnSe
2, Au-SnO
2/SnSe
2) via solvothermal and thermal treatments for NO
2 sensing [
10]. Experiments showed that the SnO
2/SnSe
2 heterojunction exhibited a response of 15.07 with response/recovery times of 63 s/122 s and a detection limit of 60.61 ppb at 90 °C under 4 ppm NO
2. The Au-SnO
2/SnSe
2 heterojunction showed an even higher response of 25.31, response/recovery times of 156 s/56 s, and a detection limit of 13.67 ppb at 80 °C. The enhanced performance is attributed to improved interfacial electron transfer, increased surface area, and the spill-over effect. Han et al. demonstrated a low-temperature formaldehyde sensor based on a hydrothermally synthesized SnO
2/SnSe
2 nanostructure [
11]. SnO
2 nanosheets were decorated on SnSe
2 nanoblocks, and microstructural characterization confirmed this unique morphology. At 150 °C, the SnO
2/SnSe
2 sensor exhibited a response of 13.47 to 10 ppm formaldehyde, with response/recovery times of 63 s/12 s, more than three times higher than that of pure SnO
2. The sensor also enabled ppb-level detection, showing excellent repeatability, long-term stability, and humidity resistance. The enhanced performance is attributed to the n–n heterojunction between SnO
2 and SnSe
2 and its unique microstructure. Rani et al. employed the thermal evaporation method to fabricate an n-SnSe
2/p-SnO/n-SnSe heterojunction for NO
2 sensing at room temperature (RT) [
12]. At RT, the sensor exhibited a response of 256% to 5 ppm NO
2, with response/recovery times of 34 s/272 s, and a calculated detection limit of ~115 ppb (38% response).
Beyond compositional tuning, external stimuli such as strain and electric fields also provide effective strategies to tailor gas sensing properties. Zhao et al. reported that strain and electric fields significantly affect the adsorption energy and charge transfer in NO
2-adsorbed monolayer and bilayer SnS
2 systems [
13]. Although Ag-doped SnSe
2 films have been synthesized and their sensing capabilities toward CO and NO gases have been experimentally verified [
14], a comprehensive theoretical investigation on the gas sensing behavior of noble metal (Ag, Au) doped SnSe
2 monolayers, particularly under strain, remains limited.
While these studies provide valuable insights, a systematic understanding of noble-metal (Ag, Au) doped SnSe2 monolayers toward multiple hazardous gases under both unstrained and strained conditions remains limited. In particular, electronic interactions, adsorption/desorption kinetics, and recovery characteristics have not been comprehensively analyzed. In this study, we address these gaps by performing first-principles calculations of Ag- and Au-doped SnSe2 monolayers interacting with NO, NO2, SO2, H2S, and HCN, evaluating adsorption energies, charge transfer, and electronic interactions via charge density difference (CDD) and density of states (DOS) analyses. We further explore the effect of biaxial strain on adsorption and recovery behavior, allowing prediction of sensor performance and providing mechanistic insights for designing high-performance, strain-tunable 2D gas sensors. Key novelties of this work include: (1) systematic comparison of Ag- and Au-doped SnSe2 monolayers for multiple hazardous gases; (2) comprehensive analysis of electronic interactions, adsorption energies, charge transfer, and recovery times; (3) investigation of biaxial strain effects on adsorption/desorption behavior to guide strain-engineered sensor design; and (4) bridging first-principles calculations with practical sensor performance trends. Overall, this work provides a comprehensive framework for understanding and designing high-performance 2D gas sensors, addressing limitations of previous studies that considered only single gases or limited modifications.
2. Calculation Model and Methods
All first-principles calculations in this study were performed using the CASTEP [
15]. The exchange–correlation interactions were treated within the generalized gradient approximation (GGA) using the Perdew–Burke–Ernzerhof (PBE) functional [
16]. In addition, to compensate for the inherent limitations of GGA in accurately describing weak interactions such as van der Waals forces, the van der Waals interactions between the Ag- and Au-doped SnSe
2 monolayer and gas molecules were considered and corrected using the dispersion-corrected DFT-D3 method [
17]. To construct the doping model, a 3 × 3 × 1 supercell of monolayer SnSe
2 was employed, in which a single Se atom was substituted with a noble metal atom (Ag or Au), corresponding to a nominal doping concentration of ~3.7%. Although this concentration is higher than typical experimentally achievable dilute levels, it is primarily dictated by the finite supercell size and represents a practical compromise between physical reliability and computational feasibility in terms of CPU time and memory requirements. Nevertheless, high-concentration theoretical calculations are valuable because they amplify the effects of doping and clarify the underlying physical and chemical trends, such as the influence of dopants on the band structure, Fermi-level position, and gas adsorption behavior, which generally persist even at lower concentrations. At experimentally accessible dilute levels, dopant-induced electronic states are expected to become more localized, band-gap modifications weaker, and molecule–surface interactions reduced, leading to lower adsorption energies and charge transfer, although selectivity may in some cases improve. During structural optimization, the energy cutoff was set at 500 eV, and the k-point sampling grid was configured as 5 × 5 × 1. To eliminate interlayer interactions along the z-direction due to periodic boundary conditions, a vacuum layer of 20 Å was introduced. The final optimized monolayer structure contained 27 atoms, including 9 Sn atoms and 18 Se atoms, as illustrated in
Figure 1.
For gas adsorption studies, the initial distance between the gas molecule and the surface of the Ag- or Au-doped SnSe
2 monolayer was set to 3 Å. The adsorption energy (
) was calculated to evaluate the thermodynamic stability of gas adsorption, and is defined as:
where
,
, and
represent the total energies of the adsorption system, the isolated Ag (or Au)-doped SnSe
2 monolayer, and the isolated gas molecule, respectively. A negative
value indicates an exothermic and energetically favorable adsorption process.
To further investigate the electronic interactions between gas molecules and the substrate, CDD analysis was carried out. The differential charge density (
) is expressed as:
where
,
, and
represent the charge densities of the adsorption system, the pristine Ag (or Au)-doped SnSe
2 monolayer, and the isolated gas molecule, respectively. Notably,
and
were computed using the same atomic configuration as in the adsorption complex to ensure accuracy. Charge transfer analysis serves as a critical indicator of the interaction strength and sensing behavior of gas molecules on 2D materials [
18].
3. Results
3.1. Ag- and Au-Doped SnSe2 Monolayers
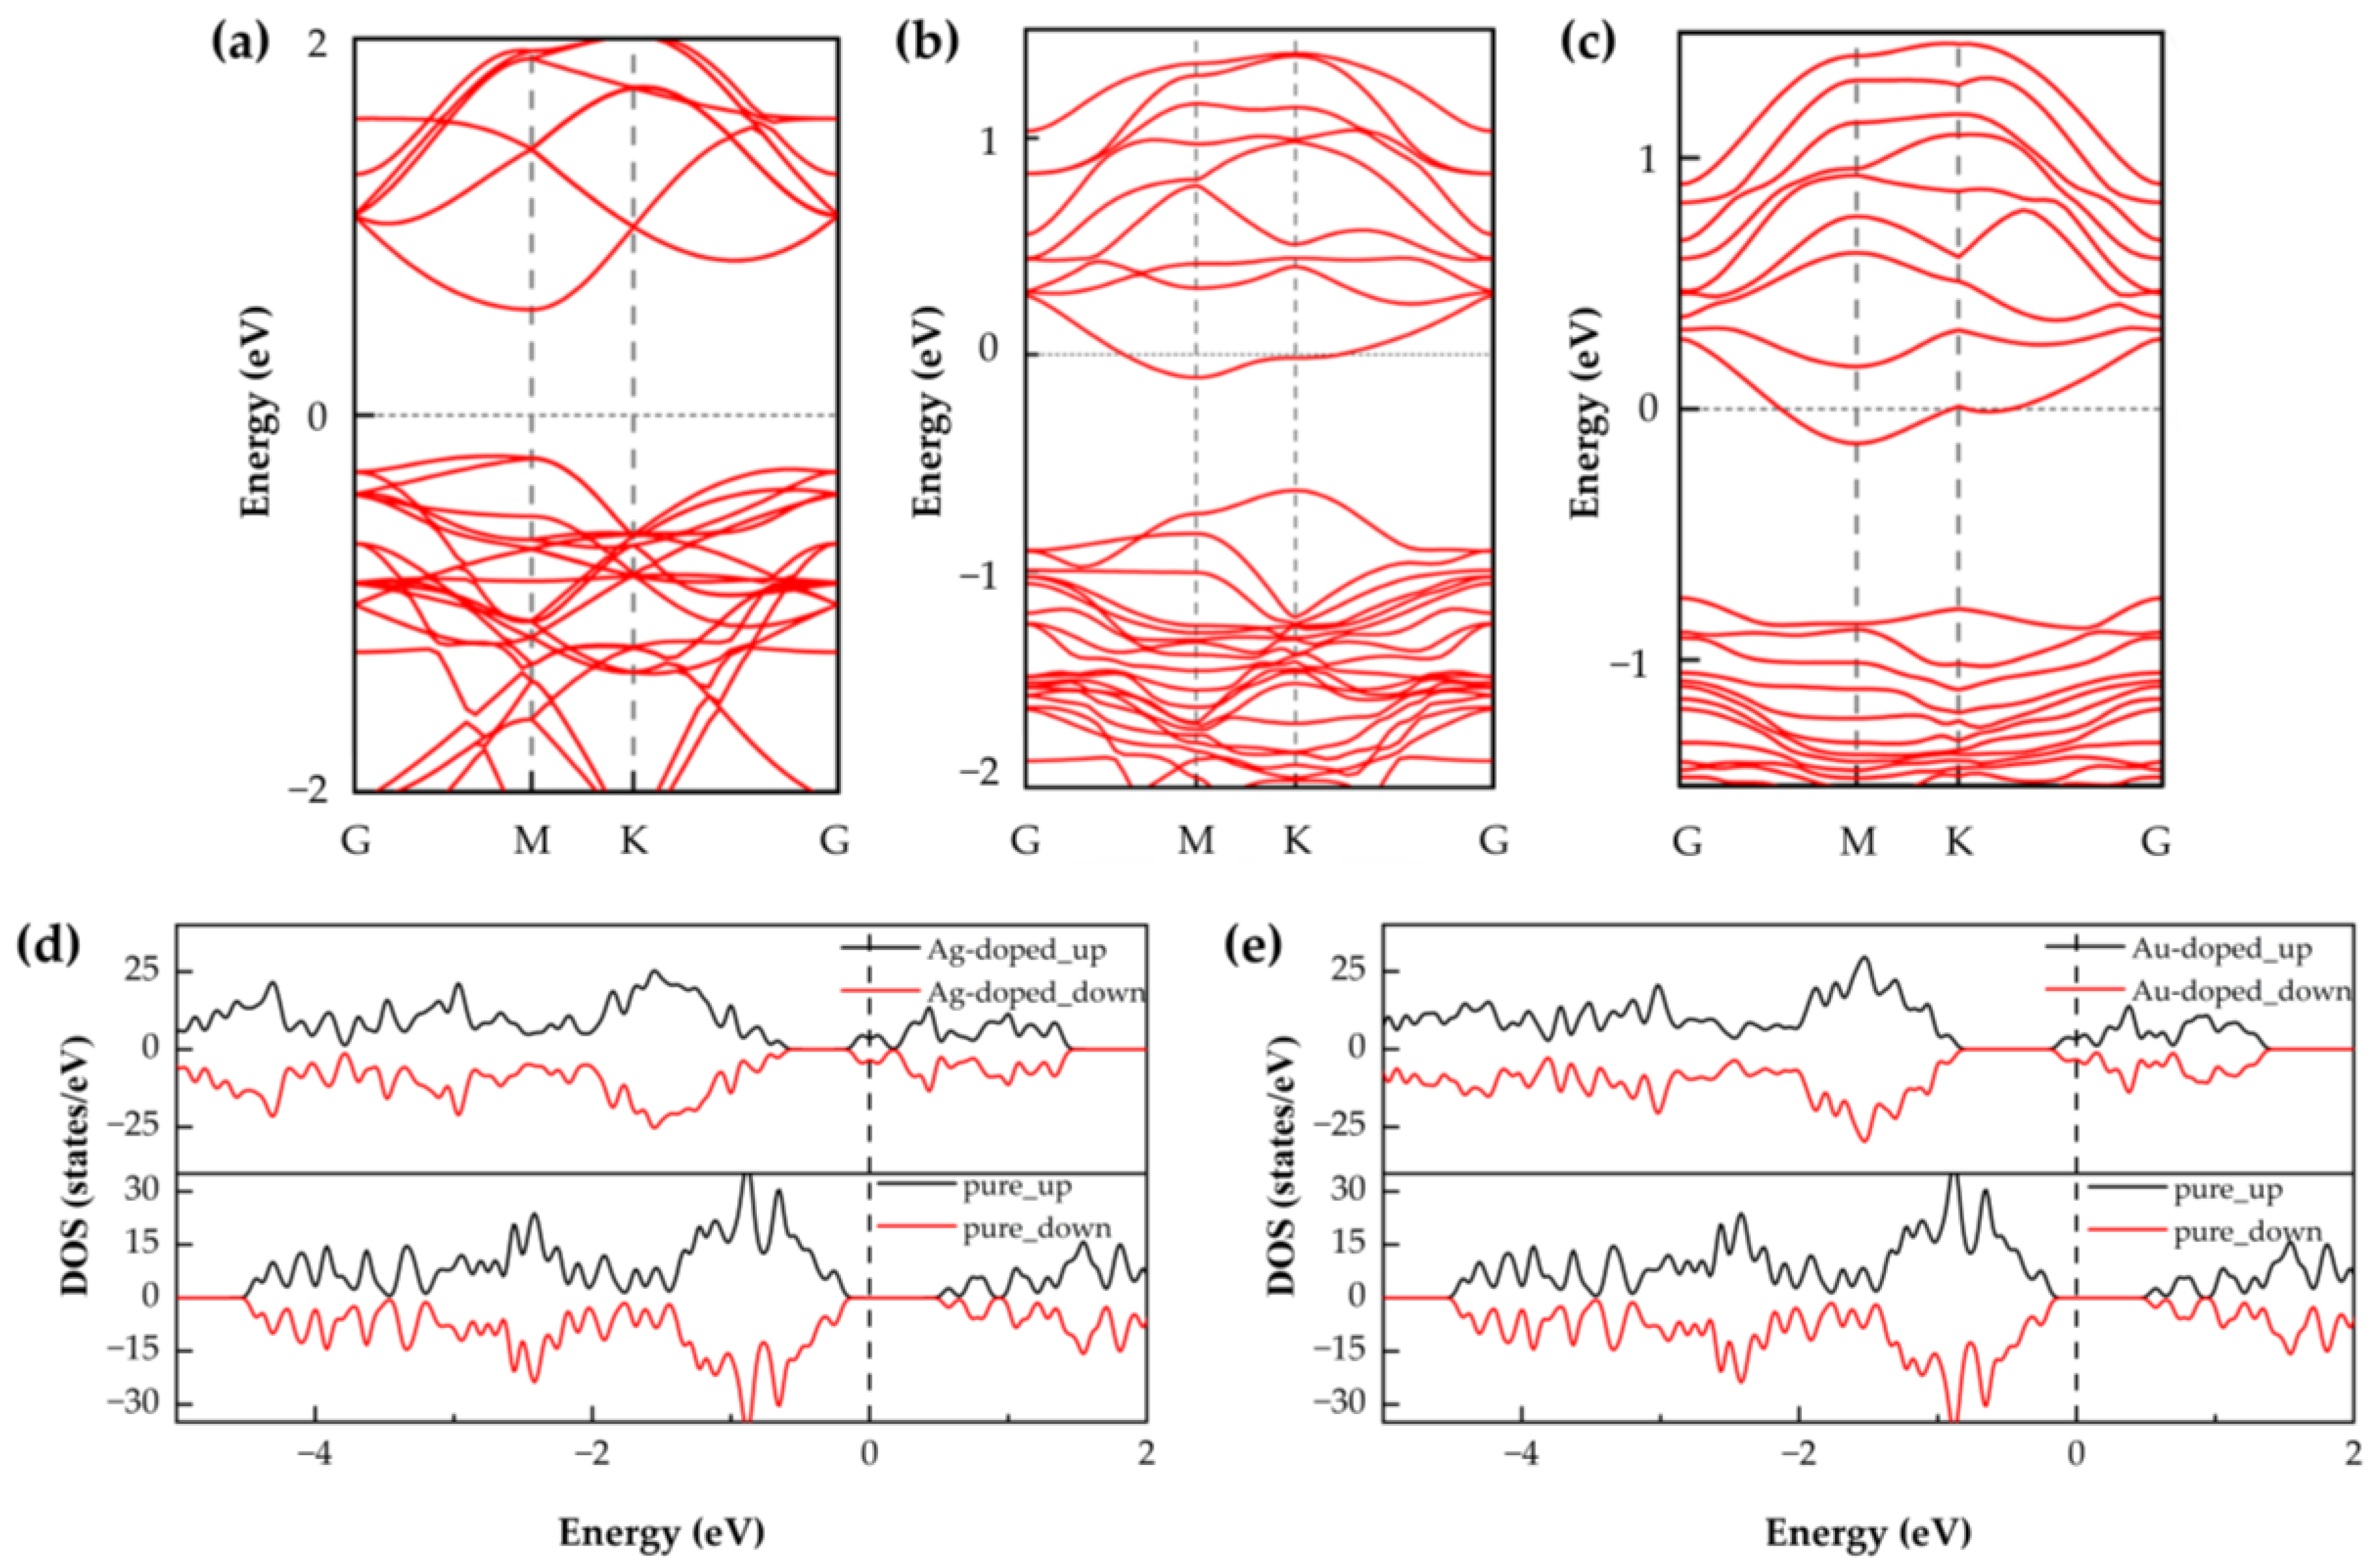
As illustrated in
Figure 2, the SnSe
2 monolayers doped with noble metal atoms (Ag or Au) were fully optimized, and their structural and electronic properties were analyzed. To investigate the gas-sensing characteristics, we calculated the band structures and DOS of pristine SnSe
2 as well as those of Ag- and Au-doped systems. The calculated band gap of pristine SnSe
2 was 0.785 eV. The introduction of Ag or Au atoms into the SnSe
2 lattice significantly alters its electronic structure. In both doped systems, the conduction band crosses the Fermi level, indicating a transition from semiconducting to semimetallic behavior. This change implies enhanced conductivity, which may contribute to improved gas-sensing performance [
8].
3.2. Gas Adsorption Behavior
We evaluated the adsorption configurations of five hazardous gases (NO, NO
2, SO
2, H
2S, and HCN) on noble metal-doped SnSe
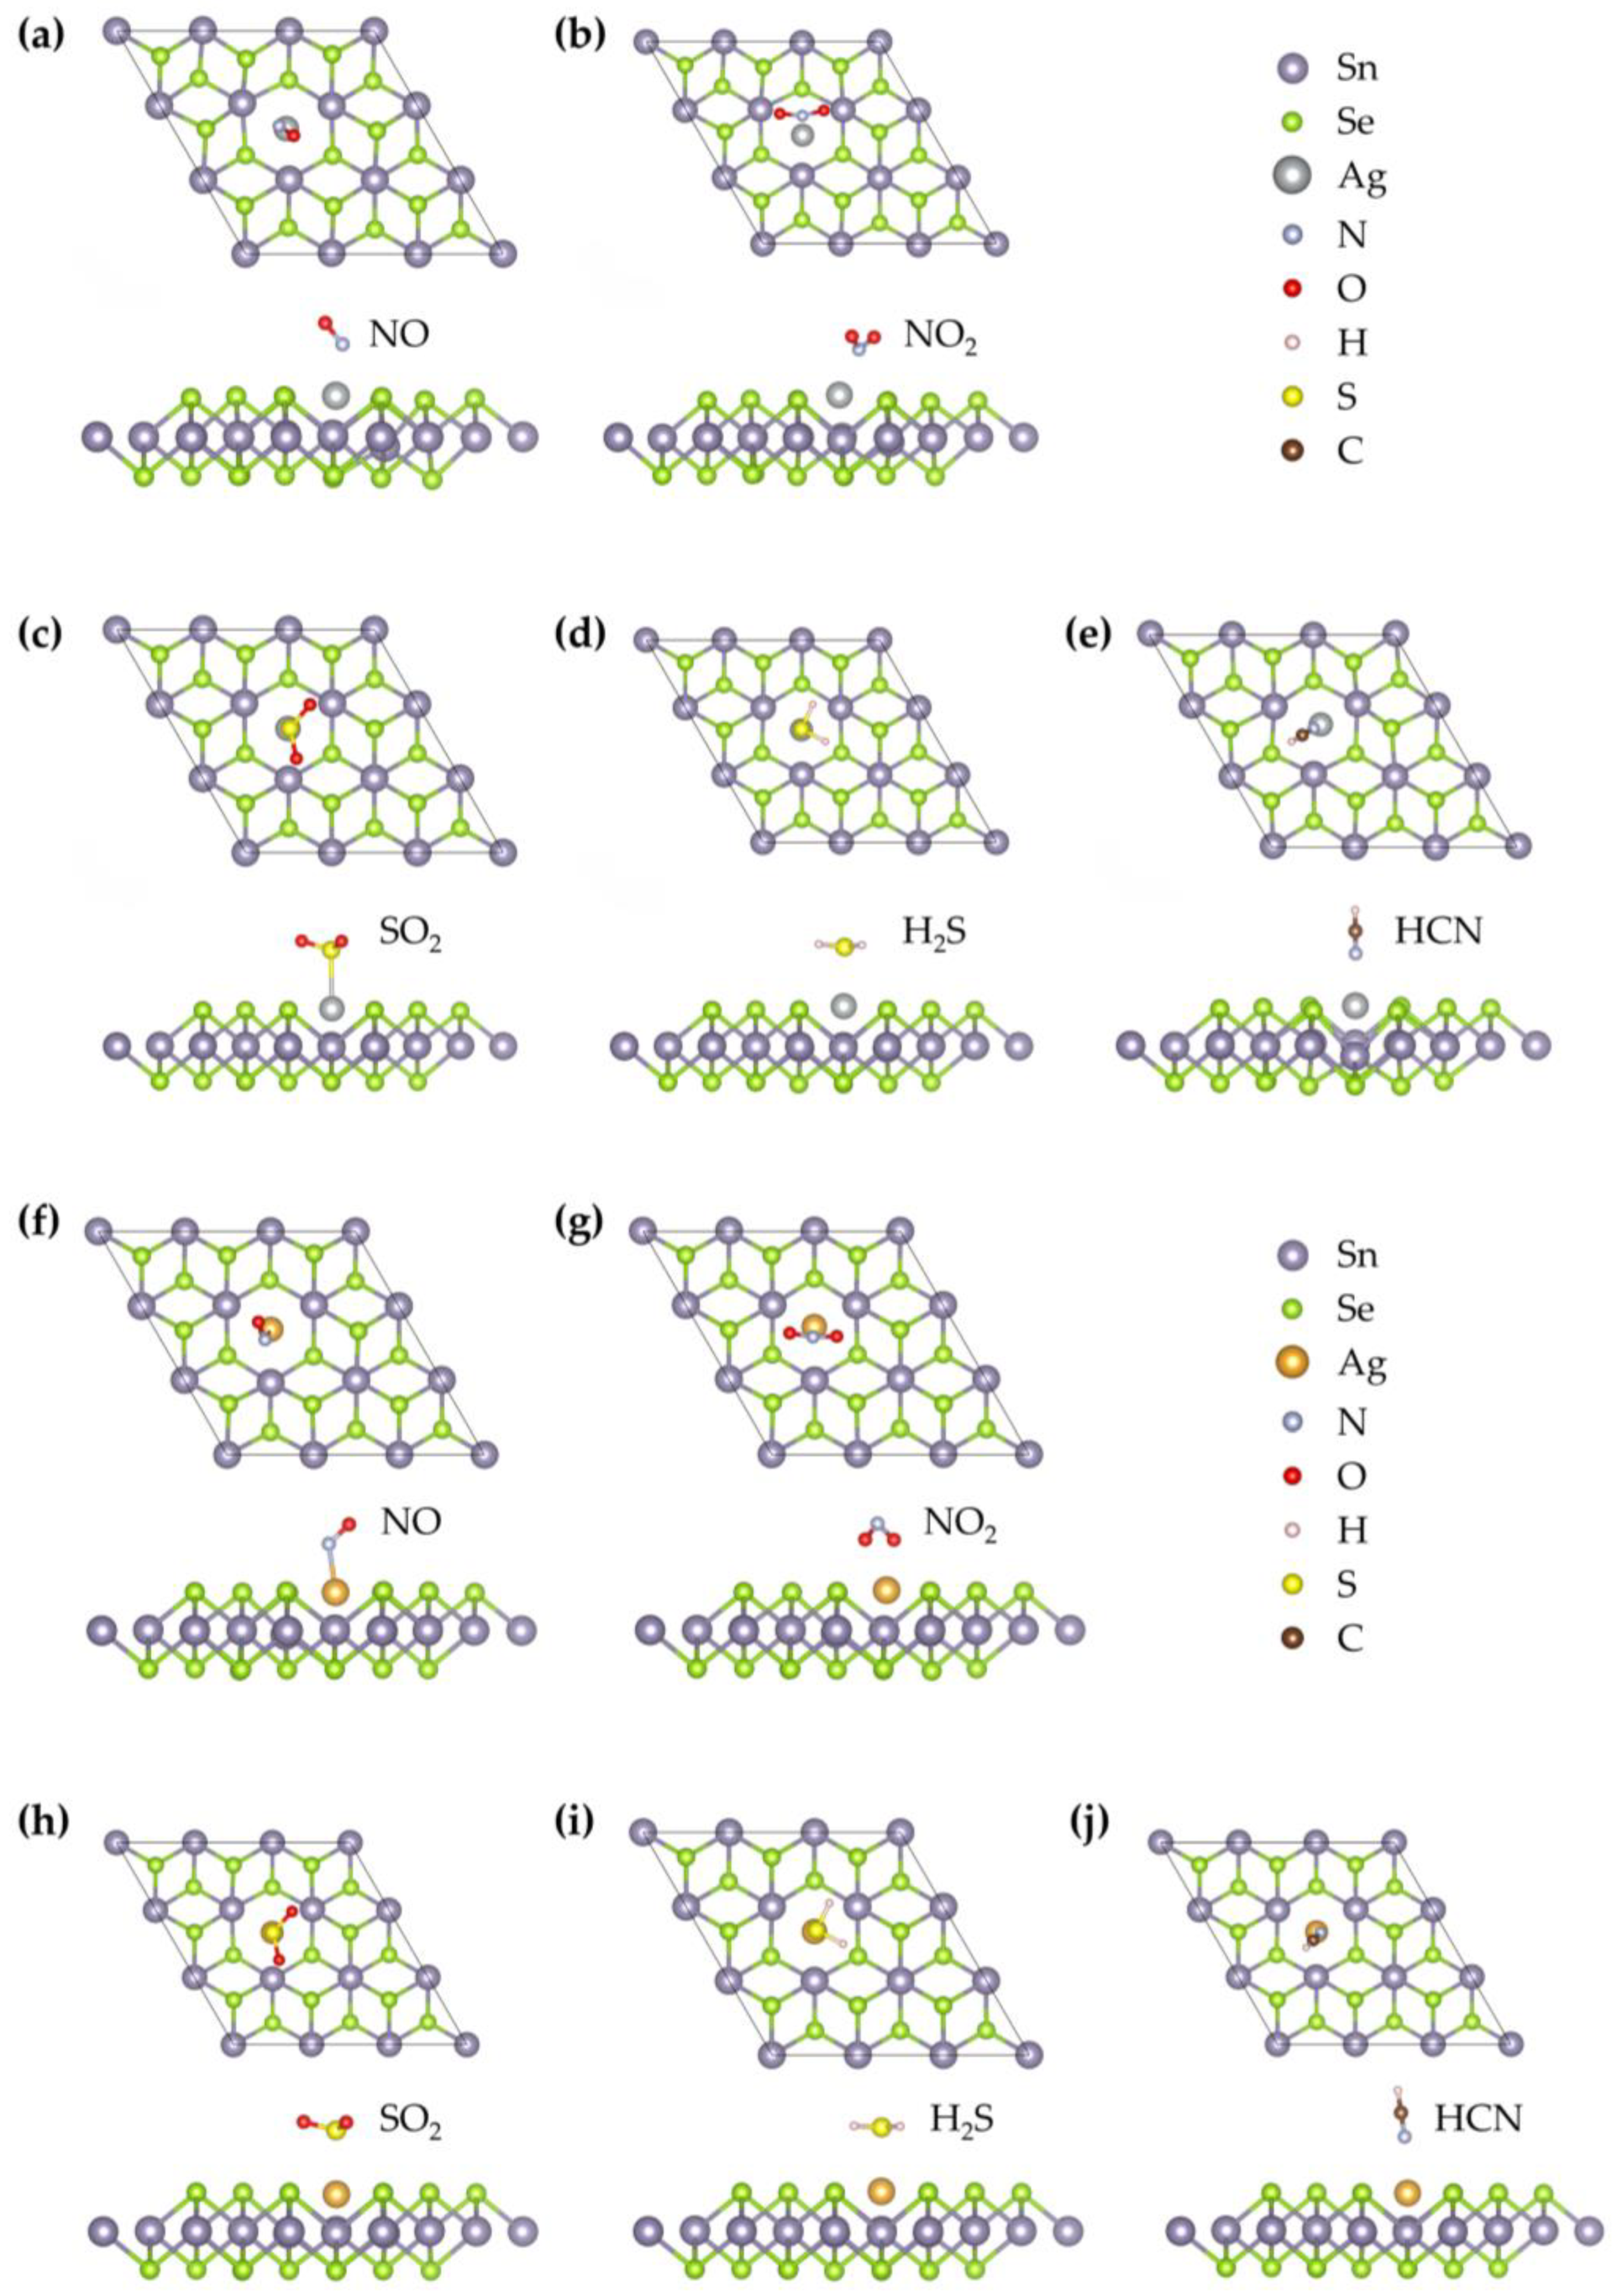
2 monolayers, focusing on adsorption sites near the Ag or Au atoms. The most stable configurations for each gas molecule are depicted in
Figure 3, corresponding to the Ag- and Au-doped systems, respectively. Upon doping, the optimized bond lengths of the adsorbed gas molecules (NO, NO
2, SO
2, H
2S, and HCN) varied depending on the dopant. For the Ag–SnSe
2 system, the bond lengths were 1.176 Å (NO), 1.237 Å (NO
2), 1.453 Å (SO
2), 1.157 Å (H
2S), and 1.075 Å (HCN). For the Au–SnSe
2 system, they were 1.179 Å (NO), 1.264 Å (NO
2), 1.454 Å (SO
2), 1.352 Å (H
2S), and 1.075 Å (HCN), respectively. These changes suggest varying degrees of interaction between the gas molecules and the doped surfaces.
The key adsorption parameters for the five gases on Ag–SnSe
2 and Au–SnSe
2 are summarized in
Table 2. To better understand the sensing behavior, we computed the
, equilibrium height (the vertical distance between the gas molecule and the monolayer), and charge transfer between the gas molecules and the substrate.
is a critical parameter that reflects the interaction strength between the gas molecule and the surface. A negative adsorption energy indicates a thermodynamically favorable process. In our results, all five gases (NO, NO
2, SO
2, H
2S, and HCN) exhibited negative adsorption energies on both Ag- and Au-doped SnSe
2 surfaces, confirming spontaneous and stable adsorption. Moreover, the absolute values of the adsorption energy for most gas molecules exceeded 0.30 eV, which suggests strong adsorption and high sensing potential. Among them, NO
2 showed the most pronounced interaction with both doped substrates, indicating its potential as a highly detectable target gas. These findings provide a theoretical foundation for further analyzing the gas adsorption mechanisms of NO, NO
2, SO
2, H
2S, and HCN on Ag–SnSe
2 and Au–SnSe
2 monolayers.
To distinguish physisorption from chemisorption in this study, adsorption energy, charge transfer, equilibrium distance, and electronic structure were jointly considered. Adsorption energy serves as a primary quantitative indicator: weakly negative values ( ≤ 0.5 eV) typically correspond to physisorption dominated by van der Waals forces, while larger negative values ( > 0.5 eV) suggest chemisorption with stronger covalent or ionic interactions. Charge transfer between the adsorbate and substrate was quantified using Bader or Mulliken analysis, where minimal transfer ( ≤ 0.05 e) indicates physisorption and significant transfer ( > 0.1 e) correlates with chemisorption. The equilibrium distance between the molecule and substrate also provides insight, with larger distances (>2.5 Å) indicating physisorption and shorter distances (<2.2–2.3 Å) suggesting chemical bonding. Finally, total and projected density of states (DOS/PDOS) analyses were used to evaluate orbital interactions; physisorption usually induces minor orbital shifts and weak overlap without new states near the Fermi level, whereas chemisorption is often accompanied by strong orbital hybridization, formation of new states, and significant electronic structure changes. By combining these criteria, NO and NO2 adsorption on noble metal-doped SnSe2 is generally classified as chemisorption due to their larger adsorption energies and moderate charge transfer, while H2S and HCN adsorption exhibits low adsorption energies, minimal charge transfer, and weak orbital overlap, indicating physisorption.
3.2.1. NO Adsorption
As shown in
Figure 3, the optimized stable configuration of NO on the Ag–SnSe
2 monolayer corresponds to a tilted, nearly parallel orientation above the Ag atom. The N–O bond length of a free NO molecule is 1.15 Å, and adsorption slightly elongates this bond by about 0.026 Å, indicating a minor weakening of the N–O bond. The equilibrium distance between the NO molecule and the substrate is 2.104 Å, and the adsorption energy is −0.29 eV. According to commonly adopted criteria, adsorption energies below about −0.5 eV, charge transfers less than 0.2 e, and molecule–surface distances larger than 2 Å are generally indicative of physisorption. Consistently, Bader charge analysis shows that only ~0.14 e is transferred from NO to the Ag–SnSe
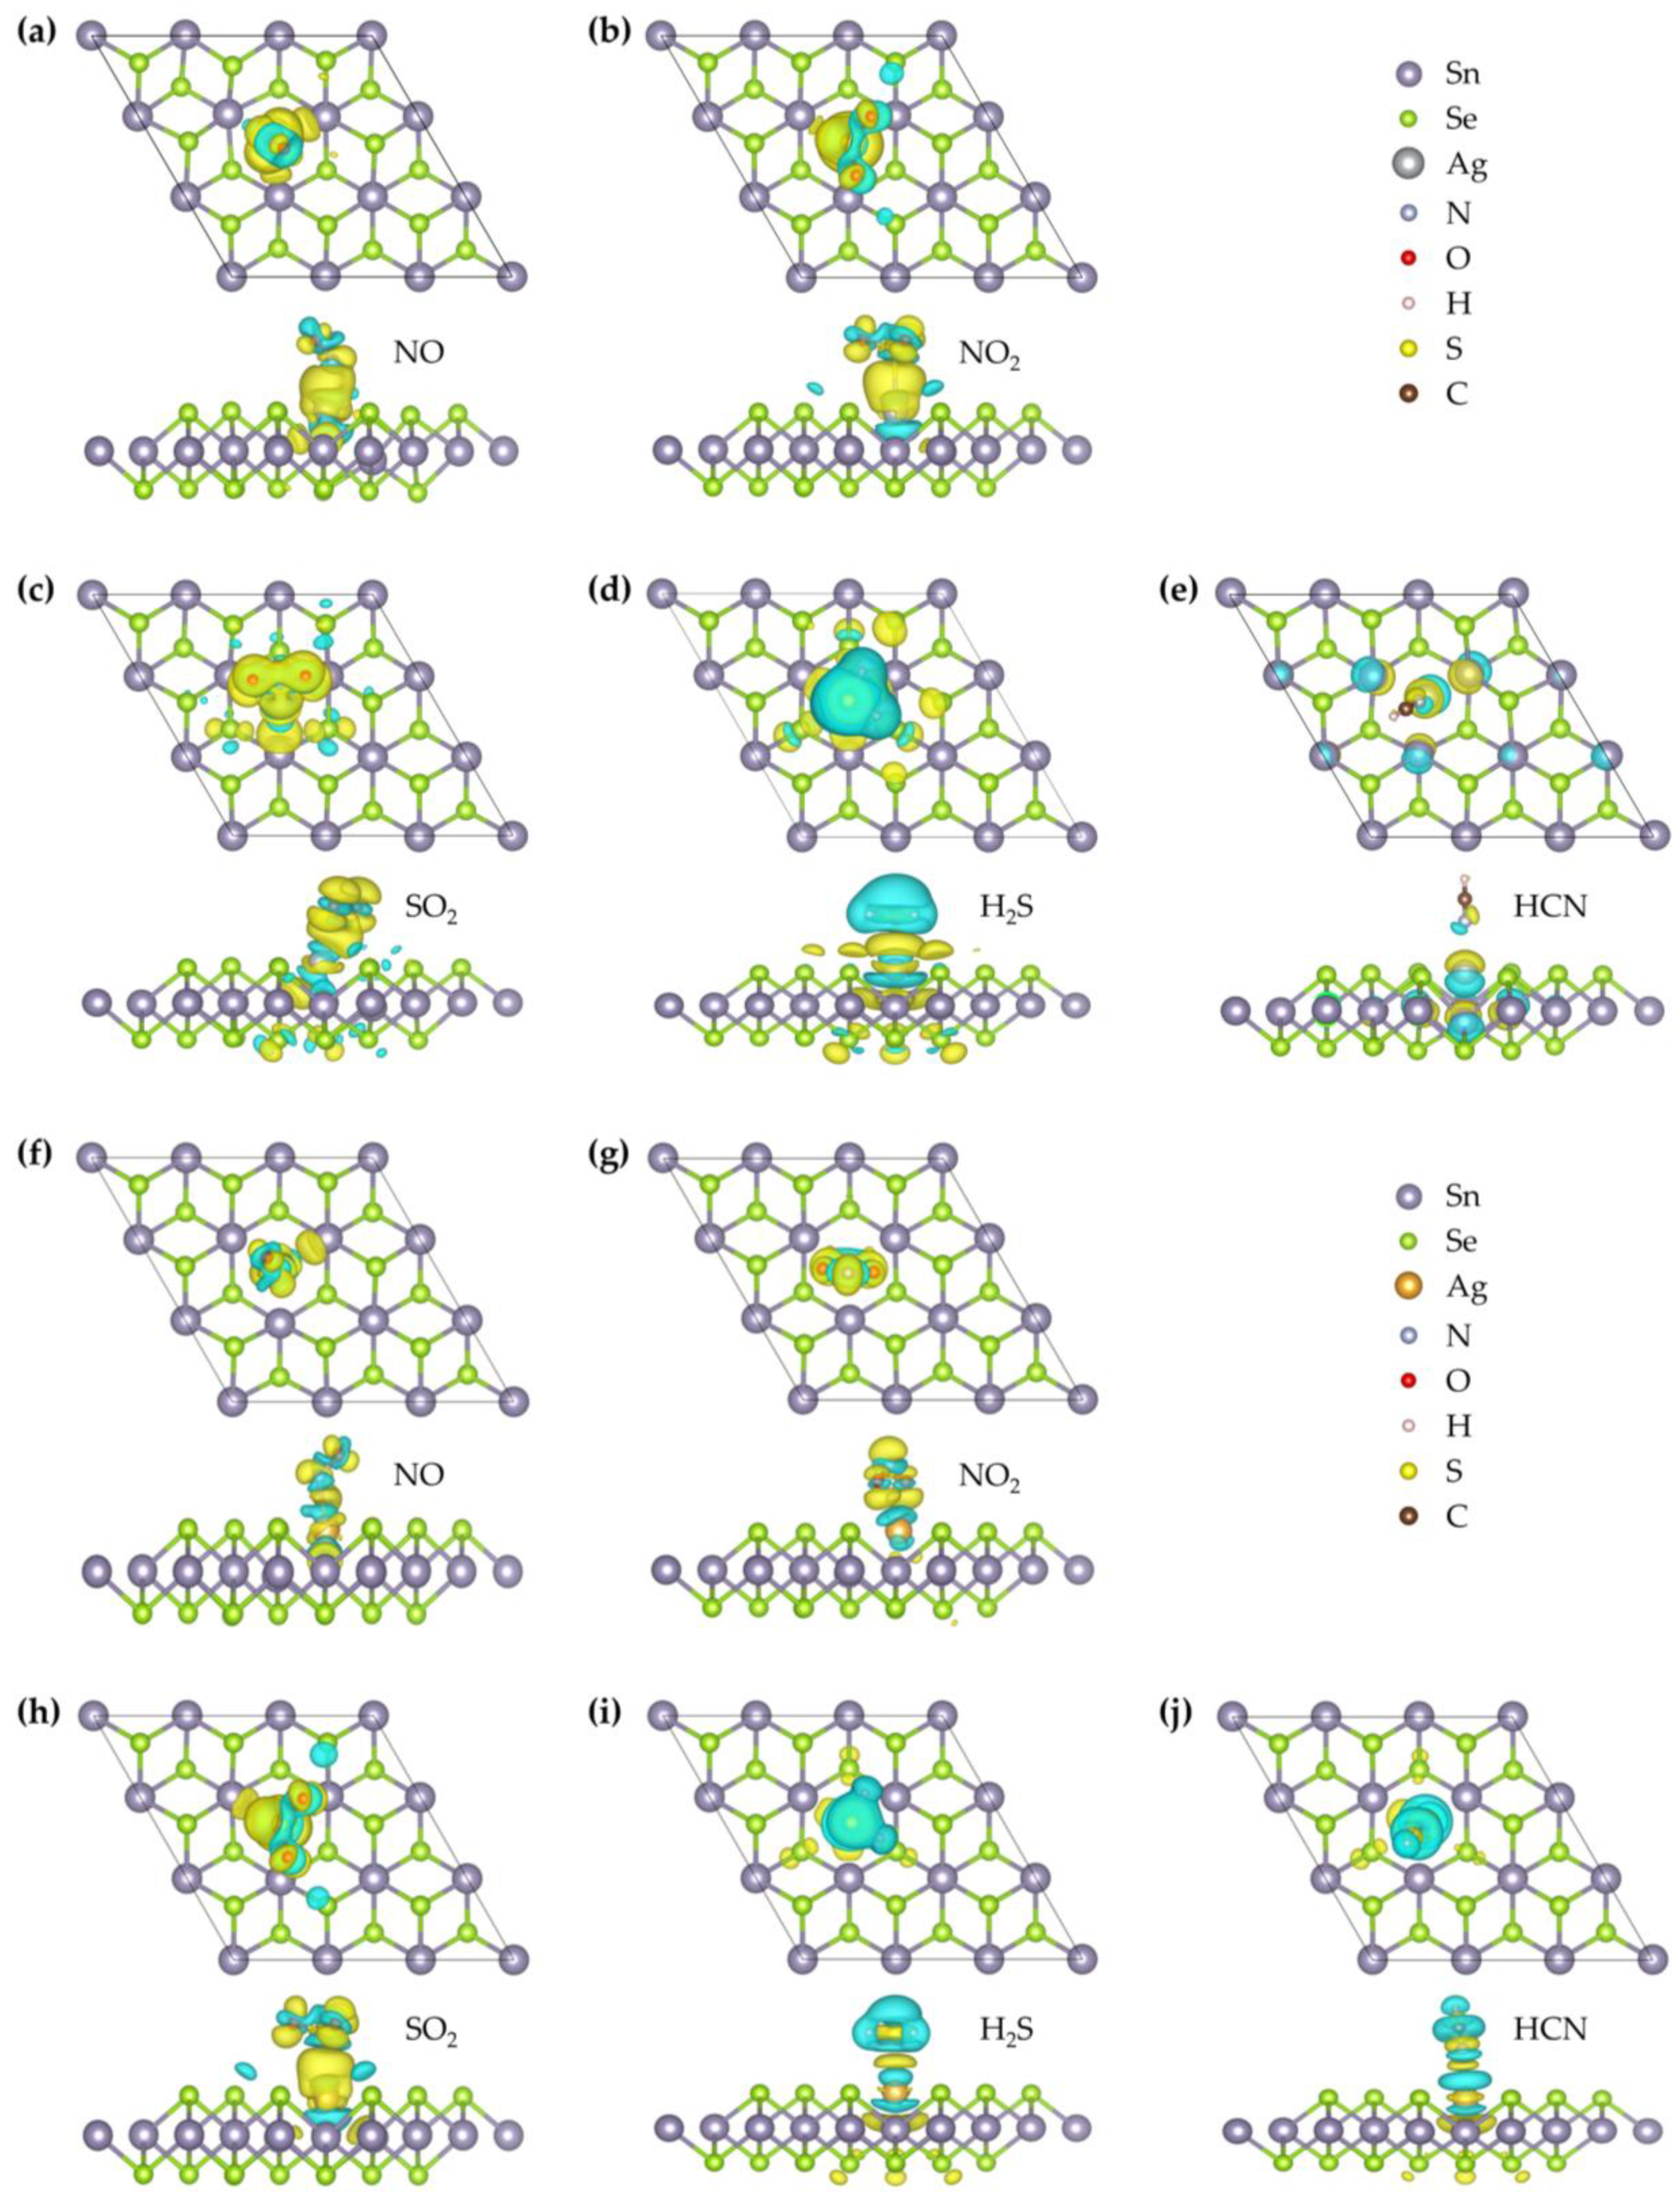
2 surface, supporting a physisorption-dominated interaction. To further examine the electronic features, the CDD and DOS were analyzed. As illustrated in
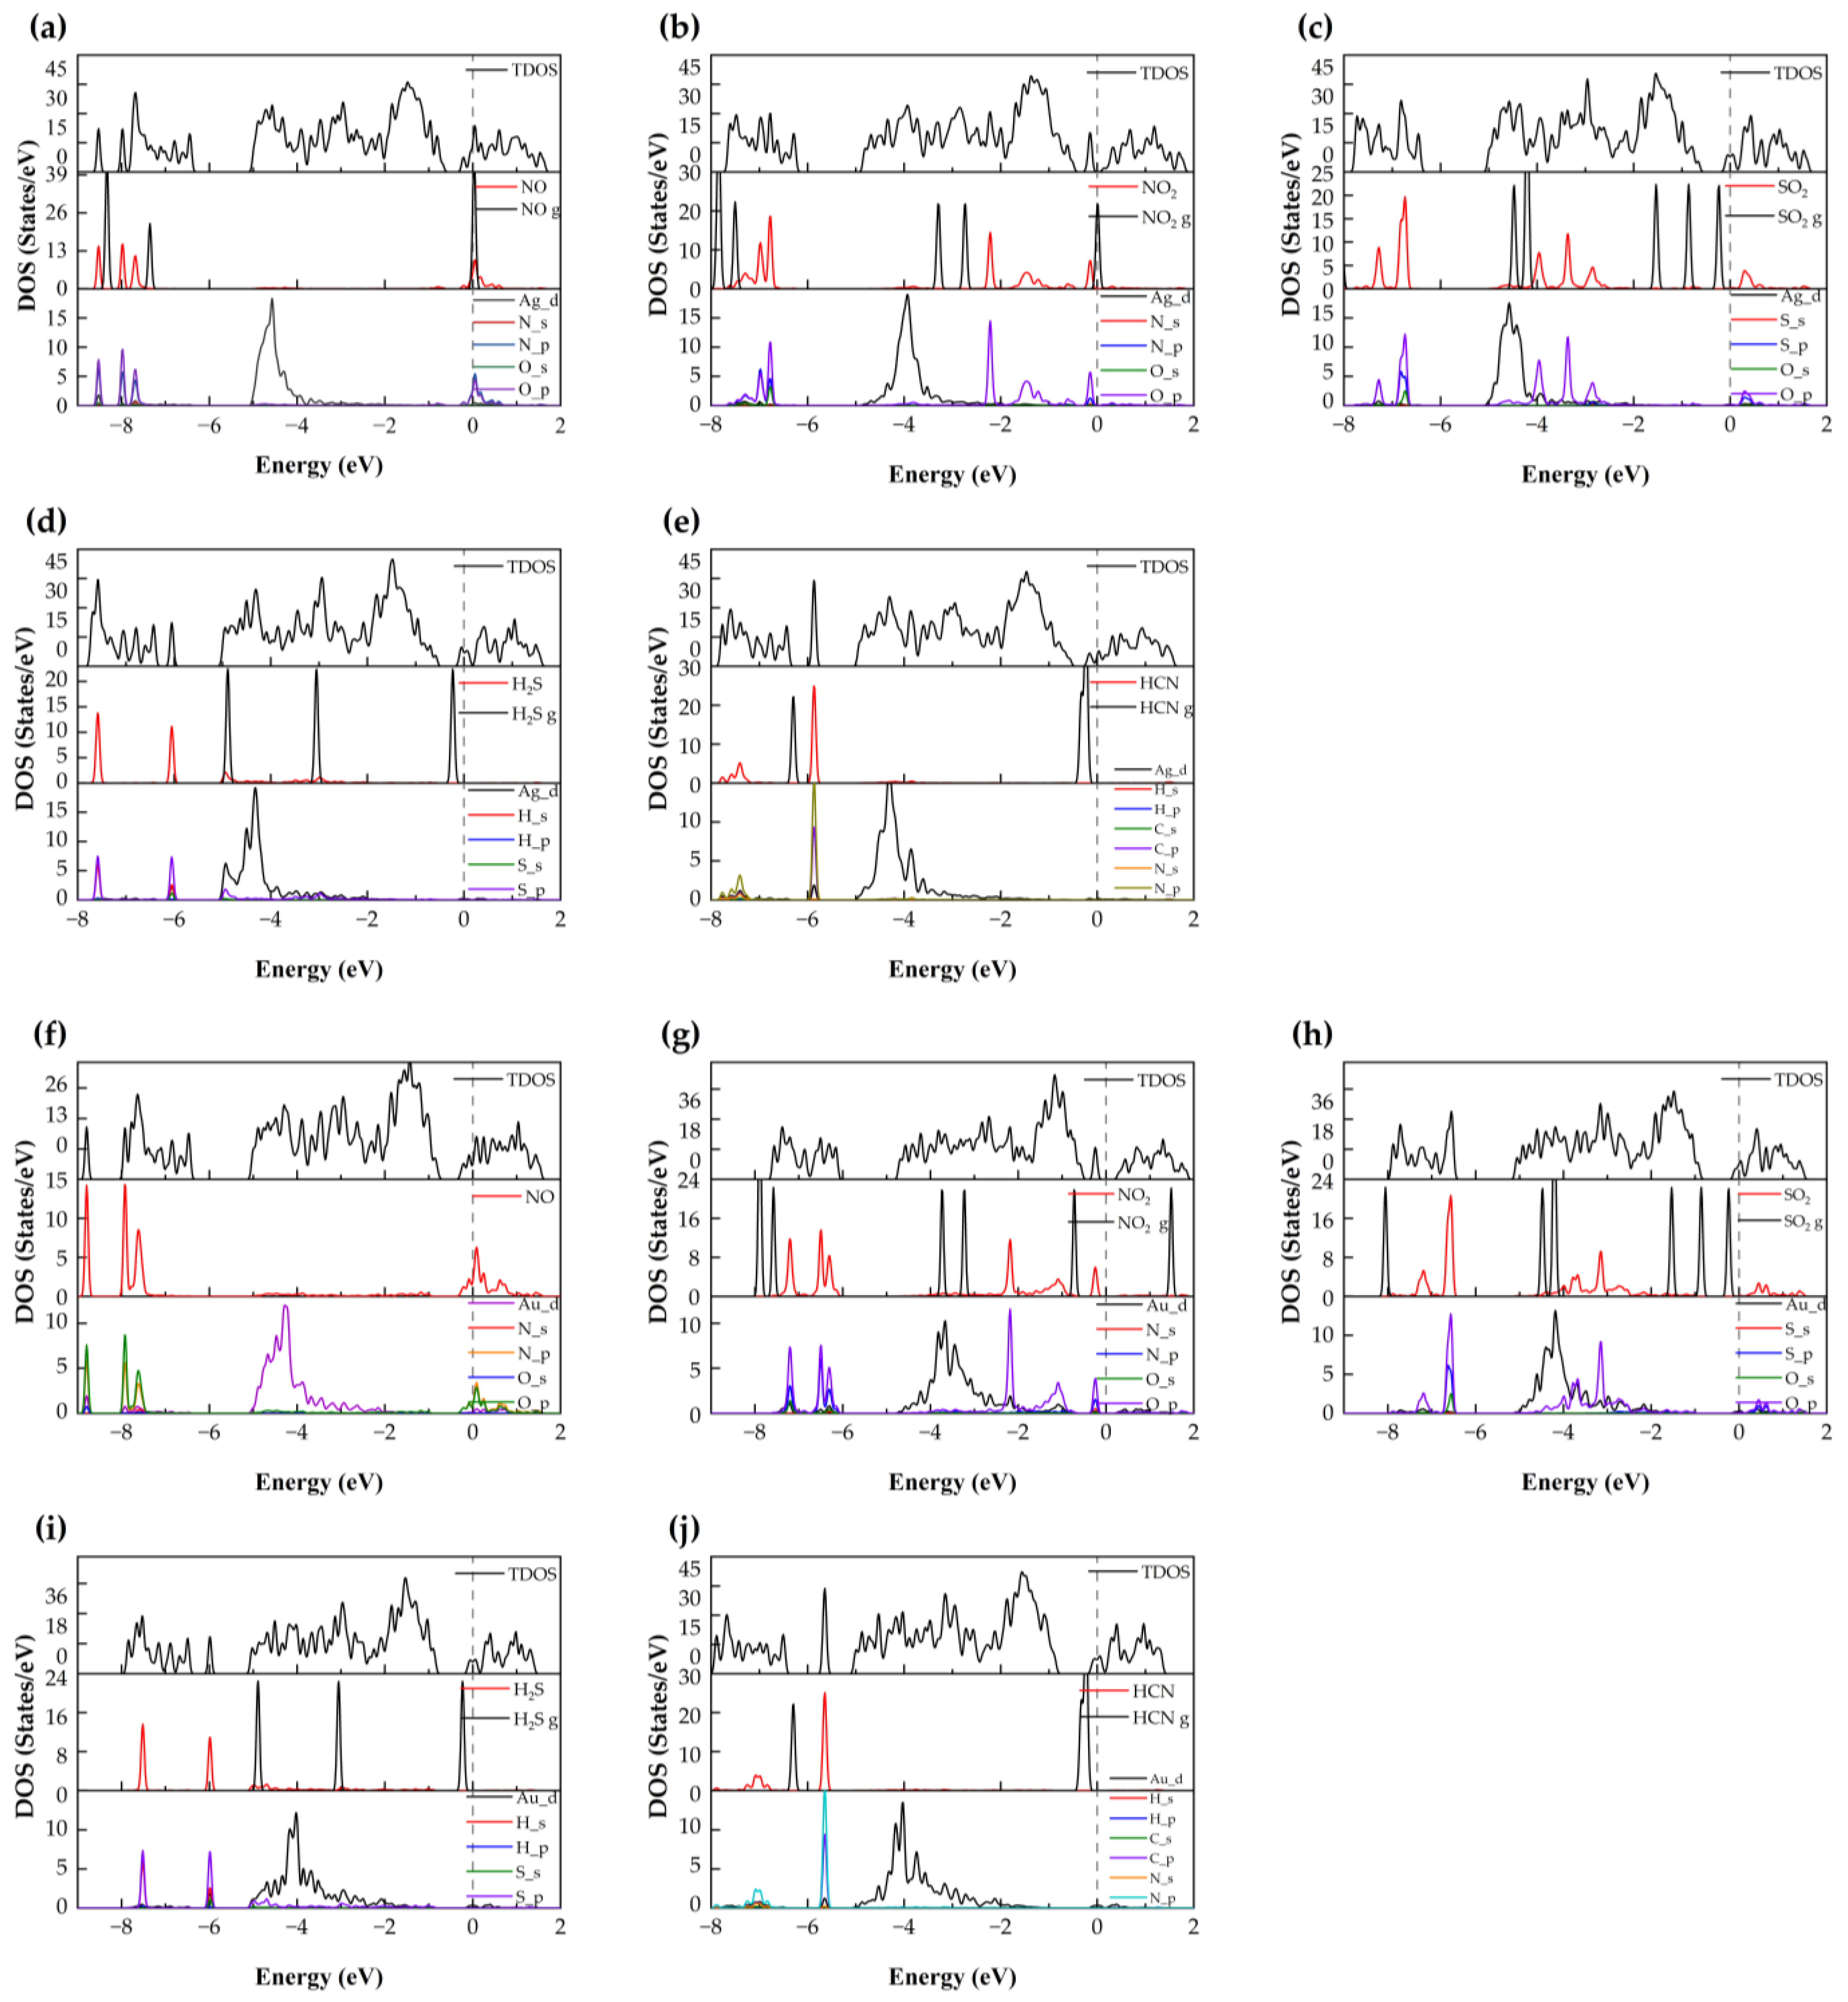
Figure 4, charge accumulation is observed between the N atom of NO and the Ag atom, and slight orbital overlaps between Ag-4d, N-2p, and O-2p states occur at around −8.53 eV, −7.97 eV, and −7.68 eV (
Figure 5). However, no distinct new states emerge near the Fermi level, and the metallic nature of the doped system remains unchanged. These results suggest that although limited orbital hybridization exists, the overall interaction between NO and the Ag–SnSe
2 monolayer is weak and primarily governed by physisorption, which may still induce detectable but moderate modulation of the electronic properties relevant for sensing applications.
As shown in
Figure 3, the most stable configuration of NO adsorption on the Au–SnSe
2 monolayer corresponds to a tilted orientation of the molecule relative to the surface. The bond length of a free NO molecule is 1.151 Å, which slightly elongates by about 0.028 Å upon adsorption, suggesting a minor weakening of the N–O bond. The equilibrium distance between the NO molecule and the substrate is 2.092 Å, and the calculated adsorption energy is −0.37 eV. Although this value is larger in magnitude than that for NO adsorption on Ag–SnSe
2, it still lies near the boundary between weak chemisorption and strong physisorption. To further probe the interaction mechanism, we analyzed the CDD, Bader charge transfer, and DOS. As shown in
Figure 4, charge accumulation is observed around the NO molecule, while charge depletion occurs around the neighboring Au atom, indicating electron redistribution between the adsorbate and substrate. Bader analysis reveals that approximately 0.171 e is transferred from the substrate to the NO molecule, implying a modest degree of charge transfer. The TDOS and projected density of states (PDOS) results (
Figure 5) confirm that the metallic nature of the doped system is preserved after adsorption. The molecular orbitals of NO shift slightly toward lower energies, with overlapping features between Au-5d, O-2p, and N-2p states around −8.8 eV and −7.93 eV. These hybridization signatures, together with the moderate adsorption energy and limited charge transfer, suggest that the interaction involves weak chemisorption features, while still retaining characteristics of physisorption. Overall, NO adsorption on Au–SnSe
2 exhibits an intermediate binding nature, which may influence its sensing performance by providing detectable electronic perturbations without strongly immobilizing the molecule.
3.2.2. NO2 Adsorption
As summarized in
Table 2, the adsorption energy of NO
2 on the Ag–SnSe
2 monolayer is calculated to be −1.03 eV, indicating a strong interaction that is characteristic of chemisorption. This result contrasts with previous reports on pristine SnSe
2, where Cheng et al. obtained an adsorption energy of only −0.29 eV for NO
2, corresponding to physisorption [
9]. The most stable configuration of NO
2 on Ag–SnSe
2 adopts a V-shaped geometry with both O atoms pointing upward, located at an equilibrium distance of 1.96 Å from the substrate. For a free NO
2 molecule, the N–O bond lengths are 1.21 Å and 1.209 Å, which increase slightly by about 0.02–0.03 Å upon adsorption, reflecting a weakening of the original N–O bonds. The charge density difference (
Figure 4) reveals a large accumulation of electrons around the NO
2 molecule, further corroborated by Bader charge analysis, which shows that approximately 0.54 e is transferred from the substrate to NO
2.
Figure 5 presents the TDOS, a comparison between the DOS of free and adsorbed NO
2, and the PDOS of the interacting system. The molecular orbitals of NO
2 shift toward lower energies upon adsorption, with distinct peaks appearing near the Fermi level. Combined with the band structure, these features indicate that the doped system undergoes a transition from metallic to semiconducting behavior. Moreover, hybridization peaks between Ag-4d and O-2p states confirm orbital interactions, supporting the conclusion that NO
2 adsorption on Ag–SnSe
2 involves strong chemisorption.
For NO
2 adsorption on the Au–SnSe
2 monolayer, structural optimization starting from a parallel orientation yields a stable configuration in which the NO
2 molecule is nearly perpendicular to the substrate, with the two O atoms located below the N atom. The N–O bond lengths elongate to 1.264 Å, and the equilibrium distance between the molecule and the surface is 2.10 Å. The differential charge density (
Figure 4) reveals significant electron accumulation around the NO
2 molecule accompanied by charge depletion around the Au atom, consistent with strong charge transfer. Bader analysis quantifies a transfer of approximately 0.654 e from the substrate to NO
2. The adsorption energy is calculated to be −1.12 eV, the largest among all studied gases, indicating highly stable adsorption. In the DOS and PDOS results (
Figure 5), the system exhibits a transition from metallic to semiconducting character after adsorption. The molecular orbitals of NO
2 shift toward lower energies, with pronounced hybridization peaks between Au-5d, N-2p, and O-2p states observed at −7.21 eV, −6.49 eV, −2.19 eV, and −0.24 eV. Compared with NO adsorption, the larger charge transfer and stronger orbital hybridization further confirm that NO
2 adsorption on Au–SnSe
2 involves chemisorption. According to the combined criteria of adsorption energy (
> 0.5 eV), charge transfer (>0.2 e), short equilibrium distance (<2.5 Å), and clear DOS hybridization, this adsorption can be reliably categorized as chemisorption.
3.2.3. SO2 Adsorption
As shown in
Figure 3, the optimized adsorption configuration of SO
2 on the Ag–SnSe
2 monolayer features the molecule aligned nearly parallel to the substrate, positioned above the Ag atom, with an equilibrium distance of 2.65 Å. The charge density difference indicates minor electron accumulation around the SO
2 molecule and between the molecule and the Ag atom. Bader charge analysis reveals that the SO
2 molecule gains only about 0.05 e from the substrate, consistent with weak charge transfer. Together with the adsorption energy (
Table 2), these results suggest that the adsorption is dominated by physisorption. The DOS and PDOS analysis further supports this conclusion: the molecular orbitals of SO
2 broaden and weaken after adsorption, mainly within −7.88 to −6.35 eV and −4.51 to −2.03 eV, while additional weak resonances appear near the conduction band edge (0.21–0.88 eV). Compared with the free SO
2 molecule, the absorption peaks near the Fermi level are diminished after adsorption. A weak hybridization feature between Ag-4d and O-2p states is observed around −4.88 to −3.83 eV, indicating limited orbital overlap. Overall, based on adsorption energy (<−0.5 eV), minimal charge transfer, and a relatively large equilibrium distance, the SO
2 adsorption on Ag–SnSe
2 can be reliably classified as physisorption, although the slight orbital hybridization may still influence sensing response.
After structural relaxation, the SO
2 molecule adopts a tilted V-shaped configuration above the Au–SnSe
2 monolayer with an equilibrium distance of 2.657 Å. The S–O bond lengths increase slightly from 1.43 Å to 1.454 Å, suggesting a small weakening of the intramolecular bonds. As shown in
Figure 4, the charge density difference indicates electron accumulation around the SO
2 molecule and the substrate surface. Bader charge analysis reveals that approximately 0.225 e is transferred from the substrate to the molecule, indicating limited charge transfer. The adsorption energy of −0.15 eV further supports that the interaction is dominated by physisorption. To better understand the electronic influence of adsorption, the TDOS and PDOS were analyzed (
Figure 5). Compared with the free molecule, the orbitals of adsorbed SO
2 shift toward lower energies, and the sharp peaks are slightly reduced, indicating orbital broadening. Weak hybridization features involving Au-d, S-p, and O-p states are observed near −7.72 eV, −6.56 eV, and −5.20 to −0.89 eV. Overall, the low adsorption energy, small charge transfer, and relatively large adsorption distance consistently indicate that SO
2 adsorption on Au–SnSe
2 is physisorption with only minor orbital interactions.
3.2.4. H2S Adsorption
After structural optimization, the H
2S molecule stably adsorbs above the Ag atom on the Ag–SnSe
2 monolayer at an equilibrium distance of 2.61 Å, with its molecular plane nearly parallel to the substrate. The H–S bond lengths slightly shorten to 1.352 Å and 1.353 Å, indicating minimal intramolecular changes. The adsorption energy is calculated to be −0.57 eV, suggesting a stronger interaction than that of NO, but still indicative of weak chemisorption or strong physisorption. The charge density difference (
Figure 4) shows electron depletion around the H
2S molecule and accumulation in the Ag–SnSe
2 substrate. Bader analysis quantifies a charge transfer of approximately 0.16 e from the H
2S molecule to the substrate. TDOS and PDOS analysis (
Figure 5) indicates that the molecular orbitals of H
2S shift slightly toward lower energies upon adsorption, with peaks appearing at −7.85 to −7.45 eV and −6.25 to −5.86 eV, contributing modestly to the total density of states. Weak orbital hybridization between Ag-d and S-p states is observed, consistent with limited electronic interaction. Overall, based on adsorption energy, charge transfer, and equilibrium distance, H
2S adsorption on Ag–SnSe
2 can be categorized as weak chemisorption or strong physisorption.
After structural optimization, the H
2S molecule adopts a parallel configuration above the Au atom on the Au–SnSe
2 monolayer, with an equilibrium distance of 2.66 Å. The S–H bond lengths remain nearly unchanged at 1.352 Å. The adsorption energy is calculated to be −0.41 eV, indicating a weak interaction between H
2S and the substrate. Charge density difference analysis (
Figure 5) shows electron depletion around the H
2S molecule, with a Bader charge transfer of only 0.041 e from the molecule to the substrate. TDOS analysis indicates negligible changes near the Fermi level after adsorption. Comparing the DOS of free and adsorbed H
2S molecules, the molecular orbitals shift slightly to lower energies, and peak intensities are reduced. Weak overlap between H-p and S-p orbitals is observed at −7.52 eV and −5.99 eV, suggesting minimal orbital hybridization. Taken together, the low adsorption energy, minimal charge transfer, and minor orbital interactions indicate that H
2S adsorption on Au–SnSe
2 is physisorption.
3.2.5. HCN Adsorption
After optimization, the HCN molecule adsorbs on the Ag–SnSe
2 monolayer with the molecule tilted toward the nearby Se atom and positioned above the Ag atom at an equilibrium distance of 2.24 Å, as shown in
Figure 3. The adsorption energy is −0.508 eV, and Bader analysis indicates an extremely small charge transfer of 0.004 e from the HCN molecule to the substrate. The charge density difference shows minimal electron redistribution between HCN and the Ag–SnSe
2 monolayer, confirming that the interaction is very weak. TDOS and PDOS analysis (
Figure 5) reveals that the molecular orbitals of adsorbed HCN shift slightly toward lower energies compared to the free molecule, with minor overlaps observed between N-p, C-p, and Ag-d orbitals at −5.87 eV and between H-s, C-p, and N-p orbitals in the −7.94 to −7.31 eV range. Overall, the low adsorption energy, negligible charge transfer, and minimal orbital overlap indicate that HCN adsorption on Ag–SnSe
2 is dominated by physisorption.
After structural optimization, the HCN molecule adsorbs slightly tilted above the Au atom on the Au–SnSe
2 monolayer, with the N atom closest to the substrate at a distance of 2.405 Å. The C–N and C–H bond lengths are 1.159 Å and 1.076 Å, respectively, showing minor elongation compared with the free molecule. The adsorption energy is −0.23 eV, indicating very weak interaction. Charge density analysis (
Figure 4) shows minimal electron redistribution around the HCN molecule, and Mulliken analysis indicates a small charge transfer of 0.043 e from the HCN molecule to the substrate. TDOS and PDOS analyses (
Figure 5) reveal that the monolayer retains its metallic character after adsorption. The molecular orbitals of HCN shift slightly toward lower energies, and a minor localized peak appears at −5.64 eV, mainly contributed by N-p and H-p orbitals with slight contribution from Au-d orbitals, indicating weak electronic localization. Taken together, the low adsorption energy, minimal charge transfer, and limited orbital interaction confirm that HCN adsorption on Au–SnSe
2 is physisorption.
3.3. Strain Modulation of Gas Adsorption on Ag- and Au-Doped SnSe2 Monolayers
3.3.1. Effect of Biaxial Strain on Gas Sensing Performance of Ag-Doped SnSe2
To further explore the tunability of adsorption properties, we investigated the influence of external biaxial strain (
ε) on the gas adsorption behavior of the Ag-doped SnSe
2 monolayer. The applied strain is defined as:
where
and
denote the lattice constants of the unstrained and strained systems, respectively. Positive
ε corresponds to tensile strain, and negative
ε indicates compressive strain. A range of biaxial strain from –8% to +6% was applied to evaluate the modulation of equilibrium height, adsorption energy, and charge transfer for each gas molecule.
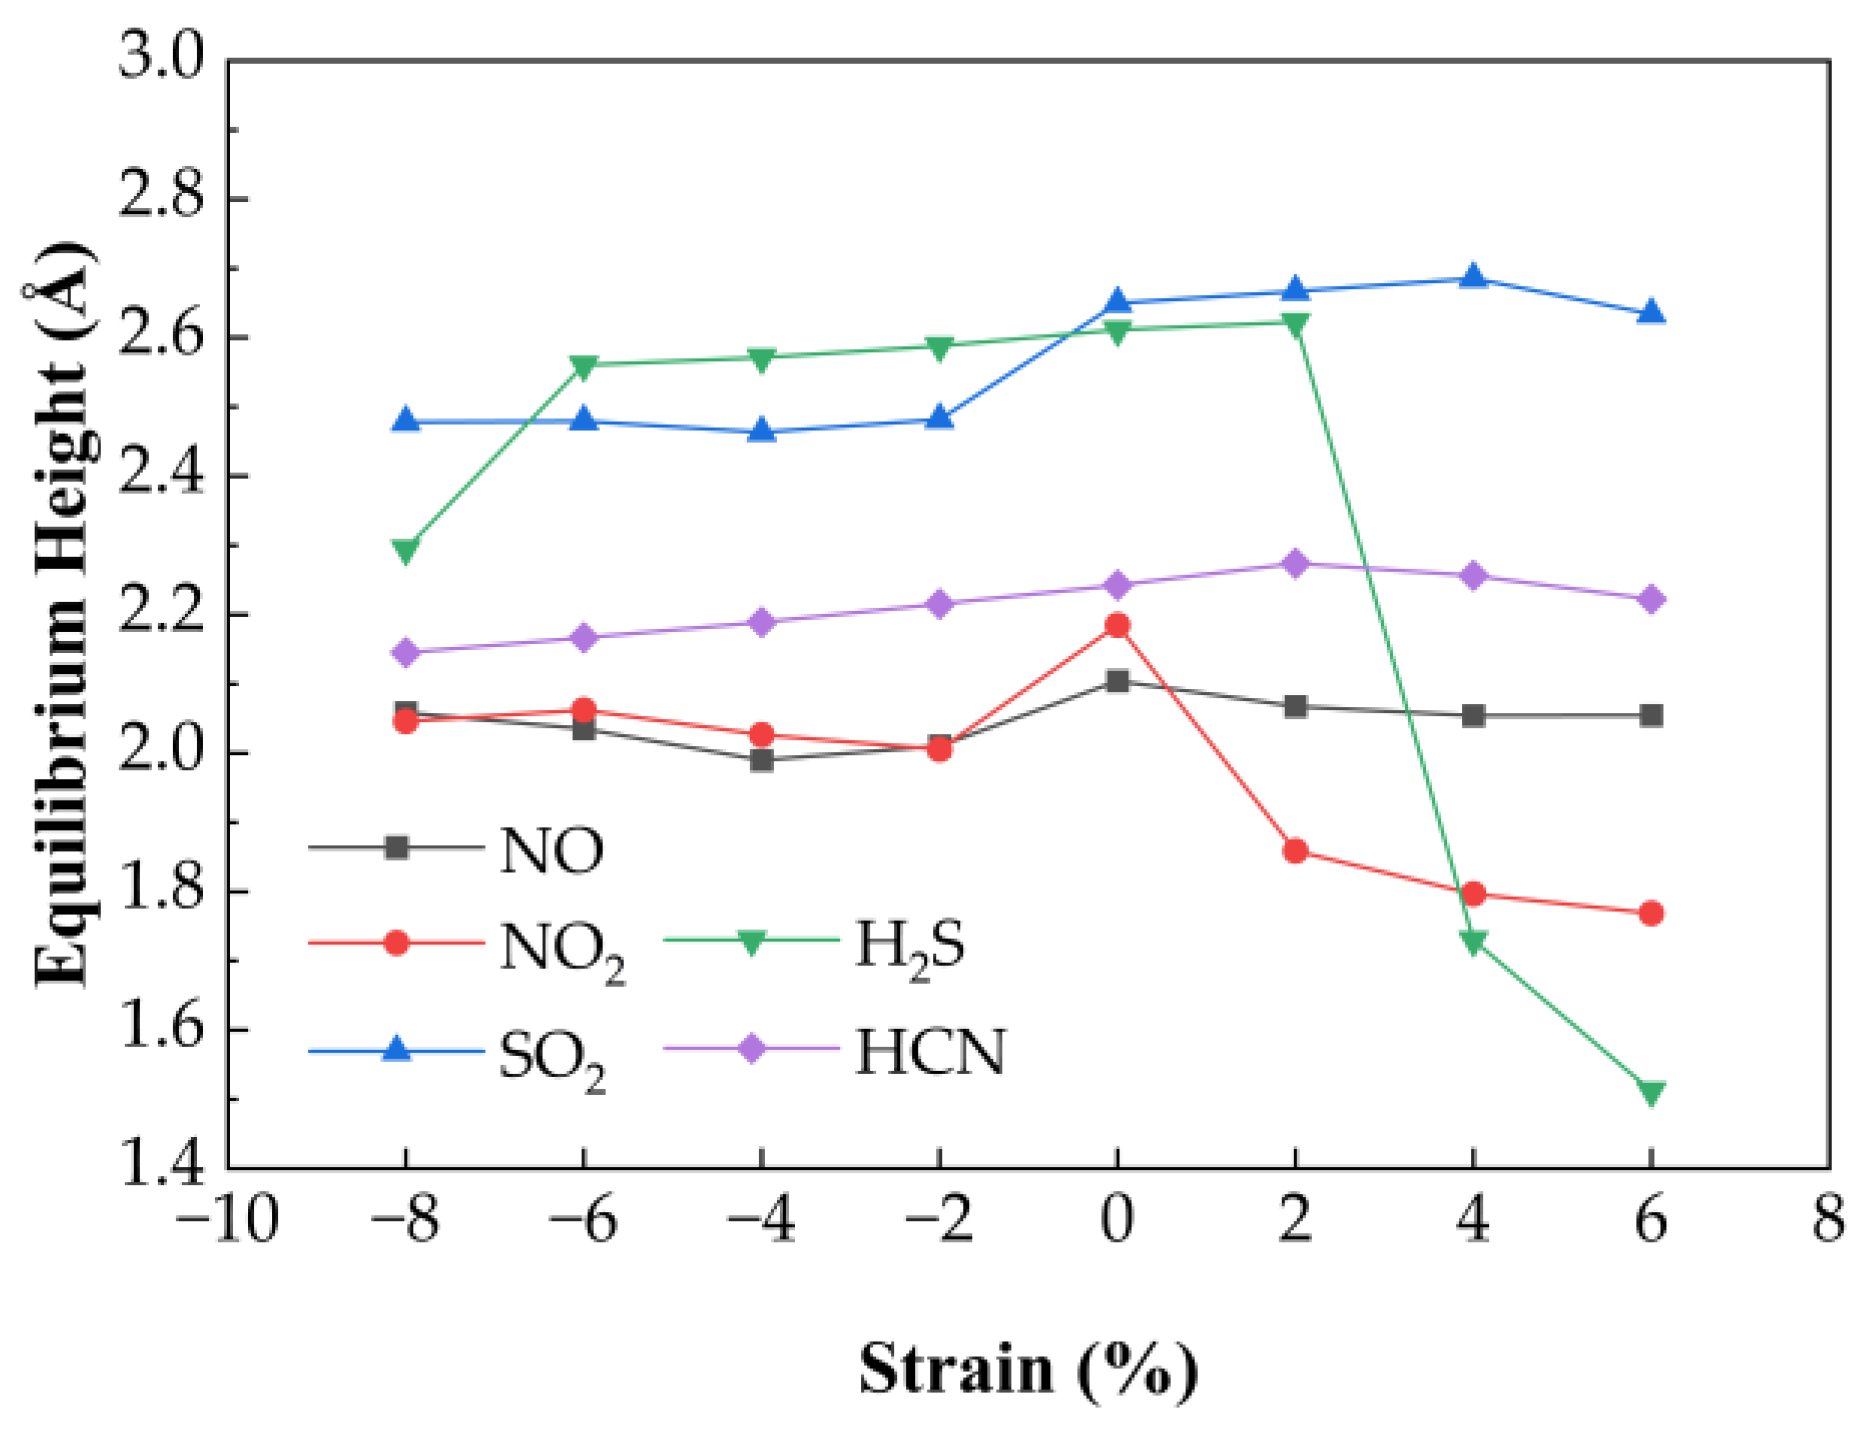
Figure 6 presents the variation in equilibrium heights for NO, NO
2, SO
2, H
2S, and HCN molecules adsorbed on Ag−SnSe
2 under different strain levels. The equilibrium heights of HCN and NO change only slightly under strain (maximum deviations of 0.03 Å and 0.08 Å, respectively). SO
2 shows a linear decrease in equilibrium height under compressive strain from −8% to −2%, while remaining relatively stable under tensile strain. In contrast, H
2S shows a more complex trend: it reaches a minimum height of 2.295 Å at −8%, increases linearly from −6% to +2%, and then drops under higher tensile strain. NO
2 equilibrium height decreases steadily with both tensile and compressive strain.
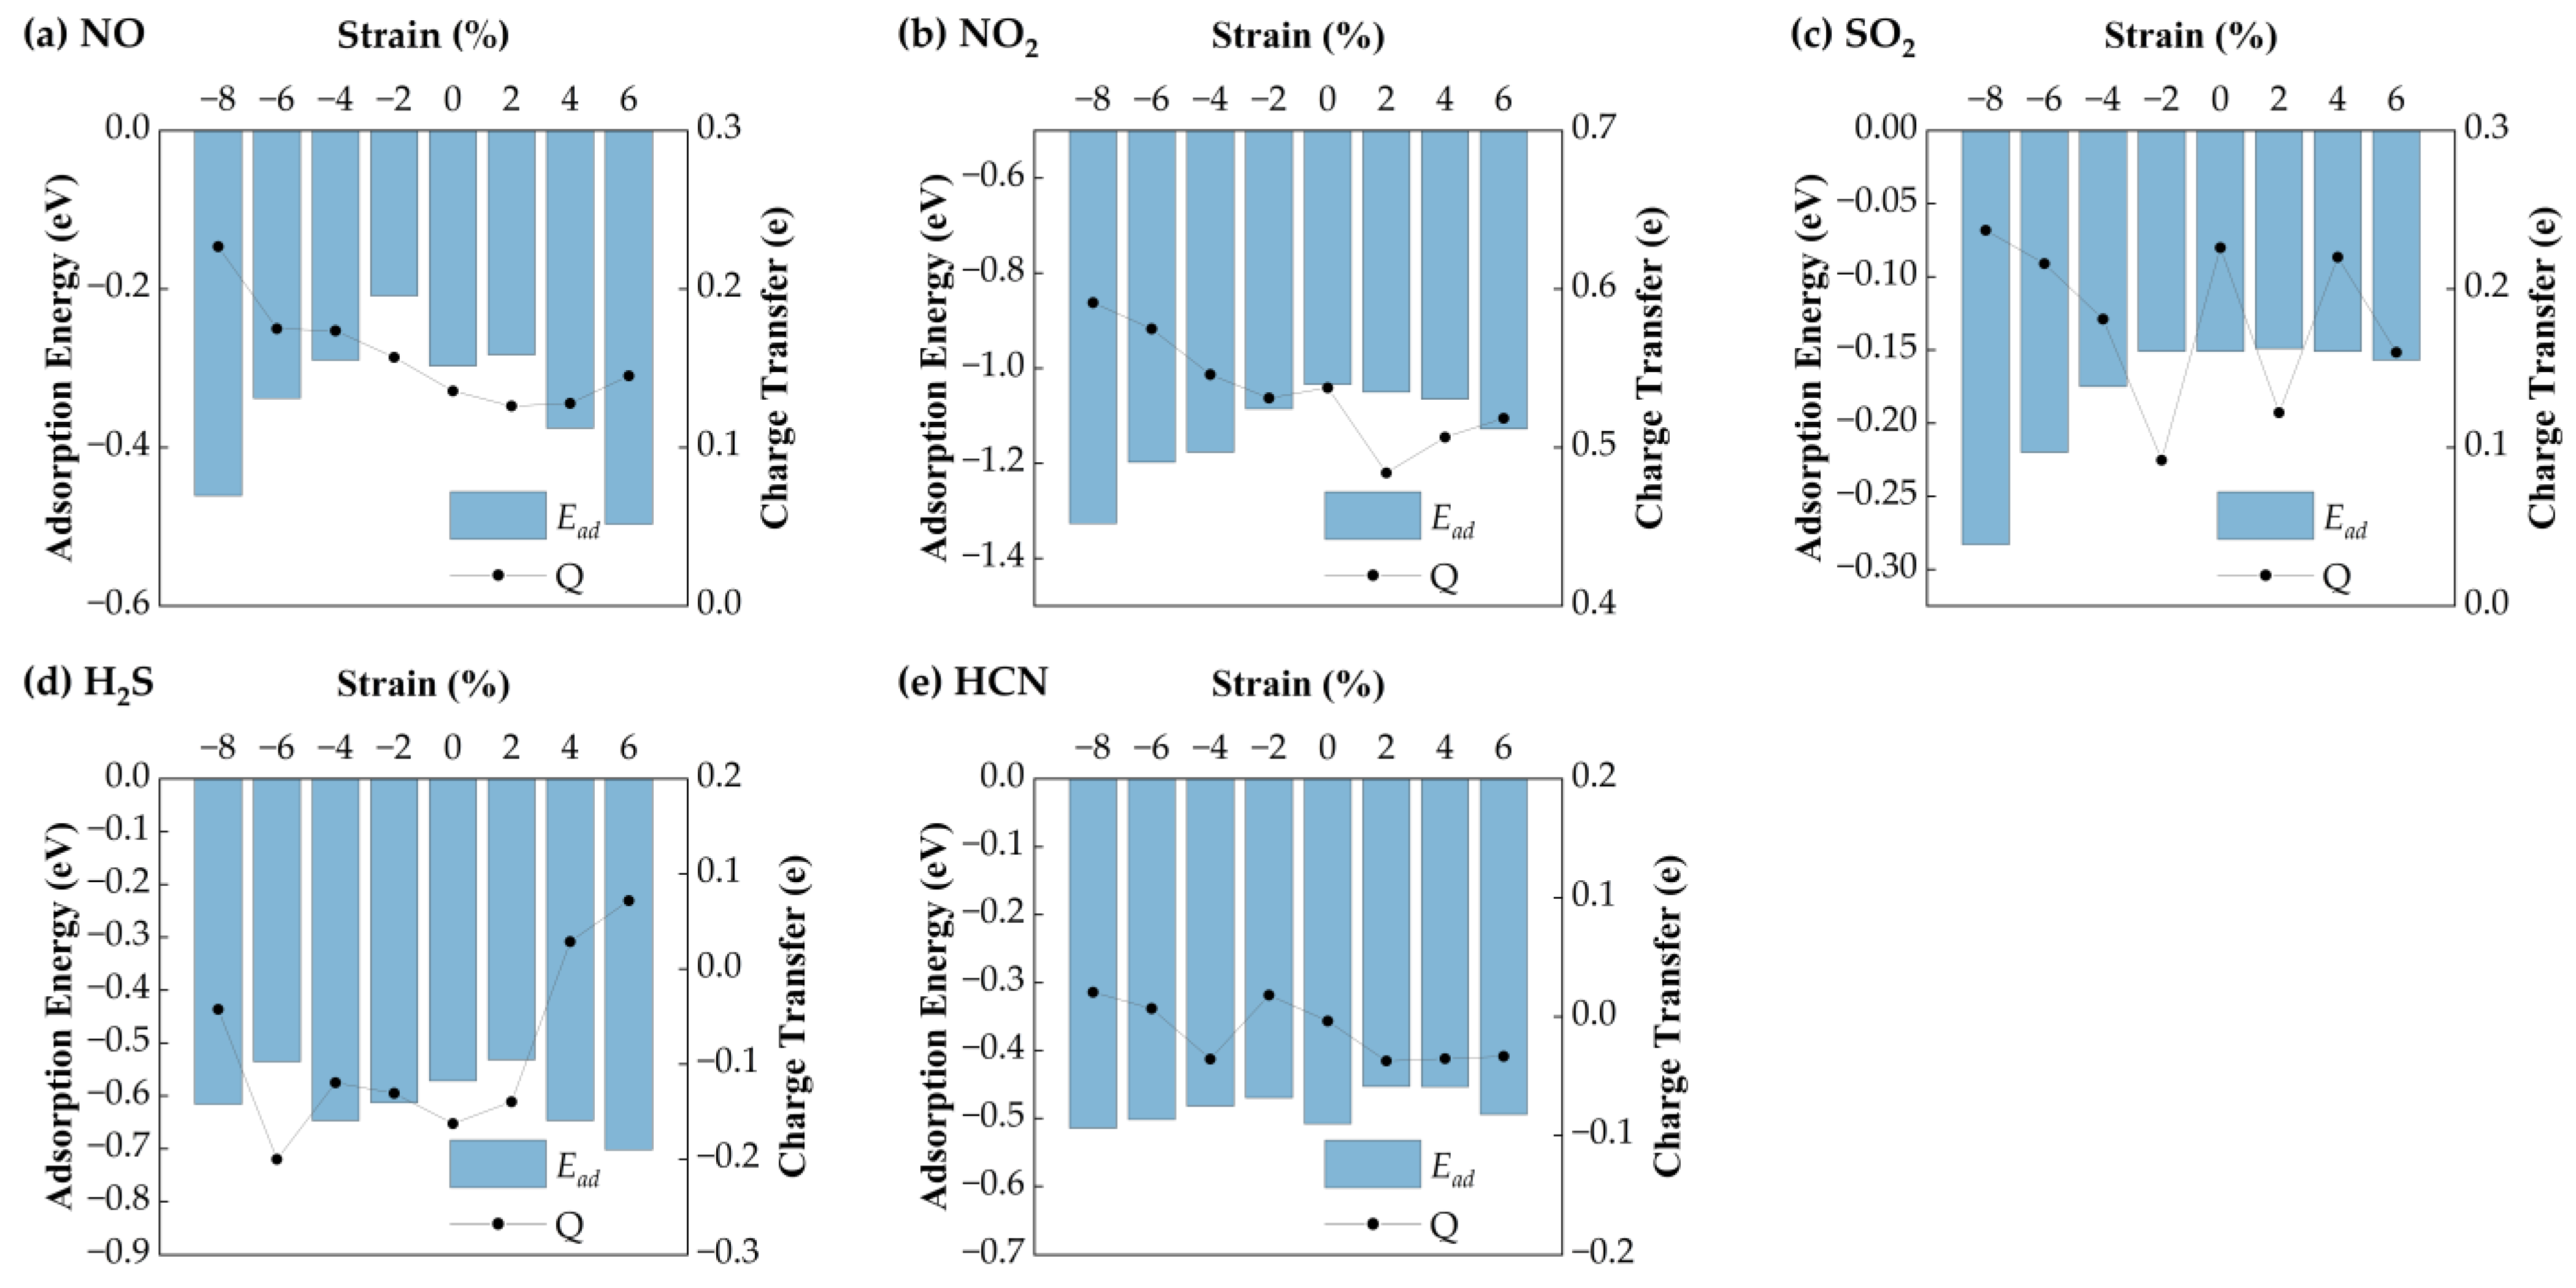
Figure 7 shows the corresponding adsorption energies under strain. For H
2S, the adsorption energy remains relatively stable (−0.57 eV), with a maximum variation of 0.11 eV, suggesting weak strain sensitivity. HCN exhibits minimal energy change (~0.05 eV), indicating that strain has little impact on its adsorption stability. In contrast, NO shows a parabolic trend: its adsorption energy increases under compressive strain (−8% to −2%) and decreases with tensile strain, reaching a minimum of −0.30 eV at 6%. NO
2 displays the strongest strain dependence, with the most favorable adsorption energy (−1.33 eV) at −8%. SO
2 also shows enhanced adsorption under compressive strain, with a minimum of −0.26 eV at −8%. Bader charge analysis reveals strain-dependent charge transfer behavior. H
2S initially loses electrons (−0.16 eV) but gains electrons under tensile strain above 2%. HCN shows a reversal: it loses charge under tension and gains under compression. NO exhibits a parabolic charge transfer curve, with the minimum (0.13 eV) at 2% strain. NO
2 shows a maximum charge transfer of 0.59 eV at −8%. SO
2 charge transfer decreases linearly under compression but fluctuates under tension.
Overall, H2S interacts more strongly with Ag-SnSe2 under tensile strain. HCN shows negligible adsorption energy and charge transfer variation, indicating low strain sensitivity. The other gases (NO, NO2, SO2) exhibit enhanced charge transfer and adsorption energy under compressive strain, suggesting that Ag-doped SnSe2 is a promising strain-tunable sensing platform for NO, NO2, SO2, and to some extent, H2S.
3.3.2. Effect of Biaxial Strain on Gas Sensing Performance of Au-Doped SnSe2
The effect of biaxial strain on the gas adsorption properties of Au-doped SnSe
2 was similarly analyzed. As shown in
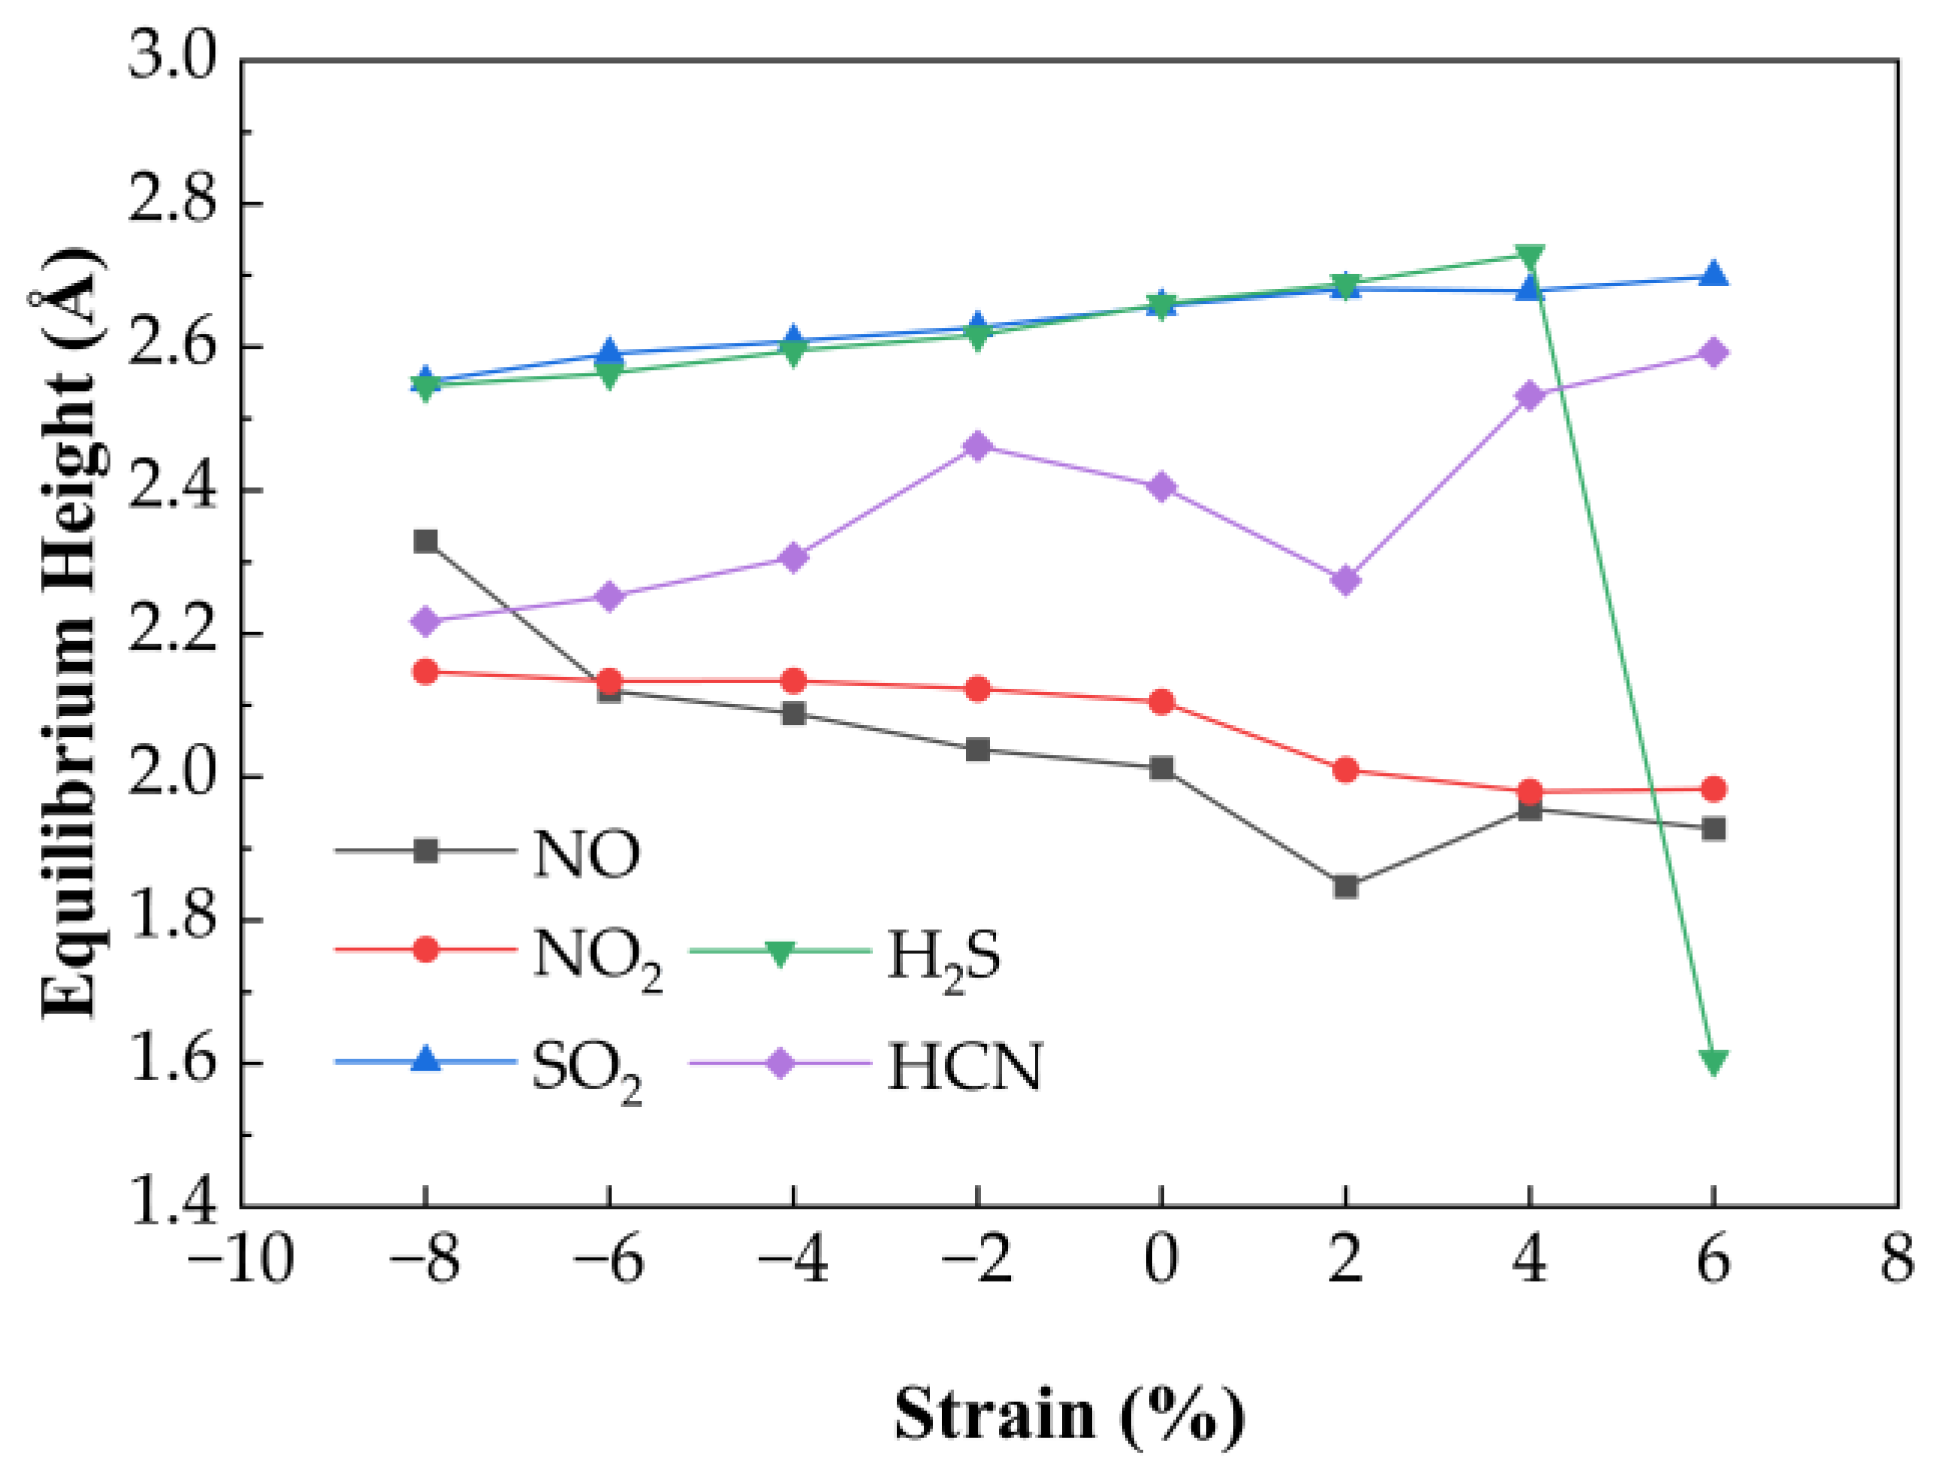
Figure 8, equilibrium heights of adsorbed gases change slightly under strain. SO
2, H
2S, and HCN show moderate increases in height under compression (−8% to 0%) by 0.04 Å, 0.03 Å, and 0.07 Å, respectively. For H
2S, the height remains ~2.62 Å under moderate strain but drops significantly to 1.61 Å at 6% tensile strain, indicating transition to chemisorption and reduced desorption capability. For NO and NO
2, equilibrium heights decrease steadily with increasing strain.
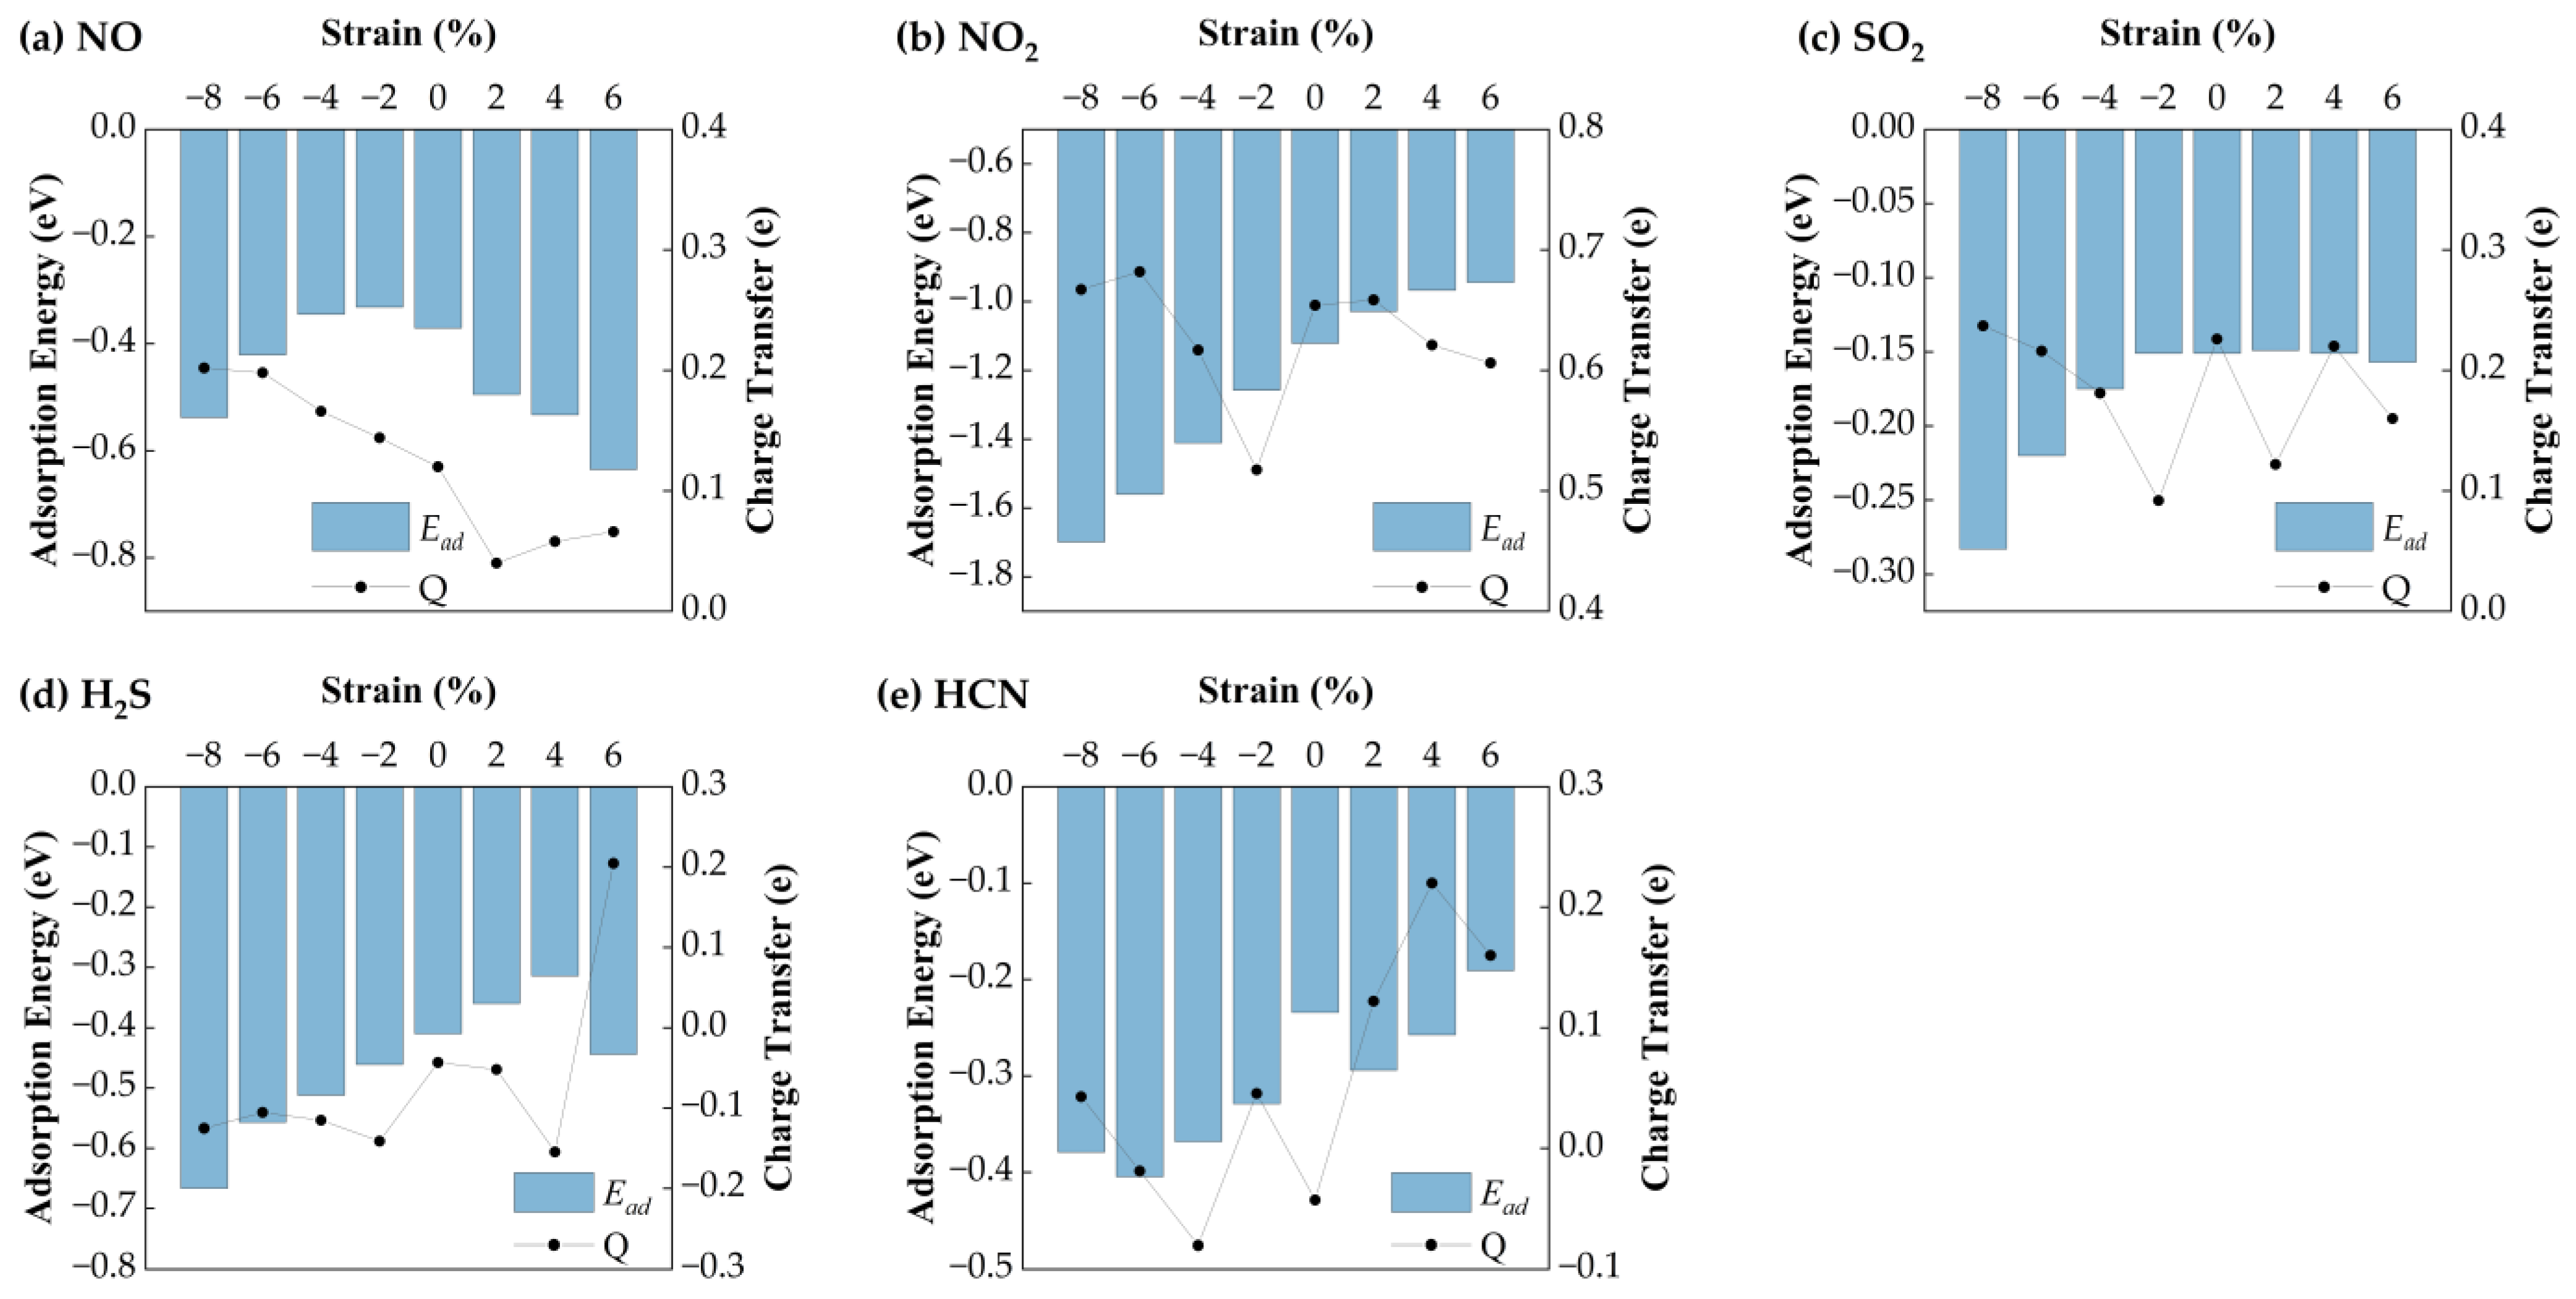
Figure 9 illustrates adsorption energies and charge transfer behavior. H
2S adsorption energy increases steadily under strain, while HCN shows maximum adsorption at −6%. NO shows a parabolic energy profile with a minimum of −0.635 eV at 6%, indicating strong binding. NO
2 exhibits the most favorable adsorption at −8% (−0.74 eV), with linear variation across the strain range. SO
2 also shows enhanced adsorption under compression, with a minimum of −0.284 eV at −8%. All systems exhibit negative adsorption energies, confirming stable physisorption over the full strain range. Charge transfer data further support these findings. H
2S transitions from electron donor to acceptor beyond 4% strain. HCN undergoes charge reversal across strain states. NO shows a decreasing-to-increasing trend across the strain range, while NO
2 behaves as a consistent electron acceptor. SO
2 shows decreasing charge transfer under compression and fluctuating values under tension.
These results suggest that Au-doped SnSe2 is a viable candidate for detecting NO, NO2, HCN, and SO2, with strain-induced modulation enhancing sensitivity, particularly under compressive strain.
3.4. Recovery Time
The working principle of semiconductor gas sensors involves electron exchange between the adsorbed gas molecules and the sensing material, resulting in changes in the electrical resistance, which is utilized for gas detection. Therefore, the sensitivity of the sensor is primarily governed by adsorption energy and charge transfer. At a fixed adsorption energy, a greater charge transfer typically enhances the sensor’s response. Moreover, the direction of charge transfer can lead to either an increase or decrease in resistance. 2D layered nanomaterials often exhibit strong interactions with gas molecules, indicating their potential for high sensitivity. However, while strong adsorption is beneficial for detection, excessively strong binding may hinder desorption, adversely affecting the recovery capability of the sensor. Hence, a high-performance gas sensing material must exhibit both sufficient adsorption strength and suitable desorption kinetics, ensuring an appropriate recovery time. Based on transition state theory, the ideal recovery time (
) can be expressed as:
where
is the attempt frequency (typically 10
12 s
−1),
is the energy barrier, taken as the absolute value of the adsorption energy
,
is the Boltzmann constant, and
is the operating temperature. We note that equating the desorption barrier directly to the adsorption energy is a commonly adopted approximation in first-principles studies of 2D gas sensors (e.g., Ref. [
8]), and it allows for a qualitative comparison of recovery trends among different gas–substrate systems. Nonetheless, we acknowledge that this approximation may overestimate recovery times because the actual desorption barrier can be affected by kinetic pathways, surface relaxation, or other dynamic effects. Therefore, the calculated recovery times should be interpreted as indicative rather than exact predictions.
At room temperature (T = 300 K),
≈ 2.585 × 10
−2 eV. As seen from the equation, recovery time increases exponentially with adsorption energy.
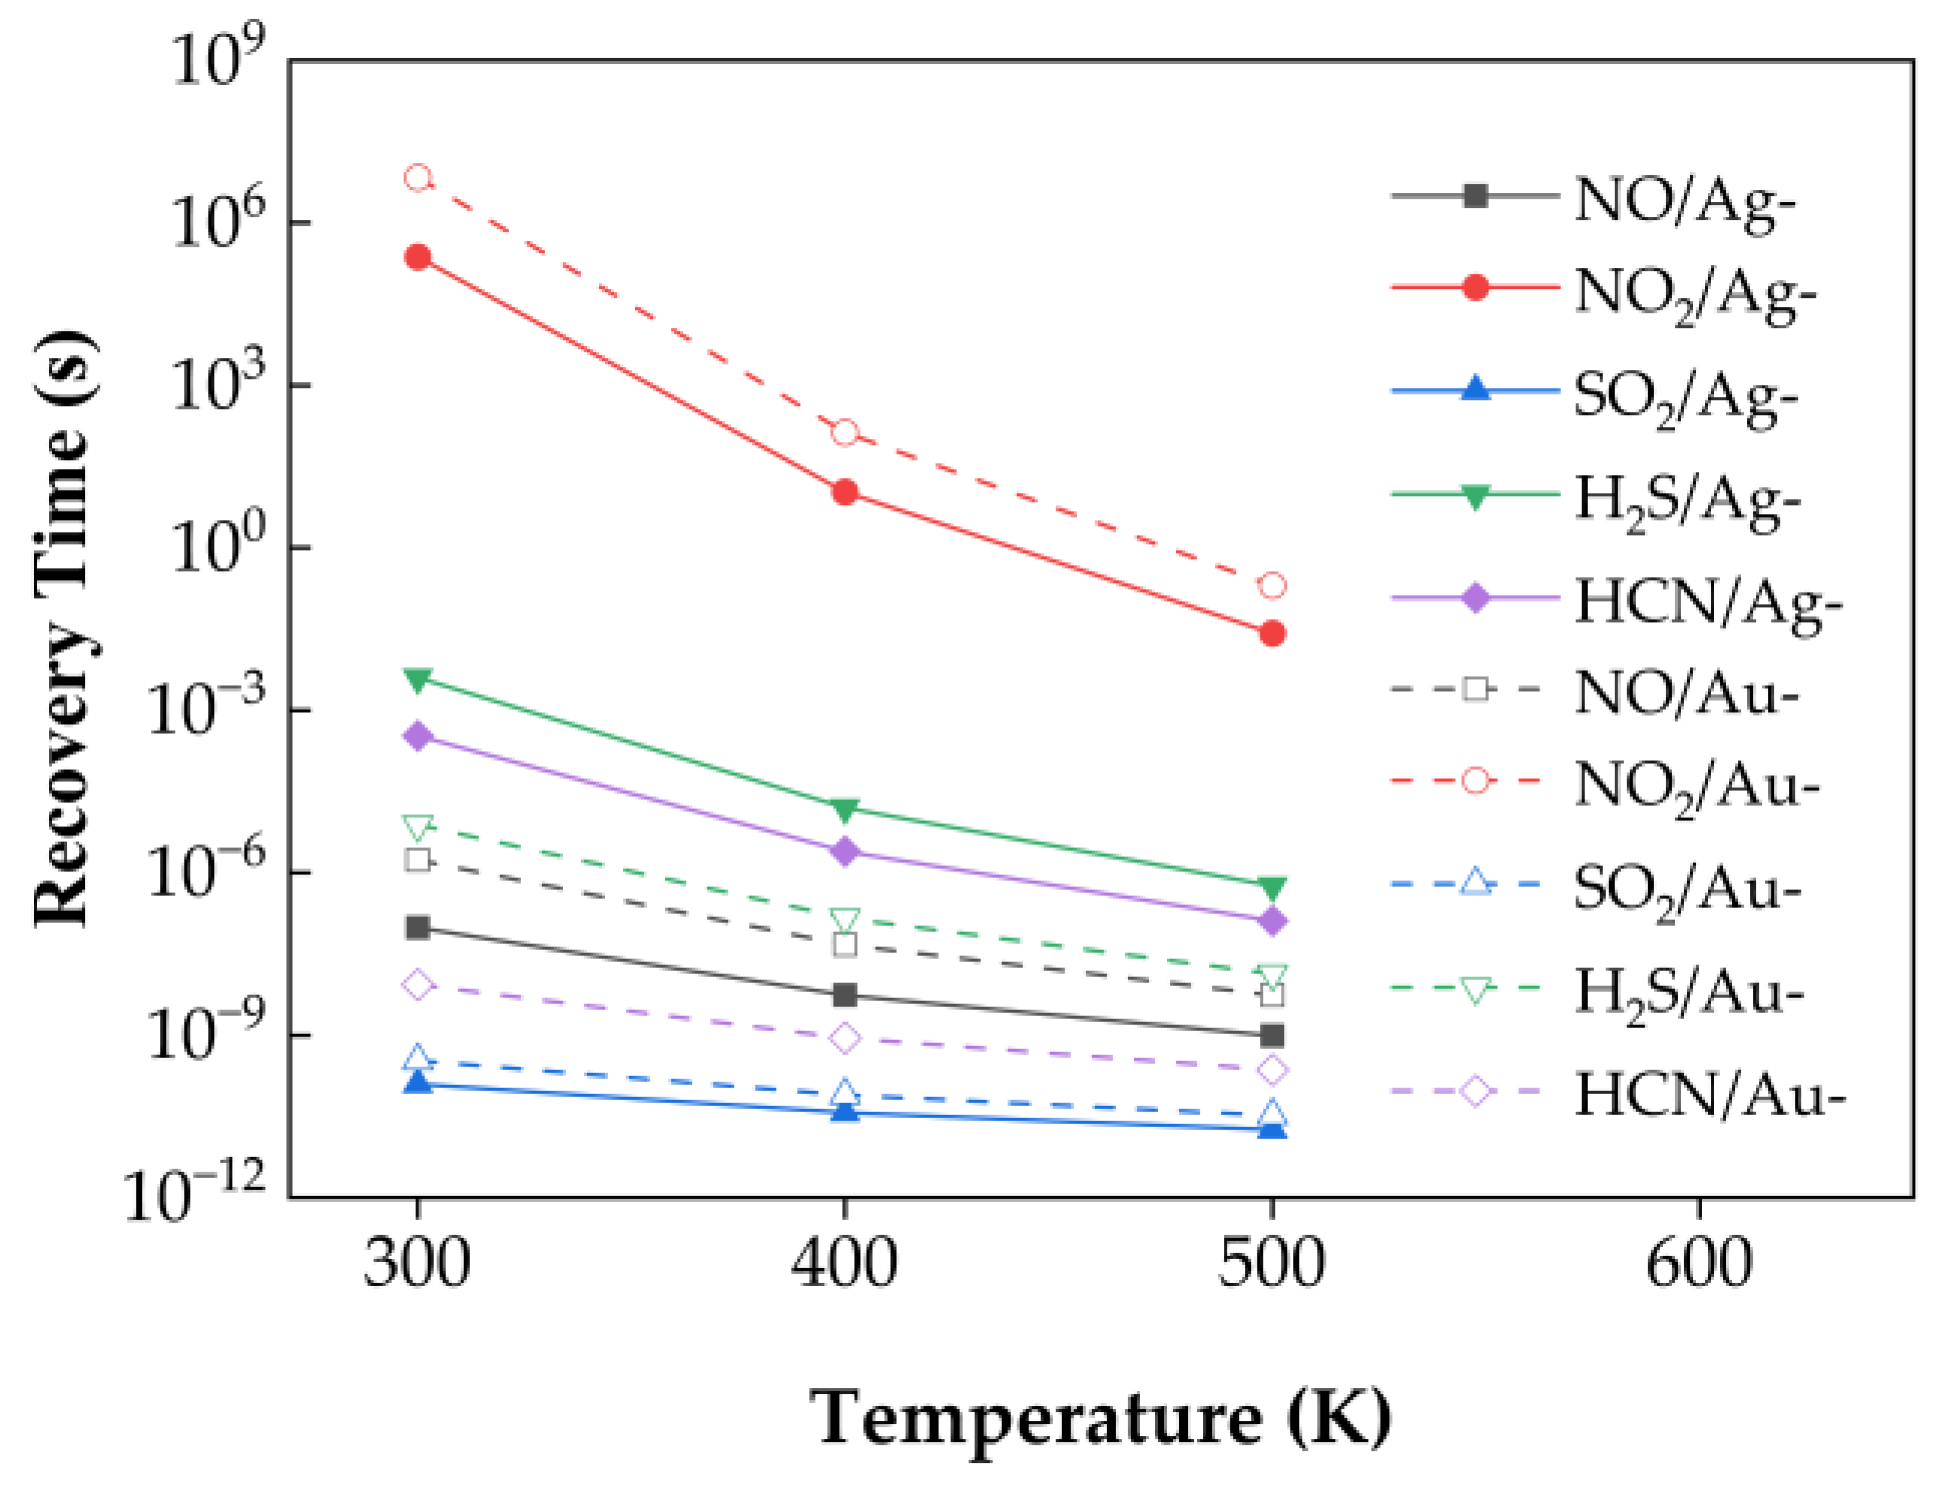
Figure 10 presents the calculated recovery times at 300 K, 400 K, and 500 K without applying external strain. At 300 K, the order of recovery time from shortest to longest is: SO
2/Ag–SnSe
2, SO
2/Au–SnSe
2, HCN/Au–SnSe
2, NO/Ag–SnSe
2, NO/Au–SnSe
2, H
2S/Au–SnSe
2, HCN/Ag–SnSe
2, H
2S/Ag–SnSe
2, NO
2/Ag–SnSe
2, and NO
2/Au–SnSe
2.
At room temperature, some calculated recovery times, particularly for NO2, appear relatively long, which may exceed the practical range for typical sensor operation (seconds to minutes). We note that these values are theoretical estimates based on transition state theory and using the adsorption energy as the desorption barrier, and they serve primarily for qualitative comparison of desorption kinetics across different gas–substrate systems. In practice, recovery times can be significantly shortened by elevating the operating temperature or applying external strain, which enhance desorption rates. For instance, increasing the temperature to 400–500 K is expected to reduce NO2 recovery times to a feasible range for sensor applications. Therefore, although the room-temperature values seem long, the studied materials remain promising for practical sensing, and the reported trends provide meaningful guidance for designing high-performance 2D gas sensors.
For other gases, such as HCN, SO2, NO, and H2S, the calculated recovery times at room temperature fall within or near the expected operational range, and the relative trends are consistent with the charge transfer and adsorption energy analysis. Therefore, while the absolute values of the recovery times should be interpreted cautiously, the results provide useful guidance for selecting 2D materials with favorable adsorption and desorption properties for gas sensing.
3.4.1. Recovery Time of NO/Ag–SnSe2 and NO/Au–SnSe2 Under Strain from −8% to 6% at Different Temperatures
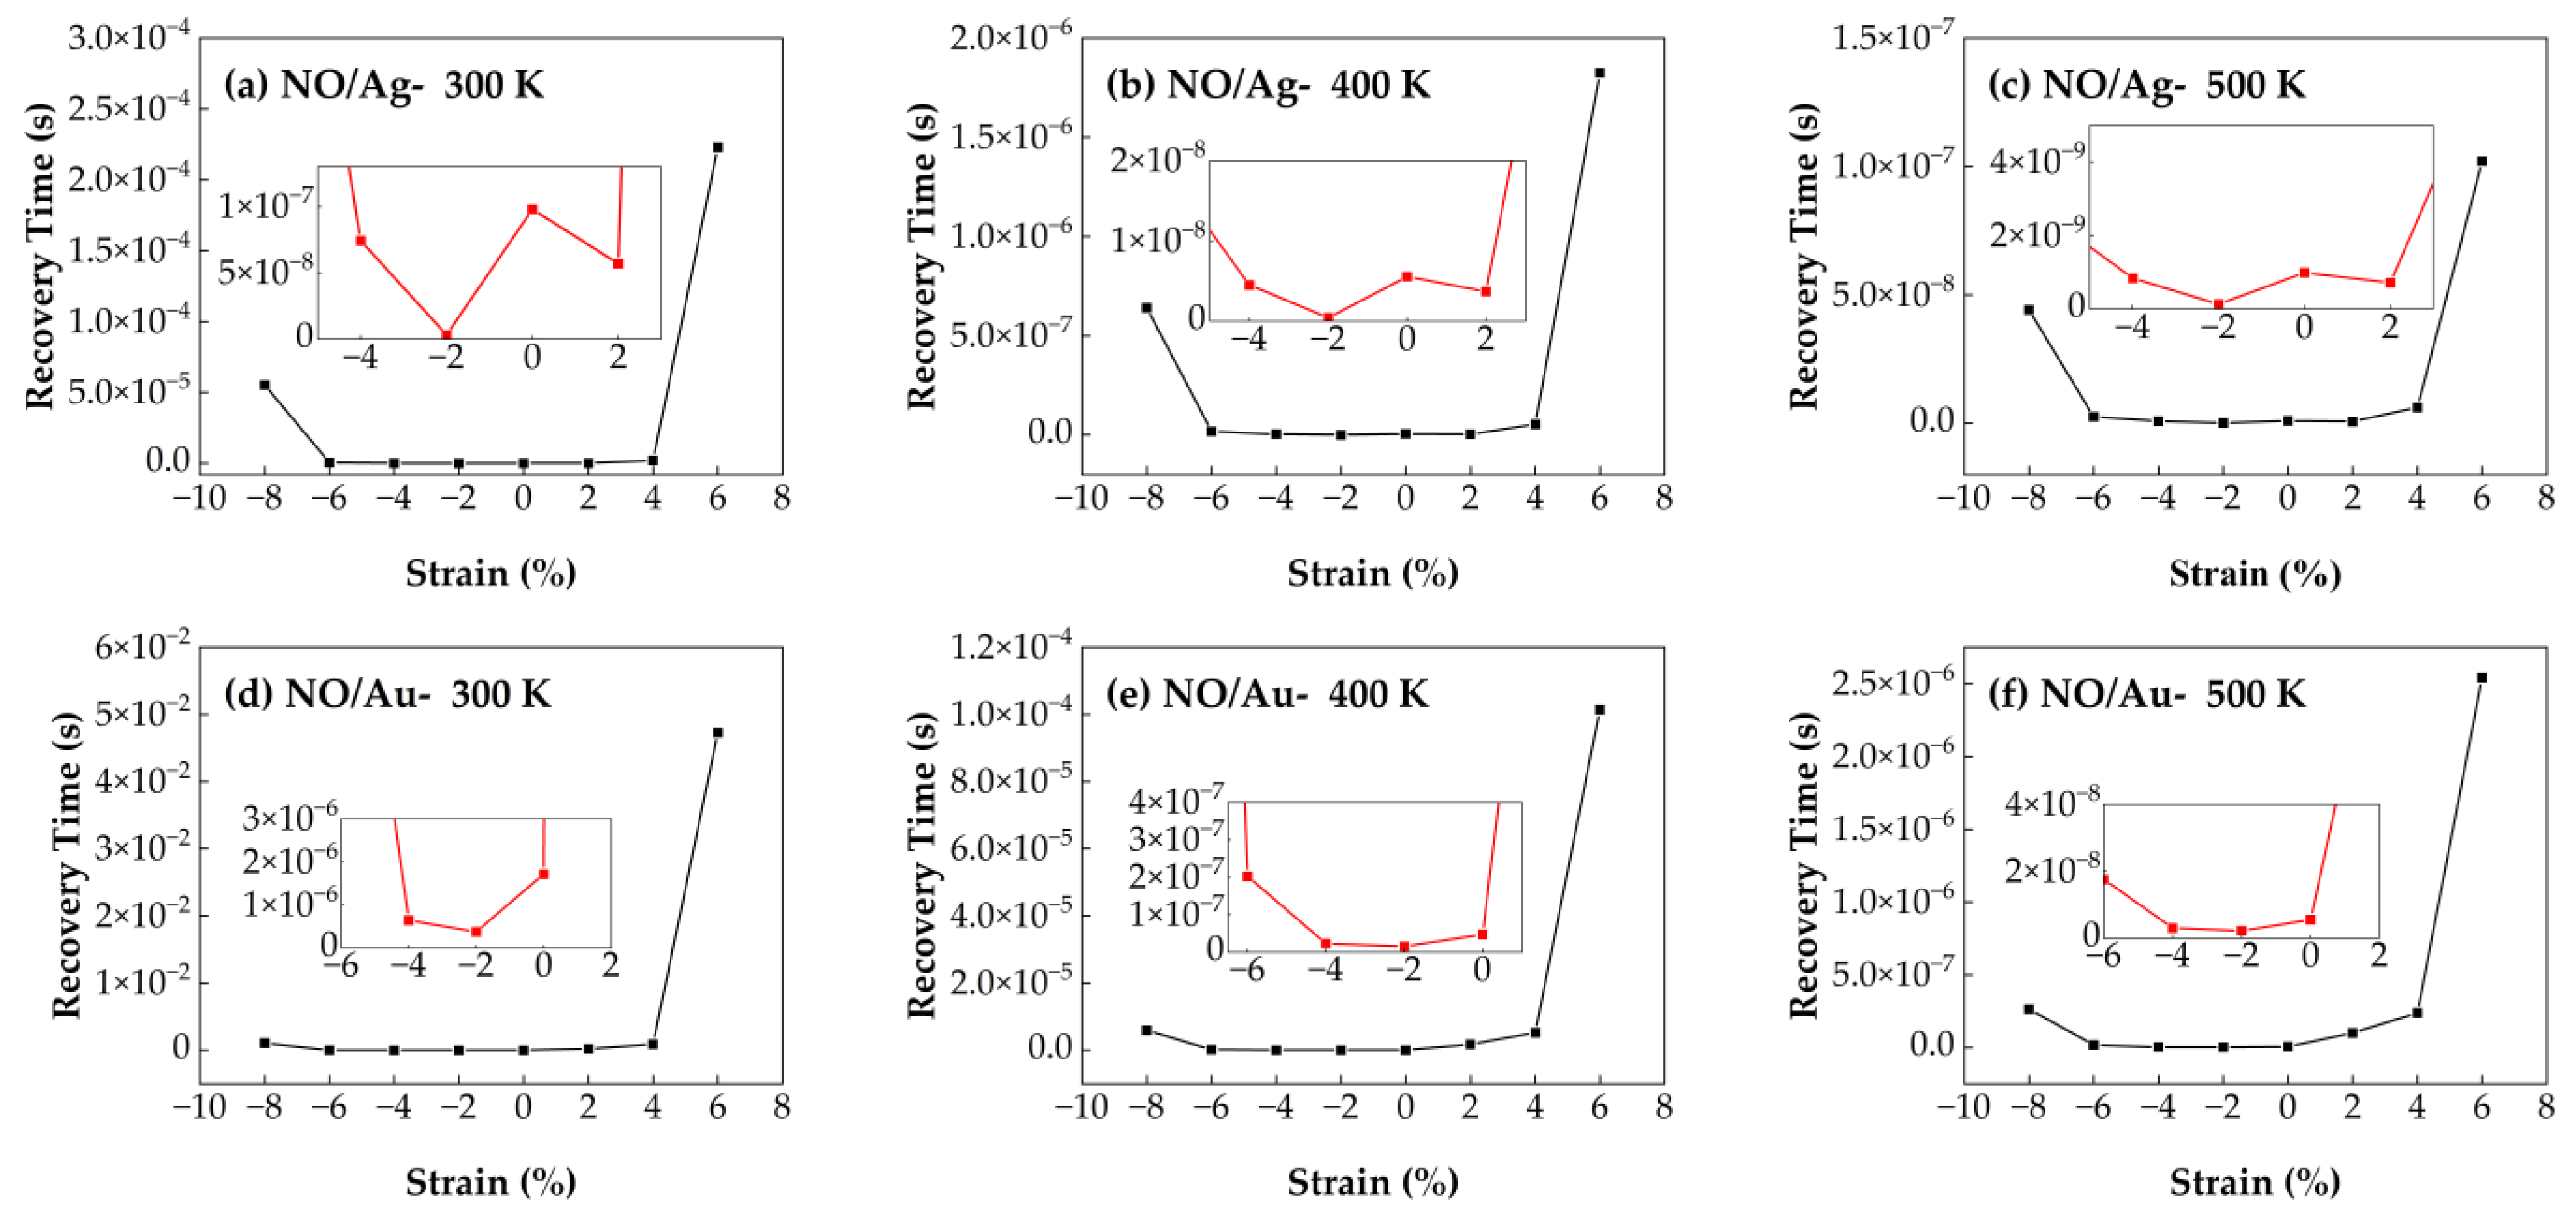
Figure 11 shows the recovery time of NO molecules adsorbed on Ag- and Au-doped SnSe
2 monolayers under biaxial strain ranging from −8% to 6% at different temperatures (300 K, 400 K, and 500 K). The recovery time of NO on Au–SnSe
2 reaches a minimum of 1.53 s under −2% compressive strain at 400 K, and remains relatively stable across the strain range of −8% to 4%. Similarly, the NO/Ag–SnSe
2 system also shows its shortest recovery time under −2% strain. However, when the strain exceeds certain thresholds (e.g., −8% or 6%), the recovery time increases significantly, indicating that excessive strain may hinder the desorption process by strengthening gas–substrate interactions. In terms of overall sensing performance, the Ag–SnSe
2 system demonstrates higher sensitivity toward NO, as evidenced by a shorter recovery time of 1.2 s at −2% strain and 500 K. This suggests that Ag–SnSe
2 is more suitable for NO gas sensing applications, especially under mild compressive strain and elevated operating temperatures, which facilitate efficient desorption and fast sensor recovery.
3.4.2. Recovery Time of NO2/Ag–SnSe2 and NO2/Au–SnSe2 Under Strain from −8% to 6% at Different Temperatures
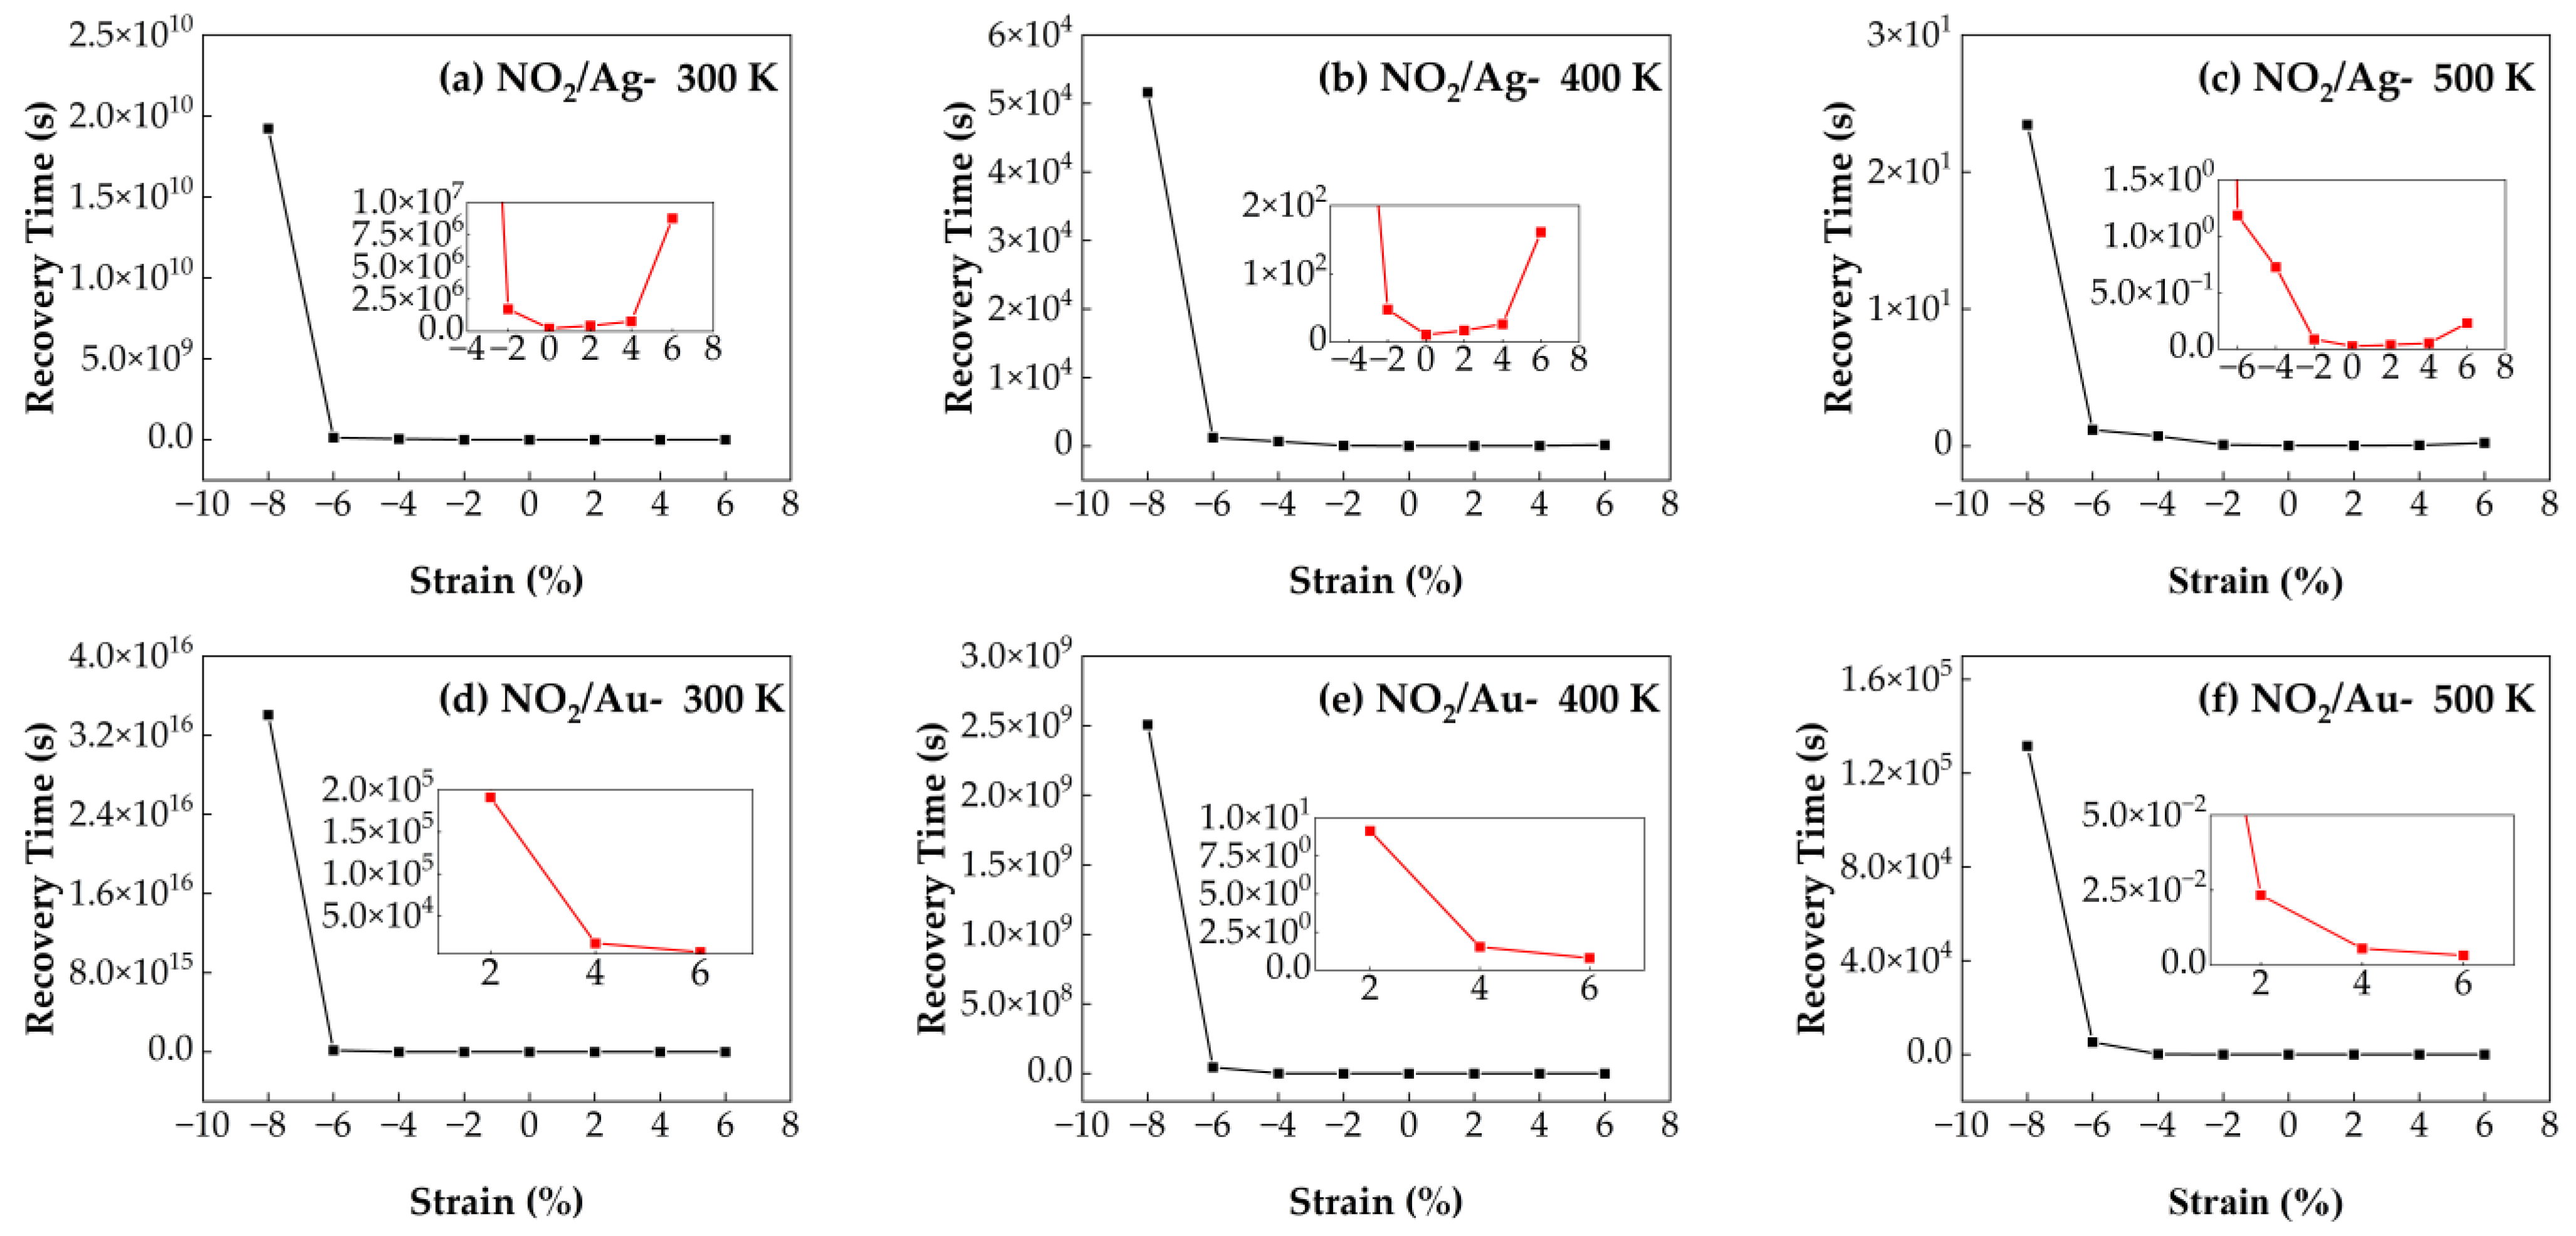
Figure 12 illustrates the recovery times of NO
2 molecules adsorbed on Ag- and Au-doped SnSe
2 monolayers under strains ranging from −8% to 6% and at temperatures of 300 K, 400 K, and 500 K. For the NO
2/Au–SnSe
2 system, increasing tensile strain from 2% to 6% significantly shortens the recovery time at all examined temperatures, with the shortest recovery time occurring at 6% tensile strain and 500 K. At fixed strain values, the recovery time decreases with increasing temperature, consistent with thermally activated desorption behavior. Under zero strain, the NO
2/Ag–SnSe
2 system shows a recovery time of 0.2 s at 500 K, which is shorter than that of the NO
2/Au–SnSe
2 system, indicating stronger desorption kinetics. In the NO
2/Ag–SnSe
2 system, compressive strain enhances the sensitivity, as demonstrated by the ultra-short recovery time of 0.02 s at 500 K and −2% strain. However, tensile strain reduces the desorption performance of Ag–SnSe
2 for NO
2, whereas Au–SnSe
2 maintains improved recovery times under tensile strain. These findings suggest that compressive strain is detrimental to the overall desorption dynamics in both systems. For Ag–SnSe
2, optimal NO
2 sensing performance is achieved under mild compressive strain and elevated temperature. In contrast, tensile strain enhances the recovery behavior in the Au–SnSe
2 system, indicating different strain modulation strategies are required depending on the choice of dopant.
3.4.3. Recovery Time of SO2/Ag–SnSe2 and SO2/Au–SnSe2 Under Strain from −8% to 6% at Different Temperatures
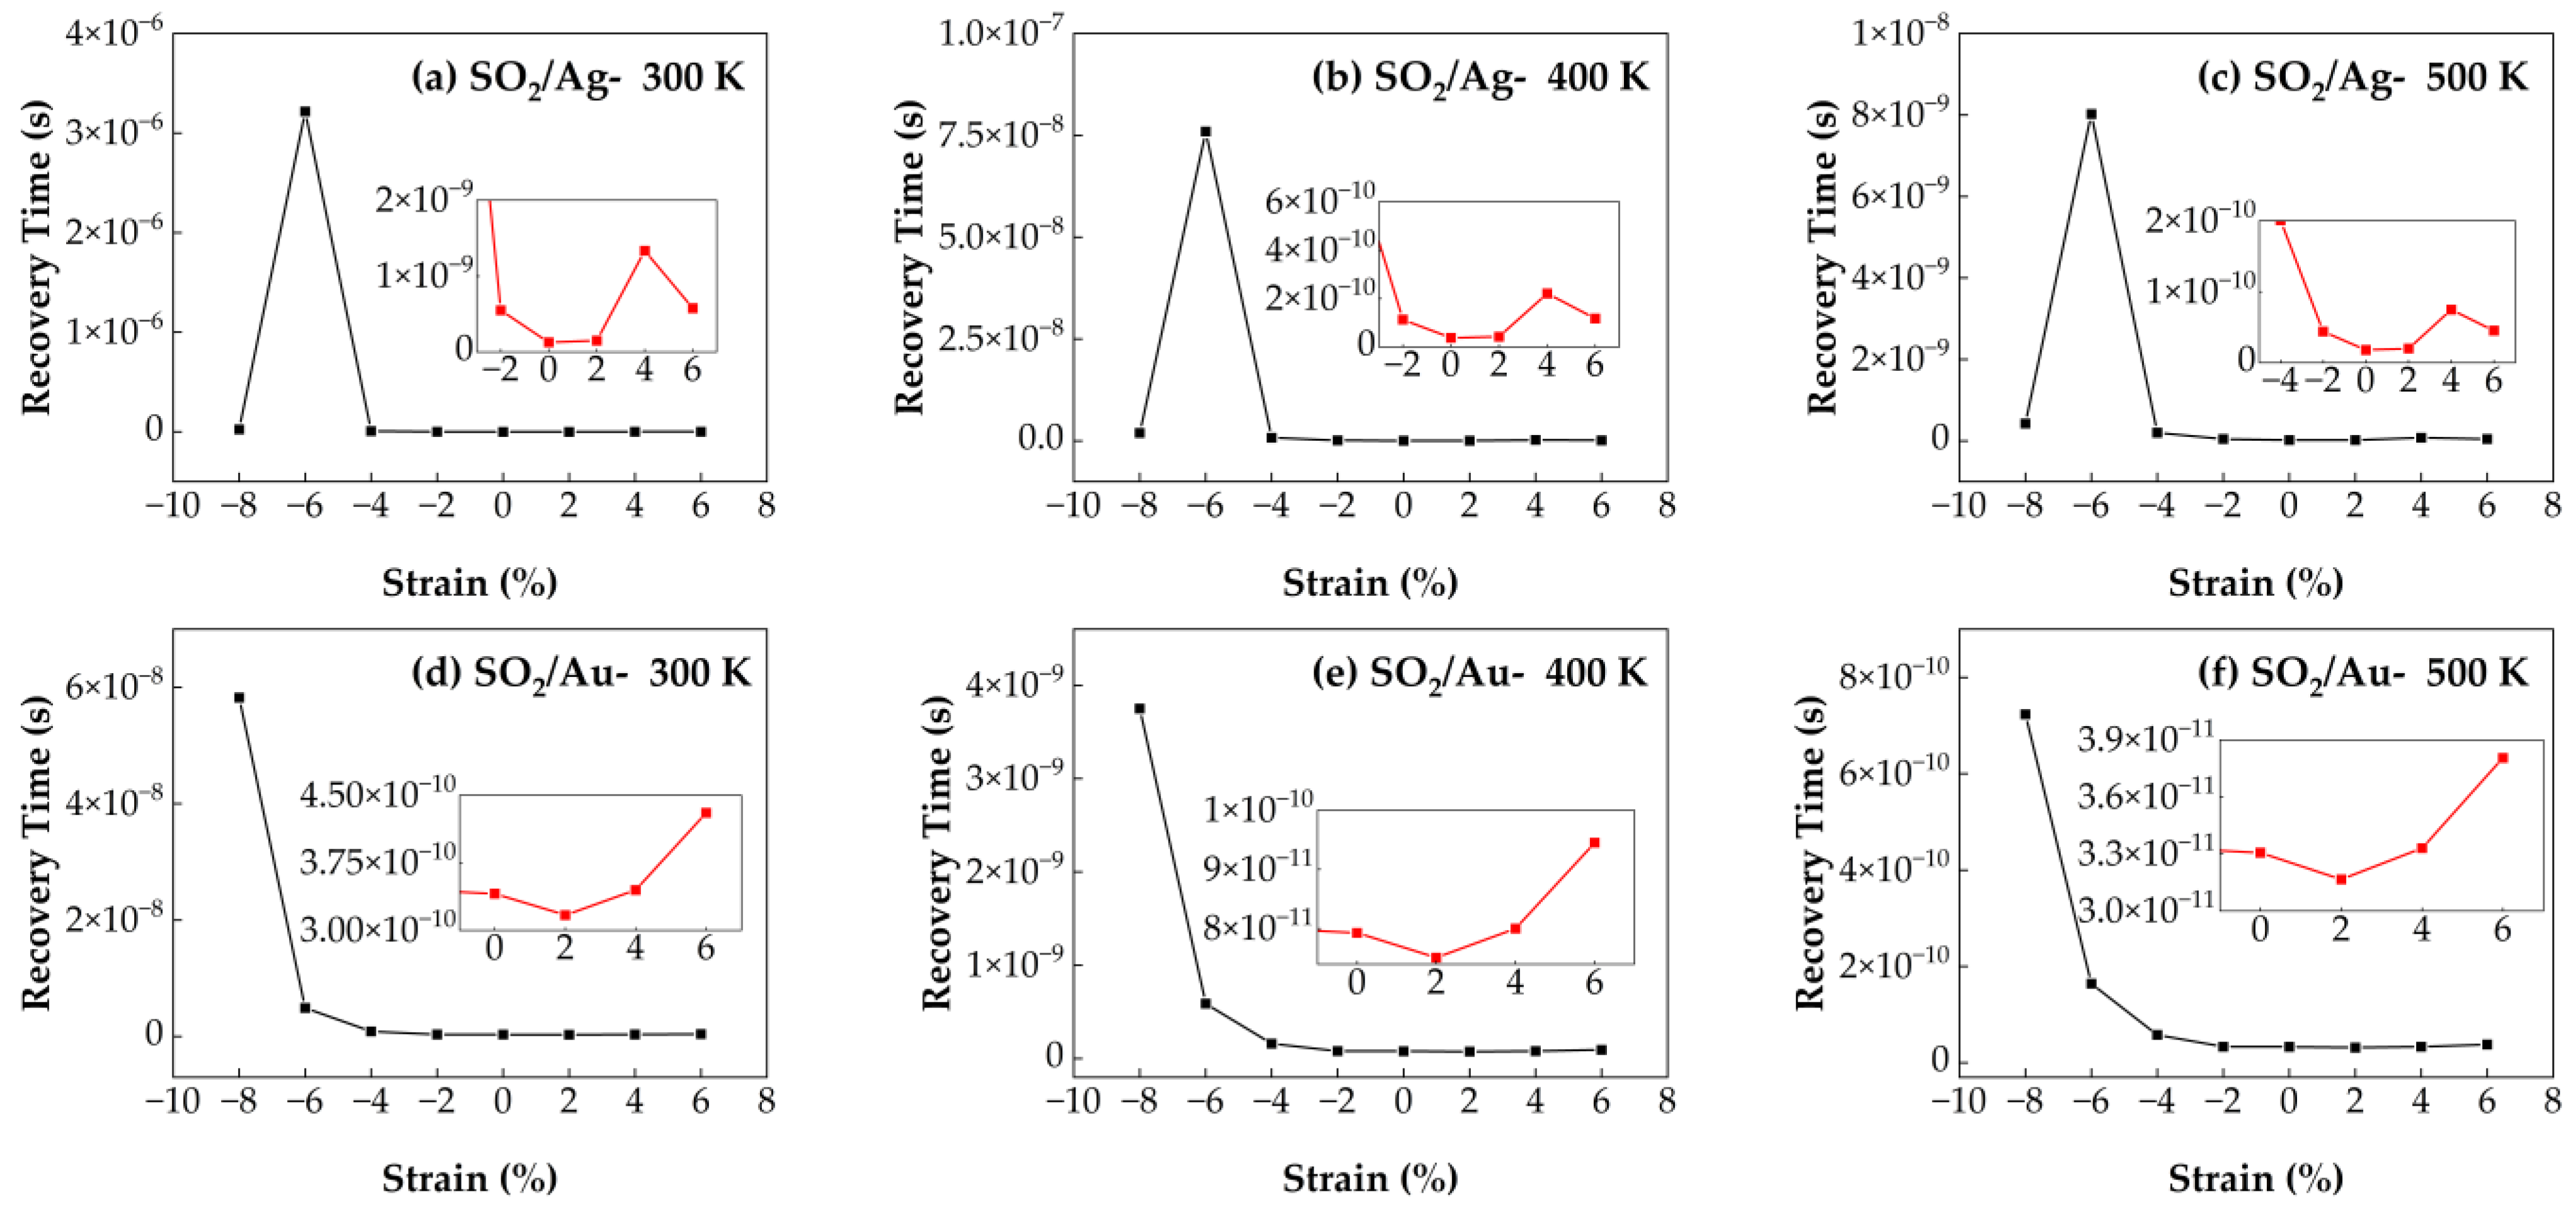
Figure 13 presents the calculated recovery times for SO
2 molecules adsorbed on Ag- and Au-doped SnSe
2 monolayers under strain conditions ranging from −8% to 6% and at three temperatures (300 K, 400 K, and 500 K). For the SO
2/Au–SnSe
2 system, the maximum recovery time occurs at −8% compressive strain, indicating strong gas–substrate interactions that hinder desorption. In contrast, the shortest recovery time is observed under 2% tensile strain, suggesting that moderate tensile strain can facilitate faster desorption. At fixed strain levels, increasing the temperature significantly reduces recovery time, consistent with the thermal activation mechanism of desorption. Specifically, tensile strain has a relatively minor impact on desorption behavior, whereas compressive strain substantially impedes gas release, especially at lower temperatures. In the SO
2/Ag–SnSe
2 system, tensile strain has negligible influence on recovery time. However, under −6% compressive strain, strong adsorption results in an extended recovery time. This effect can be mitigated by elevating the operating temperature. For example, at 500 K without applied strain, the SO
2/Ag–SnSe
2 system achieves an ultra-short recovery time of 1.8 × 10
−11 s, demonstrating excellent desorption capability. These results imply that applying moderate tensile strain and operating at elevated temperatures can significantly enhance the sensor performance for SO
2 detection.
3.4.4. Recovery Time of H2S/Ag–SnSe2 and H2S/Au–SnSe2 Under Strain from −8% to 6% at Different Temperatures
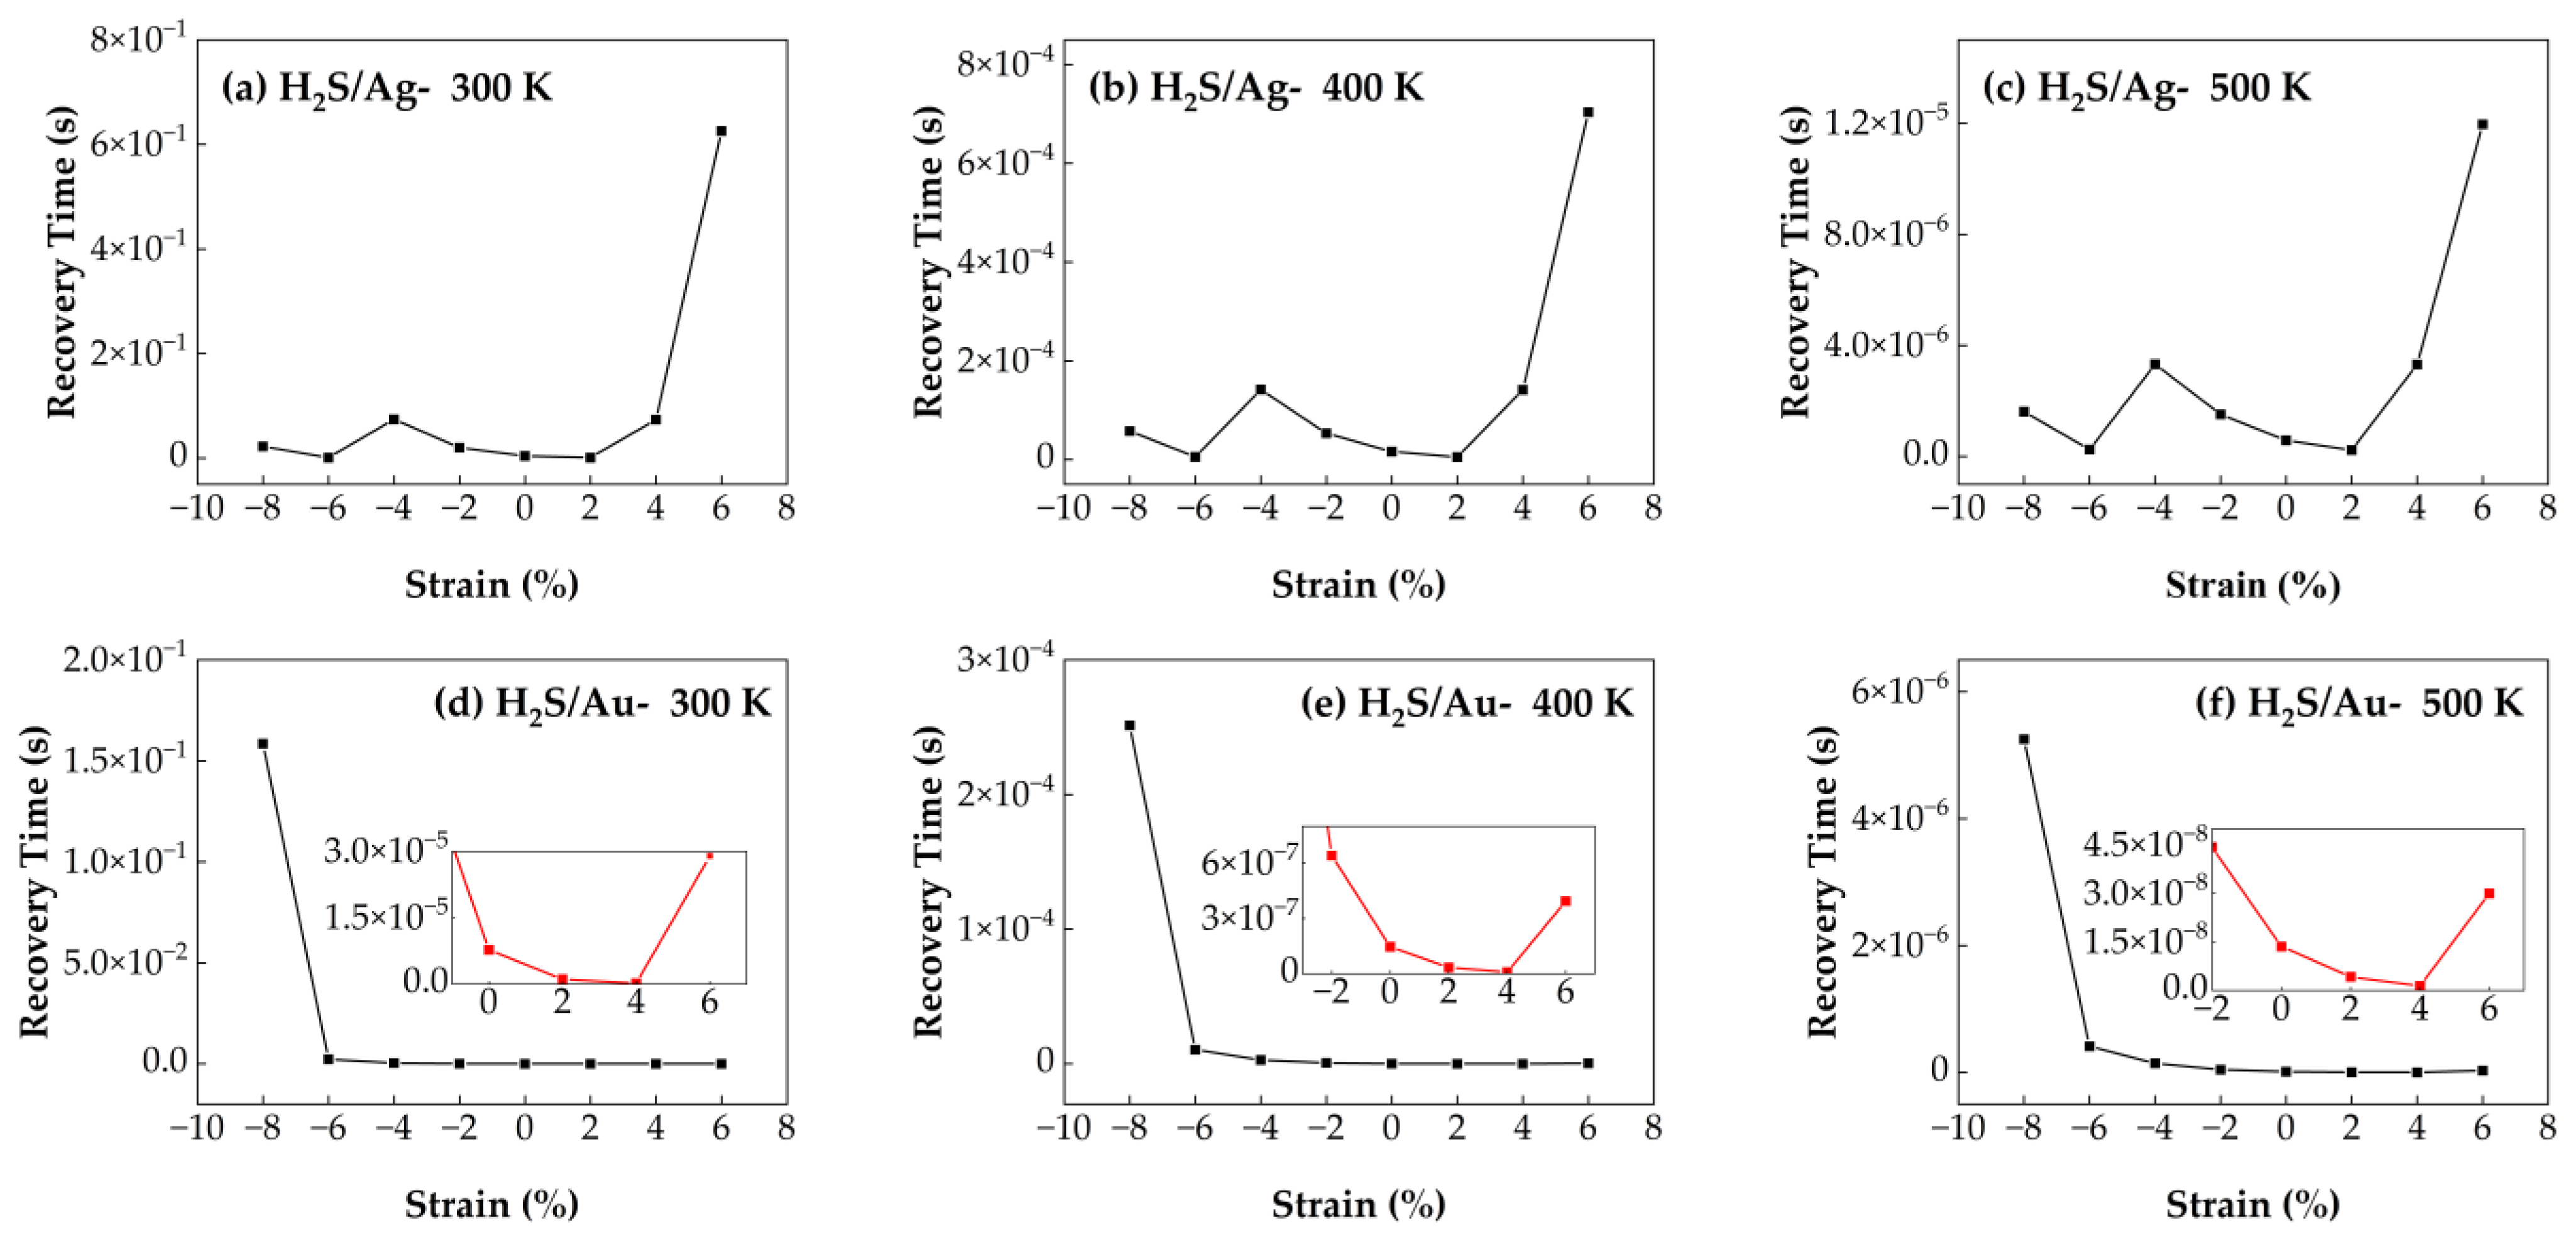
The effect of biaxial strain (ranging from −8% to 6%) on the recovery time of H
2S molecules adsorbed on Ag- and Au-doped SnSe
2 monolayers is illustrated in
Figure 14. For the H
2S/Au–SnSe
2 system, the maximum recovery time occurs under −8% compressive strain, indicating that excessive strain inhibits gas desorption and is unfavorable for sensor performance. Under tensile strain, particularly at 4%, the system exhibits optimal recovery behavior, suggesting that moderate tensile strain facilitates desorption and improves sensing performance. In contrast, the recovery time of the H
2S/Ag–SnSe
2 system exhibits more pronounced fluctuations under varying strain conditions. Strains of −6% and 2% result in shorter recovery times compared to the unstrained configuration. Notably, at 500 K and 2% tensile strain, the Ag–SnSe
2 system achieves the shortest recovery time for H
2S desorption. These results indicate that applying mild tensile strain and operating at elevated temperatures can enhance the recovery performance of H
2S sensing on Ag-doped SnSe
2, providing a feasible strategy for developing high-efficiency gas sensors.
3.4.5. Recovery Time of HCN/Ag–SnSe2 and HCN/Au–SnSe2 Under Strain from −8% to 6% at Different Temperatures
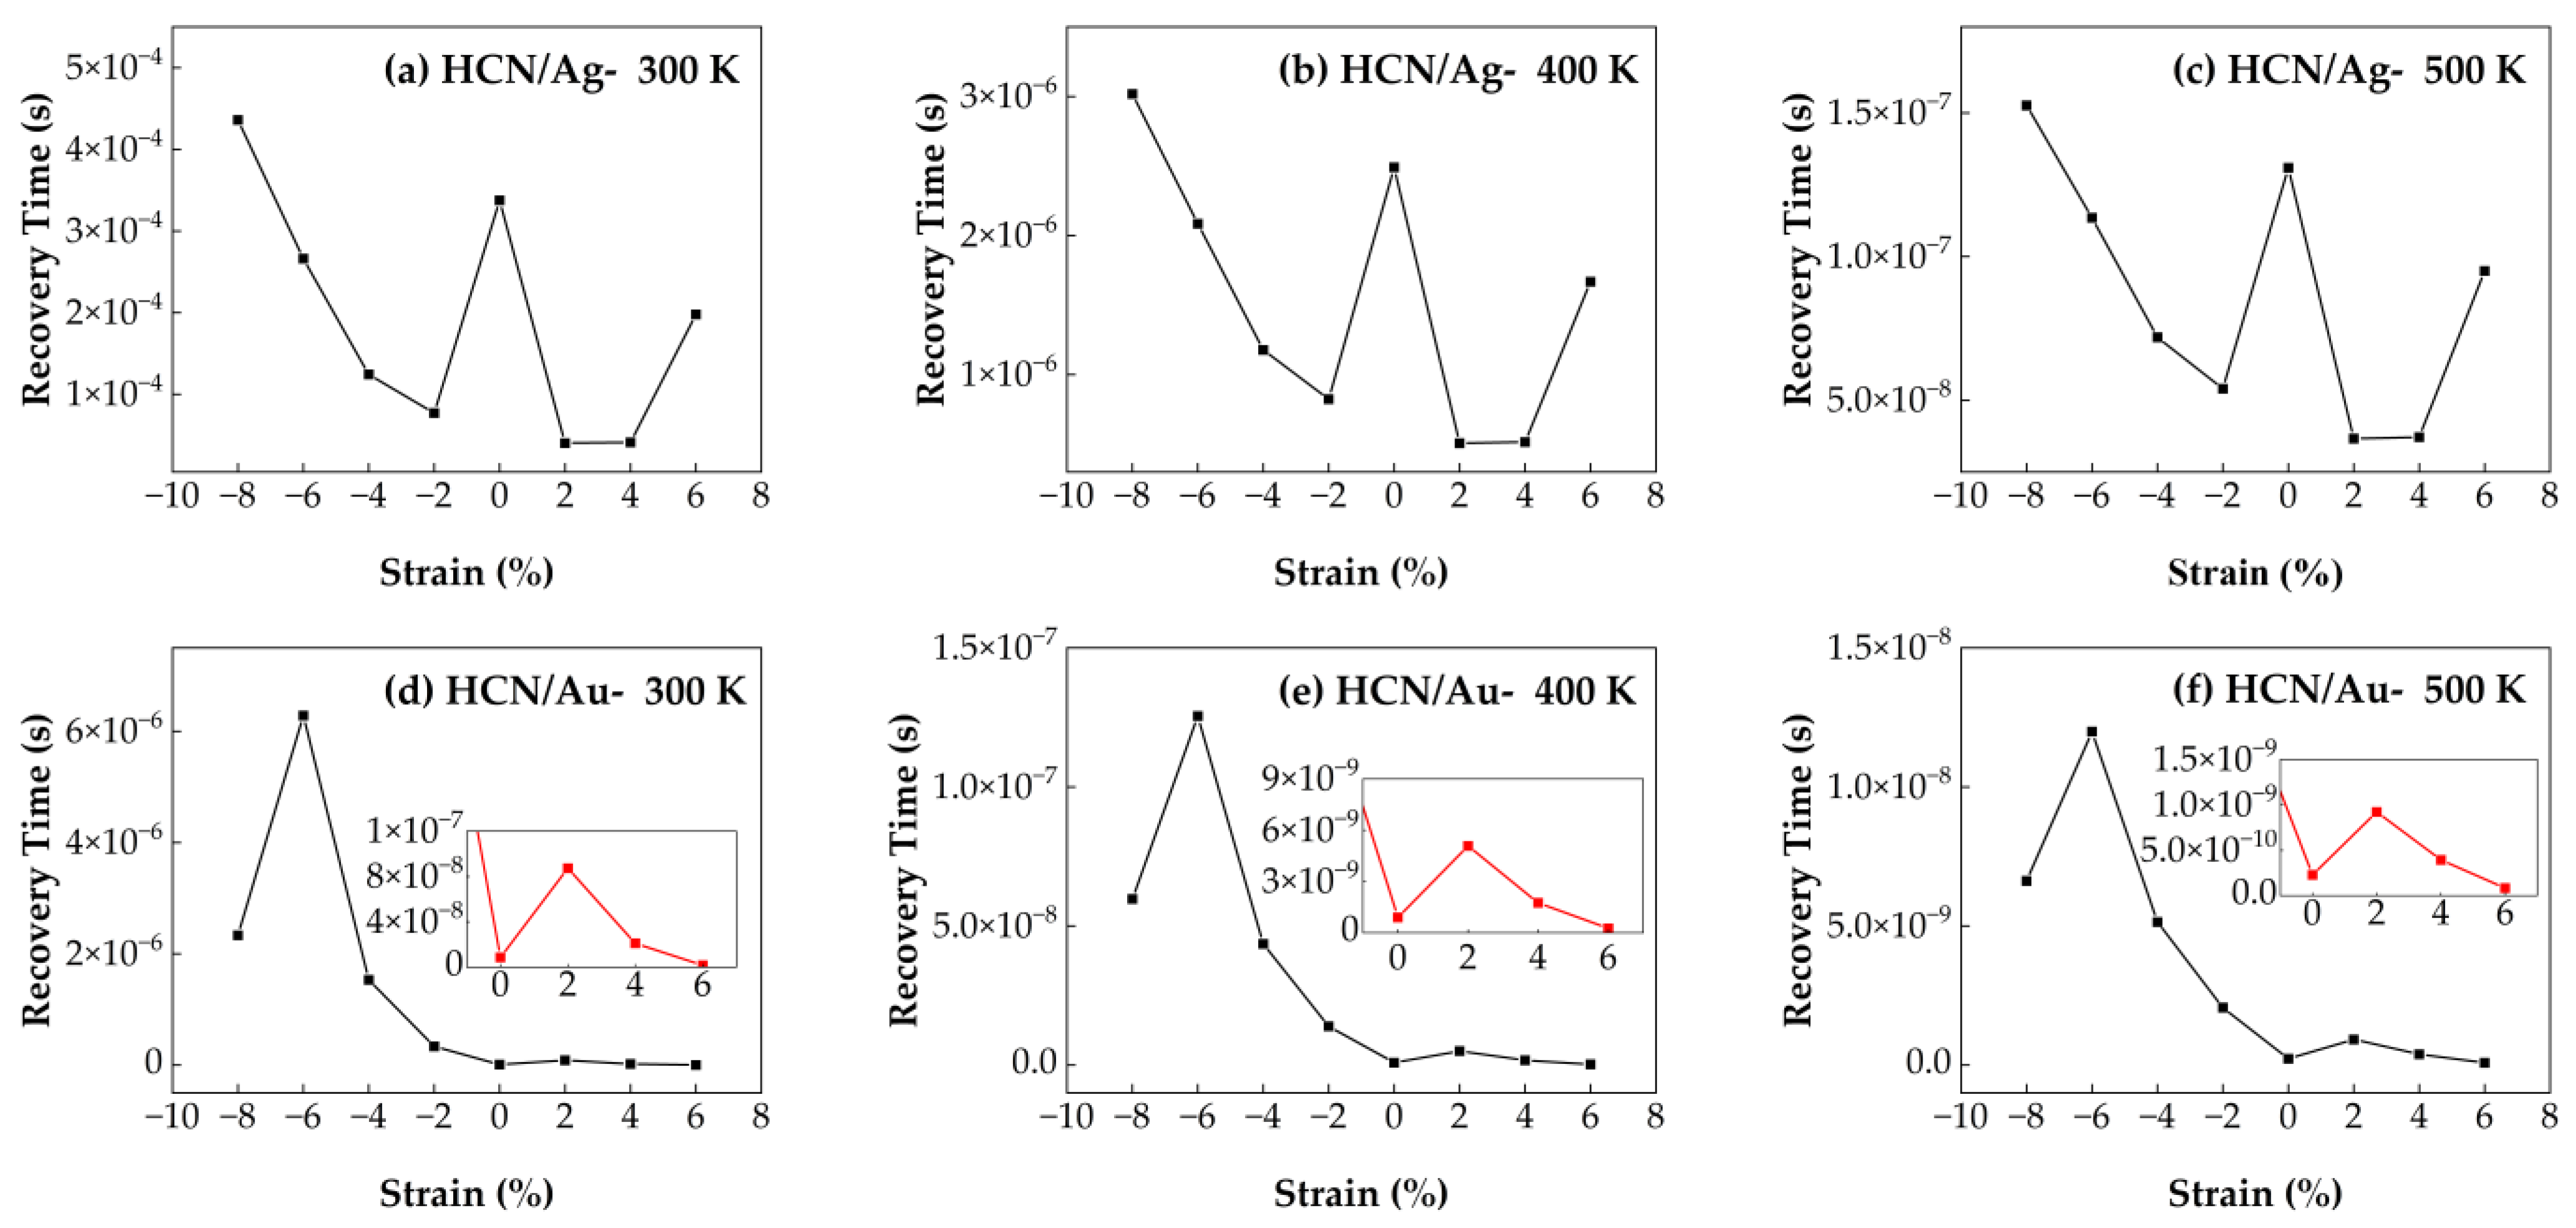
The influence of biaxial strain in the range of −8% to 6% on the recovery time of HCN molecules adsorbed on Au- and Ag-doped SnSe
2 monolayers was analyzed by calculating the desorption times at three different operating temperatures. As shown in
Figure 15, the recovery time for both systems decreases with increasing temperature, indicating that thermal activation facilitates gas desorption. For the HCN/Au–SnSe
2 system, the shortest recovery time is observed under 6% tensile strain, suggesting that tensile deformation significantly enhances desorption efficiency. In the case of HCN/Ag–SnSe
2, 2% tensile strain leads to the best recovery performance. These results indicate that applying appropriate tensile strain can effectively regulate the desorption dynamics of HCN molecules, thereby improving sensor responsiveness. Moreover, the HCN/Ag–SnSe
2 system shows improved recovery times under both moderate compressive strain (−6% to −2%) and tensile strain (2% to 6%) compared to the unstrained case. Conversely, for the HCN/Au–SnSe
2 system, compressive strain adversely affects desorption, leading to longer recovery times. Overall, strain engineering offers a viable strategy for tuning gas-sensing behavior, especially for HCN molecules.
4. Discussion
In this study, the gas sensing properties of noble metal (Au and Ag) doped SnSe2 monolayers were systematically investigated using first-principles calculations. The adsorption configurations, adsorption energies, electronic properties, charge transfer, and differential charge density were evaluated for five gas molecules (NO, NO2, HCN, SO2, and H2S). For Au-doped SnSe2, the magnitude of the adsorption energies decreases in the order of NO2 > H2S > NO > HCN > SO2, whereas for Ag-doped SnSe2, the sequence is NO2 > H2S > HCN > NO > SO2. Among all gases, NO2 adsorption induces the highest charge transfer on both doped systems, indicating their promising selectivity and sensitivity toward NO2 molecules. In contrast, lower charge transfer values are observed for H2S and HCN on Au-doped SnSe2 and for SO2 and HCN on Ag-doped SnSe2. The differential charge density plots further visualize the electron gain or depletion at the interface, which agrees with Bader charge analysis results.
Furthermore, the effects of biaxial strain (ranging from −8% to 6%) on adsorption behavior were explored by evaluating changes in equilibrium height, adsorption energy, charge transfer, and recovery time for ten representative adsorption systems. The results reveal that both compressive and tensile strains can enhance the interaction strength between the gas molecules and the doped SnSe2 monolayers. Specifically, H2S/Au–SnSe2 and HCN/Au–SnSe2 are highly responsive to tensile strain, while NO/Au–SnSe2, H2S/Ag–SnSe2, NO/Ag–SnSe2, and NO2/Ag–SnSe2 are more sensitive to compressive strain. Systems such as NO2/Au–SnSe2, SO2/Au–SnSe2, and SO2/Ag–SnSe2 show a response to both types of strain, while HCN/Ag–SnSe2 is relatively insensitive in terms of charge transfer. Recovery time analysis indicates that NO2 has the slowest desorption kinetics among the studied gases and is most affected by strain modulation. However, increasing the operating temperature and applying appropriate strain can significantly reduce recovery time. While other gas systems exhibit less dramatic variations, strain engineering remains an effective strategy to fine-tune desorption characteristics and improve overall sensor performance. Overall, these findings provide theoretical guidance for the development of high-performance, strain-tunable gas sensors based on two-dimensional noble metal-doped SnSe2 monolayers.
5. Conclusions
In this work, we systematically investigated the gas sensing properties of Au- and Ag-doped SnSe2 monolayers toward five representative hazardous gases (NO, NO2, HCN, SO2, and H2S) using first-principles calculations. Adsorption configurations, adsorption energies, charge transfer, electronic properties, and differential charge density analyses revealed that NO2 exhibits the strongest interaction and highest charge transfer in both doped systems, indicating excellent selectivity and sensitivity. Biaxial strain was further applied to modulate adsorption behavior, demonstrating that both compressive and tensile strains can enhance gas–substrate interactions. Specific gas–substrate systems show varying sensitivity to strain: H2S/Au–SnSe2 and HCN/Au–SnSe2 respond strongly to tensile strain, while NO/Au–SnSe2, H2S/Ag–SnSe2, NO/Ag–SnSe2, and NO2/Ag–SnSe2 are more responsive to compressive strain. Recovery time analysis indicates that NO2 has the slowest desorption kinetics, while other gases exhibit faster recovery, and the recovery can be further optimized by adjusting operating temperature or applied strain. Overall, these findings provide a systematic framework for understanding and predicting the gas sensing performance of noble metal-doped SnSe2 monolayers and offer theoretical guidance for designing high-performance, strain-tunable 2D gas sensors for environmental monitoring and health protection.

