Article

Impact of Nanoparticle Additions on Life Cycle Assessment (LCA) of Ceramic Tiles Production

by
Euler L. Saavedra
1,2 and
Johann F. Osma
2,3,*
1
Doctoral Program in Management of Technological Innovation, School of Engineering, Universidad de los Andes, Cra. 1E No. 19a-40, Bogotá 111711, Colombia
2
Department of Electrical and Electronic Engineering, Universidad de los Andes, Cra. 1E No. 19a-40, Bogotá 111711, Colombia
3
Department of Biomedical Engineering, Universidad de los Andes, Cra. 1E No. 19a-40, Bogotá 111711, Colombia
*
Author to whom correspondence should be addressed.
Nanomaterials 2024, 14(11), 910; https://doi.org/10.3390/nano14110910
Submission received: 22 April 2024 / Revised: 11 May 2024 / Accepted: 15 May 2024 / Published: 22 May 2024

Abstract

:
The ceramic tile industry, with significant energy and material demands in its manufacturing processes, has employed technological innovations in energy efficiency, advanced equipment and tile thickness reduction to address these challenges. This study aimed to assess the impact of Ag2O, CuFe2O4, Fe3O4, and SiO2 nanoparticles (0%, 1%, and 5% by weight) on the mechanical strength, water absorption, and apparent thermal conductivity of ceramic tiles, as well as their capacity to reduce energy and raw material consumption. This reduction translates into a decrease in environmental impacts, which have been evaluated through life cycle assessment (LCA) methodology applied to the manufacturing processes. Nanoparticles (Ag2O, CuFe2O4, Fe3O4, and SiO2) were initially screened on TF clay (0%, 1%, 5% w/w), and the most effective were applied to CR1 and CR2 clays (0%, 1%, 5% w/w). Findings indicated a 32% increase in temperature gradient and a 16% improvement in flexural strength with the addition of Fe3O4 nanoparticle at 1% (w/w) in TF clay. Furthermore, there was a potential 48% reduction in energy consumption, and up to 16% decrease in tile weight or thickness without affecting the flexural strength property of the test tiles. LCA results demonstrated that the addition of Fe3O4 nanoparticle has potential reductions of up to 20% in environmental impacts. This study suggests that nanoparticle addition offers a viable alternative for reducing energy and material consumption in the ceramic tile industry. Future research should focus on assessing the economic impact of transitioning to a sustainable business model in the ceramic tile industry with nanoparticles addition.

1. Introduction

Ceramic tile is one of the most widely used materials in building construction [1]. Ceramics are inorganic and non-metallic materials mainly used in walls, floors and ceilings, characterized by their high chemical and physical properties, such water absorption and flexural strength, as well as its high production and relevant economic value [2]. The primary components used in the production of standard ceramic bodies, such as monoporosa and porcelain stoneware tiles, are clay, feldspar, and quartz [3]. In 2022, world ceramic production was 16,762 million square meters, down 9.7% from 2021 [4]. The production of ceramic tiles involves types of energy sources such as electric and thermal. Electricity is used to generate mechanical force, and thermal energy, such as fuels, natural gas, liquefied petroleum gas and coal, is used as direct heat in the different drying and firing processes [1,5]. It is estimated that, in the ceramic process, approximately 8–12% of the total energy consumed is electrical and 88–92% is thermal [6,7]. A significant amount of thermal energy is used in the atomizing process (36%), drying (9%) and firing (55%) [8,9].
The study by Delpech et al. [10] found that thermal energy gives rise to air emissions of carbon dioxide, which are associated with gas combustion during the ceramic process. Now, these emissions are subject to control and reduction measures. For that reason, it is imperative to consider all the possible environmental and health impacts related to the ceramic process in order to improve the environmental sustainability of this process. Several authors have identified strategies to improve energy efficiency in the different processes of the ceramic industry, ranging from waste heat utilization [11,12,13,14], equipment optimization [8] and incorporation of renewable energy use in the atomizing [15,16,17,18], drying and firing processes. Few studies have focused on the reduction of thickness to improve energy efficiency and the use of materials in other ceramic tile groups such as porcelains tiles [9,19,20,21], whose apparent thermal conductivity has not been considered as an important characteristic for the reduction of energy consumption.
On the other hand, ceramic tile manufacturing companies have developed new technologies and products in recent years [22]. Some of these approaches have focused on finding new functions of their surfaces, with the aim of offering some new attributes beyond the conventional ones [23]. The new attributes or functionalities are aimed at improving aspects of tile production related to the quality of life of people, uses of ceramic tiles in new spaces and in the production of solar energy [24,25,26,27].
Several studies and patented researches have been carried out that have incorporated various types of nanoparticles, such as SiO2, Ge, TiO2, Cu, Au, Ag, Pt, Ti and Mg with the aim of improving the photocatalytic, antibacterial and self-cleaning properties of coating glazes [28,29,30,31,32,33,34,35,36,37,38,39], as well as enhancing the flexural strength of ceramic tile bodies through the addition of SiO2, PbO, Al2O3, Fe2O3, Ca, Na; Mg; B, Zn, Al and P nanoparticles [40,41,42,43,44].
In the study conducted by Chen et al. [40], replacements of different proportions of potter’s clay and porcelain clay with incinerated sludge ash (ISSA) were carried out to fabricate sludge ash tile samples. These tiles were used to examine the effect of incorporating nano-SiO2 particles (average particle size of 10 ± 5 nm) as strengthening additives in the clay-ISSA materials. The increase in flexural strength was 0–2.5 MPa.
The effects of the incorporation of nano-alumina (Al2O3) and nano-silica (SiO2) in porcelain stoneware tiles were evaluated by De la Garza et al. [42]. The tiles were manufactured with concentrations of 0.25, 0.5, 0.75 and 1 wt.% of Al2O3 and SiO2 nanoparticles with an average particle size between 20–30 nm. In this study, the authors evaluated key physic-mechanical properties, such as compressive strength, water absorption, density and porosity. The sample with 1 wt.% nano-SiO2 showed the highest compressive strength (65.27 MPa) related to the sample with the lowest porosity.
Fierro et al. [44] patented a process for the preparation, conditioning and stabilization of a family of basic additives sodium, potassium, boron, silicon, zinc, and calcium oxides, among others, prepared by physicochemical and chemical synthesis methods, forming nanometric structures, reformulated with deflocculants, sequestrants and dispersants additives, which allow one to obtain a dispersion or powder capable of reducing the sintering temperature of a ceramic body up to 13% due to the high fluxing power maximized by the use of nanotechnology in the structures obtained.
Mahmoud et al. [41] studied the incorporation of lead oxide (PbO) nanoparticles (mean particle size equal to 29.64 nm) into standard ceramic tiles, with concentrations from 0.0 to 10.0 wt.%, to serve as promising alternative candidates for γ-ray shielding. The modulus of rupture increased from 1.753 to 2.674 MPa.
Nawaukkaratharnant et al. [43] studied the addition of iron oxide particles to improve the properties of red stoneware tiles. The water absorption and apparent porosity of the samples decreased with increasing Fe2O3 content and firing temperature. Furthermore, the addition of Fe2O3 up to a total content of 8.05 wt.% improved the flexural strength up to 30 MPa and reduced the firing temperature; also, the water absorption was reduced to less than 1.5% after firing at 1150 °C. In contrast, the flexural strength was reduced with a total Fe2O3 content of up to 9.99 wt.%.
The ceramic industry is currently facing significant environmental challenges, and the approach of improving ceramic properties through the addition of nanoparticles is relevant. An LCA study allows us to quantify the various impacts of the cradle-to-gate ceramic tile manufacturing process. This means that it allows us to evaluate the impact of this process and is not necessarily related to the toxicity of the final product. Therefore, it is important to quantify the impact of the process to assess whether the incorporation of nanoparticles has a positive effect in reducing the impact on the production of ceramic tiles. Numerous studies have highlighted the importance of life cycle assessment (LCA) as a fundamental tool for addressing environmental impacts on industrial ceramic sector in order to identify opportunities for improving sustainability [45,46,47,48,49,50,51,52,53]. According to recent studies in different countries, such as the one conducted by Boschi et al. [2] in Italy that evaluated environmental impacts in Italian tile production, reductions in the environmental footprint across 90 factories were shown. The study carried out by Wang et al. [5] in China quantified environmental improvements in ceramic processes, comparing traditional and cleaner production technologies. Another study by Ros-Dosda et al. [9] in Spain examined the environmental impacts in the life cycle of porcelain stoneware tiles, focusing on thickness reduction and glazing usage. Meanwhile, Türkmen et al. [54] in Turkey compared impacts of current and cleaner manufacturing scenarios, considering factors like drying heat recovery and thickness reduction in a “cradle to gate” approach.
Although nanoparticles have found applications in ceramic tiles, studies and patents are primarily focused on enhancing the photocatalytic, antibacterial, and self-cleaning properties of coatings [28,29,30,31,32,33,34,35,36,37,38,39]. However, some research on ceramic tiles has explored alternatives to improve the mechanical properties of the ceramic body, such as flexural strength by adding nanoparticles of Al2O3, SiO2, PbO, and Fe2O3 [40,41,42,43,44]. In our study, we have incorporated SiO2 nanoparticles because of their widespread use in previous studies [40,42]. Additionally, three types of nanoparticles (Ag2O, CuFe2O4, and Fe3O4) were included owing to their excellent apparent thermal conductivity and limited utilization in prior studies. These nanoparticles not only enhance properties such as flexural strength and apparent thermal conductivity of ceramic tiles, but also have the potential to reduce energy and raw material consumption. This reduction translates into decreasing environmental impacts, evaluated through life cycle assessment (LCA) methodology applied to the manufacturing processes. The aim of this study is to evaluate how the addition of Ag2O, CuFe2O4, Fe3O4 and SiO2 nanoparticles in three different concentrations (0%, 1%, 5% by weight) improves properties such as flexural strength and apparent thermal conductivity in test tiles made from three types of clays (CR1, CR2 and TF). Initially, a screening of nanoparticles was conducted using TF clay, followed by testing the most promising ones in terms of improving the properties of ceramic tiles with CR1 and CR2 clays.

2. Materials and Methods

2.1. Materials

Three red clays were used: CR1, CR2 and TF from Colombia (particles size, 12.7 mm > 22.0% > 7.9 mm; 7.9 mm > 4.6% > 6.4 mm; 6.4 mm > 7.8% > 4.0 mm; 4.0 mm > 33.6%> 1.0 mm; 1.0 mm < 32.0%). We used silver oxide (Ag2O) nanoparticles (particle size < 15 nm) from Smalticeram (Castellon, Spain), copper iron oxide (CuFe2O4) nanoparticles (particle size < 100 nm) from Sigma Aldrich (Taufkirchen, Germany), magnetite (Fe3O4) nanoparticles (particle size < 88.59 nm) from the Ceramica Italia laboratory (Cucuta, Colombia), silicon dioxide (SiO2) nanoparticles (particle size < 20 nm) from Sigma Aldrich (Taufkirchen, Germany), and treated water. The chemical compositions of clays were examined by X-ray fluorescence spectroscopy; the results are shown in Table 1.

2.2. Equipment

Equipment used includes: magnetic stirrer MR Hei-Tec HEIDOLPH (Schwabach, Germany); measurement apparatus, Ceramica Italia (Cucuta, Colombia); K-type thermocouples, Instruequipos Ingenierias S.A.S. (Medellin, Colombia); 100 mL beaker, Brixco (Montevideo, Uruguay); four output data logging thermometers, model DT4947SD, General Tools & Instruments (New York, NY, USA); Chronometer HS 70, Casio (Tokyo, Japan); a plastic container (obtained from the local market); Grinder ct-12061, Servitech (Tubarao, Brazil); drying oven DVS600, Yamato Scientific Co., Ltd. (Tokyo, Japan); Grinder Speedy 1, Nannetti (Faenza, Italy); Oven N 20/HR, Nabertherm (Lilienthal, Germany); manual press type P.I.L.A, Sacmi (Imola, Italy); drying oven WTC, Binder (Tuttlingen, Germany); viscometer FC/100/A, Ceramics Instruments (Sassuolo, Italy); pycnometer GT0151, Gabrielli Technology (Calenzano, Italy); weighing machine GF-10002A, A&D Company (Tokyo, Japan); Moisture analyzer MX-50, A&D Company (Tokyo, Japan); grinding container GT0535, Gabrielli Technology (Calenzano, Italy); vernier caliper 530-104BR, Mitutoyo (Suzano, Brazil); sieve GT0452 ASTM No. 18 [55], Gabrielli Technology (Calenzano, Italy); sieve GT0463 ASTM No. 230 [55], Gabrielli Technology (Calenzano, Italy); strength tester CR4-650, Gabrielli Technology (Calenzano, Italy); a metal container, 21 cm × 17 cm (obtained from the local market); and a metal tray, 32 cm × 43 cm × 5 cm (obtained from the local market).

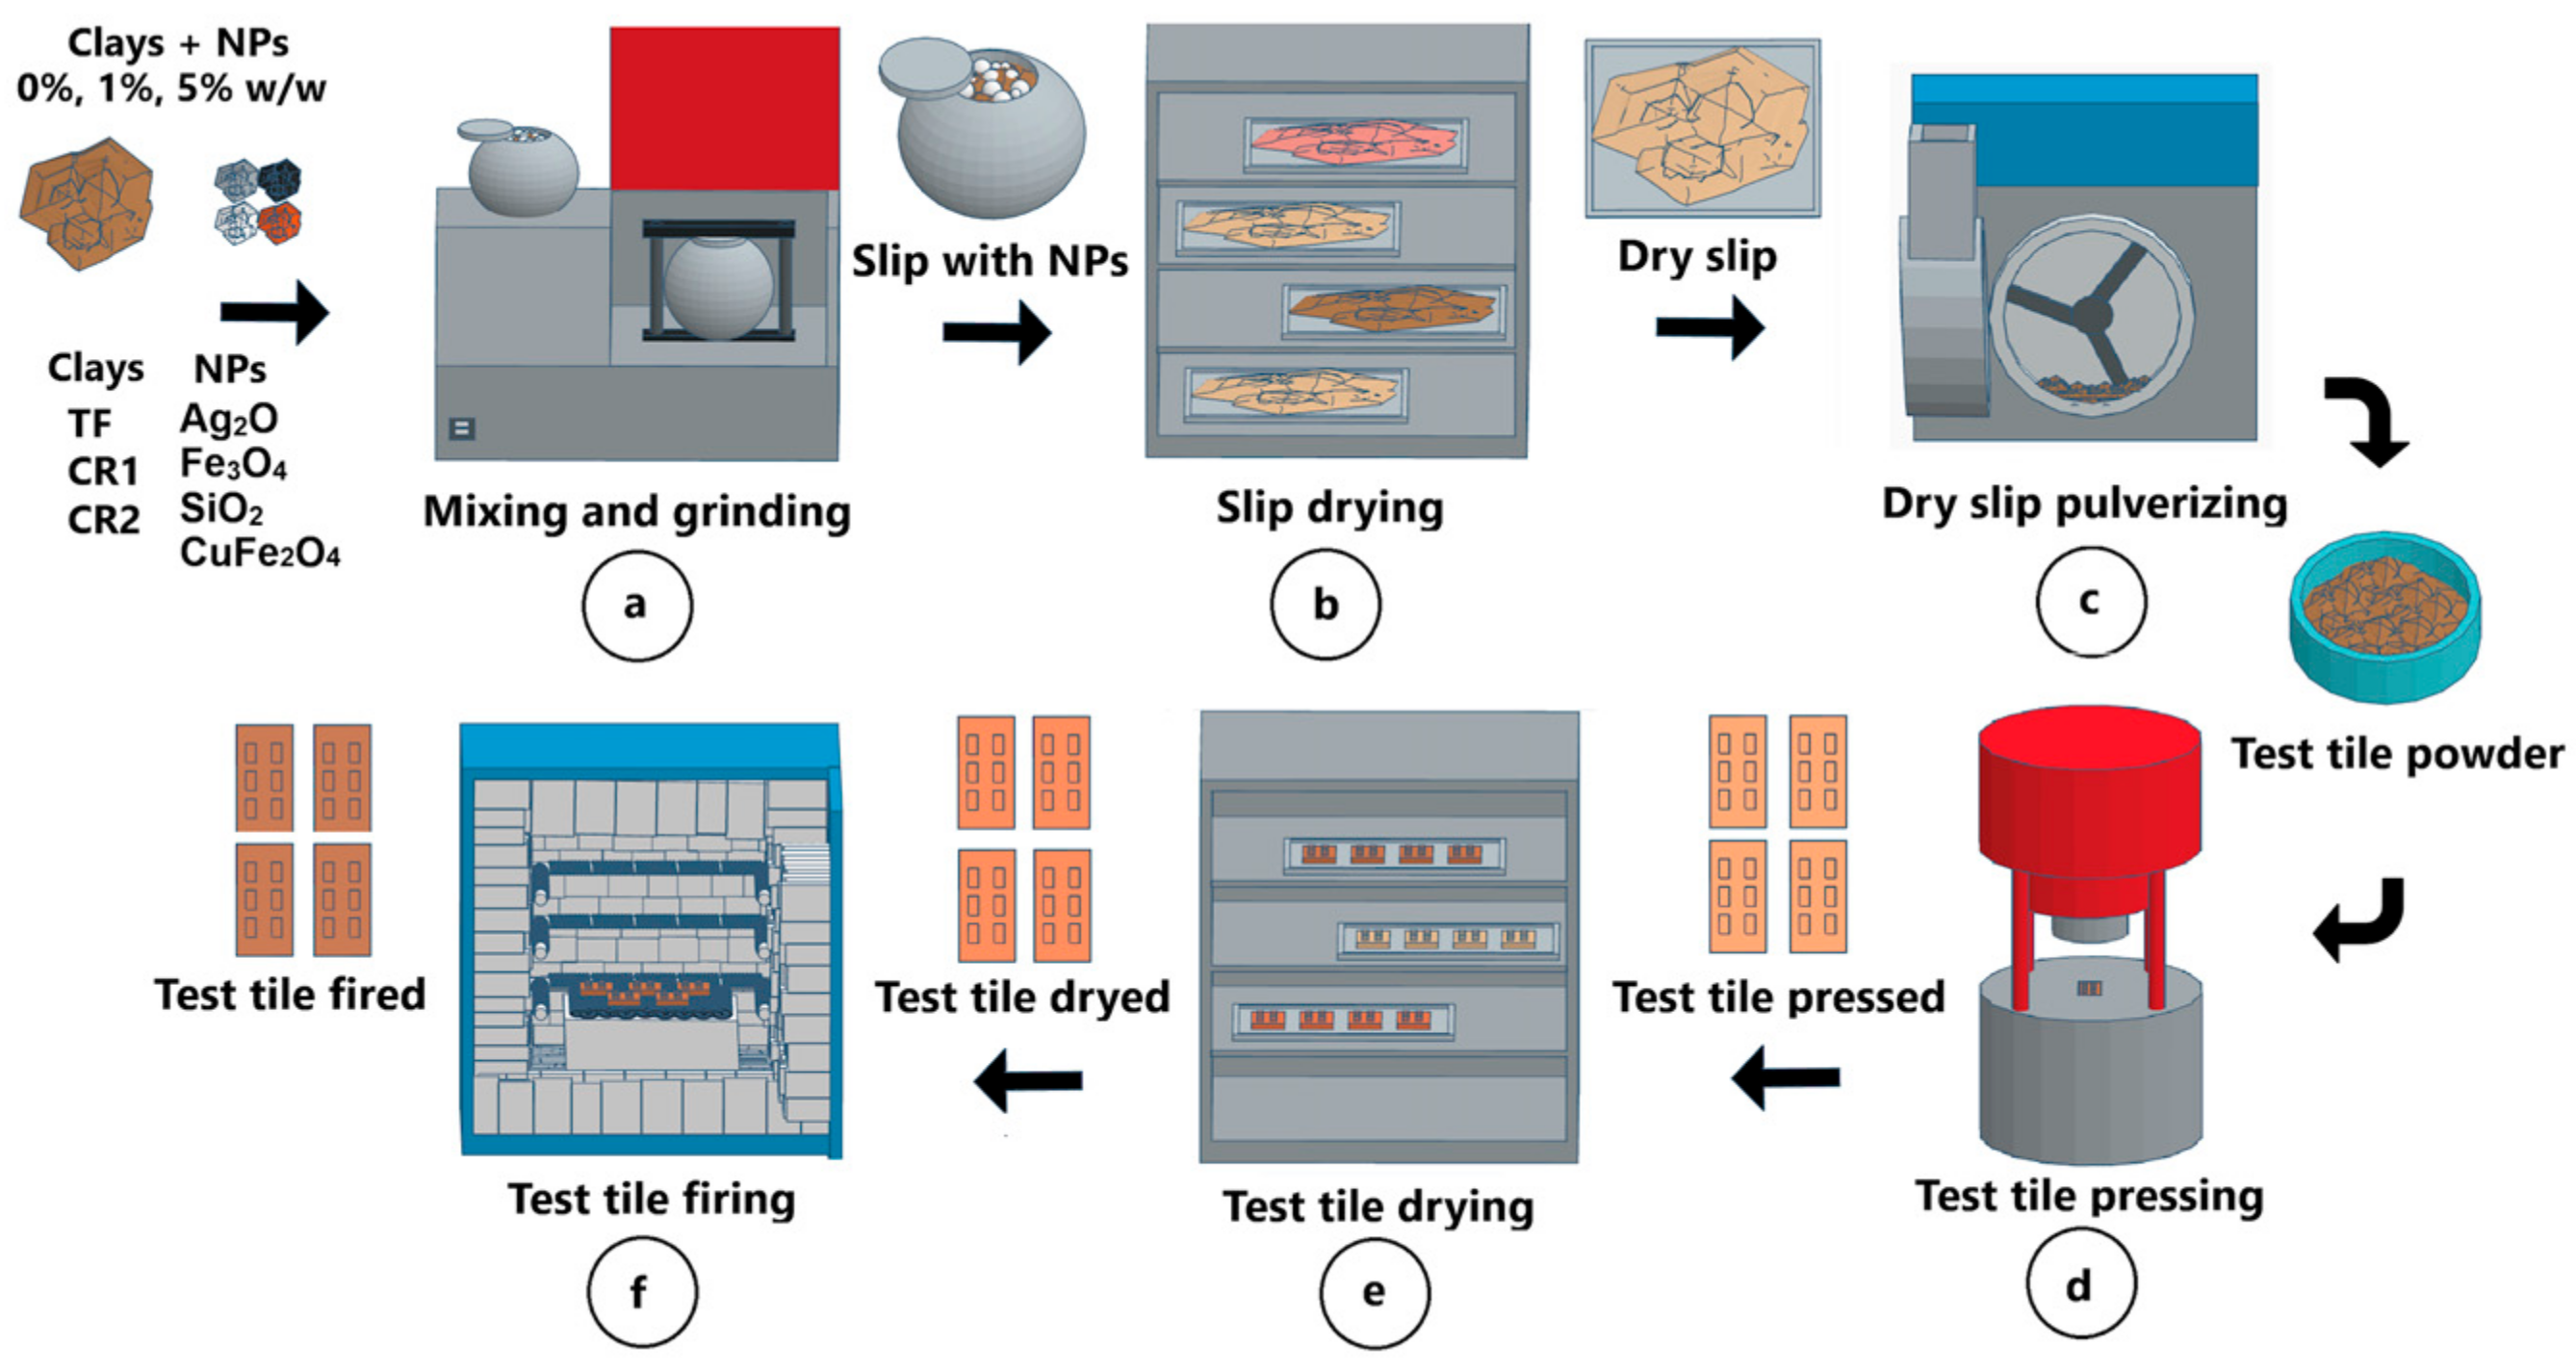
2.3. Test Tiles Manufacturing Process

The general manufacturing process for the sample tiles is shown in Figure 1. The mixing and milling process started with the preparation of 500 g of dry sample mass (Dsm) of each clay TF, CR1 and CR2 Figure 1a. Initial moisture percentages (%M) were determined for each of the clay samples on the MX-50 moisture analyzer (A&D Company Tokyo, Japan). The wet sample mass (Wsm) for each material was calculated using Equation (1) [56]:
W s m = D s m 100 M × 100 %
The amount of water for the grinding process was calculated based on the relation of 65% solids (S) and 35% water (W) by Equation (2) [57]:
A m o u n t   o f   w a t e r = ( D s m × W ) S
Also, the net amount of water to be added to the sample was calculated using Equation (3) [57]:
N e t   w a t e r   a d d e d = A m o u n t   o f   w a t e r W s m
Then, 750 g of alumina balls in three different sizes were loaded into grinder container GT0535. The first size was about 10–14 mm in diameter, corresponding to 15% of the load weight, the second size was 16–19 mm in diameter, corresponding to 35% of the load weight, and finally, the third size was 20–25 mm, corresponding to 50% of the load. For the 0% (w/w) concentration of nanoparticles, each of the clays was ground separately; the 500 g dry base, the net amount of water and additives (deflocculant) were added to the GT0535 vessel and then ground in the Speedy 1 for 5 min to obtain the slip. In the case of grinding clays with 1% and 5% (w/w) concentration of nanoparticles (Ag2O, CuFe2O4, Fe3O4 and SiO2), the dry basis reference was the same, i.e., the sum of the dry mass of clay and nanoparticles was 500 g. The density (g/cm3) and viscosity (g/cm·s) conditions were measured in the GT0151 pycnometer and FC/100/A viscometer, respectively. The slip was deposited on the metal tray, and drying was carried out in DVS600 at a temperature between 150 °C and 170 °C for 120 min (Figure 1b). When the dry sample was obtained, it was ground in CT-12061, moistened according to the plasticity index (5.6%), sieved in GT0452, and reposed for 20 min Figure 1c.
For the pressing process of the test tile (Figure 1d), 85 g of material were weighed for each of the test pieces at a pressure of 240 Bar in the manual press P.I.L.A. type. Four rectangular test tiles of dimensions 100.5 mm in length, 50 mm in width and thickness of 7.5 mm were obtained by each nanoparticle clay mixture (0%, 1% and 5% w/w). Then, each test tile was dried at 140 (±5) °C in oven WTC for 120 min, obtaining a humidity of less than 1% by weight (Figure 1e). After drying, each test tile was measured for length (L dry), width (A dry), and weight (Wdry) with the Vernier caliper 530-104BR and the GF-10002A weighing machine.
The automatic firing cycle in the N 20/HR oven was 37 min: 560 °C for 9 min, 570 °C for 3 min, 1120 °C for 4 min, 1120 °C for 3 min, 570 °C for 3 min and 560 °C for 15 min. Then, the kiln temperature gradually decreased to 100 °C, and then down to room temperature during a period of 24 h Figure 1f. Then, measurements of length (L fired), width (A fired) and weight (W fired) were obtained with the vernier caliper 530-104BR and the GF-10002A weighing machine. Figure 2 shows all types of test tiles of clays TF, CR1 and CR2 fired at 1120 °C. All tiles manufactured in this study follow the methodology described in this section.

2.4. Method for Calculating Percentage Linear Shrinkage (%LS), Loss on Fire (%LOF), Water Absorption (%WA) and Flexural Strength

We obtained the dimensional measurements for each dry (L0) and fired (L1) test tile with the 530-104BR equipment. Each sample represents three replicates. The firing linear shrinkage (LS%) was calculated for all test tiles using Equation (4) [42,57]:
L S = L 0 L 1 L 0 × 100 %
The fired test tile (W1) and dry test tile (W0) were weighed on GF-10002A. The loss on fire (LOF%) was calculated for all test tiles using Equation (5) [57,58]:
L O F = W 1 W 0 W 1 × 100 %
The percentage of water absorption (%WA) was determined according to the ISO 10545-3 standard [59]. The flexural strength was made in three replicates to determine the value of the flexural strength (N) test according to the ISO 10545-4 standard [60] on strength tester CR4-650.

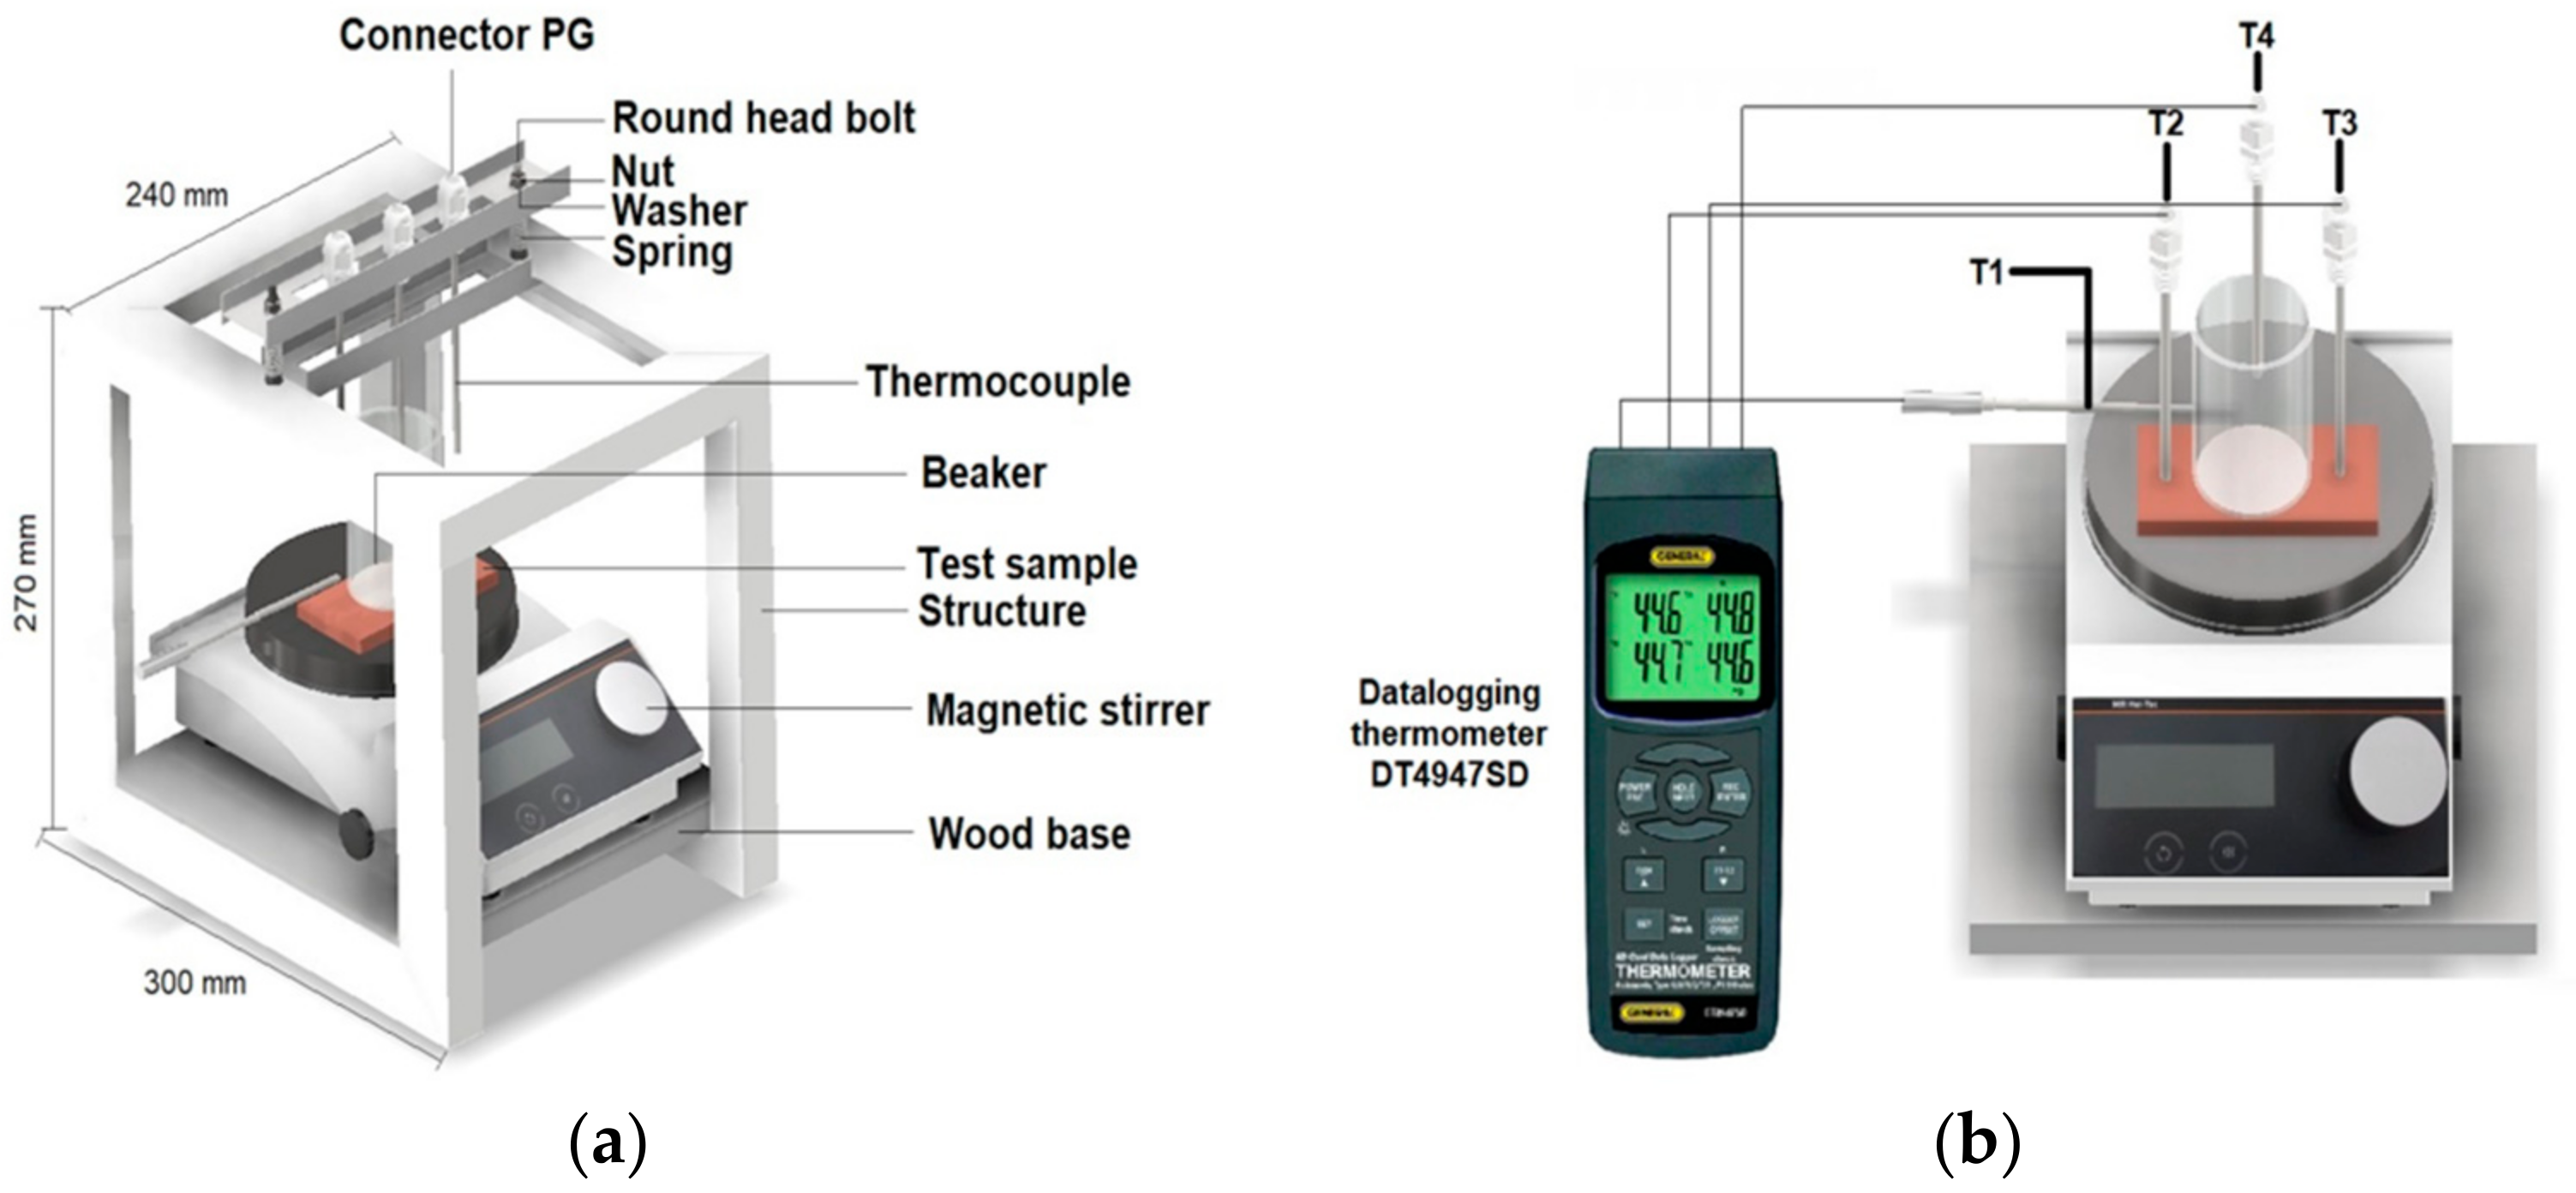
2.5. Apparent Thermal Conductivity Test

The thermal conductivity of a material represents the heat flow per unit thickness through a surface area, driven by a temperature gradient of one unit, while adhering to specific conditions [61,62,63]. The operating technique was based on the principle of heat transfer by steady-state conduction under laboratory conditions between the test tile at room temperature and a hot plate (Figure 3). For the measurement and storage of temperature data, it used the data-logging thermometer DT4947SD and 4 K-type thermocouples to obtain the temperature measurements.
In the apparatus assembly, the thermocouple 1 is connected to the magnetic stirrer plate surface, thermocouples 2 and 3 are positioned on the right and left side of the test sample, respectively, and thermocouple 4 is put inside the beaker with water. It was verified that the thermocouples were correctly connected to the data-logging thermometer DT4947SD. For the measurement of the temperature gradient, the temperatures of the thermocouples T1 (temperature of the magnetic stirrer MR Hei-Tec) and T4 (temperature of the water in the beaker) were taken as references in order to determine the delta of temperature (ΔT), which indicates the amount of heat transferred by the piece to the beaker with water. Once the stirrer was turned on and its set point was set at 100 °C, the beaker was filled with 100 mL of treated water. The data-logging thermometer was turned on, and the K-type thermocouples T1, T2, T3 and T4 were connected, then the test started.
The test sample was placed on the magnetic stirrer as centered as possible for uniform heat absorption, thermocouple T1 was placed on the stirrer plate, thermocouples T2 and T3 were lowered to make contact with the test sample, and thermocouple T4 was placed inside the beaker filled with water. Each sample represents three replicates. Data-logging was started and set to capture the data every 10 s for 15 min (t time). Then, the data-logging thermometer recording was stopped, and the beaker and thermocouples were removed. The data was exported to an Excel database, where the equation of the line was calculated for T4 (Ti initial and Tf final temperature) to obtain the slope (temperature gradient) and measure the increase of the water temperature. The temperature gradient was calculated by Equation (6).
T e m p e r a t u r e   g r a d i e n t   m i n = T i T f / t

2.6. Characterization of Clays

Three clays (TF, CR1 and CR2) were tested with used clays in the manufacturing process of monoporosa cerasmic tile bodies in Colombia. A physical-ceramic characterization of their linear shrinkage (%), fire losses (%), water absorption (%) and flexural strength (Newtons) and temperature gradient (°C/min) properties was determined according to ISO 13006 [21] and ISO 10545-4 [60]. The temperature gradient (°C/min) was determined by respective test. The chemical compositions of clays were examined by X-ray fluorescence spectroscopy.

2.7. Study of Nanoparticles Selection

TF clay was used as a model for screening nanoparticles of Ag2O, CuFe2O4, Fe3O4 and SiO2. Mixtures (w/w) of TF with nanoparticles at 0%, 1% and 5% were tested. Variables of water absorption, temperature gradient and flexural strength were measured on each test tile. A physical-ceramic characterization of their linear shrinkage (%), fire losses (%), water absorption (%) and flexural strength (Newtons) properties was determined according to ISO 13006 and ISO 10545-4. The temperature gradient (°C/min) was determined by the respective test.

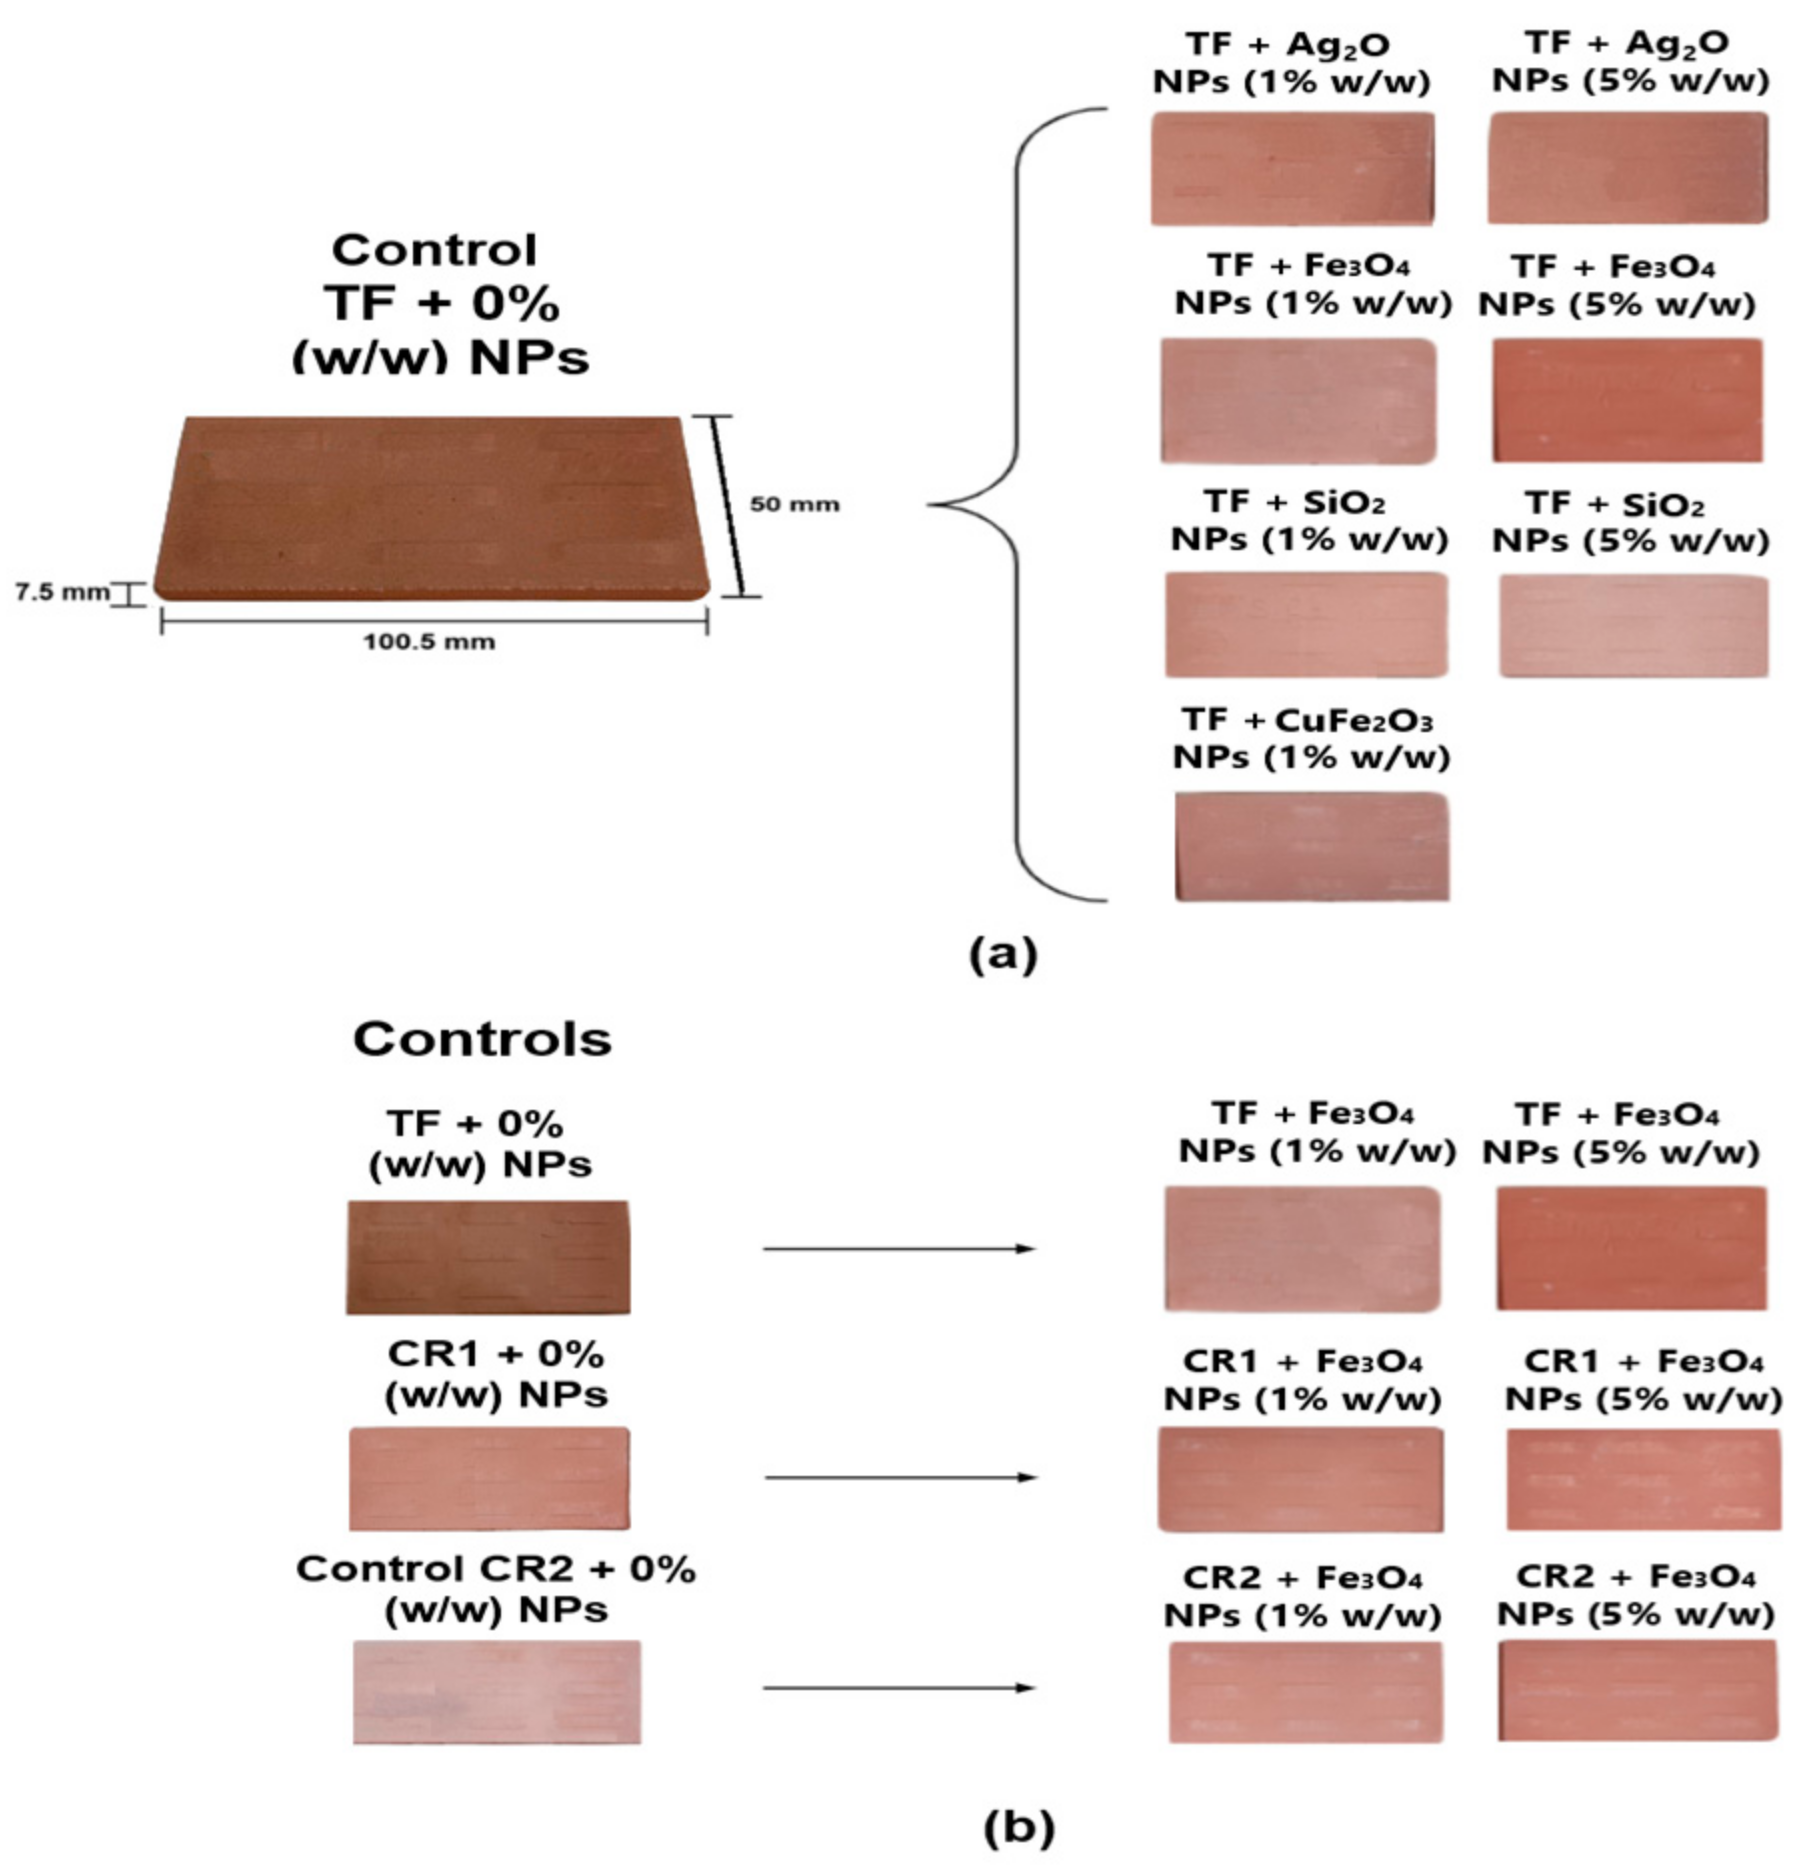
2.8. Study of Clays with Nanoparticles Addition

Nanoparticles with the best apparent thermal conductivity and flexural strength properties were also used, in addition at 0%, 1% and 5% (w/w) with CR1 and CR2 clays, to evaluate the effectiveness in linear shrinkage (%), fire losses (%), water absorption (%) and flexural strength (N) properties, determined according to ISO 13006 and ISO 10545-4, in these clays. The temperature gradient (°C/min) was determined by respective test.

2.9. Microstructural and Morphological Analysis TF Test Tile with Fe3O4 Nanoparticles Addition

The microstructure of the test tile fired was investigated using scanning electron microscopy (SEM) equipped with an energy dispersive X-ray spectroscopy detector (Coxem-CX200). To analyze the total percentage of porosity in TF test tile with Fe3O4 nanoparticles at 0%, 1% and 5% (w/w). Image processing software (ImageJ, version 1.54) was utilized. The total porosity percentage was calculated by comparing the pore area to the total area of the SEM image [43,44]. Three images were analyzed for each formulation.

2.10. Life Cycle Assessment

The LCA study, conducted in accordance with ISO 14040 guidelines [64], aimed to comprehensively evaluate the potential environmental impacts of ceramic tile production processes, specifically focusing on the use of CR1, CR2 and TF clays with magnetite (Fe3O4) nanoparticle additions at 0% and 1% (w/w). This assessment was based on an attributional “cradle to gate” approach encompassing laboratory-scale processes.
The life cycle impact assessment was carried out with Open LCA® software V1.11.0, using the Ecoinvent 3.8 database. The selection of impact categories was the ReCiPe 2016 midpoint (H) method, considering eighteen impact categories: fine particulate matter formation (FPMF), fossil resource scarcity (FRS), freshwater ecotoxicity (FE), freshwater eutrophication (FEP), global warming (GW), human carcinogenic toxicity (HCT), human non-carcinogenic toxicity (HNCT), ionizing radiation (IR), land use (LU), marine ecotoxicity (ME), marine eutrophication (MEP) mineral resource scarcity (MRS), ozone formation, human health (OF-HH), ozone formation, terrestrial ecosystem (OF-TE), stratospheric ozone depletion (SOD), terrestrial acidification (TA), terrestrial ecotoxicity (TE), and water consumption (WC).
Figure 4 shows the system boundaries were set from the use of raw materials until the obtaining of the sample tiles. It only considered the materials, water and energy consumption in the ceramic process production and magnetite synthesis manufacturing. The functional unit for the ceramic process was 420 g of material, and the functional unit for the nanoparticles was 5 g. The general unit of the process was the test tile with clays and nanoparticles.

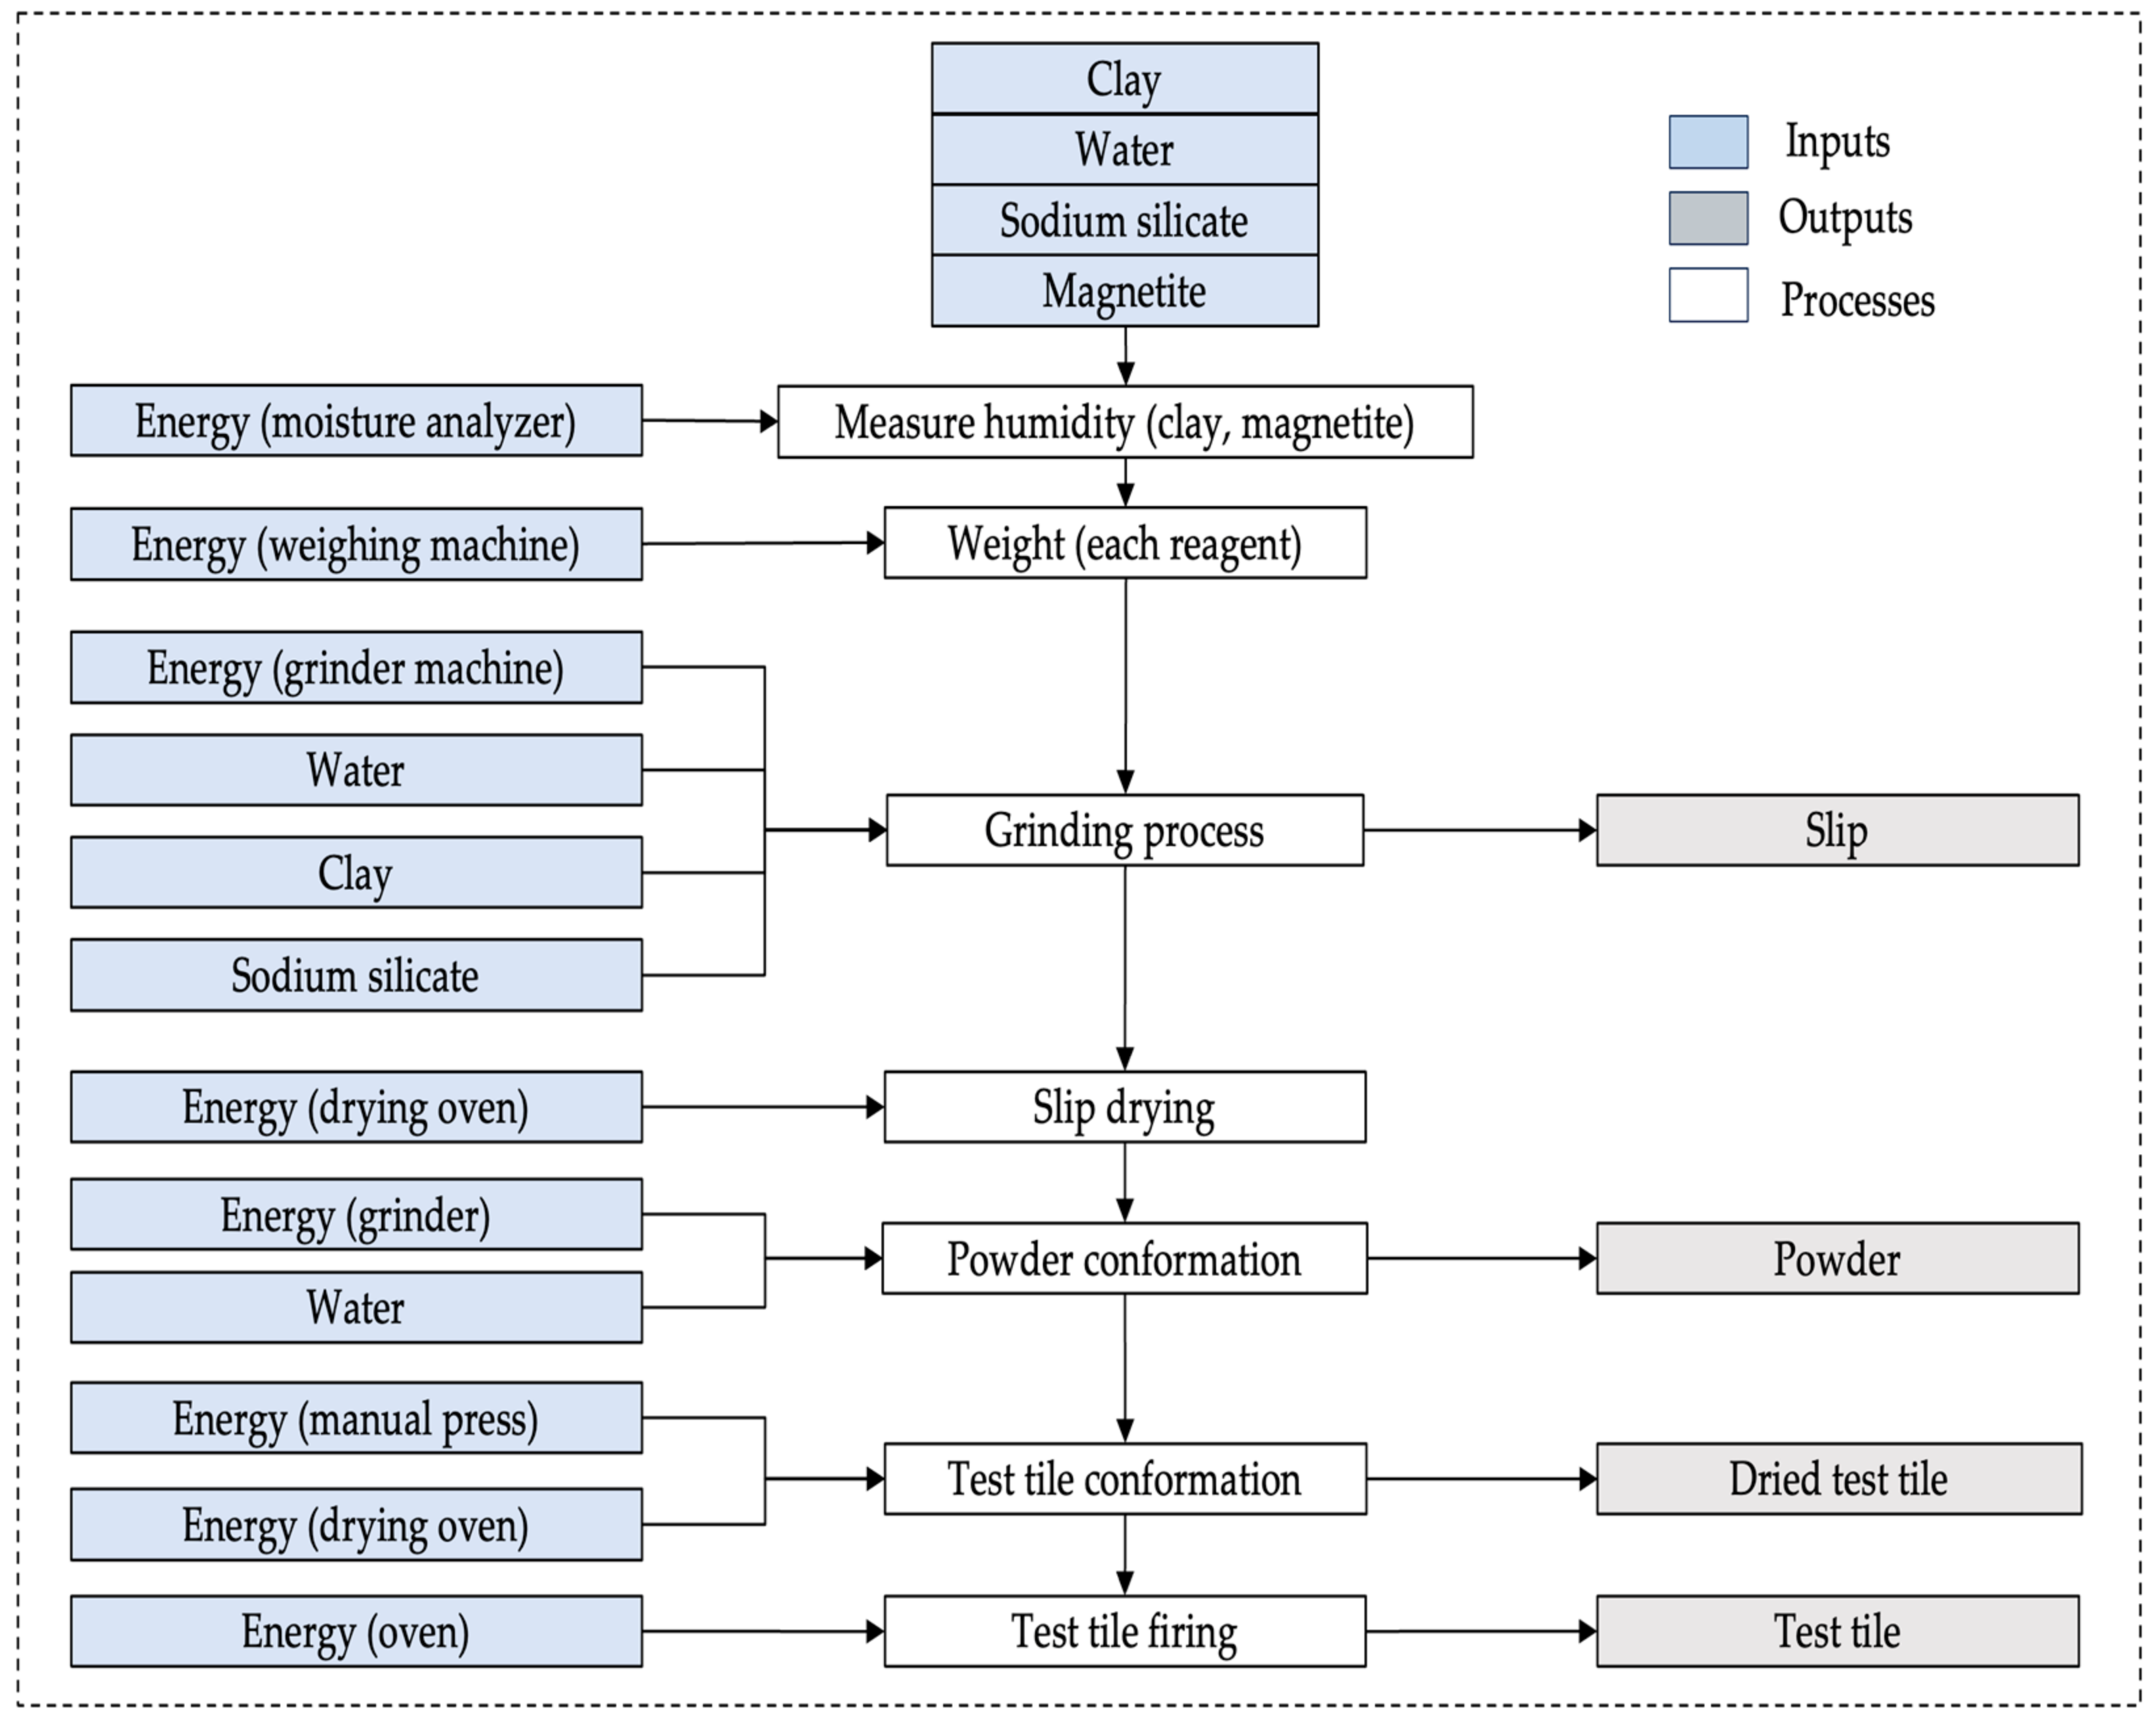
2.11. Life Cycle Inventory (LCI)

The inventory of the relevant flows in the use of reagents and energy processes was carried out for the LCA study. Data on the input of raw materials, water and energy used in the ceramic process were captured in situ. Table 2 shows the inventory report for each manufacturing process of test samples, raw materials, measurement equipment, water consumption and energy required for the process. The clay type incorporated in the inventory report was generic for TF, CR1 and CR2 with the magnetite nanoparticles addition at 0% and 1% (w/w).

3. Results

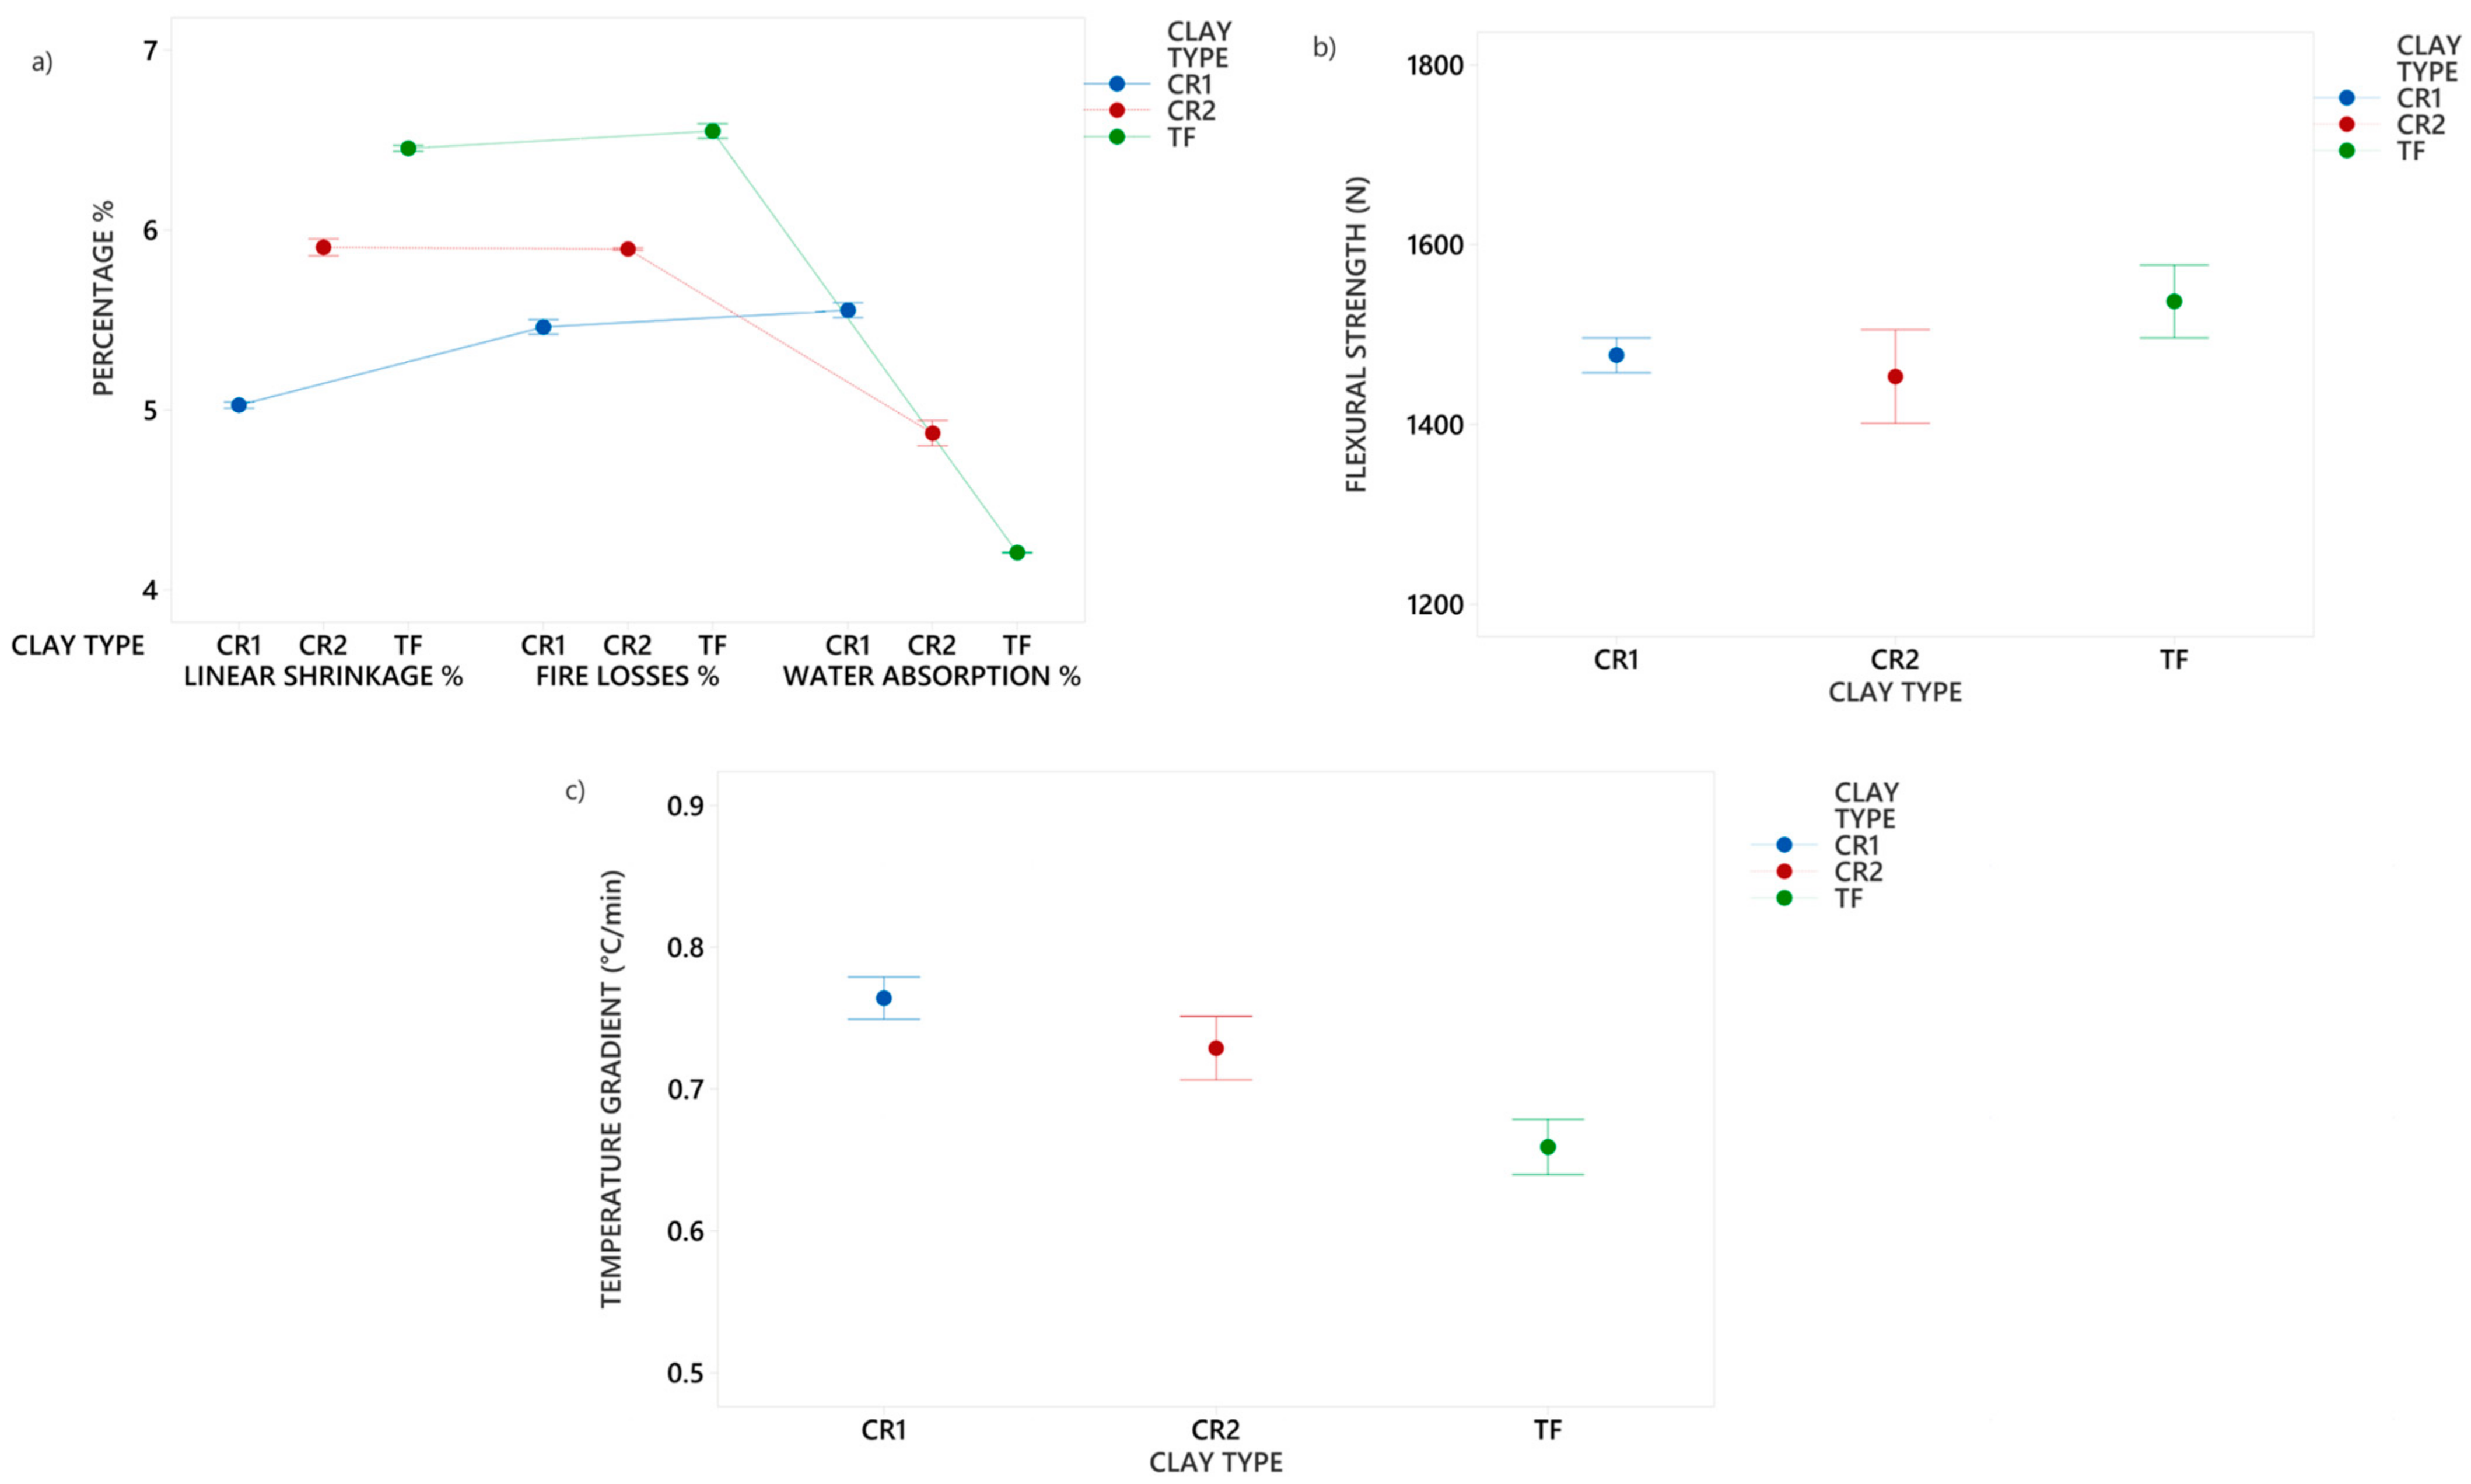
3.1. Characterization of Clays

Chemical analyses of CR1, CR2 and TF clays by XRF (see Table 1.) reveal a high content of silicon (SiO2) and aluminum (Al2O3), which represent more than 80% of the total content. The presence of iron was evidenced by the red color of the sample tiles after firing [3]. All three clays contain iron oxide (Fe2O3); these do not exceed 4.4% by weight. Consequently, these samples are considered silicoaluminous clays, in line with the presence of silicates according to X-ray diffraction (Table 3).
The test results for the ceramic characterization of CR1, CR2 and TF clays have been consolidated in Figure 5. The linear shrinkage is associated with the progressive sintering effect up to 1120 °C; greater shrinkage also results in increased mechanical properties [42]. Therefore, TF clay showed the highest percentage up to 6.5%. The fires losses of test tiles are associated with the elimination of organic matter and dihydroxylation of clay minerals (kaolinite) in the samples. The clay with the highest percentage of kaolinite (45%) was TF; consequently, it obtained 6.6% of fire losses.
Water absorption is an indicator of the densification and mechanical properties of ceramic tiles, based on the number of open pores accessible to water within the fired sample and the relationships with linear shrinkage follow an inverse correlation. In addition, it was observed that the relationships between water absorption and linear shrinkage have an inverse correlation [65]. The TF clay was the test tile with the lowest percentage of water absorption (4.2%) compared with CR1 and CR2 clays. All clays exceeded the 800 N of flexural strength established by the ISO 13006 standard. TF clay represents the highest value in flexural strength (1591 N). In comparison to the other clays, TF clay demonstrated a 14% increase in flexural strength relative to CR1 clay and a 9% increase compared to CR2 clay. This notable increase in flexural strength in TF clay is attributed to its high linear shrinkage (6.5%) and low water absorption (4.2%). Therefore, TF clay has a higher level of sintering at 1120 °C [66].
Regarding the temperature gradient, CR1 and CR2 clays recorded the highest values, at 0.74 and 0.73 °C/min, respectively (see Figure 5c). In contrast, TF clay exhibited the lowest temperature gradient, at 0.66 °C/min. This suggests that TF clay underwent a smaller temperature fluctuation during the test in comparison to the other clays [58]. Some studies report that the increase in thermal conductivity is associated with high density, lower water absorption and high flexural strength [67,68,69,70].

3.2. Study of Nanoparticles Selection

Four types of nanoparticles (Ag2O, CuFe2O4, Fe3O4 and SiO2) at three concentrations (0%, 1% and 5% w/w) were tested on TF clay to determine the best-performing one, as measured by the five variables shown in Figure 6.
Findings regarding linear shrinkage showed increases in the test tile mixtures at 1% and 5% (w/w) CuFe2O4 (14–15%), Fe3O4 (12–34%) and SiO2 (9–43%) NPs, and decreases for Ag2O NPs (15–12%) compared to the 0% (w/w) mixture. Fire losses (Figure 6b) decreased up to 10% with Ag2O, and up to 5% with Fe3O4 at 1% and 5% (w/w) nanoparticle additions, and showed an increase of fire losses with CuFe2O4 and SiO2 nanoparticle additions, up to 3% and 2% nanoparticles additions, respectively. For water absorption (Figure 6c), Ag2O nanoparticles caused an increase up to 26% and 25% at 1% and 5% (w/w) to the 0% (w/w) mixture. This increase is caused by the appearance of a liquid phase that facilities porosity closure [71]. The addition of CuFe2O4 nanoparticles resulted in a decrease in water absorption of up to 33% and 26% at 1% and 5% (w/w), respectively. The addition of Fe3O4 nanoparticles caused a significant decrease in water absorption of up to 40% and 30% at 1% and 5% (w/w), respectively, compared to the 0% (w/w) mixture. In contrast, the addition of SiO2 nanoparticles resulted in an increase in water absorption of up to 14% and 28% at 1% and 5% (w/w), respectively, compared to the 0% (w/w) mixture. Finally, it is positive to find a low water absorption percentage because it means an adequate sintering rate or low porosity, and results in a higher flexural strength on ceramic tiles [54,66,72].
Figure 6d illustrates the flexural strength of each TF clay test tile. Only the TF clay test tiles with CuFe2O4 and Fe3O4 nanoparticle additions showed an increase in flexural strength up to 9% and 16%, respectively, at 1% (w/w) compared with the 0% (w/w) mixture. The low water absorption (2.8% and 2.5%) at 1% (w/w) magnetite nanoparticles indicate a higher density of the test tile and, consequently, a higher flexural strength (1787 N) promoted by the formation of a crystalline and liquid-phase developed at low-temperature associated with the iron oxide content [73,74,75]. Test tiles with the addition of Ag2O and SiO2 nanoparticles decreased the flexural strength by 13–16% and 1–5%, respectively, at 1% and 5% (w/w), compared at 0% mixture. The decrease in flexural strength can be due to reduction in the anorthite content generated by Ag2O and SiO2 nanoparticle additions [76]. CuFe2O4 and Fe3O4 nanoparticles showed a decrease in flexural strength by 2% and 1%, at 5% (w/w) with respect to the 0% (w/w) mixture. One of the causes is that the high iron oxide content generated an excess of liquid phase, which deteriorated the properties and the formation of high porosity structures [77,78]. Flexural strength results of the test tiles exceeded the value established (800 N) by ISO 13006 standard for ceramic tiles of group BIIb.
The temperature gradient from each TF clay test tile is illustrated in Figure 6e. All mixtures with 1% and 5% nanoparticles showed an increase in the temperature gradient with respect to the mixture with 0% nanoparticles addition. Test tiles with the addition of Ag2O and SiO2 nanoparticles at 1% and 5% (w/w) demonstrated a similar increase of temperature gradient of up to 24% and 21%, respectively. Test tiles with the addition of CuFe2O4 nanoparticles showed an increase of temperature gradient up to 18%. The temperature gradient increase for the test tiles with the addition of 1% and 5% (w/w) Fe3O4 nanoparticles was 32% and 28%, respectively. This increase is due to the decrease in the percentage of water absorption, which determines the density of test tiles. The results suggest that the addition of nanoparticles can improve the thermal properties of TF clay. The iron oxide content contributes to the formation of the glassy phase and favors densification, leading to an increase in thermal conductivity [27,79].
According to the study, magnetite (Fe3O4) nanoparticles at 1% (w/w) evidenced the highest increase in flexural strength (up to 16%) and temperature gradient (32%). From the results obtained, the magnetite (Fe3O4) nanoparticles were chosen to be tested with CR1 and CR2 clays.

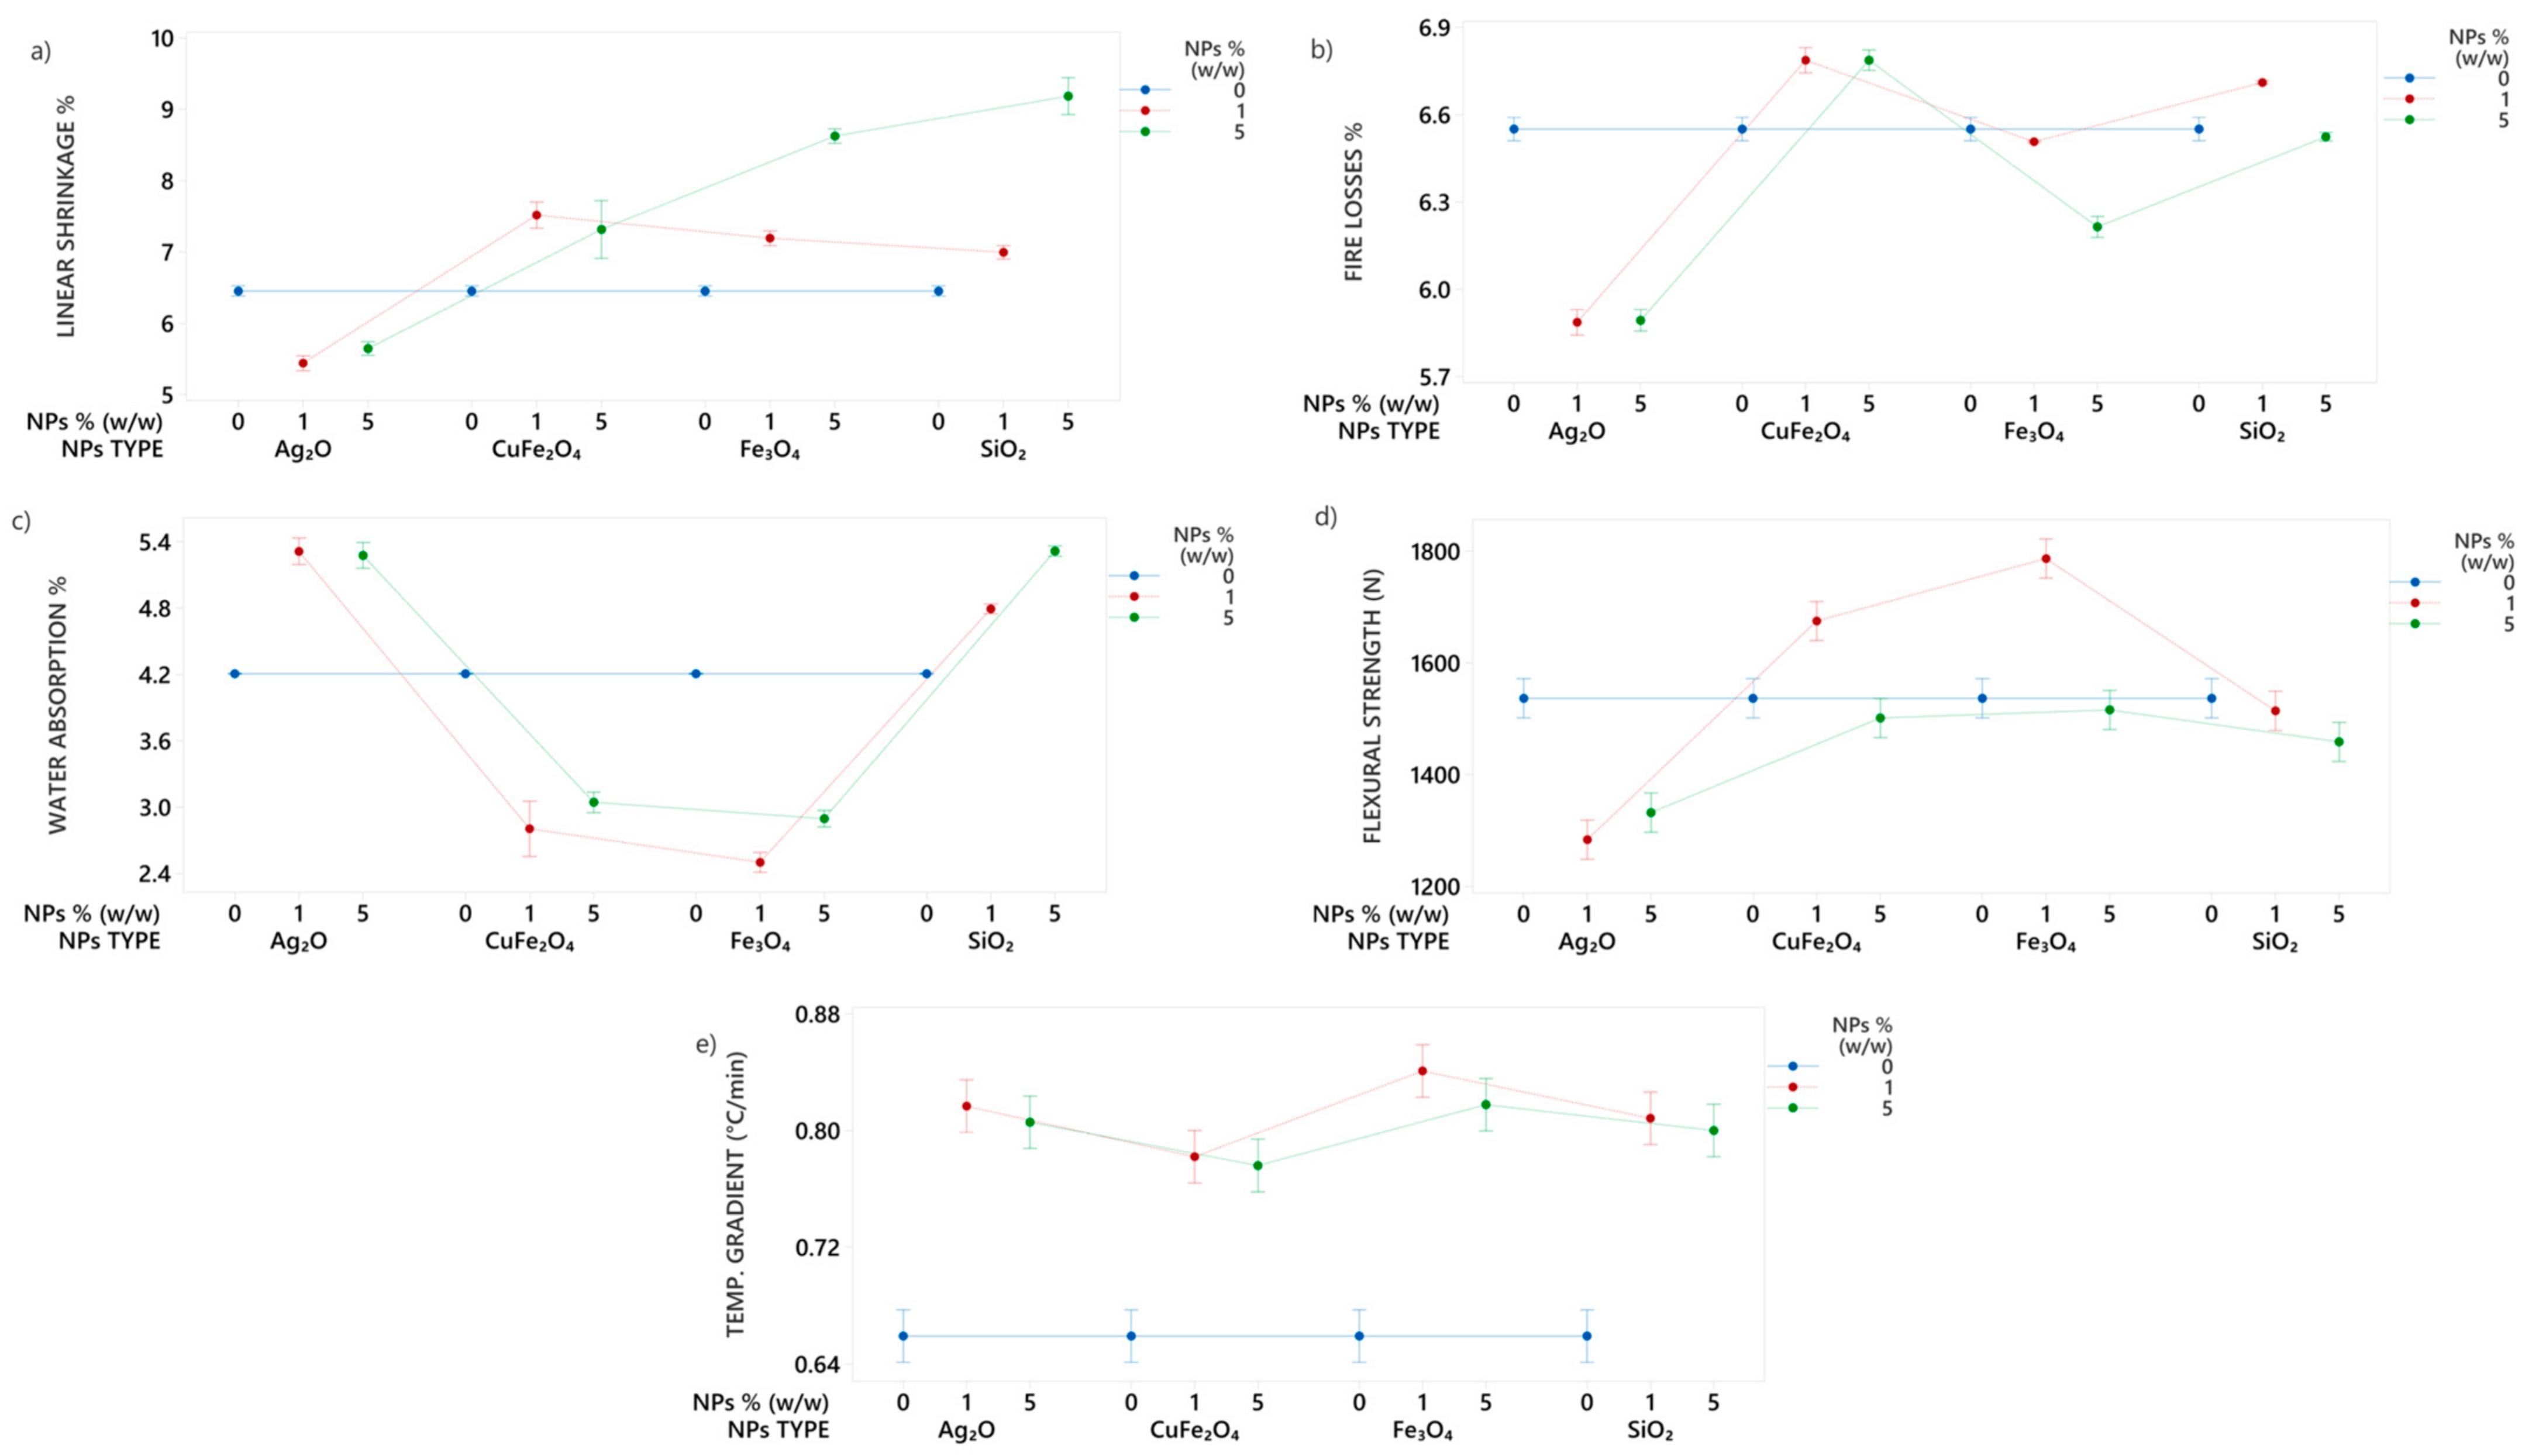
3.3. Study of Clays with Nanoparticles Addition

From the results obtained previously Fe3O4 nanoparticles were chosen to be tested with CR1 and CR2 clays. Figure 7 illustrates the ceramic properties. The linear shrinkage showed increases with Fe3O4 nanoparticles addition at 5% (w/w), in CR1 up to 31%, CR2 up to 35% and TF up to 34%, compared to the 0% (w/w) mixture Figure 7a. In fire losses (Figure 7b), the 1% magnetite mixtures in the clays remained the same, while in the 5% mixtures increased up to 12% in CR1, 2% in CR2 and decreased up to 5% in TF compared to the 0% nanoparticles mixture. Figure 7c, Fe3O4 nanoparticles caused a decrease in water absorption of up to 11% and 6% at 1% and 5% (w/w), respectively, in CR1 clay compared to the 0% (w/w) mixture. For CR2 clay, the addition of Fe3O4 nanoparticles resulted in a decrease in water absorption of up to 13% and 11% at 1% and 5% (w/w), respectively, compared to the 0% (w/w) mixture. These findings suggest that the addition of Fe3O4 nanoparticles at specific concentrations can significantly affect the water absorption of clay materials.
For CR1 clay, Figure 7d shows the addition of Fe3O4 nanoparticles resulted in a flexural strength decrease of up to 2% at 1% (w/w) and up to 12% at 5% (w/w). The flexural strength increased in CR2 clay up to 6% at 1% (w/w) and up to 3% at 5% (w/w) with the addition of Fe3O4 nanoparticles. Notably, the flexural strength results of the test tiles surpassed the standard value (800 N) established by ISO 13006.
Figure 7e represents that the 1% and 5% (w/w) mixtures containing nanoparticles showed an increase in the temperature gradient compared to the 0% (w/w) mixture. In the case of CR1 clay, the temperature gradient increased up to 3% at 1% (w/w) and up to 2% at 5% (w/w) when Fe3O4 nanoparticles were added. For CR2 clay, the temperature gradient increased up to 9% at 1% (w/w) and up to 2% at 5% (w/w) with the addition of Fe3O4 nanoparticles. Nanoparticle additions increased the temperature gradient of clays due to their high specific surface area and reduced size, altering the clay structure and increasing surface reactivity and thermal energy release during firing.
The results of this study indicate that Fe3O4 nanoparticles added at 1% (w/w) are the most effective additive for improving both flexural strength and temperature gradient in CR2 and TF clay. The improvement of the apparent thermal conductivity of TF clay test tiles has increased up to 32%. This improvement in thermal conductivity results in significant energy savings that can be used to optimize drying and firing processes in tile manufacturing. The higher apparent thermal conductivity of the tiles allows faster drying times and lower firing temperatures, which reduces the overall energy consumption of the process. In addition, the use of magnetite nanoparticles at 1% (w/w) is effective in enhancing the flexural strength of test tiles clay (up to 16%), enabling a reduction in thickness without compromising their mechanical properties. By reducing the thickness of tiles, their mass is decreased, resulting in lower energy usage during manufacturing. This leads to significant energy savings in the extraction, transportation, processing, drying, and firing processes. Thus, the incorporation of magnetite nanoparticles improves the sustainability of tile production while also reducing energy and material consumption.

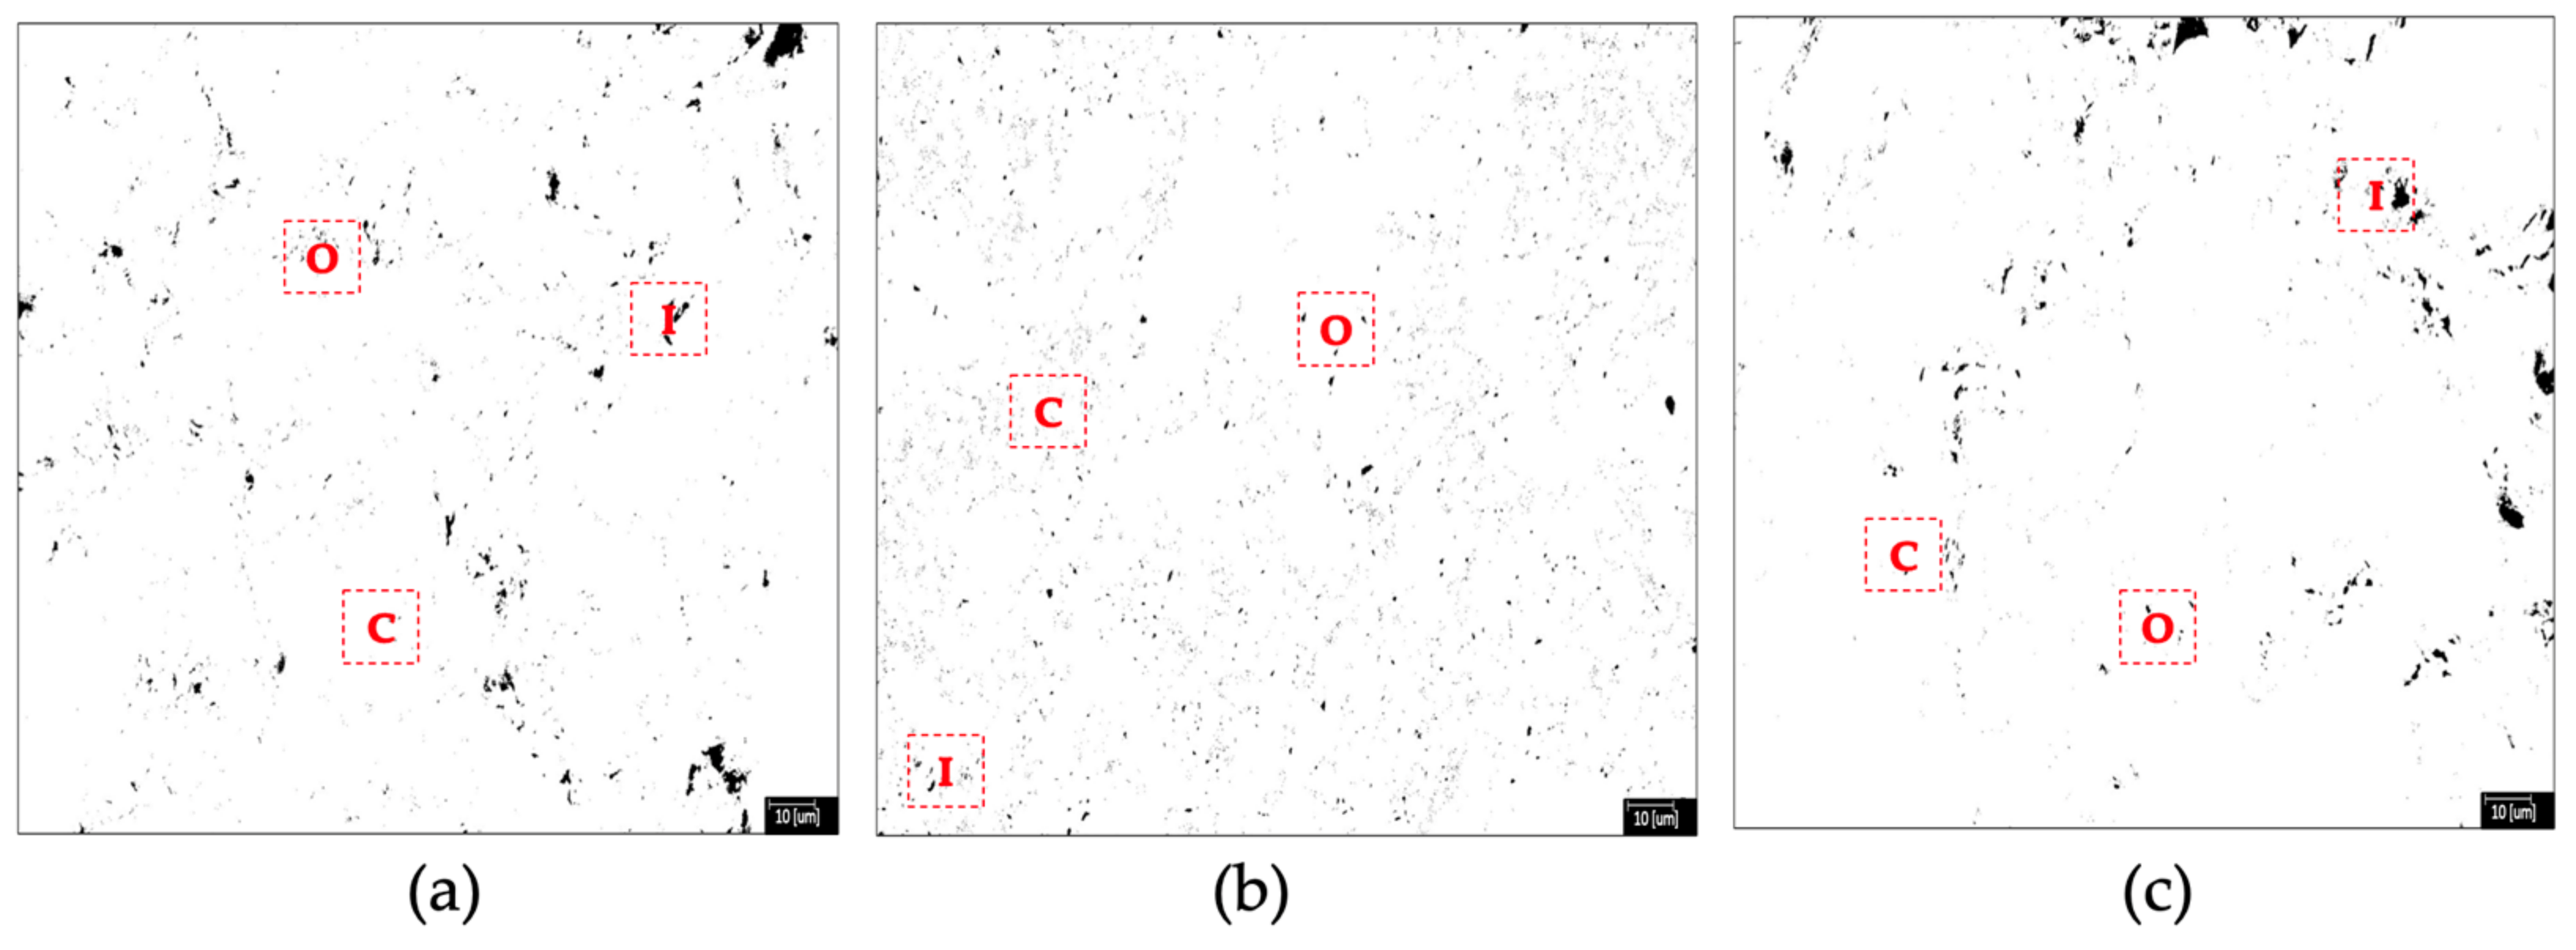
3.4. Microstructural and Morphological Analysis TF Test Tile with Fe3O4 Nanoparticles Addition

Figure 8 displays a SEM micrograph illustrating at 1000× magnification the characteristic structure of TF fired test tiles. Within the microstructure, dark-grey areas denoted as Q represents quartz grains, while black regions labeled as P indicate irregular-shaped pores dispersed amidst a continuous glassy phase, represented by light-grey zones labeled as V [42,80]. Additionally, the EDS shows presence of iron oxide, depicted by bright zones marked as Fe, attributed to the Fe2O3 content in the TF clay (see Table 1) and the transformation of the magnetite Fe3O4 [81].
The total porosity percentage and sample size of the TF clay and magnetite nanoparticles were carried out using ImageJ (version 1.54) image processing software [82,83,84]. In their morphology (Figure 9), all test tiles, whether control or with nanoparticles addition, showed different types of porosity (black zone), open (O), closed (C) and interparticle (I) [85]. Open porosity, characterized by interconnected and irregularly shaped pores of small sizes is present. Additionally, closed porosity is represented by spherical isolated pores of large sizes, while interparticle porosity is associated with irregularly shaped pores situated at crystalline grain boundaries [86,87]. This final porosity has its origin in the different coefficients of thermal expansion between the glassy and crystalline phases. Table 4 shows test tiles with 1% of nanoparticles addition display a reduction in pore formation (1.246%), hinting at potential improvements in sintering behavior [88]. This decrease in porosity is related to low water absorption and high flexural strength of TF clay with magnetite NPs addition.

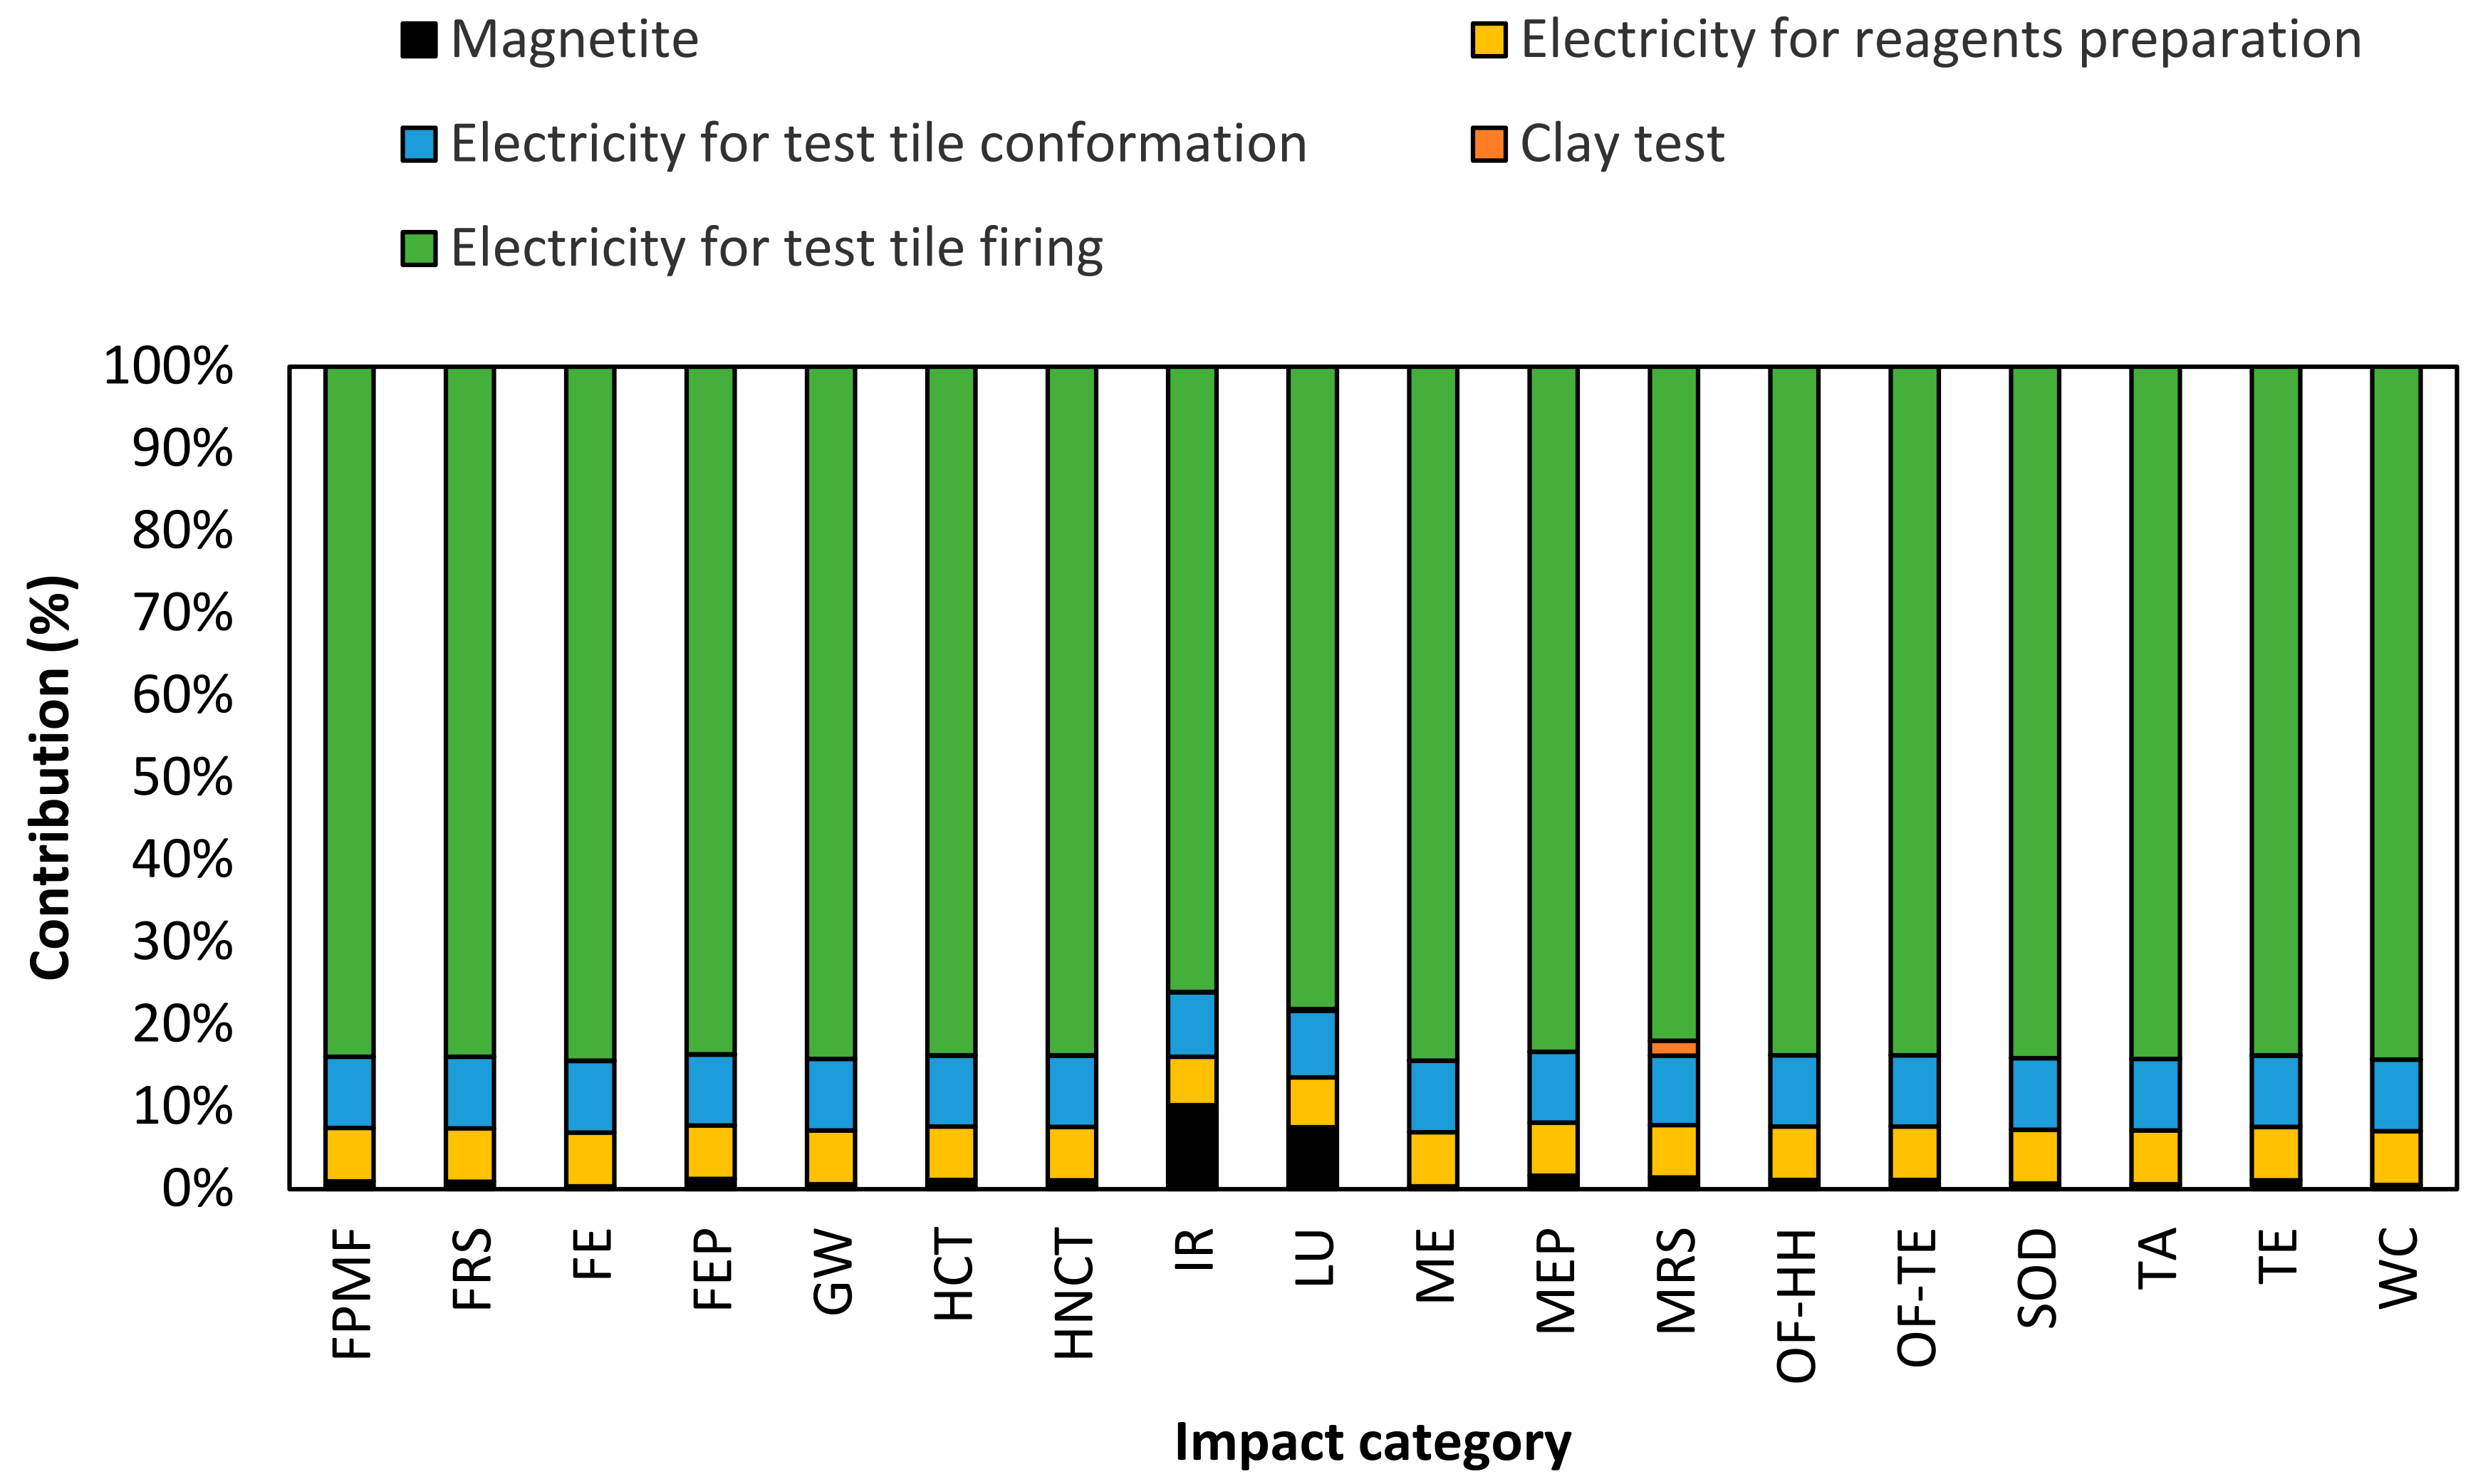
3.5. Life Cycle Assessment of Test Tile Clay Manufacturing

This life cycle analysis was conducted to assess the potential environmental impacts of the ceramic tile production processes using CR1, CR2 and TF clays. Specifically, the analysis evaluated the impacts of producing ceramic tiles without nanoparticles addition and magnetite (Fe3O4) nanoparticles addition at 0% and 1% (w/w).
These results do not evaluate the toxicity and carcinogenicity of the test tiles by the nanoparticles addition. Instead, they focus on the environmental impacts generated from raw material extraction to final product manufacturing (cradle to gate), encompassing raw materials and energy consumption. These environmental impacts are reflected in the life cycle assessment indicators of each process.
Figure 10 presents information on the life cycle assessment of the manufacture of test clay tiles without nanoparticle addition (0% w/w). LCIA results showed that the electricity contributes up to 100% to the total of all impact categories. This result can be explained by high consumption of electrical energy in all processes, especially the firing process (85%), due to the high temperature (1120 °C) and longtime exposure required to achieve the end properties [9,89,90]. Findings indicated that the greatest negative impacts were terrestrial ecotoxicity, global warming and non-carcinogenic human toxicity, with contribution values up to 61%, 16% and 14%, respectively.
Figure 11 shows the test tile samples with addition of magnetite (Fe3O4) nanoparticles at 1% (w/w). The LCIA results showed that electricity consumption and magnetite nanoparticles contribute up to 98% and 2%, respectively, in all impact categories. On the other hand, results indicate that the clay does not contribute significantly in the LCA; on average, the contribution was 0.2% in the impact categories. Consequently, negative impacts were observed on the environment, such as terrestrial ecotoxicity, global warming, and human non-carcinogenic toxicity, with contribution values of 99%, 98%, and 95%, respectively. These results highlight the importance of finding ways to reduce electricity consumption and its associated impacts on the environment in both ceramic processes and magnetite synthesis.
Table 5 compiles the outcomes of a life cycle environmental impact assessment (LCIA) conducted on ceramic test tiles incorporating magnetite nanoparticles in two different scenarios. Scenario 1 (without nanoparticles addition—0% w/w) is the baseline case without energy and mass savings, while scenario 2 (with magnetite nanoparticles addition at 1% w/w) includes a 48% energy saving and a 16% mass reduction. This improvement is attributed to a substantial 32% increase in the apparent thermal conductivity and a 16% boost in flexural strength facilitated by the addition of magnetite nanoparticles. Notably, scenario 2 achieved a significant decrease in several environmental impact categories, including a 20% reduction in global warming potential, a 19% reduction in non-carcinogenic toxicity to humans, and a 19% reduction in terrestrial ecotoxicity compared to scenario 1. This reduction was primarily due to the reduced energy consumption and material inputs achieved by improving the thermal conductivity and flexural strength of the tiles. In summary, our findings underscore the potential magnetite nanoparticles integration to mitigate the environmental impacts associated with ceramic tile manufacturing.

4. Discussion

Table 6 shows that studies and patents have been conducted on a range of nanoparticles for various ceramic tile applications. These involve surface functionalization, including coatings, for specialized applications, such as TiO2 for tile self-cleaning, SiO2-TiO2 for photocatalysis, and Ag-TiO2 and Cu for antibacterial activity. The enhancement of specific properties, such as flexural strength and compressive strength in the ceramic body, has been achieved through the incorporation of Al2O3, Fe2O3, PbO and SiO2 nanoparticles. In comparison to previous studies, our research focuses on integration of Ag2O, CuFe2O4, Fe3O4, and SiO2 nanoparticles into ceramic body tiles to enhance their mechanical and thermal properties, specifically their flexural strength and apparent thermal conductivity. This approach reduces energy and material consumption, and mitigates environmental impacts in the life cycle assessment of ceramic manufacturing processes.
The results indicate that the addition of magnetite (Fe3O4) nanoparticles at 1% (w/w) had a positive effect on both flexural strength and apparent thermal conductivity compared to tiles at 0% (w/w) nanoparticles addition. The apparent thermal conductivity related to the temperature gradient was higher in clays with magnetite (Fe3O4) nanoparticles addition: CR1 (+3%), CR2 (+9%) and TF (+32%), at 1% (w/w) compared to nanoparticles addition at 0% (w/w). Studies, such as the one conducted by Wang et al. [91], have demonstrated that certain elements inherent in clays (notably iron (Fe)), significantly influence their thermal, physical, and mechanical properties, including thermal conductivity [66,92,93]. Notably, CR2 and TF clays with 1% (w/w) magnetite (Fe3O4) nanoparticles showed an increase up to 6% and 16%, respectively, in flexural strength. Therefore, the thickness or weight of ceramic tiles can be decreased up to 16% in TF clay without degrading their flexural strength properties [9]. According to Türkmen et al. [54], a 7% reduction in thickness results in a decrease in energy consumption for the spray dryer by 4% and for firing by 9%.
Some previous studies, such as Bazzocchi et al. [19], investigated thinning porcelain stoneware tiles without compromising flexural strength, finding minimal impact from the glass fiber network. Our research achieved a notable increase in flexural strength while lowering energy consumption at 1120 °C firing temperature, enhancing sustainability in ceramic tile production. In contrast, Da Silva et al. [20] achieved a 42% flexural strength increase at 1220 °C, compared to our study, an increase up to 87% was achieved at 1120 °C, demonstrating the reduction in environmental impacts. Additionally, examined reinforced fiberglass to maintain mechanical properties, achieving a 42% increase in flexural strength, emphasizing diverse strategies for ceramic tile enhancement without thickness increase.
Chen et al. [40] explored the effect of incorporating nano-SiO2 particles (mean particle size of 10 ± 5 nm) into ceramic tiles. Their study, incorporating nano-SiO2 fractions ranging from 0 to 3% by weight, revealed a reduction in water absorption to less than 12% at 1100 °C. Additionally, an increase in flexural strength by 0.5–2.5 MPa was observed after the addition of 2% nano-SiO2. In the study by Mahmoud et al. [41], porcelain ceramic tiles were doped with lead oxide (PbO) nanoparticles, which found that as their content in the ceramic body increased from 0.0 to 10.0% wt., the modulus of rupture increased from 1.753 ± 0.07 to 2.674 ± 0.11 MPa, respectively. This improvement was attributed to the partial substitution of the clay mixture in the new ceramic nanocomposites, promoting liquid-phase sintering and higher density in the tiles. A similar trend was noted in the study by De La Garza et al. [42], where the influence of alumina and silica nanoparticles at 1% in porcelain stoneware improved compressive strength (65.27 and 55.37 MPa), confirming the role of nanoparticles in promoting denser microstructures during the sintering process. Additionally, Nawaukkaratharnant et al. [43] reported a notable flexural strength increase with rising firing temperatures, particularly at 3% and 5% wt. Fe2O3, additions, exceeding 30 MPa after firing above 1150 °C. Conversely, the introduction of 7% wt. Fe2O3 negatively impacted flexural strength due to the altered porosity and glassy phase influenced by the Fe2O3 content. The patent by Fix-Fierro et al. [44], conditioned a family of additives such as sodium, potassium, boron, silicon, zinc, and calcium oxides, among others, that form nanometric structures and allow one to obtain a powder capable to decrease the sintering temperature of a ceramic red body from 1180 °C to 1050 °C (up to 13%) due to high fluxing power. Our study confirms that the increase in apparent thermal conductivity is attributed to the higher fluxing power resulting from the addition of 1% magnetite nanoparticles. This effect is enhanced by reducing porosity, as illustrated in Figure 9, allowing for a reduction from 1120 °C to 975 °C in sintering temperature and, consequently, in energy consumption.
The Life Cycle Assessment (LCA) results highlighted the substantial impact of energy consumption during the drying and firing processes of ceramic tiles with magnetite nanoparticle additions at 0% and 1% (w/w). Electricity consumption dominated in all categories, particularly affecting terrestrial ecotoxicity, global warming, and human non-carcinogenic toxicity, contributing 99%, 98%, and 95%, respectively. This result was due to the high temperature (1120 °C) firing process and long exposure [9,89,90,94,95]. The comparison with the other studies presents some difficulties due to different methods and software used, and is a challenge for the LCA community [96].
In comparison to previous research, our study stands out for its innovative approach to reducing energy consumption and improving the properties of ceramic tiles. For instance, Türkmen et al. [54] demonstrated significant decreases in energy consumption during drying and firing, as well as environmental impacts, by reducing tile thickness. Similarly, Blundo et al. [97] found that porous ceramic tiles exhibited considerable environmental impacts, particularly on human health. In contrast, our study evaluated the use of magnetite nanoparticles in ceramic tiles, achieving an up to 48% reduction in energy consumption and improvements in physical properties. Specifically, we observed a 20% decrease in global warming potential and a 19% reduction in non-carcinogenic toxicity and terrestrial ecotoxicity compared to the baseline scenario without nanoparticles. These findings underscore the potential of magnetite (Fe3O4) nanoparticles at 1% (w/w) to mitigate environmental impacts in ceramic tile production.

5. Conclusions

The results of our study open a promising horizon for the future of sustainable ceramic tile production. These findings are not only highly relevant to the ceramic industry, but also extend to the scientific community, emphasizing the pivotal role of nanotechnology in enhancing tile properties and energy efficiency in production. Furthermore, they provide an inspiring vision for the next generation of research and developments in this field, underscoring the significance of innovation in the evolution of ceramic tile production towards new sustainability standards. These conclusions reflect a commitment to a cleaner and more efficient future, where science and the ceramic industry come together to drive progress towards a greener and more sustainable world.
The objective of many companies in the world and especially in the ceramic sector is to reduce their impact on the environment. The ceramic sector is one of the highest in terms of energy and materials consumption. The new technologies and materials have the potential to help the ceramic tiles sector achieve a substantive reduction in this area. This study demonstrated that this can be achieved by adding nanoparticles to the ceramic tile body. Results showed that the addition of magnetite nanoparticles at 1% (w/w) in TF clay improved the apparent thermal conductivity up to 32% and flexural strength up to 16%. In the future, these improvements in the apparent thermal conductivity will allow further exploration and creation of new kinds of products and new uses for them. The nanoparticle additions represent an alternative for reducing the thickness or decreasing the weight of the ceramic tiles without affecting one of the most important mechanical properties, flexural strength.
Furthermore, the LCA to produce test tiles with the addition of nanoparticles was evaluated, and it was demonstrated that an improvement of the apparent thermal conductivity and flexural strength can decrease the energy and materials impacts of the process on the LCA. In the sample tiles manufacturing process, results showed that the electrical energy contributes up to 100% to the total impact on the categories, which most affect terrestrial ecotoxicity, global warming, and human non-carcinogenic toxicity. The findings indicated that Scenario 2 with addition of magnetite nanoparticles at 1% (w/w) significantly reduced the environmental impacts, up to 20% in global warming potential, up to 19% in non-carcinogenic toxicity and up to 19% in terrestrial ecotoxicity compared to Scenario 1 at 0% (w/w).

Author Contributions

Conceptualization, E.L.S. and J.F.O.; methodology, E.L.S.; software, E.L.S.; validation, J.F.O.; formal analysis, E.L.S. and J.F.O.; investigation, E.L.S.; resources, J.F.O.; data curation, E.L.S.; writing—original draft preparation, E.L.S.; writing—review and editing, J.F.O.; visualization, E.L.S.; supervision, J.F.O.; project administration, J.F.O. All authors have read and agreed to the published version of the manuscript.

Funding

This research received financial support from the Vice-Presidency of research and Creation and the School of Engineering at Universidad de los Andes.

Data Availability Statement

The data and contributions presented in the study are included in the article. Further inquiries can be directed to the corresponding author.

Acknowledgments

The authors express their gratitude to Ceramica Italia for their invaluable support in this study, as they generously shared detailed insights into the ceramic process being investigated and played a crucial role in facilitating the successful completion of this research. The authors also would like to thank the Vice-Presidency of Research and Creation and the School of Engineering at Universidad de los Andes.

Conflicts of Interest

The authors declare no conflicts of interest.

References

  1. Almeida, M.I.; Dias, A.C.; Demertzi, M.; Arroja, L. Environmental profile of ceramic tiles and their potential for improvement. J. Clean. Prod. 2016, 131, 583–593. [Google Scholar] [CrossRef]
  2. Boschi, G.; Masi, G.; Bonvicini, G.; Bignozzi, M.C. Sustainability in Italian Ceramic Tile Production: Evaluation of the Environmental Impact. Appl. Sci. 2020, 10, 9063. [Google Scholar] [CrossRef]
  3. Dondi, M.; Raimondo, M.; Zanelli, C. Clays and bodies for ceramic tiles: Reappraisal and technological classification. Appl. Clay Sci. 2014, 96, 91–109. [Google Scholar] [CrossRef]
  4. MECS. World Production and Consumption of Ceramic Tiles (2022). 2023. Manufacturing Economic Studies. Available online: https://ceramicworldweb.com/en/economics-and-markets/world-production-and-consumption-ceramic-tiles-2022 (accessed on 12 October 2023).
  5. Wang, Y.J.; Liu, Y.; Cui, S.; Sun, B.; Gong, X.; Gao, F.; Wang, Z. Comparative life cycle assessment of different fuel scenarios and milling technologies for ceramic tile production: A case study in China. J. Clean. Prod. 2020, 273, 122846. [Google Scholar] [CrossRef]
  6. Mezquita, A.; Monfort, E.; Ferrer, S.; Gabaldón-Estevan, D. How to reduce energy and water consumption in the preparation of raw materials for ceramic tile manufacturing: Dry versus wet route. J. Clean. Prod. 2017, 168, 1566–1570. [Google Scholar] [CrossRef]
  7. Monfort, E.; Mezquita, A.; Vaquer, E.; Mallol, G.; Alves, H.J.; Boschi, A.O. Consumo de energía térmica y emisiones de dióxido de carbono en la fabricación de baldosas cerámicas Análisis de las industrias Española y Brasileña. Boletín De La Soc. Española De Cerámica Y Y Vidrio 2012, 51, 275–284. [Google Scholar] [CrossRef]
  8. Mezquita, A.; Boix, J.; Monfort, E.; Mallol, G. Energy saving in ceramic tile kilns: Cooling gas heat recovery. Appl. Therm. Eng. 2014, 65, 102–110. [Google Scholar] [CrossRef]
  9. Ros-Dosdá, T.; Celades, I.; Monfort, E.; Fullana-i-Palmer, P. Environmental profile of Spanish porcelain stoneware tiles. Int. J. Life Cycle Assess. 2018, 23, 1562–1580. [Google Scholar] [CrossRef]
  10. Delpech, B.; Axcell, B.; Jouhara, H. A review on waste heat recovery from exhaust in the ceramics industry. E3S Web Conf. 2017, 22, 00034. [Google Scholar] [CrossRef]
  11. Delpech, B.; Milani, M.; Montorsi, L.; Boscardin, D.; Chauhan, A.; Almahmoud, S.; Axcell, B.; Jouhara, H. Energy efficiency enhancement and waste heat recovery in industrial processes by means of the heat pipe technology: Case of the ceramic industry. Energy 2018, 158, 656–665. [Google Scholar] [CrossRef]
  12. Mezquita, A.; Monfort, E.; Vaquer, E.; Ferrer, S.; Arnal, M.A.; Toledo, J.; Cuesta, M.A. Energy optimization in ceramic tile manufacture by using thermal oil. Bol. De La Soc. Esp. De Ceram. Y Vidr. 2012, 51, 183–190. [Google Scholar] [CrossRef]
  13. Oliveira, M.C.; Iten, M.; Cruz, P.L.; Monteiro, H. Review on Energy Efficiency Progresses, Technologies and Strategies in the Ceramic Sector Focusing on Waste Heat Recovery. Energies 2020, 13, 6096. [Google Scholar] [CrossRef]
  14. Utlu, Z.; Hepbasli, A. Exergoeconomic analysis of energy utilization of drying process in a ceramic production. Appl. Therm. Eng. 2014, 70, 748–762. [Google Scholar] [CrossRef]
  15. Dincer, I.; Acar, C. Innovation in hydrogen production. Int. J. Hydrog. Energy 2017, 42, 14843–14864. [Google Scholar] [CrossRef]
  16. Martinez Plaza, D.; Cañadas Martinez, I.; Mallol Gasch, G.; Téllez Sufrategui, F.; Rodríguez García, J. A case study of the feasibility of using solar concentrating technologies for manufacturing ceramics. J. Clean. Prod. 2015, 87, 977–991. [Google Scholar] [CrossRef]
  17. Qian, M.; Li, Z.; Fan, L.G.; Wang, H.; Xu, J.; Zhao, W.; Huang, F. Ultra-Light Graphene Tile-Based Phase-Change Material for Efficient Thermal and Solar Energy Harvest. ACS Appl. Energy Mater. 2020, 3, 5517–5522. [Google Scholar] [CrossRef]
  18. Royo, P.; Acevedo, L.; Ferreira, V.J.; García-Armingol, T.; López-Sabirón, A.M.; Ferreira, G. High-temperature PCM-based thermal energy storage for industrial furnaces installed in energy-intensive industries. Energy 2019, 173, 1030–1040. [Google Scholar] [CrossRef]
  19. Bazzocchi, F.; Bertagni, S.; Ciacci, C.; Colonna, E.; Di Naso, V. Mechanical characterisation of a low-thickness ceramic tile cladding subject to ageing phenomena. J. Build. Eng. 2020, 29, 101105. [Google Scholar] [CrossRef]
  20. Da Silva, A.L.; Feltrin, J.; Dal Bó, M.; Bernardin, A.M.; Hotza, D. Effect of reduction of thickness on microstructure and properties of porcelain stoneware tiles. Ceram. Int. 2014, 40, 14693–14699. [Google Scholar] [CrossRef]
  21. ISO 13006; Ceramic Tiles. Definitions, Classification, Characteristics and Marking. International Organization for Standardization: Geneva, Switzerland, 2018.
  22. La Torre, V.; Rambaldi, E.; Masi, G.; Nici, S.; Ghezzi, D.; Cappelletti, M.; Bignozzi, M.C. Validation of Antibacterial Systems for Sustainable Ceramic Tiles. Coatings 2021, 11, 1409. [Google Scholar] [CrossRef]
  23. Da Silva, A.L.; Dondi, M.; Raimondo, M.; Hotza, D. Photocatalytic ceramic tiles: Challenges and technological solutions. J. Eur. Ceram. Soc. 2018, 38, 1002–1017. [Google Scholar] [CrossRef]
  24. Berto, A.M. Ceramic tiles: Above and beyond traditional applications. J. Eur. Ceram. Soc. 2007, 27, 1607–1613. [Google Scholar] [CrossRef]
  25. Cramer, C.L.; Ionescu, E.; Graczyk-Zajac, M.; Nelson, A.T.; Katoh, Y.; Haslam, J.J.; Wondraczek, L.; Aguirre, T.G.; LeBlanc, S.; Wang, H.; et al. Additive manufacturing of ceramic materials for energy applications: Road map and opportunities. J. Eur. Ceram. Soc. 2022, 42, 3049–3088. [Google Scholar] [CrossRef]
  26. Majumdar, S.D.; Kumar, S.; Mathew, V.T.; Saha, S. Functional Ceramic Tiles. Trans. Indian Ceram. Soc. 2010, 69, 37–44. [Google Scholar] [CrossRef]
  27. Nazir, H.; Batool, M.; Osorio, F.J.B.; Isaza-Ruiz, M.; Xu, X.; Vignarooban, K.; Phelan, P.; Inamuddin; Kannan, A.M. Recent developments in phase change materials for energy storage applications: A review. Int. J. Heat Mass Transf. 2019, 129, 491–523. [Google Scholar] [CrossRef]
  28. Da Silva, A.L.; Dondi, M.; Hotza, D. Self-cleaning ceramic tiles coated with Nb2O5-doped-TiO2 nanoparticles. Ceram. Int. 2017, 43, 11986–11991. [Google Scholar] [CrossRef]
  29. Ferreira-Neto, E.P.; Ullah, S.; Martinez, V.P.; Yabarrena, J.M.S.C.; Simões, M.B.; Perissinotto, A.P.; Wender, H.; de Vicente, F.S.; Noeske, P.-L.M.; Ribeiro, S.J.L.; et al. Thermally stable SiO2@TiO2 core@shell nanoparticles for application in photocatalytic self-cleaning ceramic tiles. Mater. Adv. 2021, 2, 2085–2096. [Google Scholar] [CrossRef]
  30. Djellabi, R.; Basilico, N.; Delbue, S.; D’alessandro, S.; Parapini, S.; Cerrato, G.; Laurenti, E.; Falletta, E.; Bianchi, C.L. Oxidative Inactivation of SARS-CoV-2 on Photoactive AgNPs@TiO2 Ceramic Tiles. Int. J. Mol. Sci. 2021, 22, 8836. [Google Scholar] [CrossRef]
  31. Bianchi, C.L.; Cerrato, G.; Bresolin, B.M.; Djellabi, R.; Rtimi, S. Digitally Printed AgNPs Doped TiO2 on Commercial Porcelain-Gres Tiles: Synergistic Effects and Continuous Photocatalytic Antibacterial Activity. Surfaces 2020, 3, 11–25. [Google Scholar] [CrossRef]
  32. Guzmán-Carrillo, H.R.; Relinque, E.J.; Manzano-Ramírez, A.; Castellote, M.; Romero-Pérez, M. Optimising processing conditions for the functionalisation of photocatalytic glazes by ZnO nanoparticle deposition. Mater. De Constr. 2021, 71, e261. [Google Scholar] [CrossRef]
  33. Ke, S.; Tian, W.; Meng, Z.; Fan, W. Antibacterial and Antistatic Laboratory Ceramic Countertop and Preparation Method Therefor. WO Patent WO 2022/252931 A1, 8 December 2022. [Google Scholar]
  34. Liu, C. Method for Preparing Anion Glazed Porcelain Tiles. CN Patent CN 108530030 A, 14 September 2018. [Google Scholar]
  35. Ryan, D.; Pillai, S.; Carroll, J. A Surface Coating. EP Patent EP 2908646 B1, 22 January 2020. [Google Scholar]
  36. Hayashi, H.; Kumazawa, T. Inkjet Ink for Ceramic Substrate. US Patent US 2020/0199389 A1, 25 June 2020. [Google Scholar]
  37. Wang, Q.; Chai, L.; Zhong, L.; Shi, M.; Jiang, K.; Li, Q. Antibacterial Ceramic, Antibacterial Ceramic Glaze Slip and Preparation Method Thereof. CN Patent CN 114315138 A, 12 April 2022. [Google Scholar]
  38. Ferreira-Neto, E.P.; Worsley Marcus, A.; Filho Ubirajara Pereira, R. Preparation of SiO2-TiO2 Composite Aerogels and SiO2@TiO2 Core-Shell Aerogels with High Thermal Stability and Enhanced Photocatalysis. US Patent US 2020/0180969 A1, 11 June 2020. [Google Scholar]
  39. Kim, J.; Kim, U.; Han, K.; Choi, J. Antibacterial persistence of hydrophobically glazed ceramic tiles. J. Korean Ceram. Soc. 2022, 59, 920–928. [Google Scholar] [CrossRef]
  40. Chen, L.; Lin, D.F. Applications of sewage sludge ash and nano-SiO2 to manufacture tile as construction material. Constr. Build. Mater. 2009, 23, 3312–3320. [Google Scholar] [CrossRef]
  41. Mahmoud, M.E.; El-Khatib, A.M.; Halbas, A.M.; El-Sharkawy, R.M. Ceramic tiles doped with lead oxide nanoparticles: Their fabrication, physical, mechanical characteristics and γ-ray shielding performance. Radiat. Phys. Chem. 2021, 189, 109780. [Google Scholar] [CrossRef]
  42. De la Garza, D.A.; Guzmán, A.M.; Gómez-Rodríguez, C.; Martínez, D.I.; Elizondo, N. Influence of Al2O3 and SiO2 nanoparticles addition on the microstructure and mechano-physical properties of ceramic tiles. Ceram. Int. 2022, 48, 12712–12720. [Google Scholar] [CrossRef]
  43. Nawaukkaratharnant, N.; Thueploy, A.; Khunthon, S.; Nilpairach, S.; Theerapapvisetpong, A. Improving the technological properties of red stoneware tiles derived from Ratchaburi red clay by the addition of iron oxide. Cases Stud. Constr. Mater. 2022, 16, e00983. [Google Scholar] [CrossRef]
  44. Fix Fierro, C.; Acosta Gonzalez Guillermo, E.; Aguilera Bustos Monica, I.; Gutiérrez Antonio, J. Preparation Method of Nanometric Size Metal Oxide Additives that Reduce the Temperature of Sinterized and/or Increase Productivity in the Manufacture of Ceramic Parts, Improving Mechanical Properties without Affecting the Gresification Properties of Ceramic Bodies, Tiles or Coatings. US Patent US 11339098 B2, 24 May 2022. [Google Scholar]
  45. Vieira, A.W.; Rosso, L.S.; Demarch, A.; Pasini, D.; Ruzza, S.P.; Arcaro, S.; Ribeiro, M.J.; Angioletto, E. Life cycle assessment in the ceramic tile industry: A review. J. Mater. Res. Technol. 2023, 23, 3904–3915. [Google Scholar] [CrossRef]
  46. Cucchi, M.; Volpi, L.; Ferrari, A.M.; García-Muiña, F.E.; Settembre-Blundo, D. Industry 4.0 real-world testing of dynamic organizational life cycle assessment (O-LCA) of a ceramic tile manufacturer. Environ. Sci. Pollut. Res. 2022. [Google Scholar] [CrossRef] [PubMed]
  47. Ferrari, A.M.; Volpi, L.; Settembre-Blundo, D.; García-Muiña, F.E. Dynamic life cycle assessment (LCA) integrating life cycle inventory (LCI) and Enterprise resource planning (ERP) in an industry 4.0 environment. J. Clean. Prod. 2021, 286, 125314. [Google Scholar] [CrossRef]
  48. Quinteiro, P.; Almeida, M.I.; Serra, J.; Arroja, L.; Dias, A.C. Life cycle assessment of ceramic roof tiles: A temporal perspective. J. Clean. Prod. 2022, 363, 132568. [Google Scholar] [CrossRef]
  49. Caglayan, H.; Caliskan, H. Life cycle assessment based exergoenvironmental analysis of a cogeneration system used for ceramic factories. Sustain. Energy Technol. Assess. 2022, 52, 102078. [Google Scholar] [CrossRef]
  50. Barbosa, M.Z.; Dias, J.D.; Marvila, M.T.; de Azevedo, A.R.G. Life cycle approach applied to the production of ceramic materials incorporated with ornamental stone wastes. Environ. Sci. Pollut. Res. 2022, 29, 9957–9970. [Google Scholar] [CrossRef] [PubMed]
  51. Silvestri, L.; Forcina, A.; Silvestri, C.; Ioppolo, G. Life cycle assessment of sanitaryware production: A case study in Italy. J. Clean. Prod. 2020, 251, 119708. [Google Scholar] [CrossRef]
  52. Monteiro, H.; Cruz, P.L.; Moura, B. Integrated environmental and economic life cycle assessment of improvement strategies for a ceramic industry. J. Clean. Prod. 2022, 345, 131173. [Google Scholar] [CrossRef]
  53. Del Rio, D.D.F.; Sovacool, B.K.; Foley, A.M.; Griffiths, S.; Bazilian, M.; Kim, J.; Rooney, D. Decarbonizing the ceramics industry: A systematic and critical review of policy options, developments and sociotechnical systems. Renew. Sustain. Energy Rev. 2022, 157, 112081. [Google Scholar] [CrossRef]
  54. Türkmen, B.A.; Özbilen, S.K.; Duhbaci, T.B. Improving the sustainability of ceramic tile production in Turkey. Sustain. Prod. Consum. 2021, 27, 2193–2207. [Google Scholar] [CrossRef]
  55. ASTM E11; Standard Specification for Woven Wire Test Sieve Cloth and Test Sieves. ASTM International: West Conshohocken, PA, USA, 2022.
  56. Sacmi Group. Ceramic Tile Technology, 3rd ed; Imola, S., Ed.; Copyright Sacmi Imola, SC: Imola, Italy, 2022; Chapter 1; pp. 33–34. [Google Scholar]
  57. Temga, J.P.; Mache, J.R.; Madi, A.B.; Nguetnkam, J.P.; Bitom, D.L. Ceramics applications of clay in Lake Chad Basin, Central Africa. Appl. Clay Sci. 2019, 171, 118–132. [Google Scholar] [CrossRef]
  58. Rat, E.; Martínez-Martínez, S.; Sánchez-Garrido, J.A.; Pérez-Villarejo, L.; Garzón, E.; Sánchez-Soto, P.J. Characterization, thermal and ceramic properties of clays from Alhabia (Almería, Spain). Ceram. Int. 2023, 49, 14814–14825. [Google Scholar] [CrossRef]
  59. ISO 10545-3; Ceramic Tiles Part 3: Determination of Water Absorption, Apparent Porosity, Apparent Relative Density and bulk Density. International Organization for Standardization: Geneva, Switzerland, 2018.
  60. ISO 10545-4; Ceramic Tiles Part 4: Determination of Modulus of Rupture and Breaking Strength. International Organization for Standardization: Geneva, Switzerland, 2019.
  61. Asadi, I.; Shafigh, P.; Abu Hassan, Z.F.B.; Mahyuddin, N.B. Thermal conductivity of concrete—A review. J. Build. Eng. 2018, 20, 81–93. [Google Scholar] [CrossRef]
  62. Sengul, O.; Azizi, S.; Karaosmanoglu, F.; Tasdemir, M.A. Effect of expanded perlite on the mechanical properties and thermal conductivity of lightweight concrete. Energy Build. 2011, 43, 671–676. [Google Scholar] [CrossRef]
  63. El hammouti, A.; Charai, M.; Channouf, S.; Horma, O.; Nasri, H.; Mezrhab, A.; Karkri, M.; Tankari, M.A. Laboratory-testing and industrial scale performance of different clays from eastern Morocco for brick manufacturing. Constr. Build. Mater. 2023, 370, 130624. [Google Scholar] [CrossRef]
  64. ISO 14040; Environmental Management—Life Cycle Assessment. Requirements and Guidelines. International Organization for Standardization: Geneva, Switzerland, 2006.
  65. Garcia-Valles, M.; Cuevas, D.; Alfonso, P.; Martínez, S. Thermal behaviour of ceramics obtained from the kaolinitic clays of Terra Alta, Catalonia, Spain. J. Therm. Anal. Calorim. 2022, 147, 5303–5312. [Google Scholar] [CrossRef]
  66. Martínez-Martínez, S.; Pérez-Villarejo, L.; Garzón, E.; Sánchez-Soto, P.J. Influence of firing temperature on the ceramic properties of illite-chlorite-calcitic clays. Ceram. Int. 2023, 49, 24541–24557. [Google Scholar] [CrossRef]
  67. Kurmus, H.; Mohajerani, A. Energy savings, thermal conductivity, micro and macro structural analysis of fired clay bricks incorporating cigarette butts. Constr. Build. Mater. 2021, 283, 122755. [Google Scholar] [CrossRef]
  68. Leyton-Vergara, M.; Pérez-Fargallo, A.; Pulido-Arcas, J.; Cárdenas-Triviño, G.; Piggot-Navarrete, J. Influence of Granulometry on Thermal and Mechanical Properties of Cement Mortars Containing Expanded Perlite as a Lightweight Aggregate. Materials 2019, 12, 4013. [Google Scholar] [CrossRef] [PubMed]
  69. Tasdemir, C.; Sengul, O.; Tasdemir, M.A. A comparative study on the thermal conductivities and mechanical properties of lightweight concretes. Energy Build. 2017, 151, 469–475. [Google Scholar] [CrossRef]
  70. Luhar, I.; Luhar, S.; Abdullah, M.M.A.B.; Nabiałek, M.; Sandu, A.V.; Szmidla, J.; Jurczyńska, A.; Razak, R.A.; A Aziz, I.H.; Jamil, N.H.; et al. Assessment of the Suitability of Ceramic Waste in Geopolymer Composites: An Appraisal. Materials 2021, 14, 3279. [Google Scholar] [CrossRef] [PubMed]
  71. Comin, A.B.; Zaccaron, A.; Nandi, V.d.S.; Inocente, J.M.; Muller, T.G.; Bo, A.G.D.; Bernardin, A.M.; Peterson, M. Measurement of apparent sintering activation energy for densification of clays. Clay Miner. 2021, 56, 299–305. [Google Scholar] [CrossRef]
  72. Wang, T.; Ma, S.; Wang, X.; Hong, T.; Luo, Y. A 100% high-aluminum fly ash-based high-density mullite ceramic with a triple microstructure: Preparation and mechanical characterization. Constr. Build. Mater. 2020, 239, 117761. [Google Scholar] [CrossRef]
  73. Jiang, F.; Li, Y.; Zhao, L.; Cang, D. Novel ceramics prepared from inferior clay rich in CaO and Fe2O3: Properties, crystalline phases evolution and densification process. Appl. Clay Sci. 2017, 143, 199–204. [Google Scholar] [CrossRef]
  74. Chalouati, Y.; Mannai, F.; Bennour, A.; Srasra, E. Firing behavior of argillites from northern Tunisia as raw materials for ceramic applications. Int. J. Appl. Ceram. Technol. 2021, 18, 2323–2335. [Google Scholar] [CrossRef]
  75. Slimanou, H.; Baziz, A.; Bouzidi, N.; Quesada, D.E.; Tahakourt, A. Thermal, physical, mechanical and microstructural properties of dredged sediment-based ceramic tiles as substituent of kaolin. Environ. Sci. Pollut. Res. 2022, 29, 26792–26809. [Google Scholar] [CrossRef] [PubMed]
  76. Abou Elmaaty, T.M.; Sayed-Ahmed, K.; El Gohari, M.M.; Noaman, R. Enhancing the properties of bone China ceramics by treatment with microporous SiO2 nanoparticles. Chem. Pap. 2022, 76, 5879–5891. [Google Scholar] [CrossRef]
  77. Li, Y.R.; Zhang, X.C.; Cao, Z.; Liu, Z.J.; Lu, Z.; Liu, Y.S. Towards the progress of ecological restoration and economic development in China’s Loess Plateau and strategy for more sustainable development. Sci. Total Environ. 2021, 756, 143676. [Google Scholar] [CrossRef] [PubMed]
  78. Ghasemi-Kahrizsangi, S.; Dehsheikh, H.G.; Karamian, E. Impact of Titania nanoparticles addition on the microstructure and properties of MgO-C refractories. Ceram. Int. 2017, 43, 15472–15477. [Google Scholar] [CrossRef]
  79. Deng, T.; Li, J. Study on preparation of thermal storage ceramic by using clay shale. Ceram. Int. 2016, 42, 18128–18135. [Google Scholar] [CrossRef]
  80. Molinari, C.; Alaya, Y.; Pasti, L.; Guarini, G.; Dondi, M.; Zanelli, C. Assessing white clays from Tabarka (Tunisia) in the production of porcelain stoneware tiles. Appl. Clay Sci. 2023, 231, 106741. [Google Scholar] [CrossRef]
  81. Harizanova, R.; Mihailova, I.; Cherkezova-Zheleva, Z.; Paneva, D.; Georgieva, M.; Tzankov, D.; Avdeev, G.; Rüssel, C. Glass–crystalline materials with high iron oxide concentration: Phase composition, redox ratio and magnetic properties. Boletín De La Soc. Española De Cerámica y Vidr. 2024, 63, 23–32. [Google Scholar] [CrossRef]
  82. Xu, K.; Huang, W.; Zhang, L.; Fu, S.; Chen, M.; Ding, S.; Han, B. Mechanical properties of low-carbon ultrahigh-performance concrete with ceramic tile waste powder. Constr. Build. Mater. 2021, 287, 123036. [Google Scholar] [CrossRef]
  83. Nascimento de Souza, B.; Dal Bó, M.; Hotza, D.; Fredel, M.C. Chemical modification of porcelain tile surface to optimize flexural strength and Weibull modulus through the ion exchange process. J. Build. Eng. 2022, 56, 104735. [Google Scholar] [CrossRef]
  84. De Sousa, I.V.; Jaramillo Nieves, L.J.; Dal-Bó, A.G.; Bernardin, A.M. Valorization of porcelain tile polishing residue in the production of cellular ceramics. Clean. Eng. Technol. 2022, 6, 100381. [Google Scholar] [CrossRef]
  85. Pérez, J.M.; Romero, M. Microstructure and technological properties of porcelain stoneware tiles moulded at different pressures and thicknesses. Ceram. Int. 2014, 40, 1365–1377. [Google Scholar] [CrossRef]
  86. Tamsu Selli, N. Relationship between microstructure and the impact resistance of porcelain stoneware tiles. Boletín De La Soc. Española De Cerámica y Vidr. 2022, 61, 210–219. [Google Scholar] [CrossRef]
  87. Eren Gültekin, E. The effect of heating rate and sintering temperature on the elastic modulus of porcelain tiles. Ultrasonics 2018, 83, 120–125. [Google Scholar] [CrossRef]
  88. Piccolo, P.d.O.; Zaccaron, A.; Teixeira, L.B.; de Moraes, E.G.; Montedo, O.R.K.; de Oliveira, A.P.N. Development of translucent ceramic tiles from modified porcelain stoneware tile paste. J. Build. Eng. 2022, 45, 103543. [Google Scholar] [CrossRef]
  89. Ciacco, E.F.S.; Rocha, J.R.; Coutinho, A.R. The energy consumption in the ceramic tile industry in Brazil. Appl. Therm. Eng. 2017, 113, 1283–1289. [Google Scholar] [CrossRef]
  90. Ferrer, S.; Mezquita, A.; Aguilella, V.M.; Monfort, E. Beyond the energy balance: Exergy analysis of an industrial roller kiln firing porcelain tiles. Appl. Therm. Eng. 2019, 150, 1002–1015. [Google Scholar] [CrossRef]
  91. Wang, S.; Gainey, L.; Mackinnon, I.D.R.; Allen, C.; Gu, Y.; Xi, Y. Thermal behaviors of clay minerals as key components and additives for fired brick properties: A review. J. Build. Eng. 2023, 66, 105802. [Google Scholar] [CrossRef]
  92. Wang, S.; Lu, A.L.; Zhong, C.J. Hydrogen production from water electrolysis: Role of catalysts. Nano Converg. 2021, 8, 4. [Google Scholar] [CrossRef] [PubMed]
  93. Huang, D.; Tian, Z.; Cui, W.; Gao, L.; Liu, Z.; Diao, X.; Liu, G. Effects of Y2O3 and yttrium aluminates as sintering additives on the thermal conductivity of AlN ceramic substrates. Ceram. Int. 2018, 44, 20556–20559. [Google Scholar] [CrossRef]
  94. Pini, M.; Ferrari, A.M.; Gamberini, R.; Neri, P.; Rimini, B. Life cycle assessment of a large, thin ceramic tile with advantageous technological properties. Int. J. Life Cycle Assess. 2014, 19, 1567–1580. [Google Scholar] [CrossRef]
  95. De Souza, W.J.V.; Scur, G.; Hilsdorf, W.D. Eco-innovation practices in the brazilian ceramic tile industry: The case of the Santa Gertrudes and Criciuma clusters. J. Clean. Prod. 2018, 199, 1007–1019. [Google Scholar] [CrossRef]
  96. Cui, H.W.; Li, D.S.; Fan, Q. Using Nano Hexagonal Boron Nitride Particles and Nano Cubic Silicon Carbide Particles to Improve the Thermal Conductivity of Electrically Conductive Adhesives. Electron. Mater. Lett. 2013, 9, 1–5. [Google Scholar] [CrossRef]
  97. Settembre-Blundo, D.; García-Muiña, F.E.; Pini, M.; Volpi, L.; Siligardi, C.; Ferrari, A.M. Sustainability as source of competitive advantages in mature sectors: The case of Ceramic District of Sassuolo (Italy). Smart Sustain. Built Environ. 2019, 8, 53–79. [Google Scholar] [CrossRef]
Figure 1. Ceramic test tiles manufacturing process.
Nanomaterials 14 00910 g001
Figure 2. Clay test tiles with nanoparticles addition fired at 1120 °C. (a) TF control clay test tiles with 0%, 1% and 5% (w/w) additions of Ag2O, CuFe2O4, Fe3O4 and SiO2 nanoparticles. (b) Control clay test tiles for TF, CR1 and CR2 with additions of 0%, 1% and 5% (w/w) of Fe3O4 nanoparticles.
Nanomaterials 14 00910 g002
Figure 3. Apparent thermal conductivity test: (a) set up, (b) real measurement.
Nanomaterials 14 00910 g003
Figure 4. System boundaries of test tile manufacturing with magnetite addition.
Nanomaterials 14 00910 g004
Figure 5. Interval plot of (a) linear shrinkage (%), fire losses (%), water absorption (%), (b) flexural strength (N) and (c) temperature gradient (°C/min) of CR1, CR2 and TF.
Nanomaterials 14 00910 g005
Figure 6. Interval plot of (a) linear shrinkage (%), (b) fire losses (%), (c) water absorption (%), (d) flexural strength (N) and (e) temperature gradient (°C/min) in TF clay with Ag2O, CuFe2O4, Fe3O4 and SiO2 nanoparticle additions.
Nanomaterials 14 00910 g006
Figure 7. Interval plot of (a) linear shrinkage (%), (b) fire losses (%), (c) water absorption (%), (d) flexural strength (N) and (e) temperature gradient (°C/min) in CR1, CR2 and TF clay with Fe3O4 nanoparticle additions.
Nanomaterials 14 00910 g007
Figure 8. SEM images corresponding to test tiles of TF clays fired at 1120 °C with (a) 0%, (b) 1% and (c) 5% (w/w) Fe3O4 nanoparticle additions.
Nanomaterials 14 00910 g008
Figure 9. SEM images were used to calculate the total porosity of test tiles with TF clay. (a) 0%, (b) 1% and (c) 5% of Fe3O4 (w/w) nanoparticles addition.
Nanomaterials 14 00910 g009
Figure 10. Normalized contribution per impact category of clay without nanoparticles addition (0% w/w). The abbreviation definitions of the impact categories are listed in Section 2.9.
Nanomaterials 14 00910 g010
Figure 11. Normalized contribution per impact category of test tiles clay manufacturing with magnetite nanoparticles addition at 1% (w/w). The abbreviation definitions of the impact categories are listed in Section 2.9.
Nanomaterials 14 00910 g011
Table 1. Particle sizes and chemical compositions of clays CR1, CR2 and TF by X-ray fluorescence (XRF).
Clays
CRCR2TF
Particle size
Oxide Compound (wt.%)
12.7 mm > 22.0% > 7.9 mm
7.9 mm > 4.6% > 6.4 mm
6.4 mm > 7.8% > 4.0 mm
4.0 mm > 33.6%> 1.0 mm
1.0 mm < 32.0%
SiO268.0565.4763.84
Al2O317.7319.3320.76
CaO0.230.230.39
MgO0.640.680.70
Na2O0.250.200.19
K2O1.801.902.05
Fe2O34.334.414.05
TiO20.940.970.88
SO30.040.030.04
V2O50.030.040.05
P2O50.090.100.09
ZrO20.050.040.04
SrO0.040.040.04
Mn00.040.040.02
ZnO0.030.030.04
Cr2O30.020.020.02
LOI5.676.496.79
Table 2. Inventory report of manufacturing process for test samples.
Method InventoryAmountUnit
Laboratory-scale processReagents preparationInputs
Clay500g
Water269g
Sodium silicate4g
Magnetite5g
Electricity (Weighing machine)0.0001kWh
Electricity (Grinder Speedy)0.026kWh
Electricity (Drying oven)1.840kWh
Powder conformationWater25.20g
Electricity (Grinder ct-12061)0.01kWh
Test tile conformationElectricity (Manual press)0.24kWh
Electricity (Drying oven)2.484kWh
Test tile firingElectricity (Oven)24.29kWh
Outputs
Test tile420g
Table 3. Mineralogical analysis (in wt.%) obtained by XRD determination using CR1, CR2 and TF clays.
Mineral Phases wt.%Clays
CR1CR2TF
Quartz424136
Kaolinite 1A242745
Microcline222
Anatase<1.021
Nacrita-2M2643
Muscovite-2M1, ferric232311
Albite211
Hematite<1.0%<1.0%<1.0%
Table 4. Total porosity and average size of TF clay.
Clay + Fe3O4 NPsTotal Porosity %Average Size µm
TF—0%1.4200.220
TF—1%1.2460.068
TF—5%1.3840.304
Table 5. Life cycle impact assessment (LCIA). Scenario 1 (clays at 0% nanoparticles addition). Scenario 2 (clays with magnetite nanoparticles at 1% w/w) includes energy saving and mass reduction.
Impact CategoryAbbreviationReference UnitClays at 0% (w/w) Fe3O4 NPsClays at 1%(w/w) Fe3O4 NPs
Fine particulate matter formationFPMFkg PM2.5 eq0.300.24
Fossil resource scarcityFRSkg oil eq39.3031.57
Freshwater ecotoxicityFEkg 1,4-DCB33.3126.54
Freshwater eutrophicationFEPkg P eq0.040.04
Global warmingGWkg CO2 eq216.51173.20
Human carcinogenic toxicityHCTkg 1,4-DCB10.388.37
Human non-carcinogenic toxicityHNCTkg 1,4-DCB187.36150.88
Ionizing radiationIRkBq Co-60 eq0.950.87
Land useLUm2a crop eq0.390.35
Marine ecotoxicityMEkg 1,4-DCB40.7432.47
Marine eutrophicationMEPkg N eq0.000.00
Mineral resource scarcityMRSkg Cu eq0.560.45
Ozone formation, Human healthOF-HHkg NOx eq0.320.26
Ozone formation, Terrestrial ecosystemsOF-TEkg NOx eq0.330.26
Stratospheric ozone depletionSODkg CFC11 eq0.000.00
Terrestrial acidificationTAkg SO2 eq0.900.72
Terrestrial ecotoxicityTEkg 1,4-DCB849.10683.75
Water consumptionWCm34.213.363
Table 6. Studies and patents on application of nanoparticles in ceramic tiles.
Type of NanoparticlesApplicationsParticle Size (nm)w/w %ResultsAuthor
Body TileCoating
TiO2 Self-cleaning ceramic tiles9–675Self-cleaning ceramic tilesDa Silva et al. [28]
SiO2-TiO2 Self-cleaning ceramic tiles53.4Self-cleaning coatings and photocatalytic ceramicFerreira-Neto et al. [29]
Ag-TiO2 Photoactive tiles110–1308Oxidate inactivation of SARS-CoV-2Djellabi et al. [30]
Ag-TiO2 Photocatalytic antibacterial tile110–1301, 4 and 8Photocatalytic abilityBianchi et al. [31]
ZnO Glazed ceramic tiles.3810Photocatalytic activityGuzman-Carrillo et al. [32]
SnO2, ZnO, Sb2O3 Glazed ceramic countertop.50–1000.5–6Excellent antibacterial and antistatic propertiesKe et al. [33]
SiO2, Ge Glazed porcelain tilesNot available2–3Odorless and free toxicsLiu et al. [34]
Cu(NO3)2 Anti-microbial coatingsNot available0.03 to 3Stable at temperatures up to at 1350 °CDarragh et al. [35]
Au, Ag, Cu, Pl, Ti Inkjet ink for a ceramic substrate5.0–900.05 to 0.8Better fixed on a ceramic substrateHiromichi et al. [36]
Mg Photocatalytic antibacterial tile500.5–5Level 0 anti-mildewWang et al. [37]
SiO2, TiO2 Photocatalytic antibacterial tile1050–90Excellent photocatalytic activity even after 1000 °CFerreira-Neto et al. [38]
Cu Glazed ceramic tiles.30–903Antibacterial efficiency of 99.9%Kim et al. [39]
SiO2Pottery and porcelain clays 100–3Increase in flexural strength 0.5–2.5 MpaChen et al. [40]
PbOCeramic tiles for γ-ray shielding 29.640–10Increase in modulus of rupture 2.674 MpaMahmoud et al. [41]
Al2O3 and SiO2Porcelain stoneware 20–300.25–1Compressive strength 55.37 and 65.27 MpaDe la Garza et al. [42]
Fe2O3Red stoneware Not available3–7Flexural strength 30 MpaNawaukkaratharnant et al. [43]
Si, Ca, Na, Mg, B, Zn, Al, PRed and porcelain stoneware 50–5000.2–5Sintering temperature reduction up to 13%Fix-Fierro et al. [44]
AgO2Red stoneware 151–5Increase water absorption up to 26%, decrease flexural strength up to 13% and increase of temperature gradient up to 24%.This study
CuFe2O4Red stoneware 1001–5Decrease water absorption up to 33%, increase flexural strength up to 9% and increase temperature gradient up to 18%.This study
Fe3O4Red stoneware 88.591–5Decrease water absorption up to 40%, increase flexural strength up to 16% and increase temperature gradient up to 32%.This study
SiO2Red stoneware 201–5Increase water absorption up to 28%, decrease flexural strength up to 16% and increase of temperature gradient up to 21%.This study
Disclaimer/Publisher’s Note: The statements, opinions and data contained in all publications are solely those of the individual author(s) and contributor(s) and not of MDPI and/or the editor(s). MDPI and/or the editor(s) disclaim responsibility for any injury to people or property resulting from any ideas, methods, instructions or products referred to in the content.

