
Effects of Gas Type, Oil, Salts and Detergent on Formation and Stability of Air and Carbon Dioxide Bubbles Produced by Using a Nanobubble Generator


Abstract
1. Introduction
2. Materials and Methods
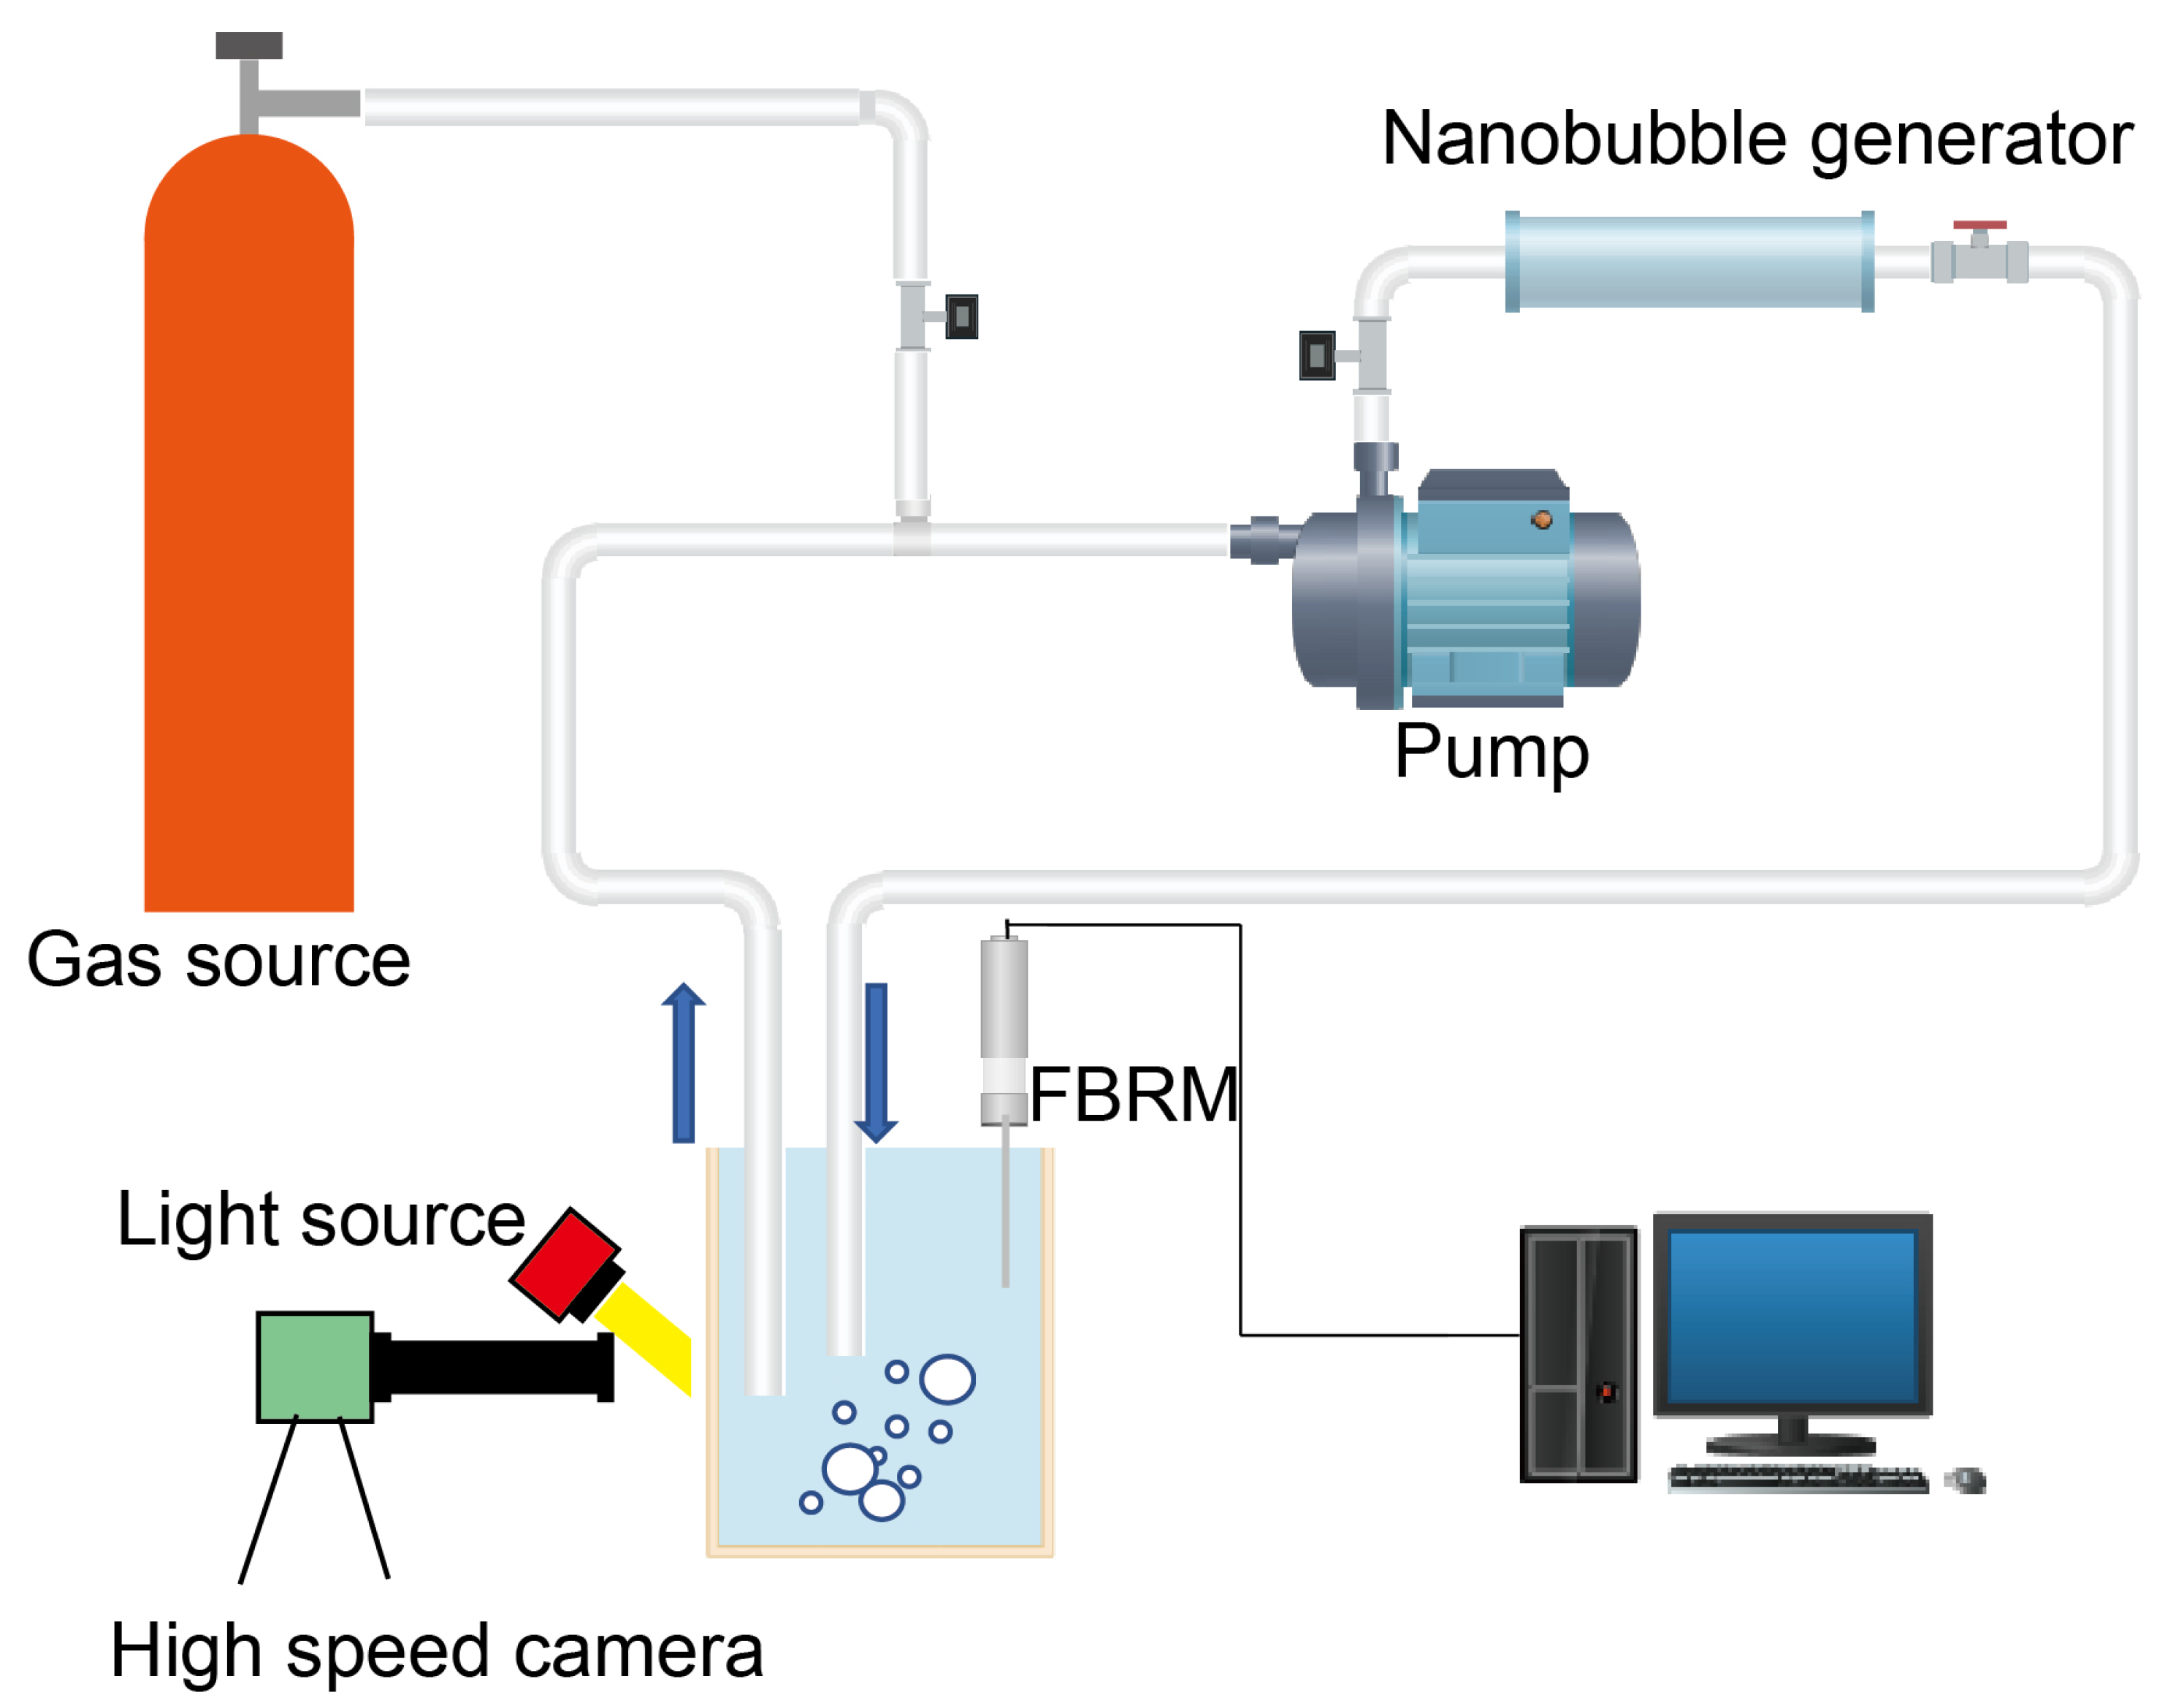
2.1. Bubble Generation by Using a Nanobubble Generator
2.2. Visualization of Bubbles
2.3. Characterization of Bubbles
3. Results and Discussion
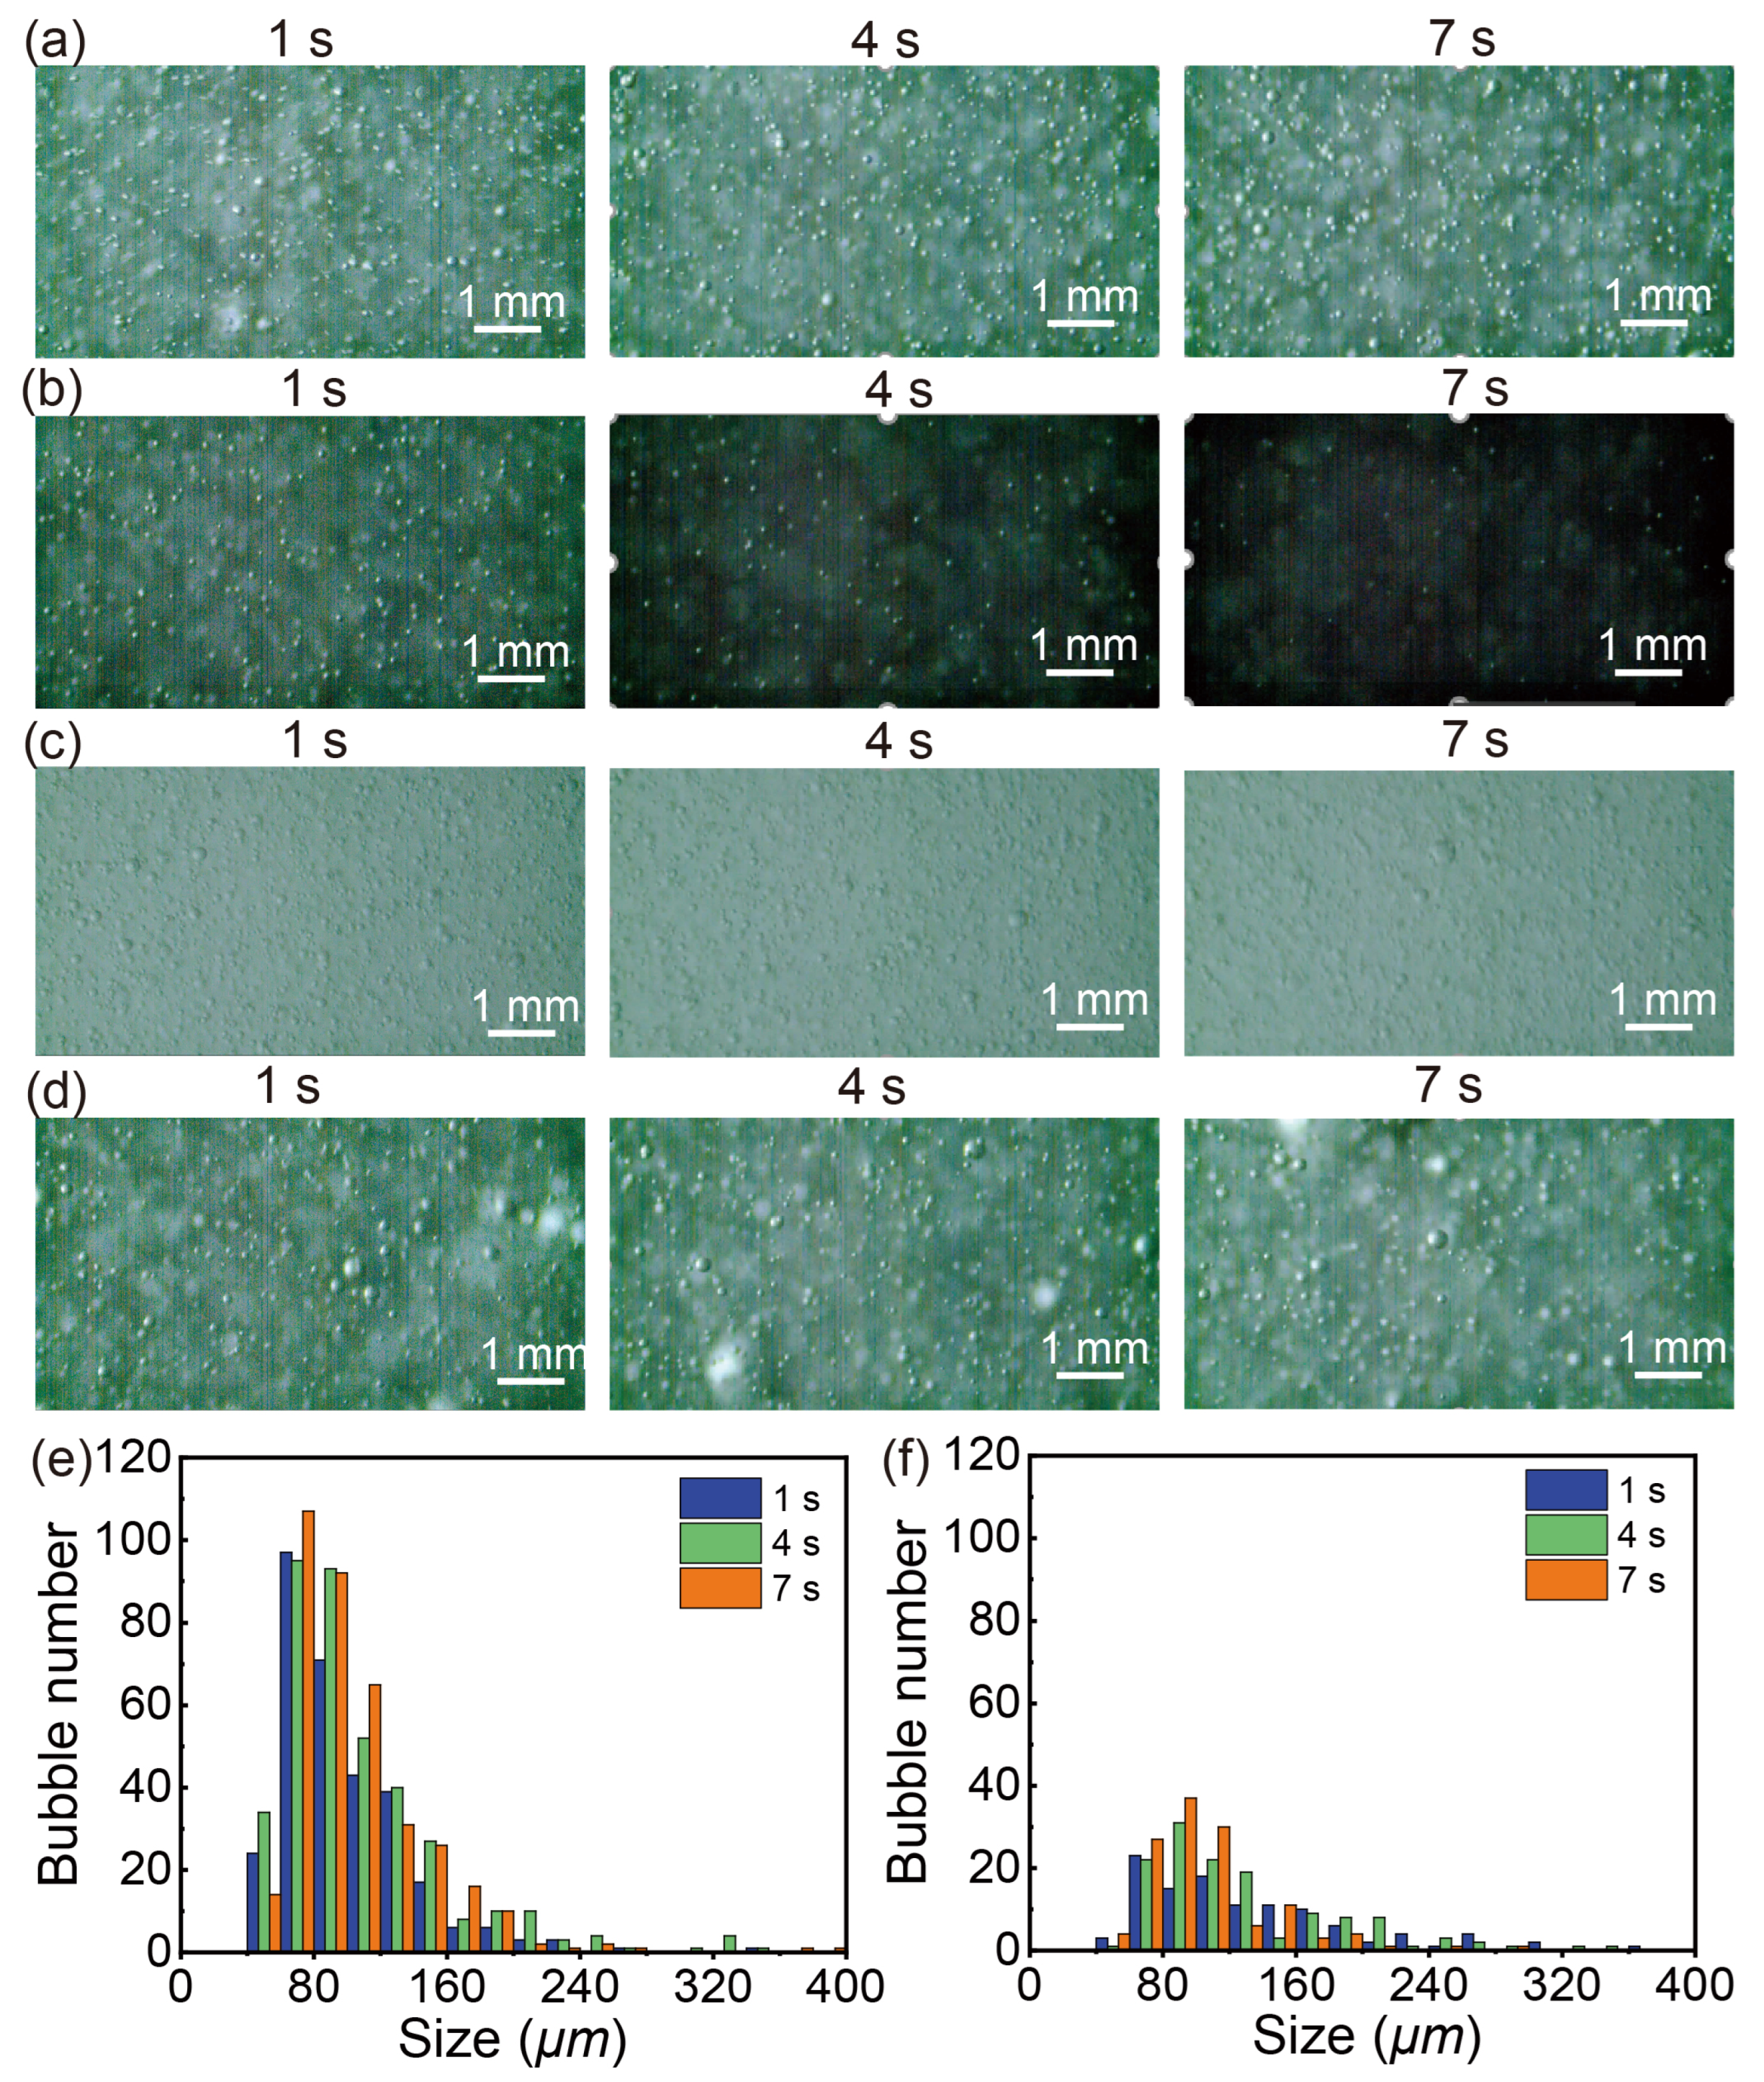
3.1. Visualization and Size Determination of Microbubbles
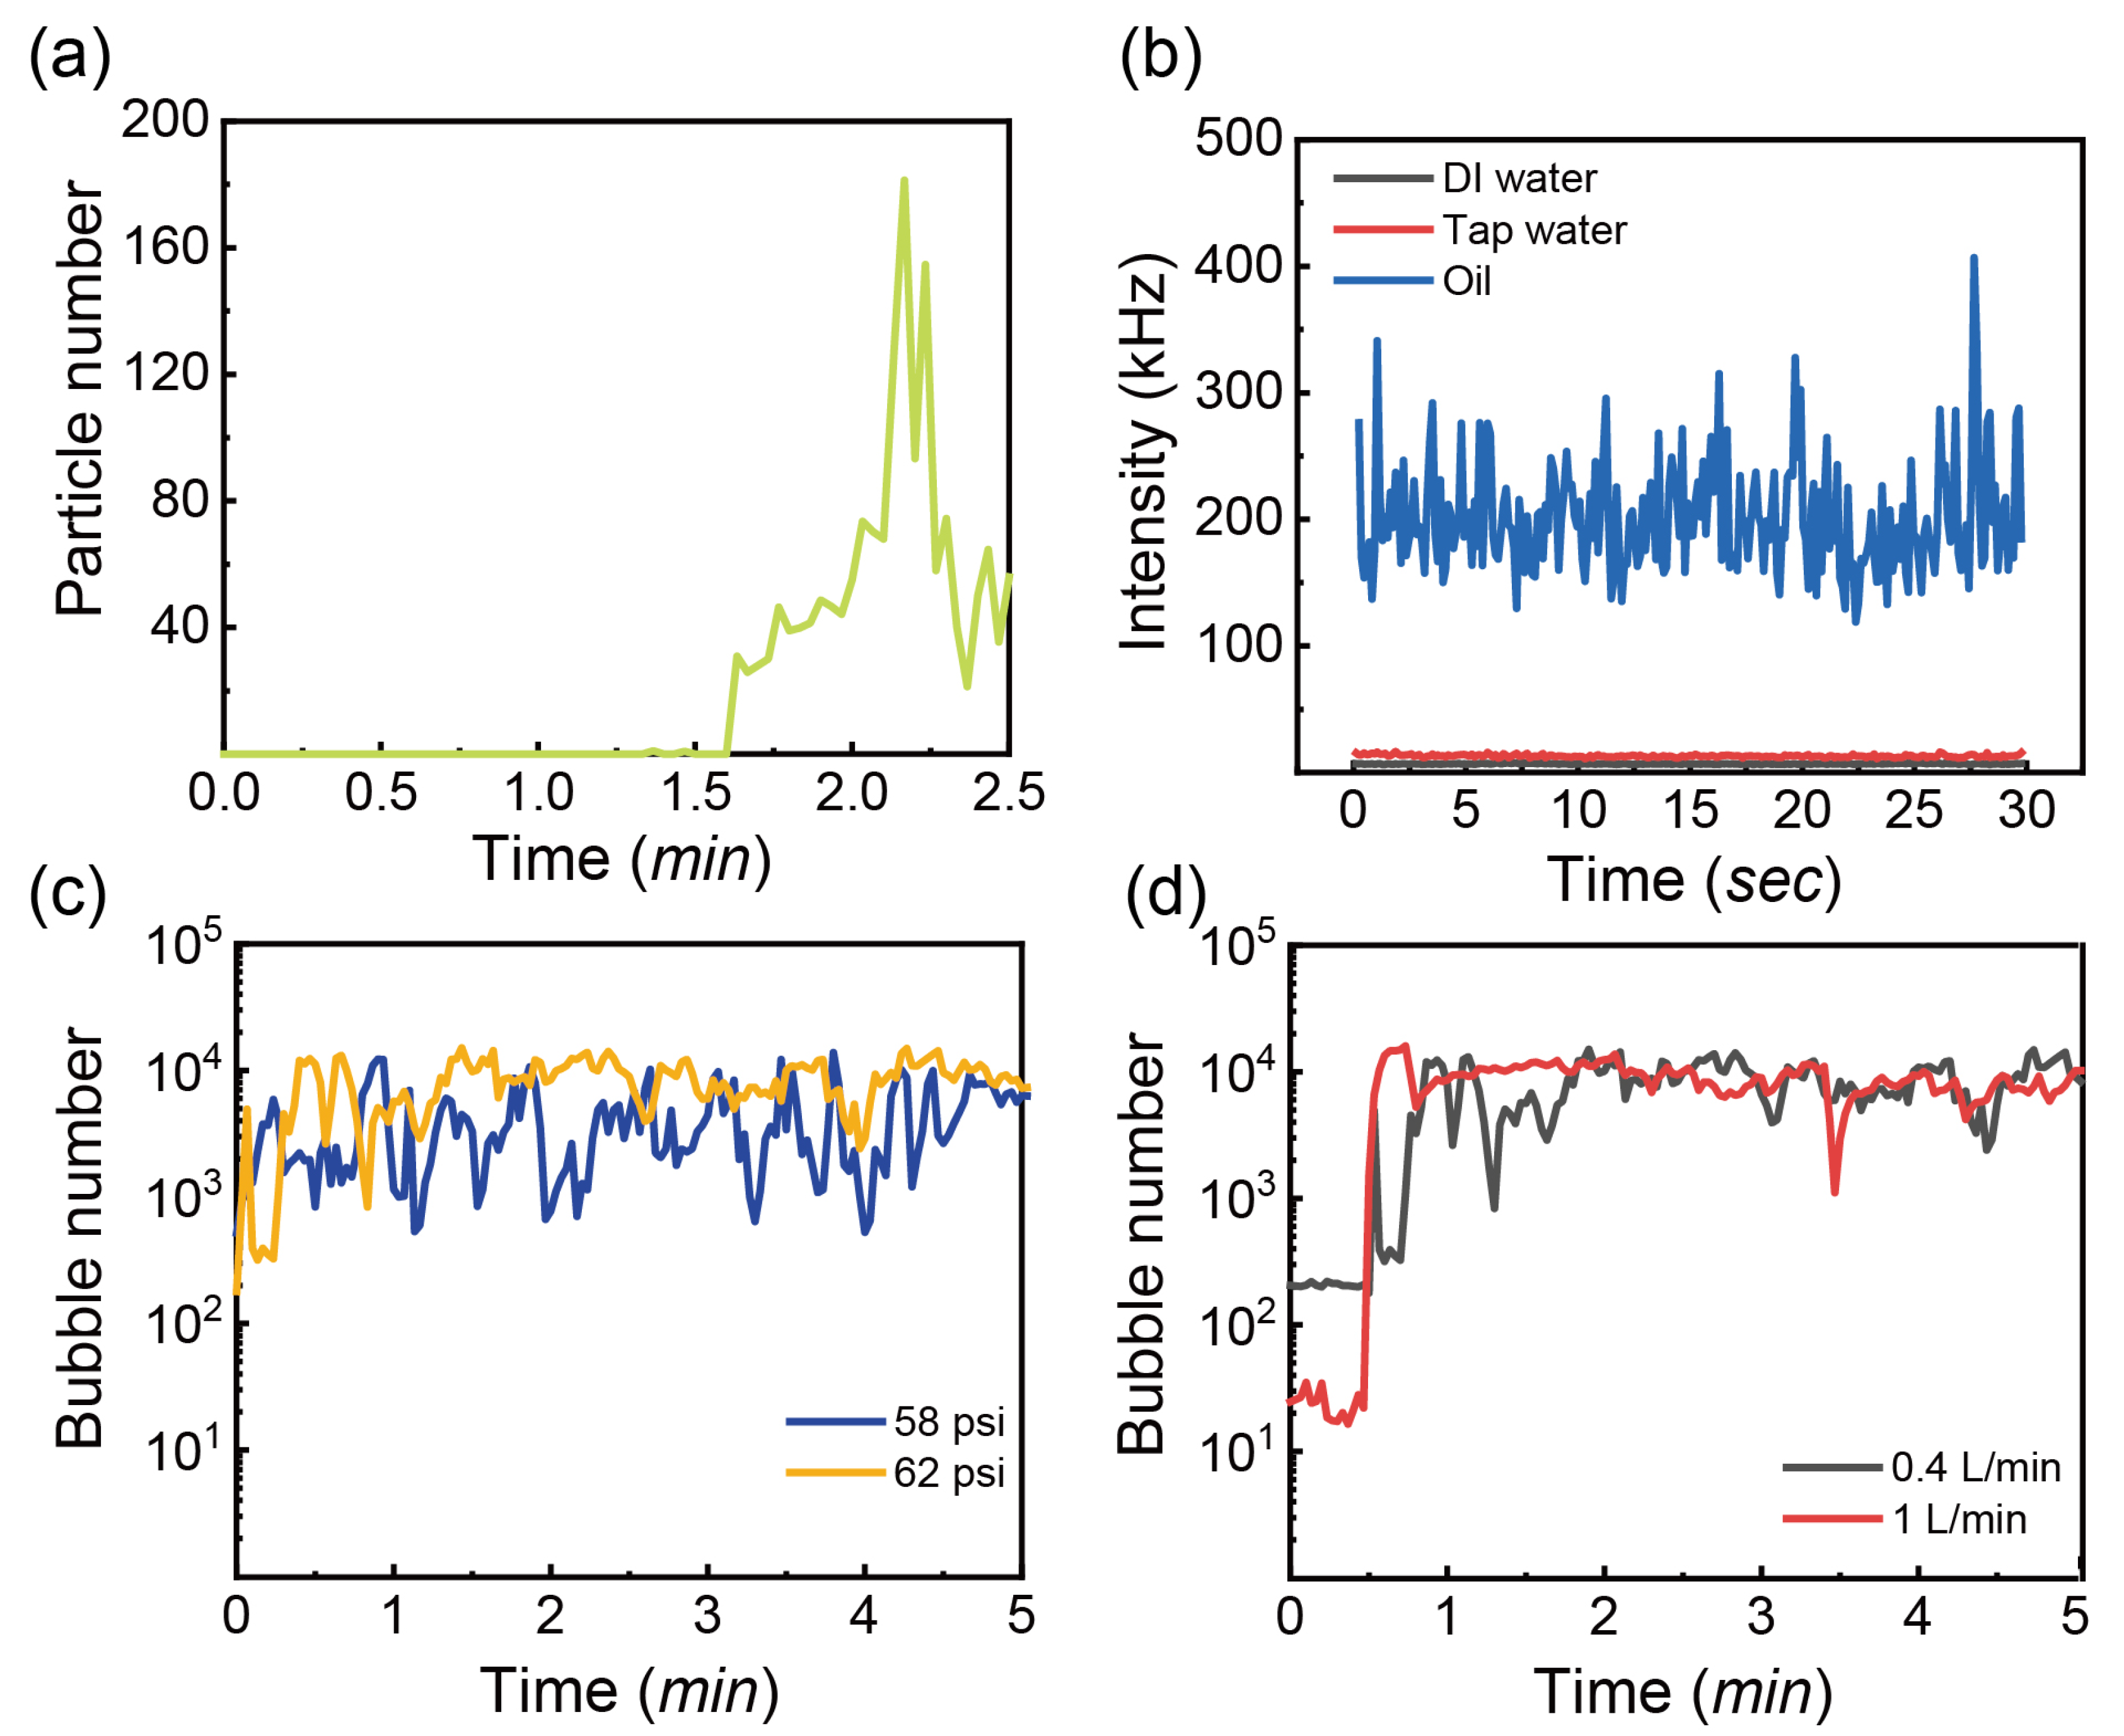
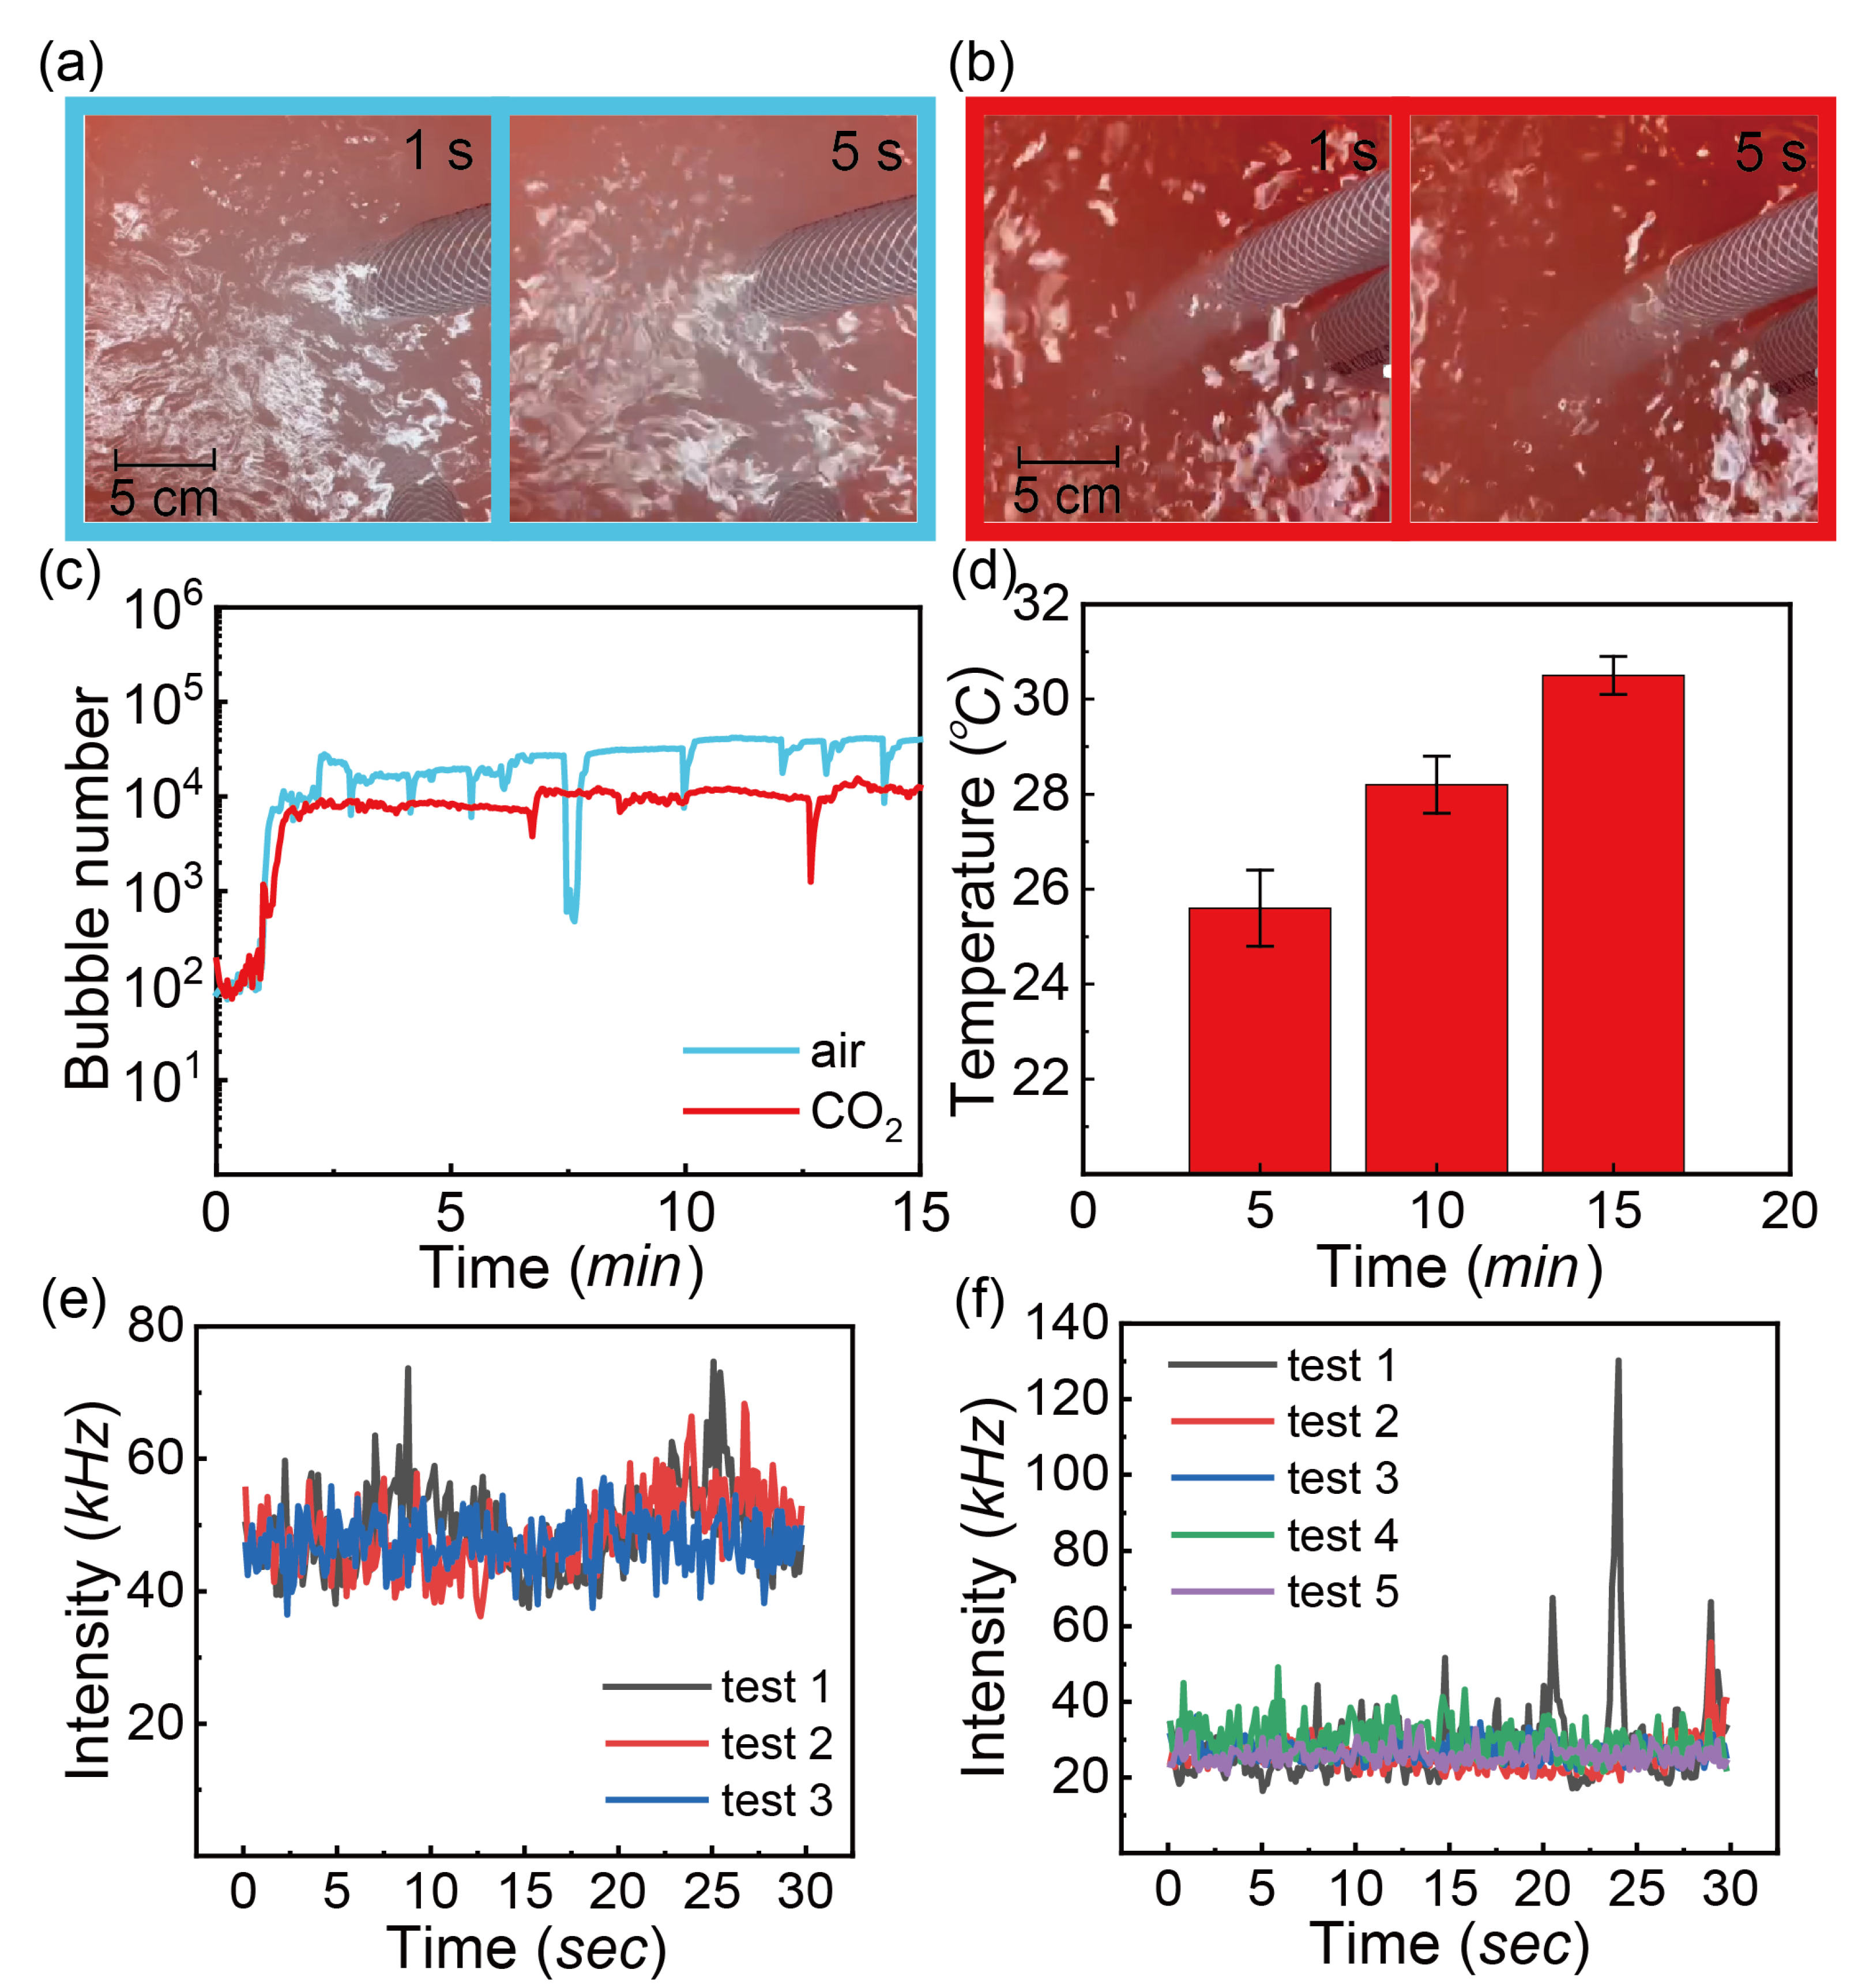
3.2. Dependence of Bubble Sizes on Gas Flow Rate, Pressure of the Generator, Gas Type and Temperature
3.3. Effects of Additives on Formation and Stability of Bubbles
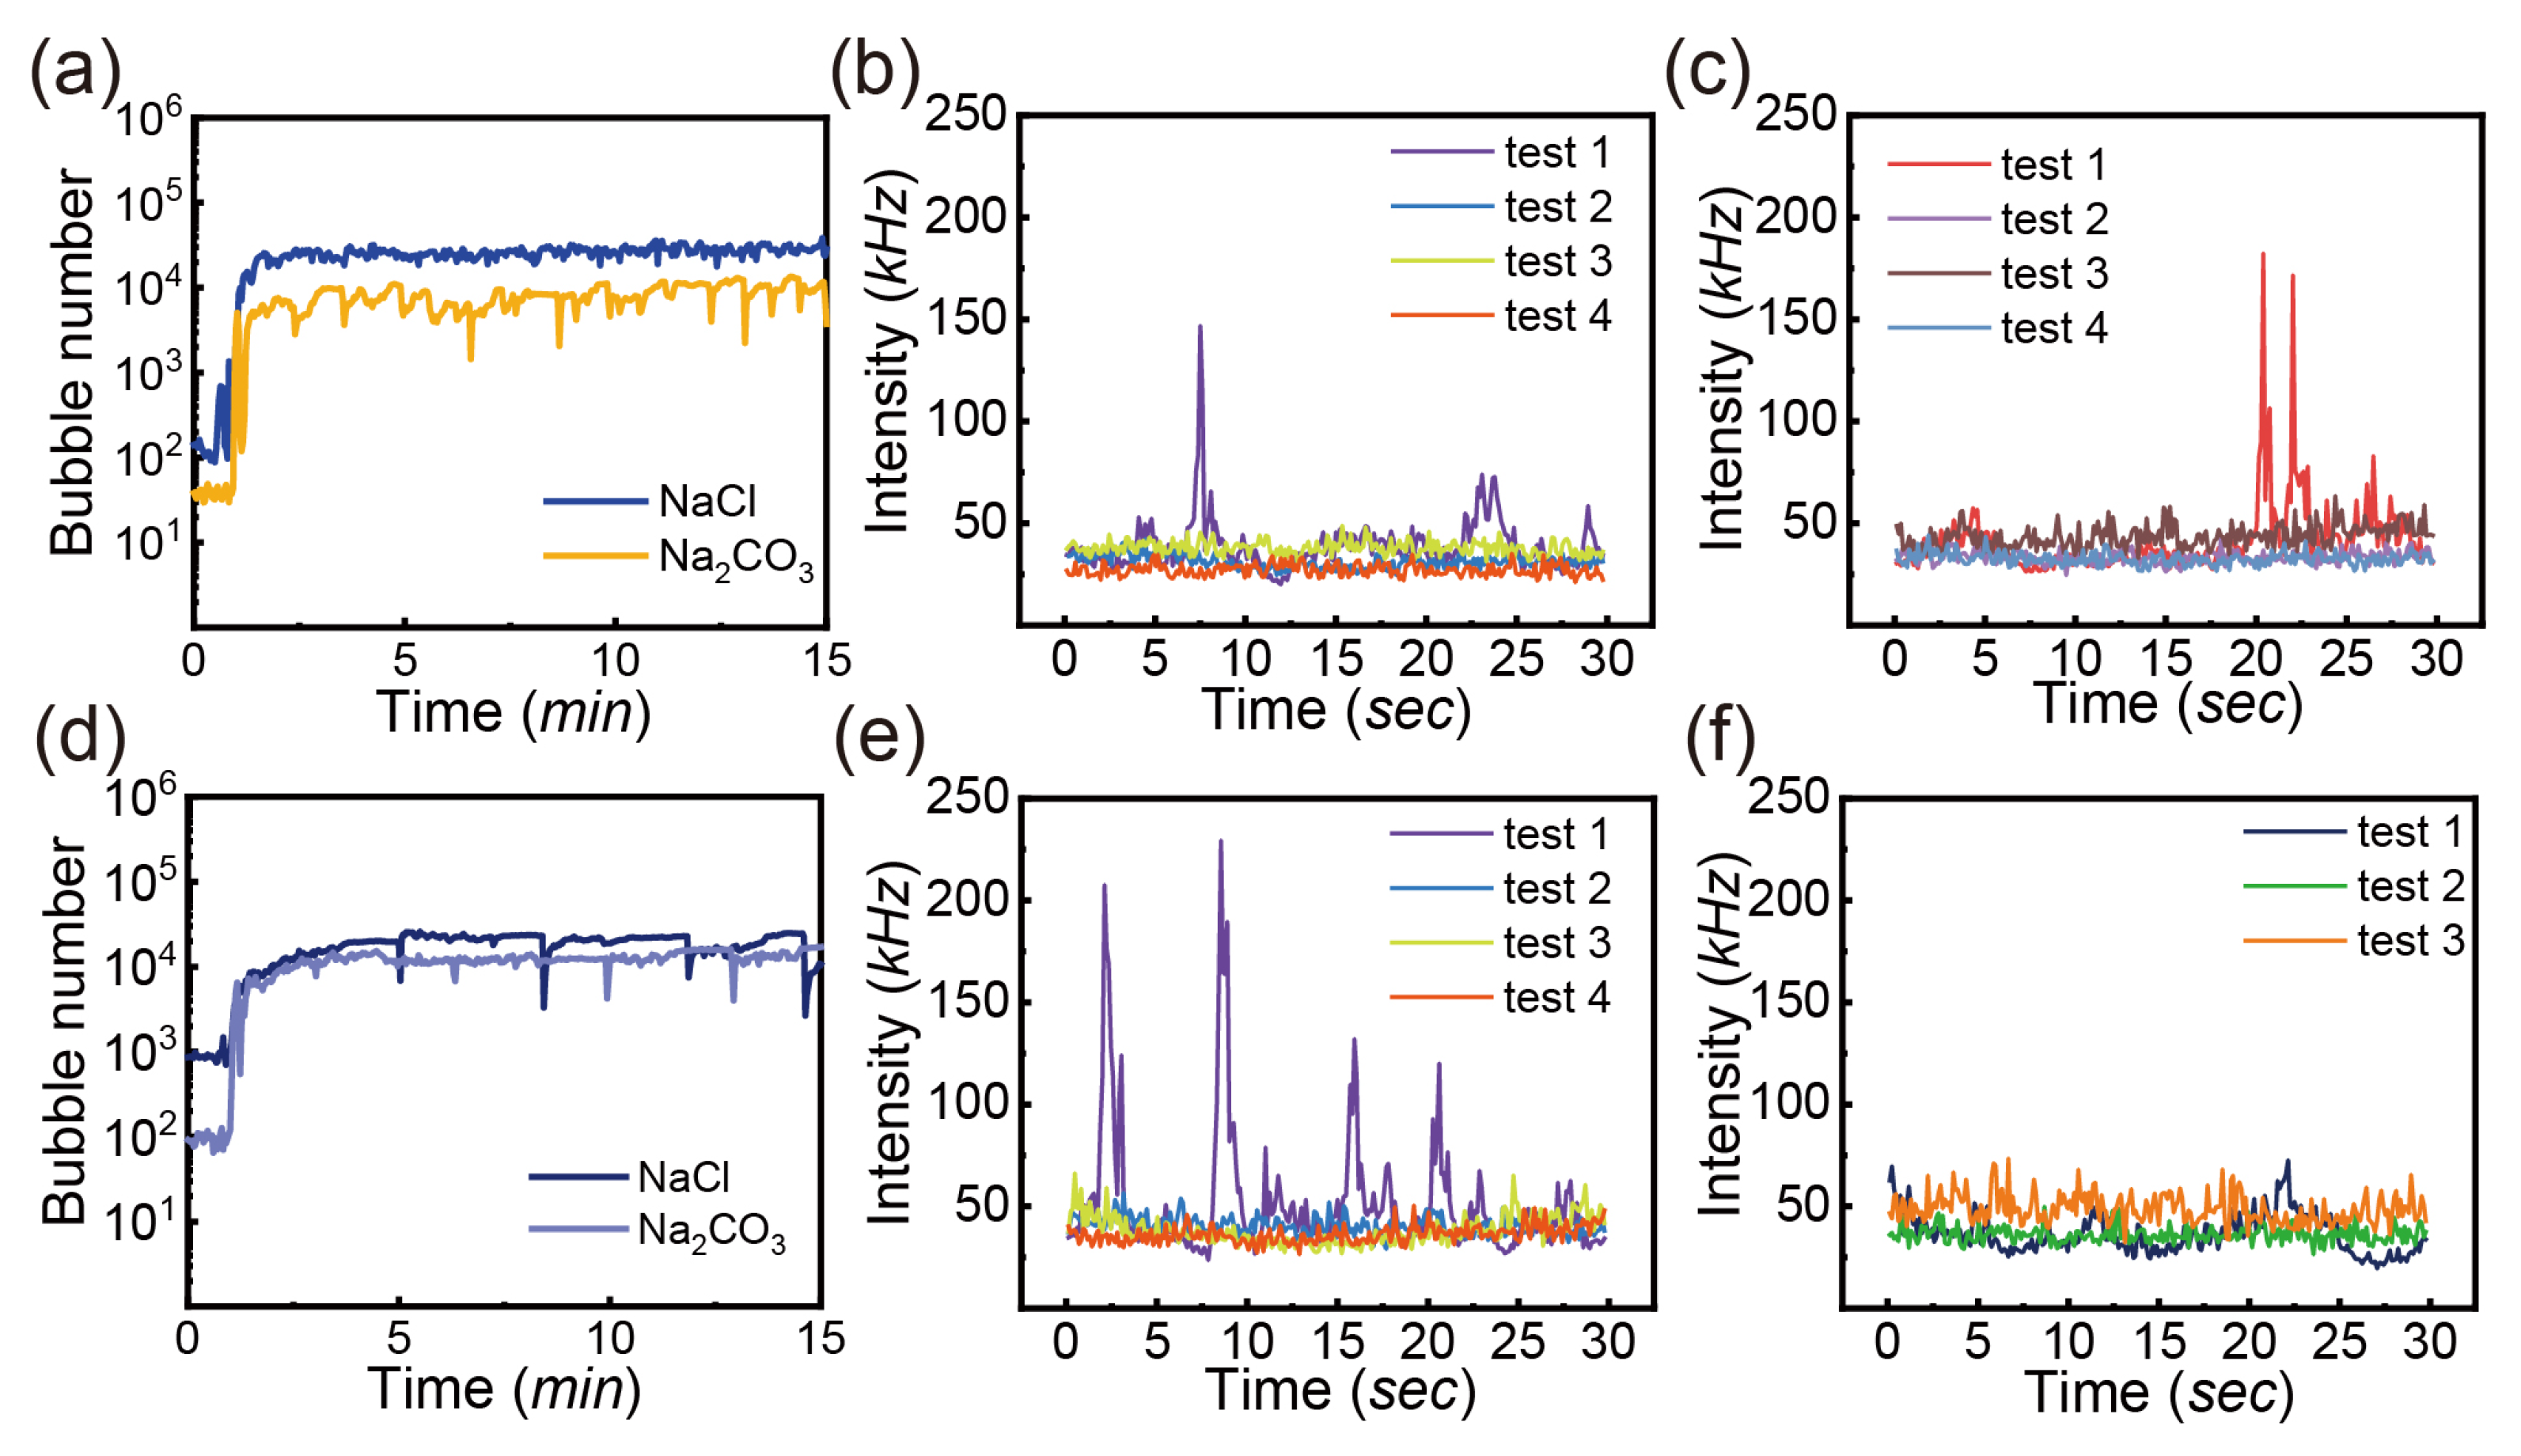
3.3.1. Salts
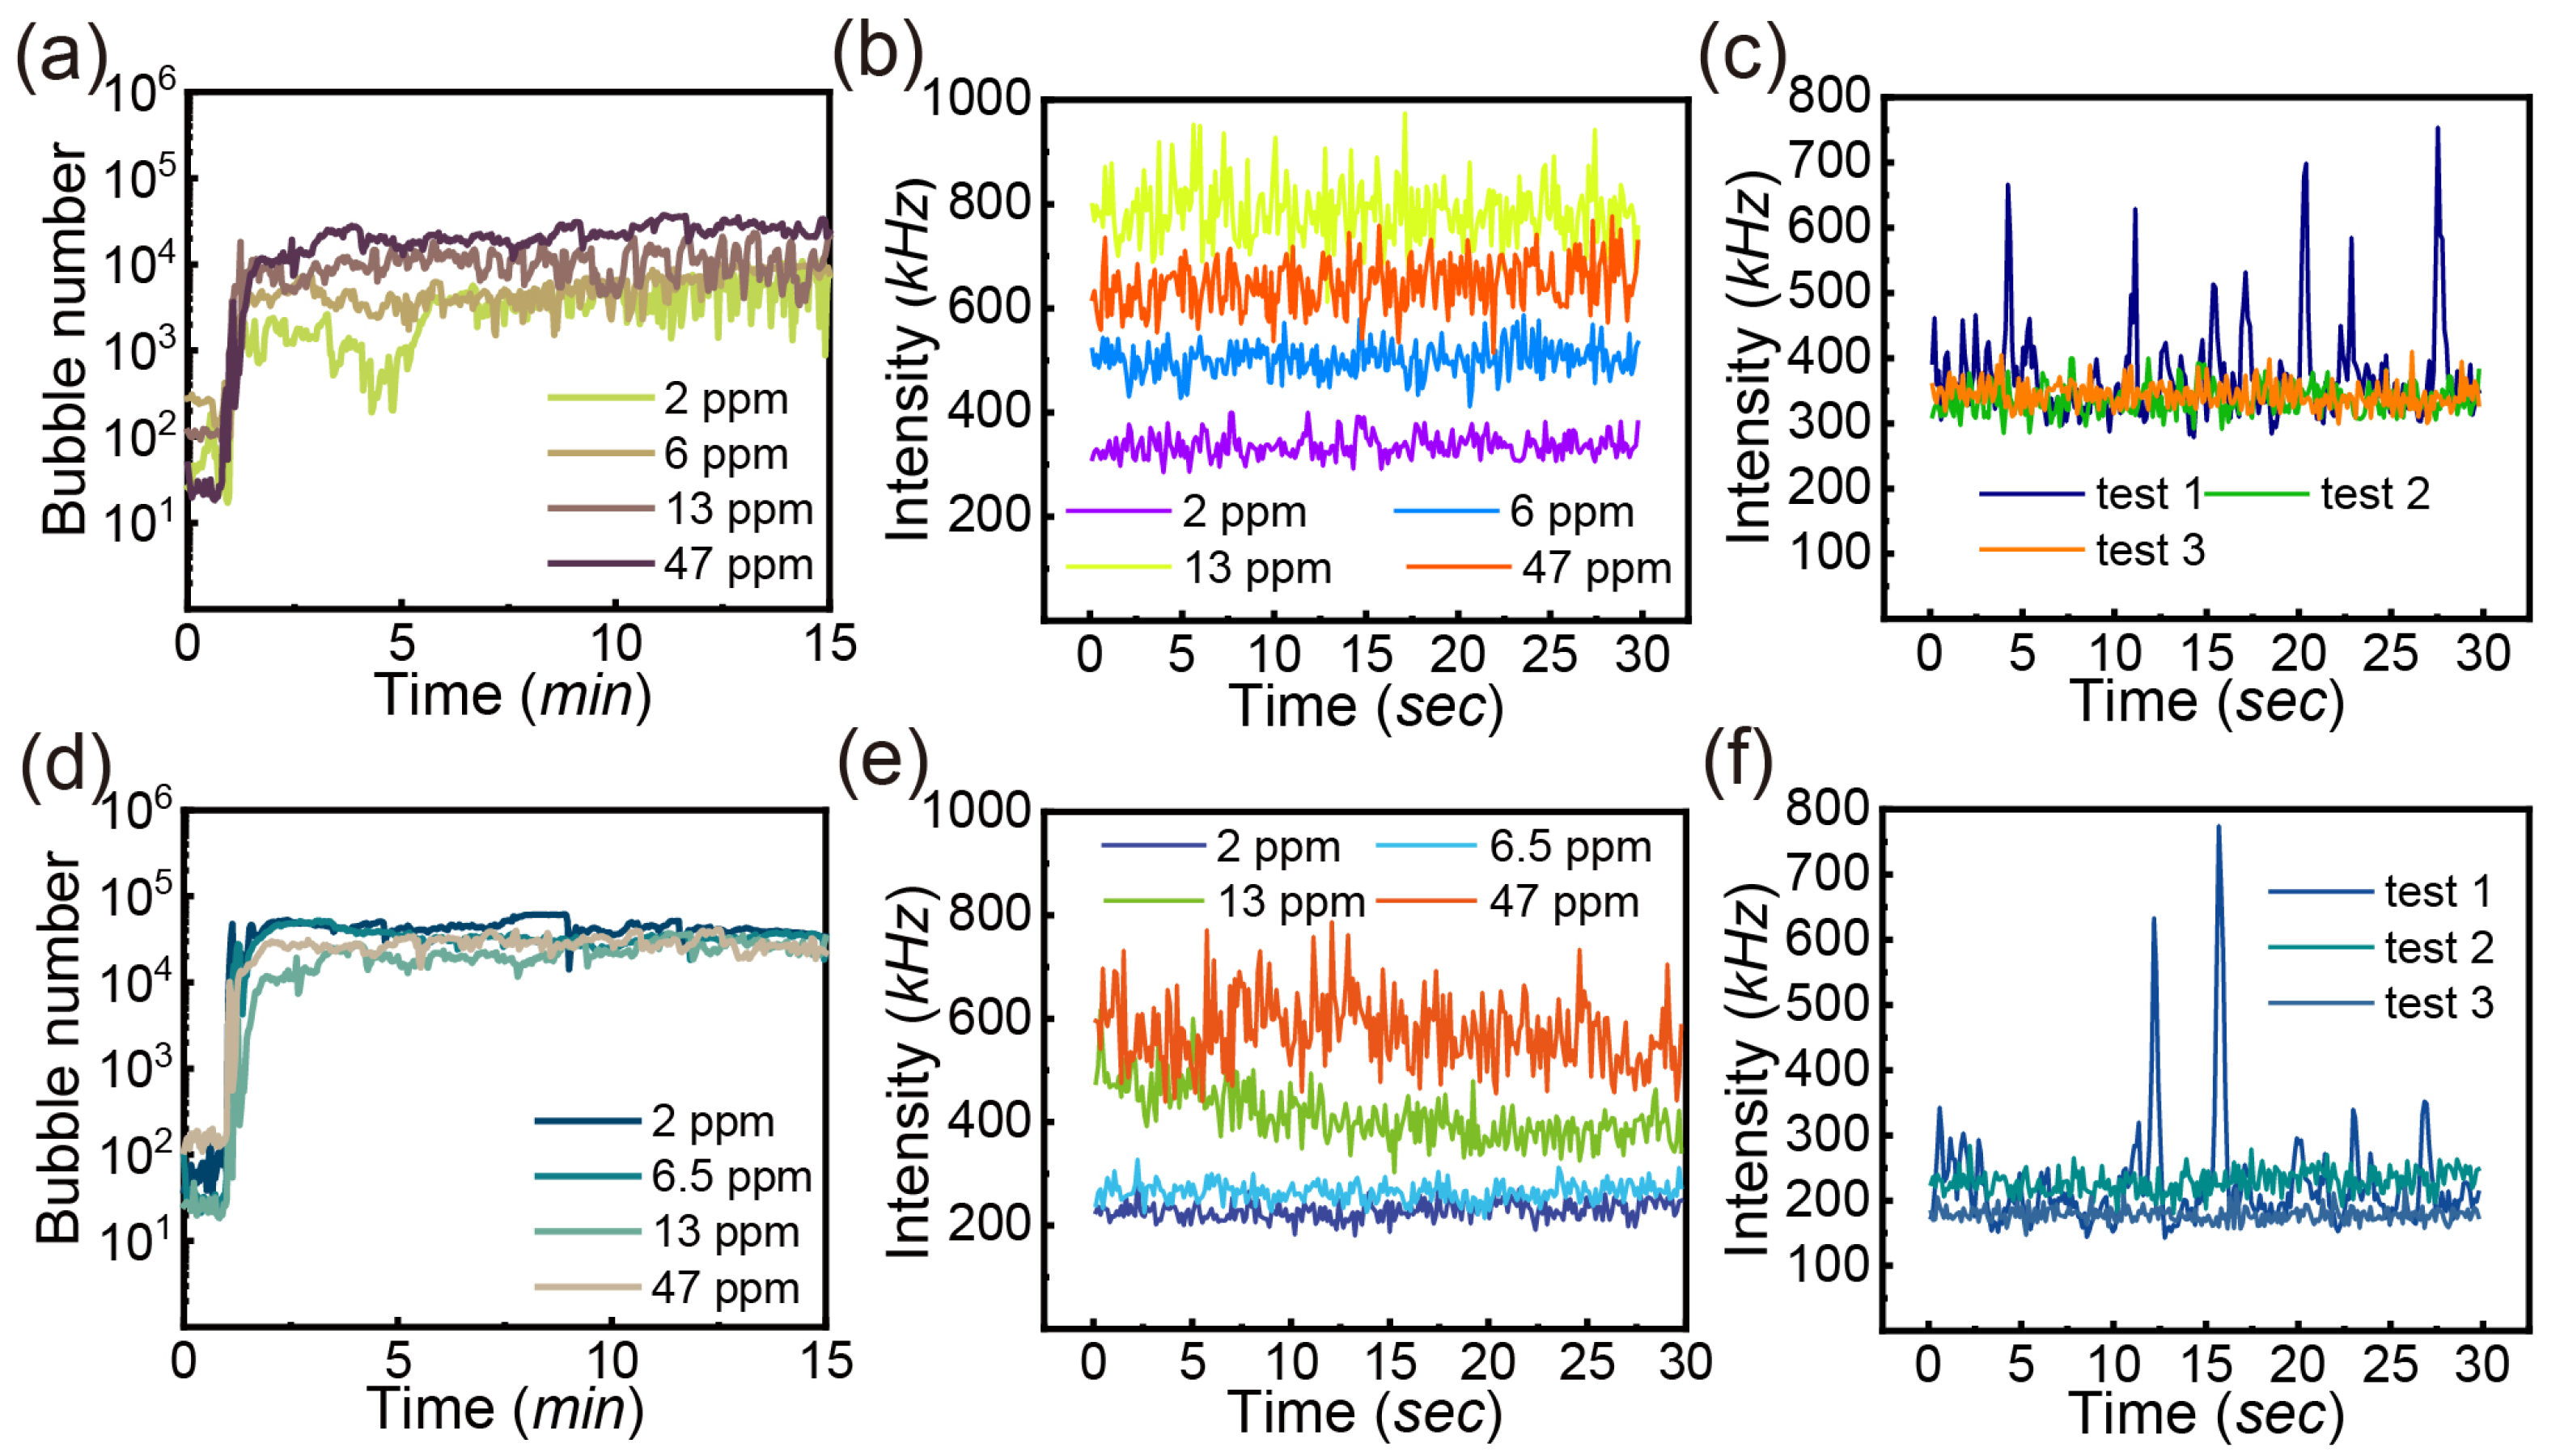
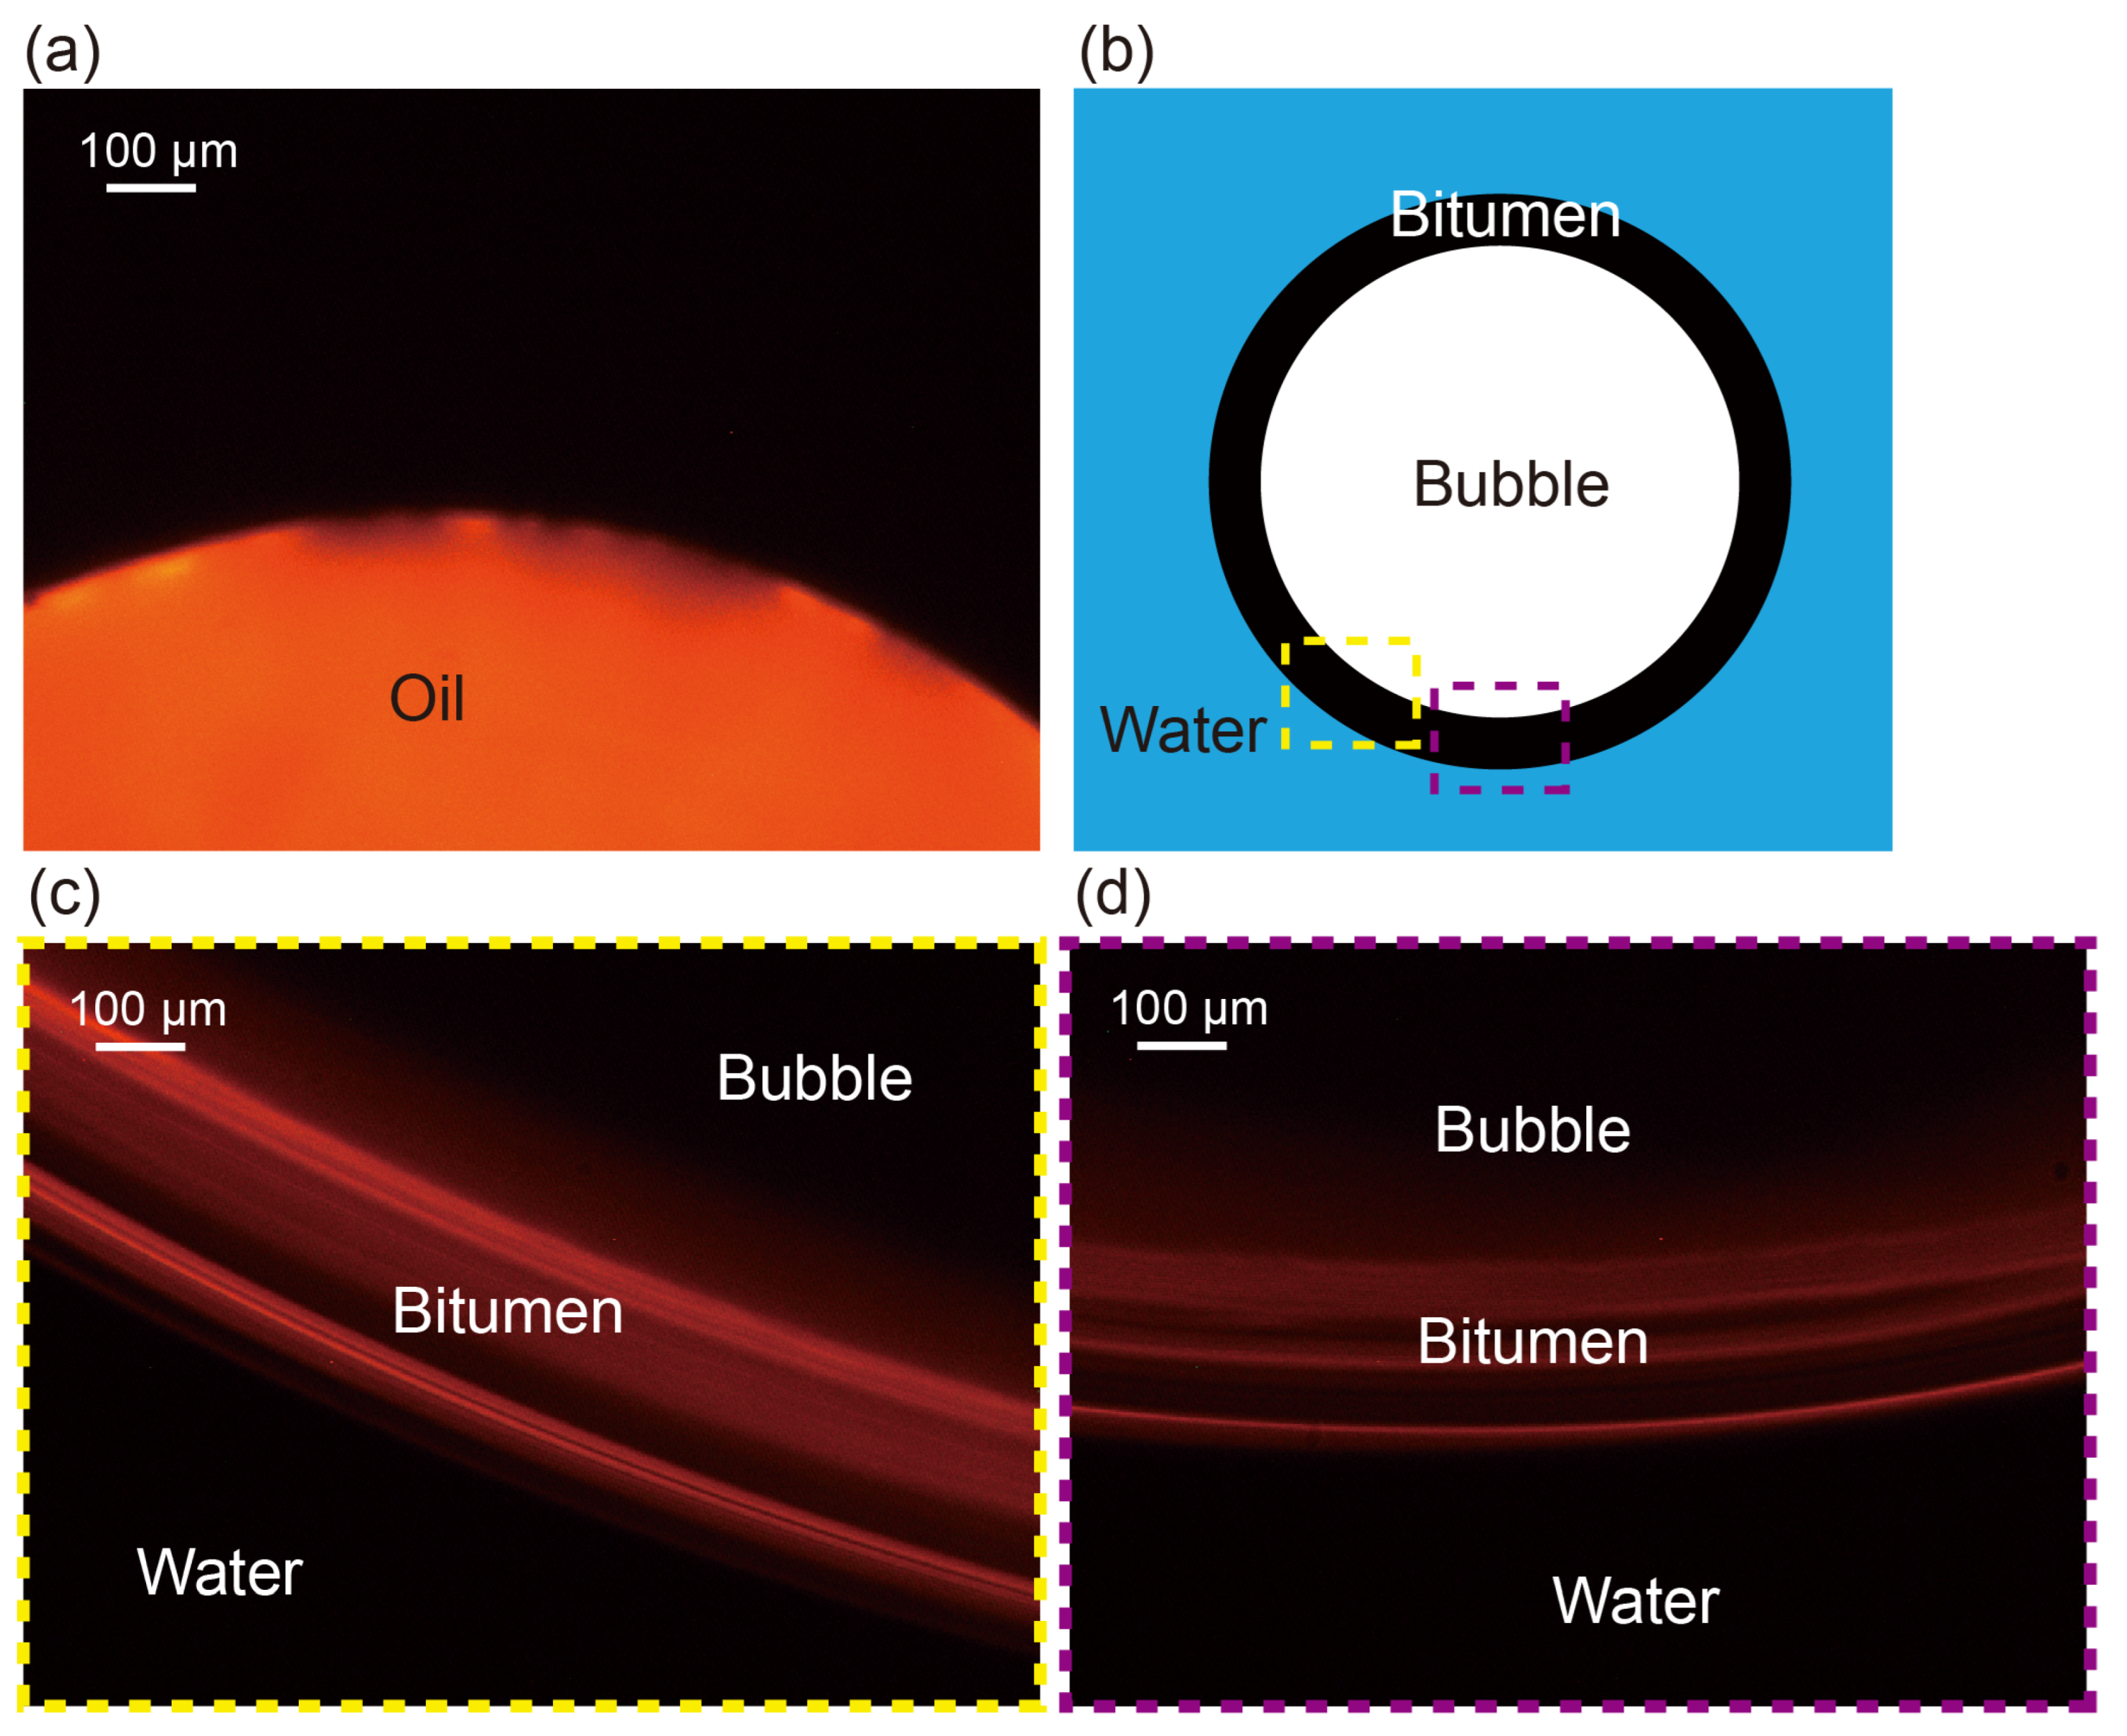
3.3.2. Oil
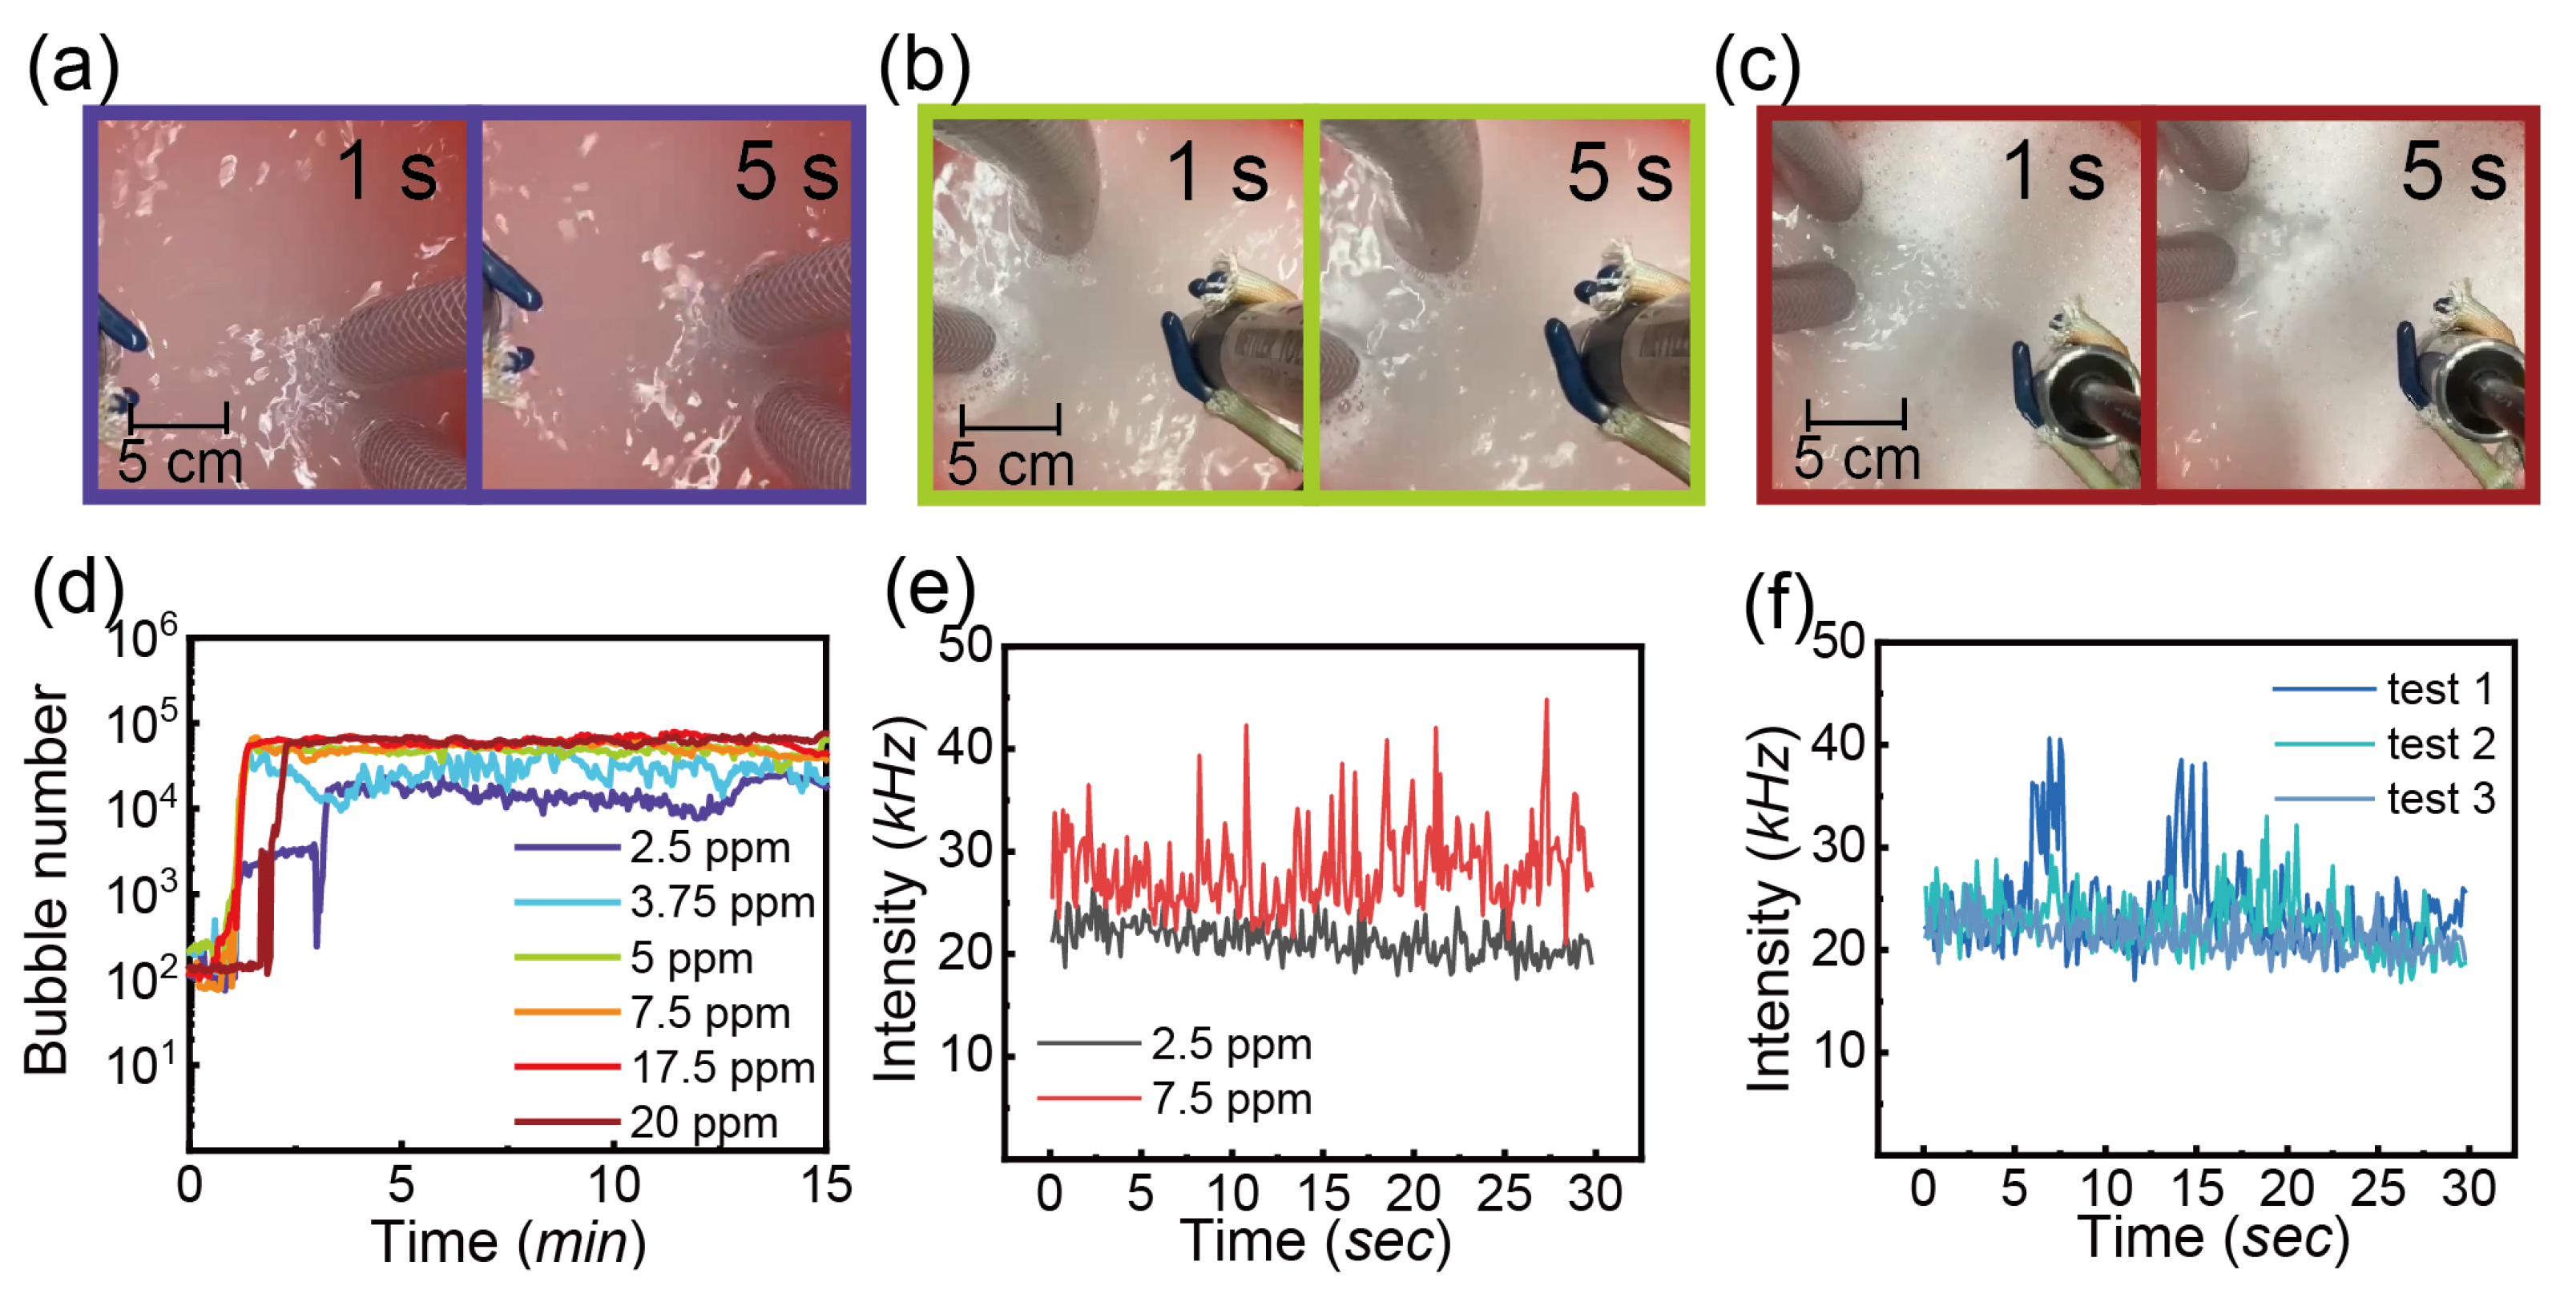
3.3.3. Detergent
4. Conclusions
Supplementary Materials
Author Contributions
Funding
Data Availability Statement
Acknowledgments
Conflicts of Interest
References
- Attard, P. The stability of nanobubbles. Eur. Phys. J. Spec. Top. 2014, 223, 893–914. [Google Scholar] [CrossRef]
- Zhang, X.; Detlef, L. Perspectives on surface nanobubbles. Biomicrofluidics 2014, 8, 041301. [Google Scholar] [CrossRef] [PubMed]
- Meegoda, J.N.; Aluthgun Hewage, S.; Batagoda, J.H. Stability of nanobubbles. Environ. Eng. Sci. 2018, 35, 1216–1227. [Google Scholar] [CrossRef]
- Craig, V.S.J. Very small bubbles at surfaces—The nanobubble puzzle. Soft Matter 2011, 7, 40–48. [Google Scholar] [CrossRef]
- Alheshibri, M.; Qian, J.; Jehannin, M.; Craig, V.S.J. A History of Nanobubbles. Langmuir 2016, 32, 11086–11100. [Google Scholar] [CrossRef]
- Zhou, L.; Wang, S.; Zhang, L.; Hu, J. Generation and stability of bulk nanobubbles: A review and perspective. COCIS 2021, 53, 101439. [Google Scholar] [CrossRef]
- Li, C.; Zhang, H. Surface nanobubbles and their roles in flotation of fine particles—A review. J. Ind. Eng. Chem. 2022, 106, 37–51. [Google Scholar] [CrossRef]
- Ma, F.; Zhang, P.; Tao, D. Surface nanobubble characterization and its enhancement mechanisms for fine-particle flotation: A review. Int. J. Miner. Metall. Mater. 2022, 29, 727–738. [Google Scholar] [CrossRef]
- Zhou, K.; Sontti, S.G.; Zhou, J.; Esmaeili, P.; Zhang, X. Microbubble-Enhanced Bitumen Separation from Tailing Slurries with High Solid Contents. Ind. Eng. Chem. Res. 2022, 61, 17327–17341. [Google Scholar] [CrossRef]
- Wang, C.; Lü, Y.; Song, C.; Zhang, D.; Rong, F.; He, L. Separation of emulsified crude oil from produced water by gas flotation: A review. Sci. Total Environ. 2022, 845, 157304. [Google Scholar] [CrossRef]
- Xia, Y.; Wang, L.; Zhang, R.; Yang, Z.; Xing, Y.; Gui, X.; Cao, Y.; Sun, W. Enhancement of flotation response of fine low-rank coal using positively charged microbubbles. Fuel 2019, 245, 505–513. [Google Scholar] [CrossRef]
- Liu, G.; Wu, Z.; Craig, V.S. Cleaning of protein-coated surfaces using nanobubbles: An investigation using a quartz crystal microbalance. J. Phys. Chem. C 2008, 112, 16748–16753. [Google Scholar] [CrossRef]
- Maoming, F.; Daniel, T.; Honaker, R.; Zhenfu, L. Nanobubble generation and its application in froth flotation (part I): Nanobubble generation and its effects on properties of microbubble and millimeter scale bubble solutions. Int. J. Min. Sci. Technol. 2010, 20, 1–19. [Google Scholar]
- Millare, J.C.; Basilia, B.A. Nanobubbles from ethanol-water mixtures: Generation and solute effects via solvent replacement method. ChemistrySelect 2018, 3, 9268–9275. [Google Scholar] [CrossRef]
- Shen, G.; Zhang, X.H.; Ming, Y.; Zhang, L.; Zhang, Y.; Hu, J. Photocatalytic induction of nanobubbles on TiO2 surfaces. J. Phys. Chem. C 2008, 112, 4029–4032. [Google Scholar] [CrossRef]
- Wang, L.; Ali, J.; Wang, Z.; Oladoja, N.; Cheng, R.; Zhang, C.; Mailhot, G.; Pan, G. Oxygen nanobubbles enhanced photodegradation of oxytetracycline under visible light: Synergistic effect and mechanism. Chem. Eng. J. 2020, 388, 124227. [Google Scholar] [CrossRef]
- Rojviroon, O.; Rojviroon, T. Photocatalytic process augmented with micro/nano bubble aeration for enhanced degradation of synthetic dyes in wastewater. Water Resour. Ind. 2022, 27, 100169. [Google Scholar] [CrossRef]
- Zhou, K.; Yuan, T.; Su, H.; Wang, W. Accessing the spatiotemporal heterogeneities of single nanocatalysts by optically imaging gas nanobubbles. COCIS 2021, 55, 101465. [Google Scholar] [CrossRef]
- Zhang, L.; Zhang, Y.; Zhang, X.; Li, Z.; Shen, G.; Ye, M.; Fan, C.; Fang, H.; Hu, J. Electrochemically controlled formation and growth of hydrogen nanobubbles. Langmuir 2006, 22, 8109–8113. [Google Scholar] [CrossRef]
- Ma, W.; Sun, Z.H.; Gu, Z. Confined Electrochemical Behaviors of Single Platinum Nanoparticles Revealing Ultrahigh Density of Gas Molecules inside a Nanobubble. Anal. Chem. 2023, 95, 3613–3620. [Google Scholar]
- Chen, Q.; Zhao, J.; Deng, X.; Shan, Y.; Peng, Y. Single-Entity Electrochemistry of Nano-and Microbubbles in Electrolytic Gas Evolution. J. Phys. Chem. Lett. 2022, 13, 6153–6163. [Google Scholar] [CrossRef] [PubMed]
- Dyett, B.P.; Zhang, X. Accelerated formation of H2 nanobubbles from a surface nanodroplet reaction. ACS Nano 2020, 14, 10944–10953. [Google Scholar] [CrossRef] [PubMed]
- Li, Z.; Zeng, H.; Zhang, X. Growth rates of hydrogen microbubbles in reacting femtoliter droplets. Langmuir 2022, 38, 6638–6646. [Google Scholar] [CrossRef] [PubMed]
- Ushikubo, F.Y.; Furukawa, T.; Nakagawa, R.; Enari, M.; Makino, Y.; Kawagoe, Y.; Shiina, T.; Oshita, S. Evidence of the existence and the stability of nano-bubbles in water. Colloids Surf. A Physicochem. Eng. Asp. 2010, 361, 31–37. [Google Scholar] [CrossRef]
- Xu, Q.; Nakajima, M.; Ichikawa, S.; Nakamura, N.; Roy, P.; Okadome, H.; Shiina, T. Effects of surfactant and electrolyte concentrations on bubble formation and stabilization. J. Colloid Interface Sci. 2009, 332, 208–214. [Google Scholar] [CrossRef]
- Craig, V.S. Bubble coalescence and specific-ion effects. COCIS 2004, 9, 178–184. [Google Scholar] [CrossRef]
- Liu, Y.; Hou, M.; Yang, G.; Han, B. Solubility of CO2 in aqueous solutions of NaCl, KCl, CaCl2 and their mixed salts at different temperatures and pressures. J. Supercrit. Fluids 2011, 56, 125–129. [Google Scholar] [CrossRef]
- Hewage, S.A.; Kewalramani, J.; Meegoda, J.N. Stability of nanobubbles in different salts solutions. Colloids Surf. A Physicochem. Eng. Asp. 2021, 609, 125669. [Google Scholar] [CrossRef]
- Srinivasa, S.; Flury, C.; Afacan, A.; Masliyah, J.; Xu, Z. Study of bitumen liberation from oil sands ores by online visualization. Energy Fuels 2012, 26, 2883–2890. [Google Scholar] [CrossRef]
- Najafi, A.S.; Xu, Z.; Masliyah, J. Measurement of sliding velocity and induction time of a single micro-bubble under an inclined collector surface. Can. J. Chem. Eng. 2008, 86, 1001–1010. [Google Scholar]
- ezzahra Chakik, F.; Kaddami, M.; Mikou, M. Effect of operating parameters on hydrogen production by electrolysis of water. Int. J. Hydrogen Energy. 2017, 42, 25550–25557. [Google Scholar] [CrossRef]
- Gao, Y.; Dashliborun, A.M.; Zhou, J.Z.; Zhang, X. Formation and stability of cavitation microbubbles in process water from the oilsands industry. Ind. Eng. Chem. Res. 2021, 60, 3198–3209. [Google Scholar] [CrossRef]
- Yasuda, K.; Matsushima, H.; Asakura, Y. Generation and reduction of bulk nanobubbles by ultrasonic irradiation. Chem. Eng. Sci. 2019, 195, 455–461. [Google Scholar] [CrossRef]
- Kalogerakis, N.; Kalogerakis, G.C.; Botha, Q.P. Environmental applications of nanobubble technology: Field testing at industrial scale. Can. J. Chem. Eng. 2021, 99, 2345–2354. [Google Scholar] [CrossRef]
- Li, M.; Bussonnière, A.; Bronson, M.; Xu, Z.; Liu, Q. Study of Venturi tube geometry on the hydrodynamic cavitation for the generation of microbubbles. Miner. Eng. 2019, 132, 268–274. [Google Scholar] [CrossRef]
- Feng, Y.; Mu, H.; Liu, X.; Huang, Z.; Zhang, H.; Wang, J.; Yang, Y. Leveraging 3D printing for the design of high-performance venturi microbubble generators. Ind. Eng. Chem. Res. 2020, 59, 8447–8455. [Google Scholar] [CrossRef]
- Lim, J.; Yeap, S.P.; Che, H.X.; Low, S.C. Characterization of magnetic nanoparticle by dynamic light scattering. Nanoscale Res. Lett. 2013, 8, 1–14. [Google Scholar] [CrossRef]
- Carvalho, P.M.; Felício, M.R.; Santos, N.C.; Gonçalves, S.; Domingues, M.M. Application of light scattering techniques to nanoparticle characterization and development. Front. Chem. 2018, 6, 237. [Google Scholar] [CrossRef]
- Oh, S.H.; Kim, J.M. Generation and stability of bulk nanobubbles. Langmuir 2017, 33, 3818–3823. [Google Scholar] [CrossRef]
- dos Santos, A.P.; Diehl, A.; Levin, Y. Surface tensions, surface potentials and the Hofmeister series of electrolyte solutions. Langmuir 2010, 26, 10778–10783. [Google Scholar] [CrossRef]
- Xie, W.J.; Gao, Y.Q. A simple theory for the Hofmeister series. J. Phys. Chem. Lett. 2013, 4, 4247–4252. [Google Scholar] [CrossRef] [PubMed]
- Li, Y.; Wang, Z.; Guan, B. Separation and identification of nanoplastics in tap water. Environ. Res. 2022, 204, 112134. [Google Scholar] [CrossRef] [PubMed]
- Kwok, M.; McGeorge, S.; Roberts, M.; Somani, B.; Rukin, N. Mineral content variations between Australian tap and bottled water in the context of urolithiasis. BJUI Compass 2022, 3, 377–382. [Google Scholar] [CrossRef] [PubMed]
- Eke-Ejiofor, J.; Beleya, E.; Allen, J. Effect of variety on the quality parameters of crude soybean oil. Am. J. Food Sci. Technol. 2021, 9, 69–75. [Google Scholar]
- Yu, Z.Q.; Chow, P.S.; Tan, R.B. Interpretation of focused beam reflectance measurement (FBRM) data via simulated crystallization. Org. Process Res. Dev. 2008, 12, 646–654. [Google Scholar] [CrossRef]
- Panchal, J.; Kotarek, J.; Marszal, E.; Topp, E.M. Analyzing subvisible particles in protein drug products: A comparison of dynamic light scattering (DLS) and resonant mass measurement (RMM). AAPS J. 2014, 16, 440–451. [Google Scholar] [CrossRef]
- Niu, W.; Chua, Y.A.A.; Zhang, W.; Huang, H.; Lu, X. Highly symmetric gold nanostars: Crystallographic control and surface-enhanced Raman scattering property. J. Am. Chem. Soc. 2015, 137, 10460–10463. [Google Scholar] [CrossRef]
- Geißler, D.; Gollwitzer, C.; Sikora, A.; Minelli, C.; Krumrey, M.; Resch-Genger, U. Effect of fluorescent staining on size measurements of polymeric nanoparticles using DLS and SAXS. Anal. Methods 2015, 7, 9785–9790. [Google Scholar] [CrossRef]
- Zhou, C.; Qi, W.; Lewis, E.N.; Carpenter, J.F. Concomitant Raman spectroscopy and dynamic light scattering for characterization of therapeutic proteins at high concentrations. Anal. Biochem. 2015, 472, 7–20. [Google Scholar] [CrossRef]
- Sovechles, J.; Lepage, M.; Johnson, B.; Waters, K. Effect of gas rate and impeller speed on bubble size in frother-electrolyte solutions. Miner. Eng. 2016, 99, 133–141. [Google Scholar] [CrossRef]
- Han, Y.; Wang, X.; Zhu, J.; Wang, P. Gas Dispersion Characteristics in a Novel Jet-Stirring Coupling Flotation Device. ACS Omega 2022, 7, 9061–9070. [Google Scholar] [CrossRef]
- Reinke, P.; Ahlrichs, J.; Beckmann, T.; Schmidt, M. Bubble Dynamics in a Narrow Gap Flow under the Influence of Pressure Gradient and Shear Flow. Fluids 2020, 5, 208. [Google Scholar] [CrossRef]
- Hamamoto, S.; Takemura, T.; Suzuki, K.; Nishimura, T. Effects of pH on nano-bubble stability and transport in saturated porous media. J. Contam. Hydrol. 2018, 208, 61–67. [Google Scholar] [CrossRef]
- Tabor, R.F.; Chan, D.Y.; Grieser, F.; Dagastine, R.R. Anomalous stability of carbon dioxide in pH-controlled bubble coalescence. Angew. Chem. 2011, 123, 3516–3518. [Google Scholar] [CrossRef]
- Kracht, W.; Finch, J. Bubble break-up and the role of frother and salt. Int. J. Miner. Process. 2009, 92, 153–161. [Google Scholar] [CrossRef]
- Quinn, J.; Sovechles, J.; Finch, J.; Waters, K. Critical coalescence concentration of inorganic salt solutions. Miner. Eng. 2014, 58, 1–6. [Google Scholar] [CrossRef]
- Craig, V.S.; Ninham, B.W.; Pashley, R.M. The effect of electrolytes on bubble coalescence in water. J. Phys. Chem. 1993, 97, 10192–10197. [Google Scholar] [CrossRef]
- Henry, C.L.; Dalton, C.N.; Scruton, L.; Craig, V.S. Ion-specific coalescence of bubbles in mixed electrolyte solutions. J. Phys. Chem. C 2007, 111, 1015–1023. [Google Scholar] [CrossRef]
- Hsu, J.P.; Nacu, A. Behavior of soybean oil-in-water emulsion stabilized by nonionic surfactant. J. Colloid Interface Sci. 2003, 259, 374–381. [Google Scholar] [CrossRef]
- Motamed Dashliborun, A.; Zhou, J.; Esmaeili, P.; Zhang, X. Microbubble-enhanced recovery of residual bitumen from the tailings of oil sands extraction in a laboratory-scale pipeline. Energy Fuels 2020, 34, 16476–16485. [Google Scholar] [CrossRef]
- Masliyah, J.H.; Czarnecki, J.; Xu, Z. Handbook on Theory and Practice on Bitumen Recovery from Athabasca Oil Sands; Kingsley Publishing Services: Pretoria, South Africa, 2011. [Google Scholar]
- Zhou, J.Z.; Li, H.; Chow, R.S.; Liu, Q.; Xu, Z.; Masliyah, J. Role of mineral flotation technology in improving bitumen extraction from mined Athabasca oil sands—II. Flotation hydrodynamics of water-based oil sand extraction. Can. J. Chem. Eng. 2020, 98, 330–352. [Google Scholar] [CrossRef]
- Behrens, S.H. Oil-coated bubbles in particle suspensions, capillary foams and related opportunities in colloidal multiphase systems. COCIS 2020, 50, 101384. [Google Scholar] [CrossRef]
- Yan, S.; Yang, X.; Bai, Z.; Xu, X.; Wang, H. Drop attachment behavior of oil droplet-gas bubble interactions during flotation. Chem. Eng. Sci. 2020, 223, 115740. [Google Scholar] [CrossRef]
- Sahasrabudhe, S.N.; Rodriguez-Martinez, V.; O’Meara, M.; Farkas, B.E. Density, viscosity and surface tension of five vegetable oils at elevated temperatures: Measurement and modeling. Int. J. Food Prop. 2017, 20, 1965–1981. [Google Scholar] [CrossRef]
- Grau, R.A.; Laskowski, J.S.; Heiskanen, K. Effect of frothers on bubble size. Int. J. Miner. Process. 2005, 76, 225–233. [Google Scholar] [CrossRef]
- Golemanov, K.; Denkov, N.; Tcholakova, S.; Vethamuthu, M.; Lips, A. Surfactant mixtures for control of bubble surface mobility in foam studies. Langmuir 2008, 24, 9956–9961. [Google Scholar] [CrossRef]
- Staszak, K.; Wieczorek, D.; Michocka, K. Effect of sodium chloride on the surface and wetting properties of aqueous solutions of cocamidopropyl betaine. J. Surfactants Deterg. 2015, 18, 321–328. [Google Scholar] [CrossRef]
- Oliveira, E.; Boock, K.; Maruno, M.; Rocha-Filho, P.A.d. Accelerated stability and moisturizing capacity of emulsions presenting lamellar gel phase obtained from brazilian natural raw material. J. Dispers. Sci. Technol. 2011, 32, 1135–1139. [Google Scholar] [CrossRef]
- Bacdown Handsoap. Available online: https://deconlabs.com/products/skin-care-bacdown-handsoap/ (accessed on 22 April 2023).
- Water Quality Reports: Edmonton. Available online: https://www.epcor.com/products-services/water/water-quality/Pages/water-quality-reports-edmonton.aspx/waterworks (accessed on 22 April 2023).


| Gas Type | Air | CO2 |
|---|---|---|
| Operating conditions | ||
| P (psi) | 62 | 58, 62 |
| (L/min) | 0.4 | 0.4, 1 |
| T (°C) | 20 | 20 |
| Chemical addition @ 62 psi, 20 °C and of 0.4 L/min | ||
| Hand soap (ppm) | 2.5, 3.75, 5,7.5, 17.5, 20 | 2.5, 5, 7.5,10, 17.5 |
| NaCl (ppm) | 50 | 50 |
| Na2CO3 (ppm) | 50 | 50 |
| Soybean oil (ppm) | 1, 2, 6, 13, 47 | 2, 6.5, 13, 47 |
Disclaimer/Publisher’s Note: The statements, opinions and data contained in all publications are solely those of the individual author(s) and contributor(s) and not of MDPI and/or the editor(s). MDPI and/or the editor(s) disclaim responsibility for any injury to people or property resulting from any ideas, methods, instructions or products referred to in the content. |
© 2023 by the authors. Licensee MDPI, Basel, Switzerland. This article is an open access article distributed under the terms and conditions of the Creative Commons Attribution (CC BY) license (https://creativecommons.org/licenses/by/4.0/).
Share and Cite
Zhou, K.; Maugard, V.; Zhang, W.; Zhou, J.; Zhang, X. Effects of Gas Type, Oil, Salts and Detergent on Formation and Stability of Air and Carbon Dioxide Bubbles Produced by Using a Nanobubble Generator. Nanomaterials 2023, 13, 1496. https://doi.org/10.3390/nano13091496
Zhou K, Maugard V, Zhang W, Zhou J, Zhang X. Effects of Gas Type, Oil, Salts and Detergent on Formation and Stability of Air and Carbon Dioxide Bubbles Produced by Using a Nanobubble Generator. Nanomaterials. 2023; 13(9):1496. https://doi.org/10.3390/nano13091496
Chicago/Turabian StyleZhou, Kaiyu, Vincent Maugard, Wenming Zhang, Joe Zhou, and Xuehua Zhang. 2023. "Effects of Gas Type, Oil, Salts and Detergent on Formation and Stability of Air and Carbon Dioxide Bubbles Produced by Using a Nanobubble Generator" Nanomaterials 13, no. 9: 1496. https://doi.org/10.3390/nano13091496
APA StyleZhou, K., Maugard, V., Zhang, W., Zhou, J., & Zhang, X. (2023). Effects of Gas Type, Oil, Salts and Detergent on Formation and Stability of Air and Carbon Dioxide Bubbles Produced by Using a Nanobubble Generator. Nanomaterials, 13(9), 1496. https://doi.org/10.3390/nano13091496