Article

High-Accuracy Neural Network Interatomic Potential for Silicon Nitride

1
The Institute of Technological Sciences, Wuhan University, Wuhan 430072, China
2
School of Power and Mechanical Engineering, Wuhan University, Wuhan 430072, China
3
School of Electrical and Automation, Wuhan University, Wuhan 430072, China
*
Authors to whom correspondence should be addressed.
Nanomaterials 2023, 13(8), 1352; https://doi.org/10.3390/nano13081352
Submission received: 14 March 2023 / Revised: 6 April 2023 / Accepted: 9 April 2023 / Published: 13 April 2023
(This article belongs to the Special Issue Theoretical Calculation and Molecular Modeling of Nanomaterials)

Abstract

:
In the field of machine learning (ML) and data science, it is meaningful to use the advantages of ML to create reliable interatomic potentials. Deep potential molecular dynamics (DEEPMD) are one of the most useful methods to create interatomic potentials. Among ceramic materials, amorphous silicon nitride (SiNx) features good electrical insulation, abrasion resistance, and mechanical strength, which is widely applied in industries. In our work, a neural network potential (NNP) for SiNx was created based on DEEPMD, and the NNP is confirmed to be applicable to the SiNx model. The tensile tests were simulated to compare the mechanical properties of SiNx with different compositions based on the molecular dynamic method coupled with NNP. Among these SiNx, Si3N4 has the largest elastic modulus (E) and yield stress (σs), showing the desired mechanical strength owing to the largest coordination numbers (CN) and radial distribution function (RDF). The RDFs and CNs decrease with the increase of x; meanwhile, E and σs of SiNx decrease when the proportion of Si increases. It can be concluded that the ratio of nitrogen to silicon can reflect the RDFs and CNs in micro level and macro mechanical properties of SiNx to a large extent.

1. Introduction

Molecular dynamics (MD) mainly rely on Newtonian mechanics to simulate the motion of molecular systems. Compared with the expensive cost of the experiment, the MD method is a cost-effective and efficient tool for exploring the properties of various complicated new materials. To make sure the simulation results match well with the experiments, it is important to use an accurate description of interatomic interactions. Quantum mechanics (QM) simulations, such as the ab initio molecular dynamics (AIMD) method based on the density functional theory (DFT), are the most reliable way to describe the atomic interactions for different systems [1,2,3,4,5]. Although AIMD exhibits desirable computational accuracy, the time cost of AIMD is very high, which limits the application of AIMD. To balance the calculation performance and speed of MD simulations, empirical interatomic potentials have been applied to MD simulations. Empirical interatomic potentials, including Lennard–Jones (LJ) [6], embedded atom method (EAM) [7,8], the Stillinger–Weber (SW) [9,10], Tersoff [11] and charge-optimized many-body (COMB) [12] potentials obviously improved the calculation performance and speed of MD. However, the application of these empirical potentials is hindered by their poor transferability. In terms of systems described by two-body interactions, the LJ potential has favorable accuracy. The SW and Tersoff potentials are able to combine two-body and three-body interactions to stabilize tetrahedral solids, but the description accuracy of bond breaking and metallic phases of silicon and carbon is not sufficient. Owing to the rapid development of machine learning (ML) and data science, it is meaningful to take the advantages of ML to create reliable ML interatomic potentials to replace the conventional empirical potentials [13,14,15]. In 2007, J. Behler and M. Parrinello first proposed a method to create ML interatomic potentials based on artificial neural network deep learning [16]. Various ML potentials have been generated and further applied to material property calculations. Among these ML potential training methods, deep potential molecular dynamics (DEEPMD) is one of the most useful methods to create interatomic potentials recently [16,17]. Results prove that the various systems that used DEEPMD methods delivered good accuracy [18,19]. For example, Wang et al. developed a DEEPMD potential to describe the properties of Li-Si alloys [20]. The DEEPMD potential is about 20 times faster than the AIMD simulations. Meanwhile, the accuracy of DEEPMD potential is comparable with that of AIMD.
Amorphous silicon nitride (SiNx) has been widely used in advanced semiconductor packaging owing to its good electrical insulation, abrasion resistance, and mechanical strength [21,22,23].
However, compared to the plenty of experimental studies about SiNx, there is less research about SiNx on theoretical calculations at present [24,25,26]. In this work, we conducted a preliminary and comprehensive theoretical calculation of SiNx. At the same time, considering that current classic MD potentials are not suitable for SiNx simulations due to efficiency and accuracy [27,28,29,30,31,32], it is of great interest to train a new potential to describe the interatomic interactions.
In our work, a neural network potential (NNP) was trained based on the ML in the DEEMD package for SiNx with the 3:4 composition, owing to its high stability. To validate the accuracy of the NNP, the energies and forces obtained by the NNP were compared with its AIMD counterpart. The structure and properties of Si3N4 calculated -by MD + NNP were compared with the AIMD through the radial distribution functions (RDFs), coordination numbers (CNs), and bond angle distributions (BADs). Similar to the empirical potentials, the NNP trained by DEEPMD can also be used for SiNx with different compositions. Therefore, the NNP was confirmed to be reliable and applicable for SiNx. In the following parts, SiNx all refers to the amorphous silicon nitride with different compositions. Then, the NNP was applied to MD simulations to predict the properties of SiNx. To further investigate the influence of compositions on the mechanical properties of SiNx, the tensile tests of SiNx were carried out at 300 K. Among these SiNx models, the Si3N4 has the desired mechanical strength, which is consistent with the microstructure, including the maximal RDF peak and CNs.

2. Materials and Methods

DEEPMD is one of the most popular methods to create interatomic potentials recently owing to its calculation speed and accuracy [17,33]. The details of the NNP training process are listed as follows.

2.1. AIMD Calculations

In our work, Si3N4 was chosen as an example to train the NNP because of the high stability of the 3:4 composition. The training database of Si3N4 at different temperatures was obtained by first-principles calculations using the Vienna ab initio simulation package (VASP) [34]. The exchange–correlation interaction was described by Perdew–Burke–Ernzerhof (PBE) functional [35]. The interaction between electrons and ions was described by the projector-augmented wave (PAW) approach. The cut-off energy is 520 eV. We use the k-point mesh grid with a spacing of 0.4 Å within the Gamma-centered k-sampling to sample the Brillouin zone. The initial Si3N4 configuration with 112 atoms is a cube with randomly distributed atoms; the model was built by LAMMPS “create_atoms” command and modified by Material Studio. The periodic boundary conditions were applied in x, y, and z directions. The cube size in the x, y, and z directions is 11.935 Å, 11.935 Å, and 11.55 Å, respectively. The AIMD calculations were fulfilled at a constant temperature of 2000 K with an NVT ensemble. The Nose-Hoover thermostat was used to control the temperature of the AIMD simulation. The timestep is 1 fs running 10,000 steps. The energy and force errors less than 10−5 eV/atom and 0.01 eV/Å, respectively, are convergence criteria for geometry optimization.

2.2. Deep Potential Training Process

Based on the AIMD calculations, 10,000 data points were transferred from the output file “OUTCAR”; the data points were divided into five sets. The four sets were used for training databases, with the remaining one selected as a testing database. The smooth edition of the DEEPMD and DeepPot-SE model, implemented in the DEEPMD-kit package [33], was used to train the interatomic potential. The cutoff radius of the model is 6.0 Å for neighbor searching with the smoothing function starting from 5.8 Å. The hidden layers were divided into three layers, and the number of neurons in each layer is 25, 50, and 100, respectively. The learning rate starts from 0.001 using a decay rate of 0.95 every 5000 steps. The decay step and stop learning rate are 5000 and 3.51 × 10⁻⁸, respectively. Based on the datasets of AIMD calculations at 2000 K, the NNP potential at 2000 K was obtained. In order to obtain a high-quality potential, a training database including different temperatures is crucial; as a result, the same method was used for the 3000 K potential training as well. Then, the 2000 K and 3000 K NNP potentials were combined to achieve a new NNP. Finally, the NNP was frozen, and the frozen model can be used in model testing and MD simulations.

3. Results and Discussions

3.1. The Accuracy of NNP

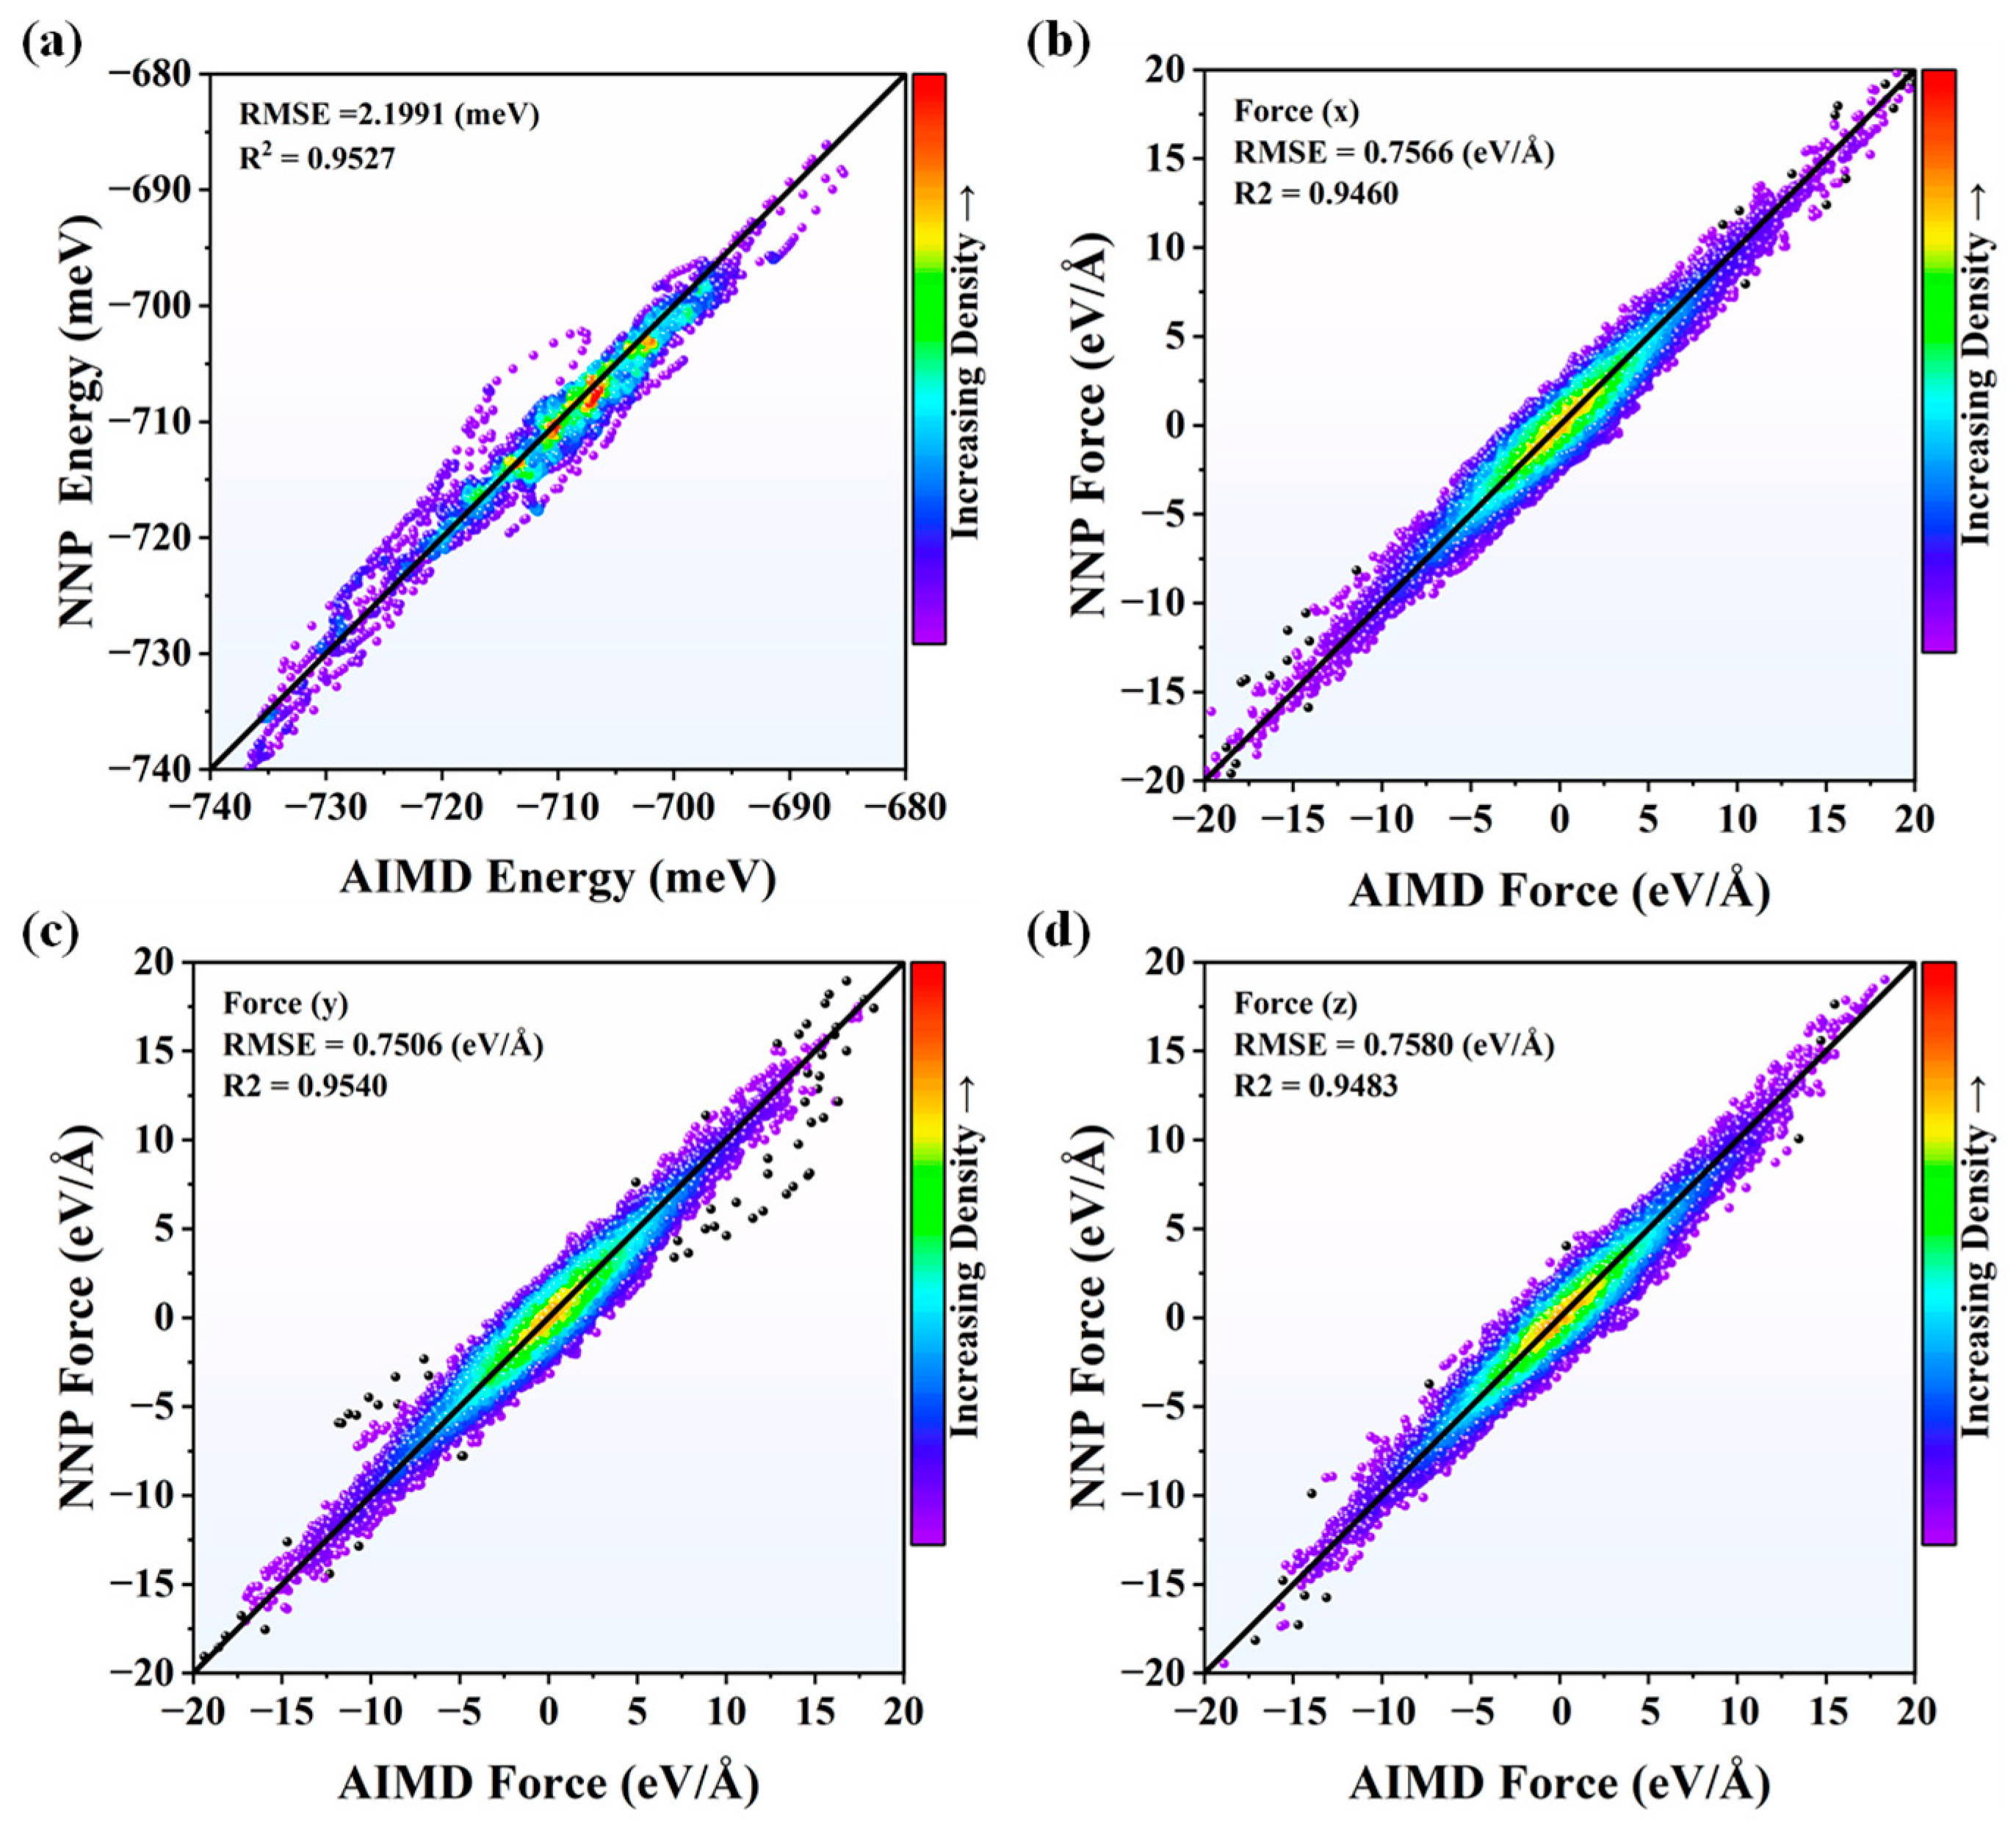
To verify the accuracy of NNP at 2000 K and 3000 K, the energies and forces from NNP after DEEPMD training were compared with those from AIMD shown in Figure 1 and Figure 2. The results show that the validation data generally distribute around the y = x line, showing that the obtained potential can predict the energies and forces precisely. The root-mean-square errors (RMSEs) and R-Square (R2) of energies were calculated to evaluate the performance of NNP. The smaller RMSEs mean better prediction. On the contrary, the higher R2, between 0 and 1, indicates better results. It can be seen that the NNP with larger R2 and smaller RMSE at y and z directions, respectively, works better than that of the x direction, both in Figure 1 and Figure 2. Meanwhile, the R2 and RMSE are acceptable for NNP at x direction as well.
To further validate the reliability of NNP, the RDFs, CNs, and BADs of Si3N4 calculated by NNP were compared with those of AIMD. To research these properties of Si3N4, a simulation at 2000 K was conducted by a large-scale atomic/molecular massively parallel simulator (LAMMPS) [36] with the MD [37]. The detailed simulation parameters are shown in the Supplementary Material. The RDFs, also known as pair correlation function, usually refer to the distribution probability of other particles in the Δ r thickness shell at the distance r of a specified particle. RDFs are widely used to study the degree of order of materials and describe the correlation of atoms, which can be calculated by
g α β ( r ) = V N α N β α N α β ( r , r ) 4 π r 2
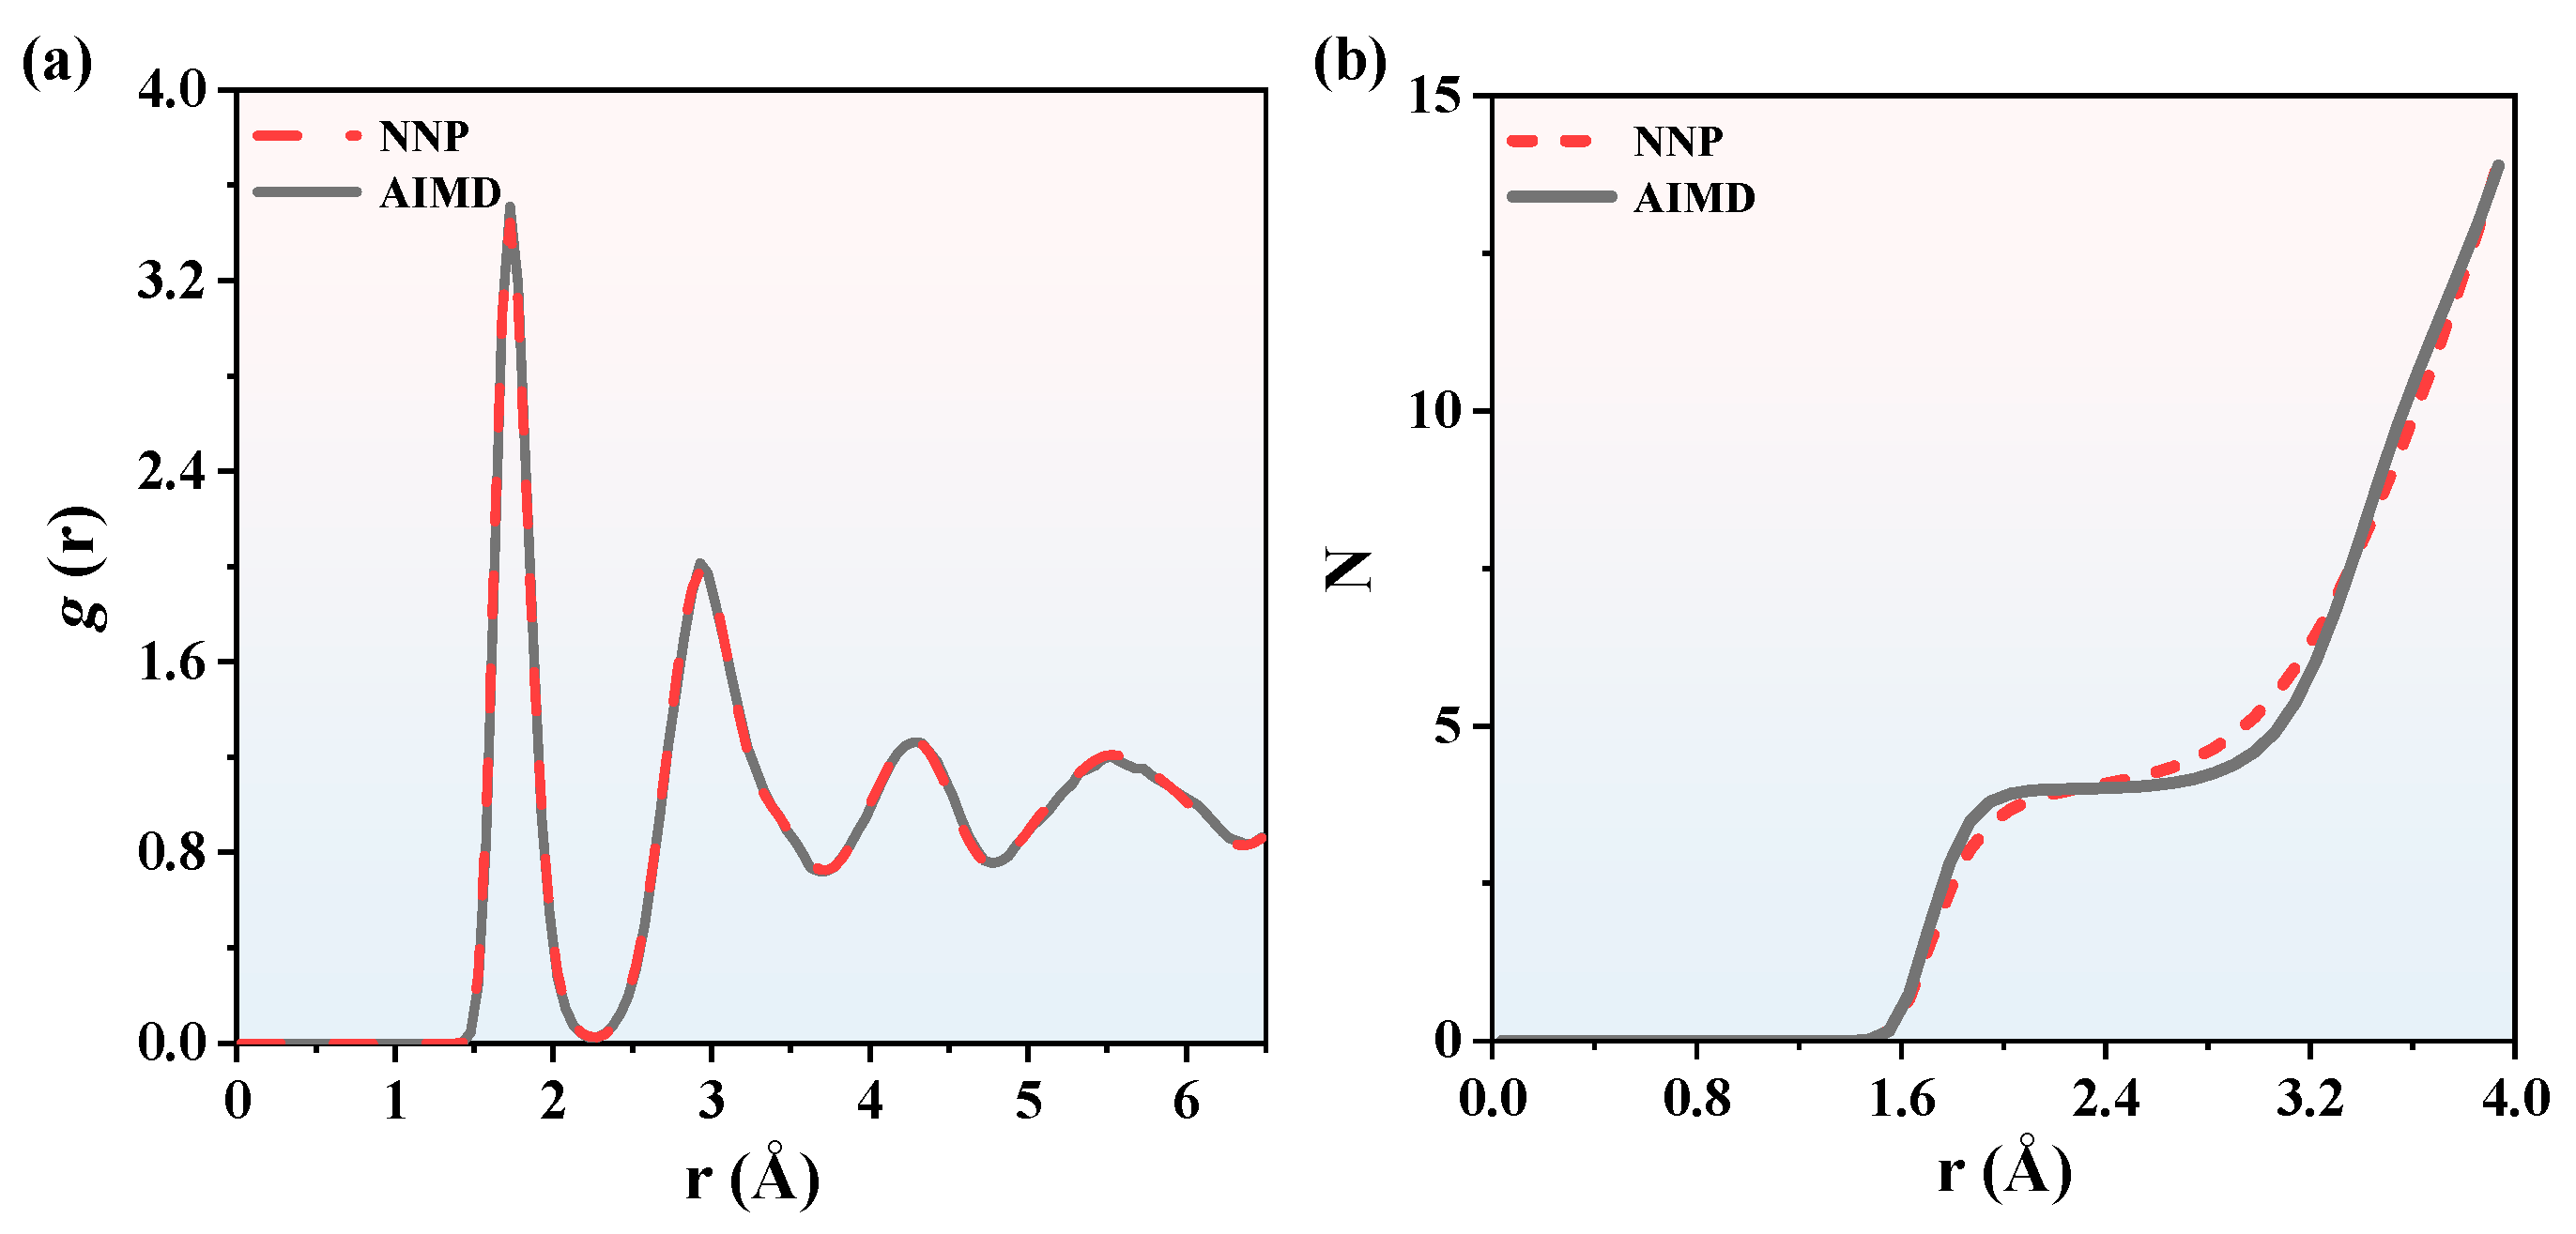
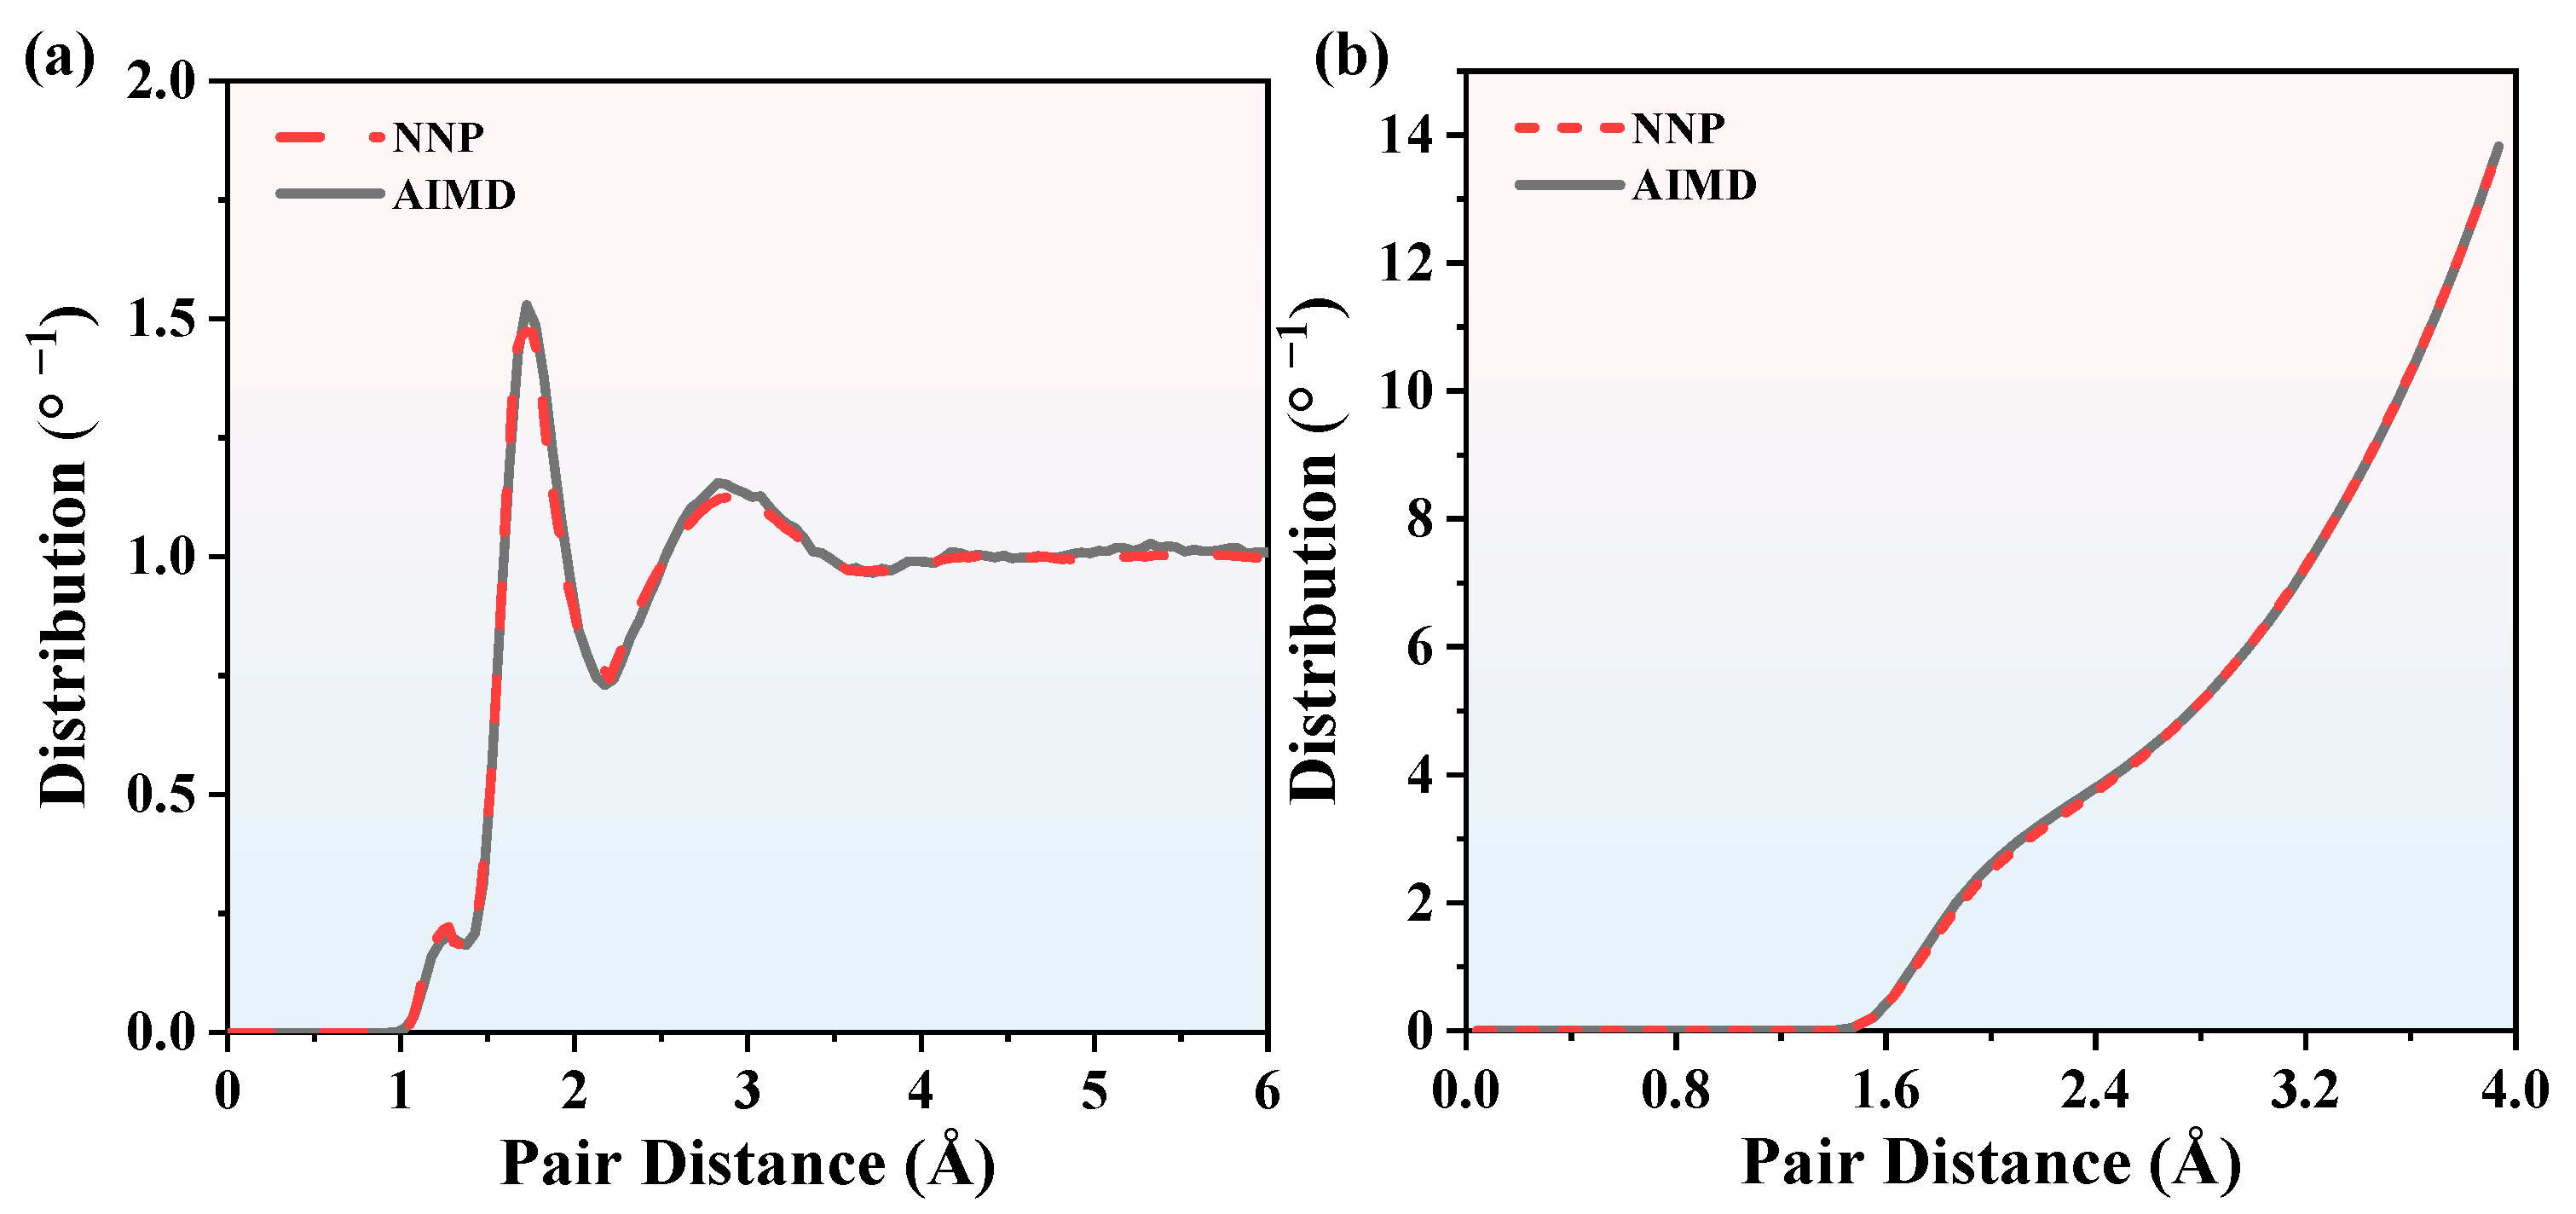
where V is the volume of the simulation cell. Nα and Nβ are the number of α-type ions and β-type ions, respectively. Nαβ (r, Δr) is the average number of α-type ions around β-type ions in a spherical space. The results of the NNP + MD and AIMD simulations in Figure 3a confirm the accuracy of the NNP. The MD in the following content is specified as MD coupled with NNP. It can be seen that the first peak values of Si3N4 RDFs calculated by MD are located around r = 1.7 Å. The results show that the distribution function g(r) obtained by MD is consistent with the AIMD results calculated by VASP. The same conclusion can be reached at 3000 K in Figure 4a. Therefore, it is concluded that the NNP is capable of predicting structure information of SiNx with AIMD accuracy within this range from 2000 K to 3000 K.
CNs are the number of coordination atoms around the central atom of a compound. The RDFs depend on the multilayered coordination radius and coordination particle numbers. The CNs could be calculated by integration of the RDFs
N = 4 π ρ 0 R min g α β ( r ) r 2 d r
where N is the CN. ρ is particle density in the simulation cell. Rmin is the first minimum in Figure 3a and Figure 4a. As is shown in Figure 3b, we now concentrate on the CNs of Si3N4. The results calculated by MD are compared with the AIMD simulation results. The CNs calculated by MD fit the AIMD results accurately, as well as in Figure 4b. The CNs are proportional to the pair distance and CNs are zero when the pair distance is less than 1.5 Å, so the minimal pair distance of Si3N4 is 1.5 Å. The BADs were calculated to analyze the local geometries of the first coordination shell, which can be calculated by
θ i j k = cos 1 r i j 2 + r i k 2 r j k 2 2 r i j r i k
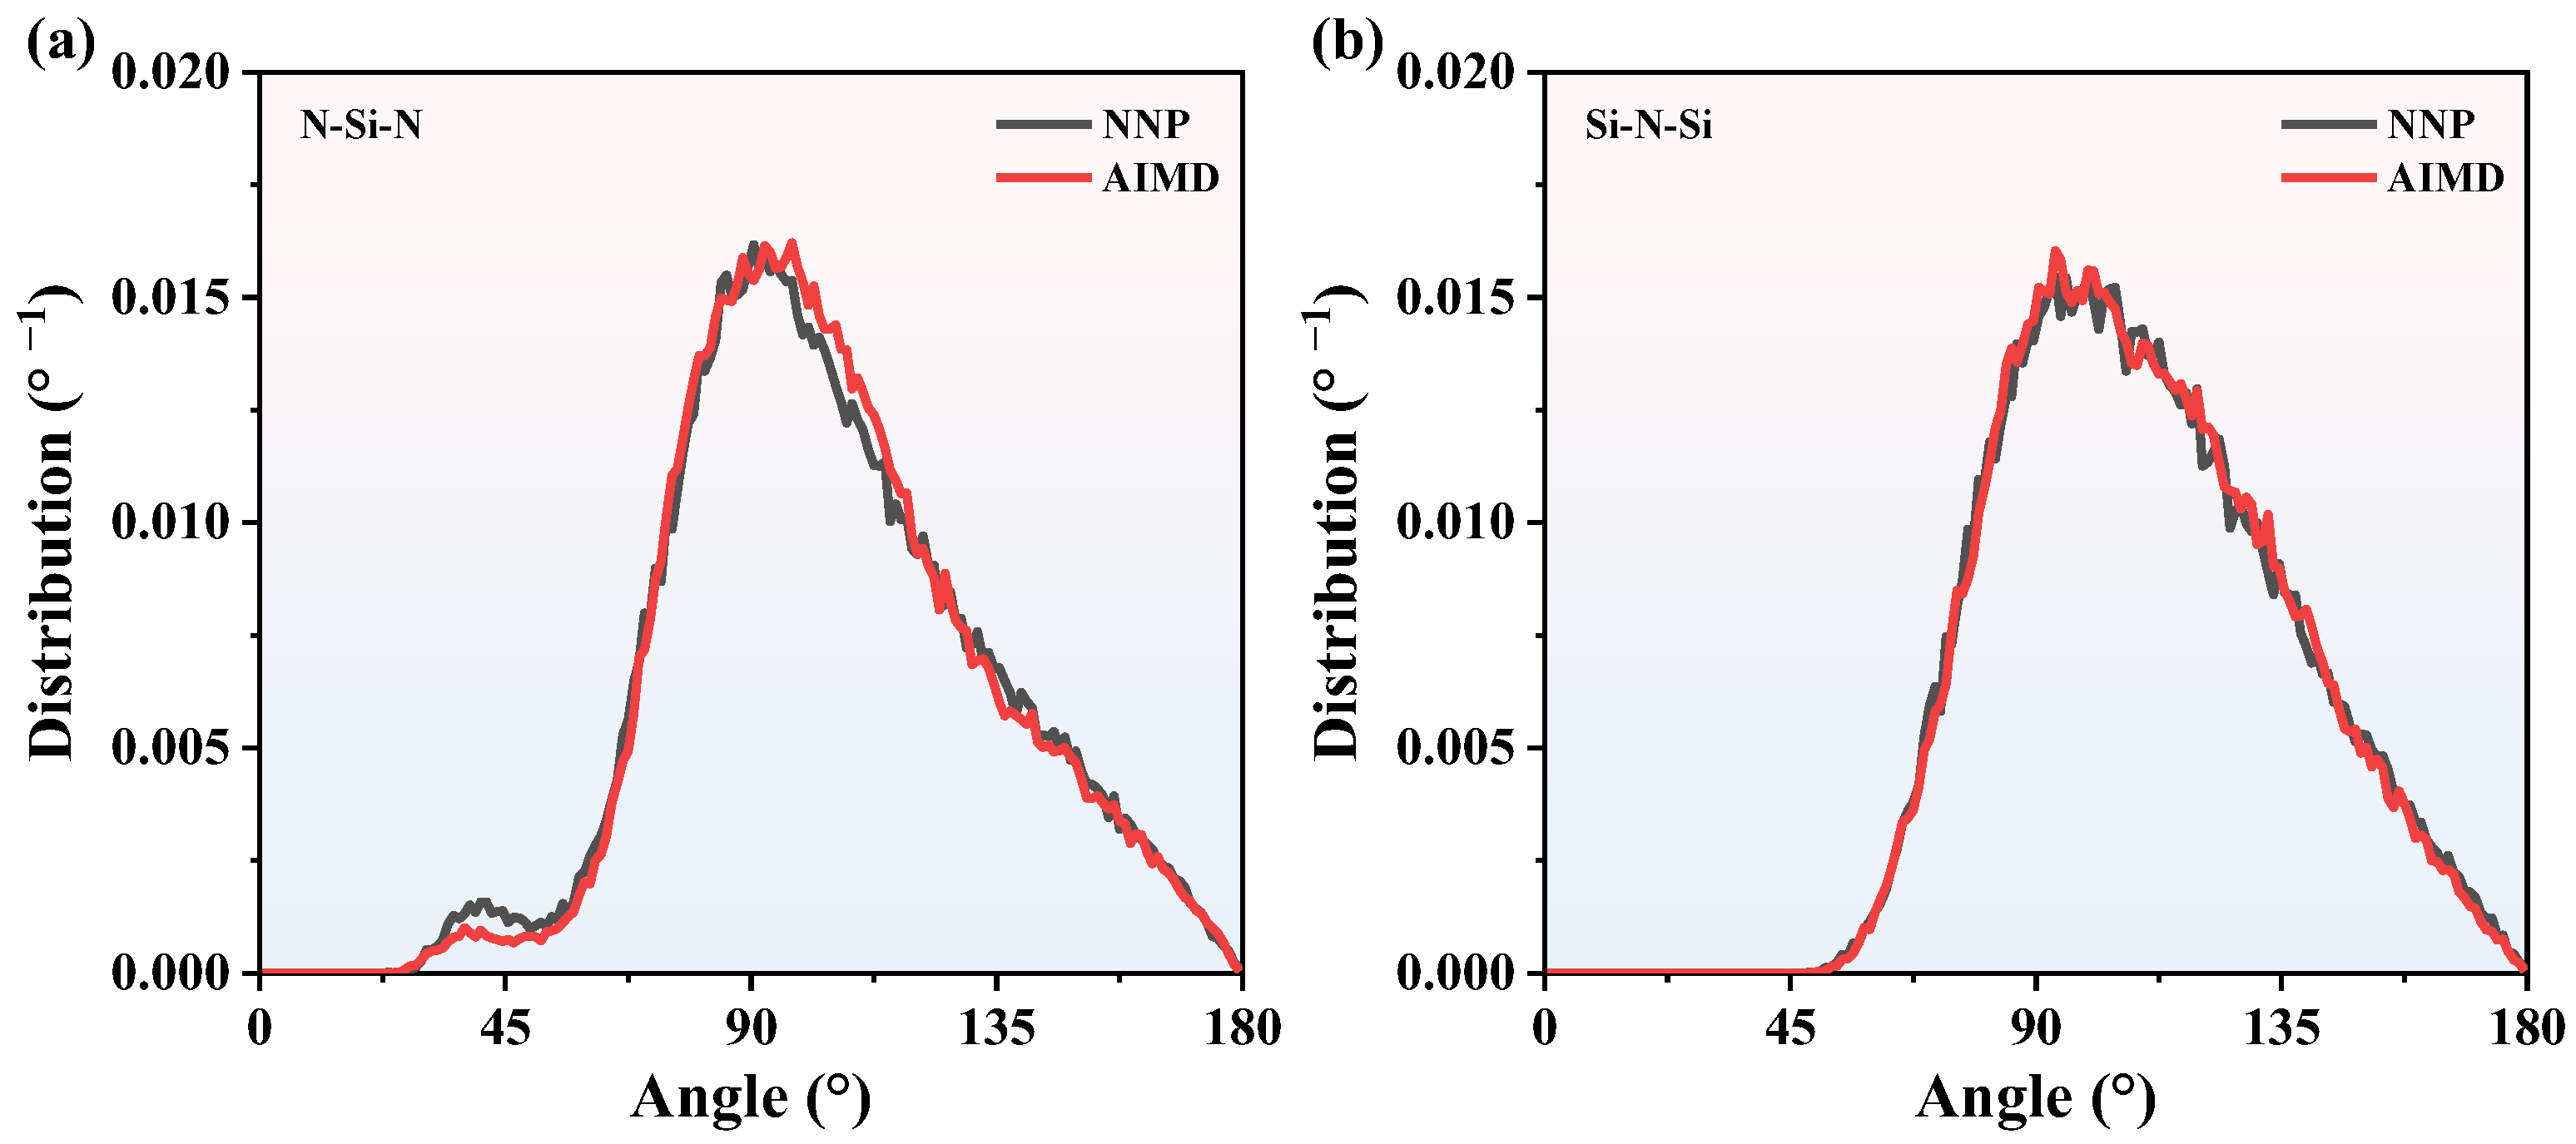
where θ is the bond angle. rij, rik, and rjk are the bond length between atoms. The BADs of Si3N4 obtained by MD and AIMD at 2000 K and 3000 K are shown in Figure 5 and Figure 6, respectively. At 2000 K, there are few BAD smaller than 45°. The majority of BADs are localized between 75° and 120°, and the Si-N-Si and N-Si-N peak values of MD BADs are 90°, which is consistent with AIMD BADs. As for 3000 K, though the curves are rougher than that of 2000 K, the Si-N-Si and N-Si-N peak values of MD BADs are consistent well with AIMD BADs. Therefore, NNP is reliable enough to predict CNs and BADs information of SiNx. Based on the RDFs, CNs, and BADs analysis above, it can be concluded that we can use the NNP to calculate the structure information of SiNx.

3.2. The NPP Applied for Structure Information

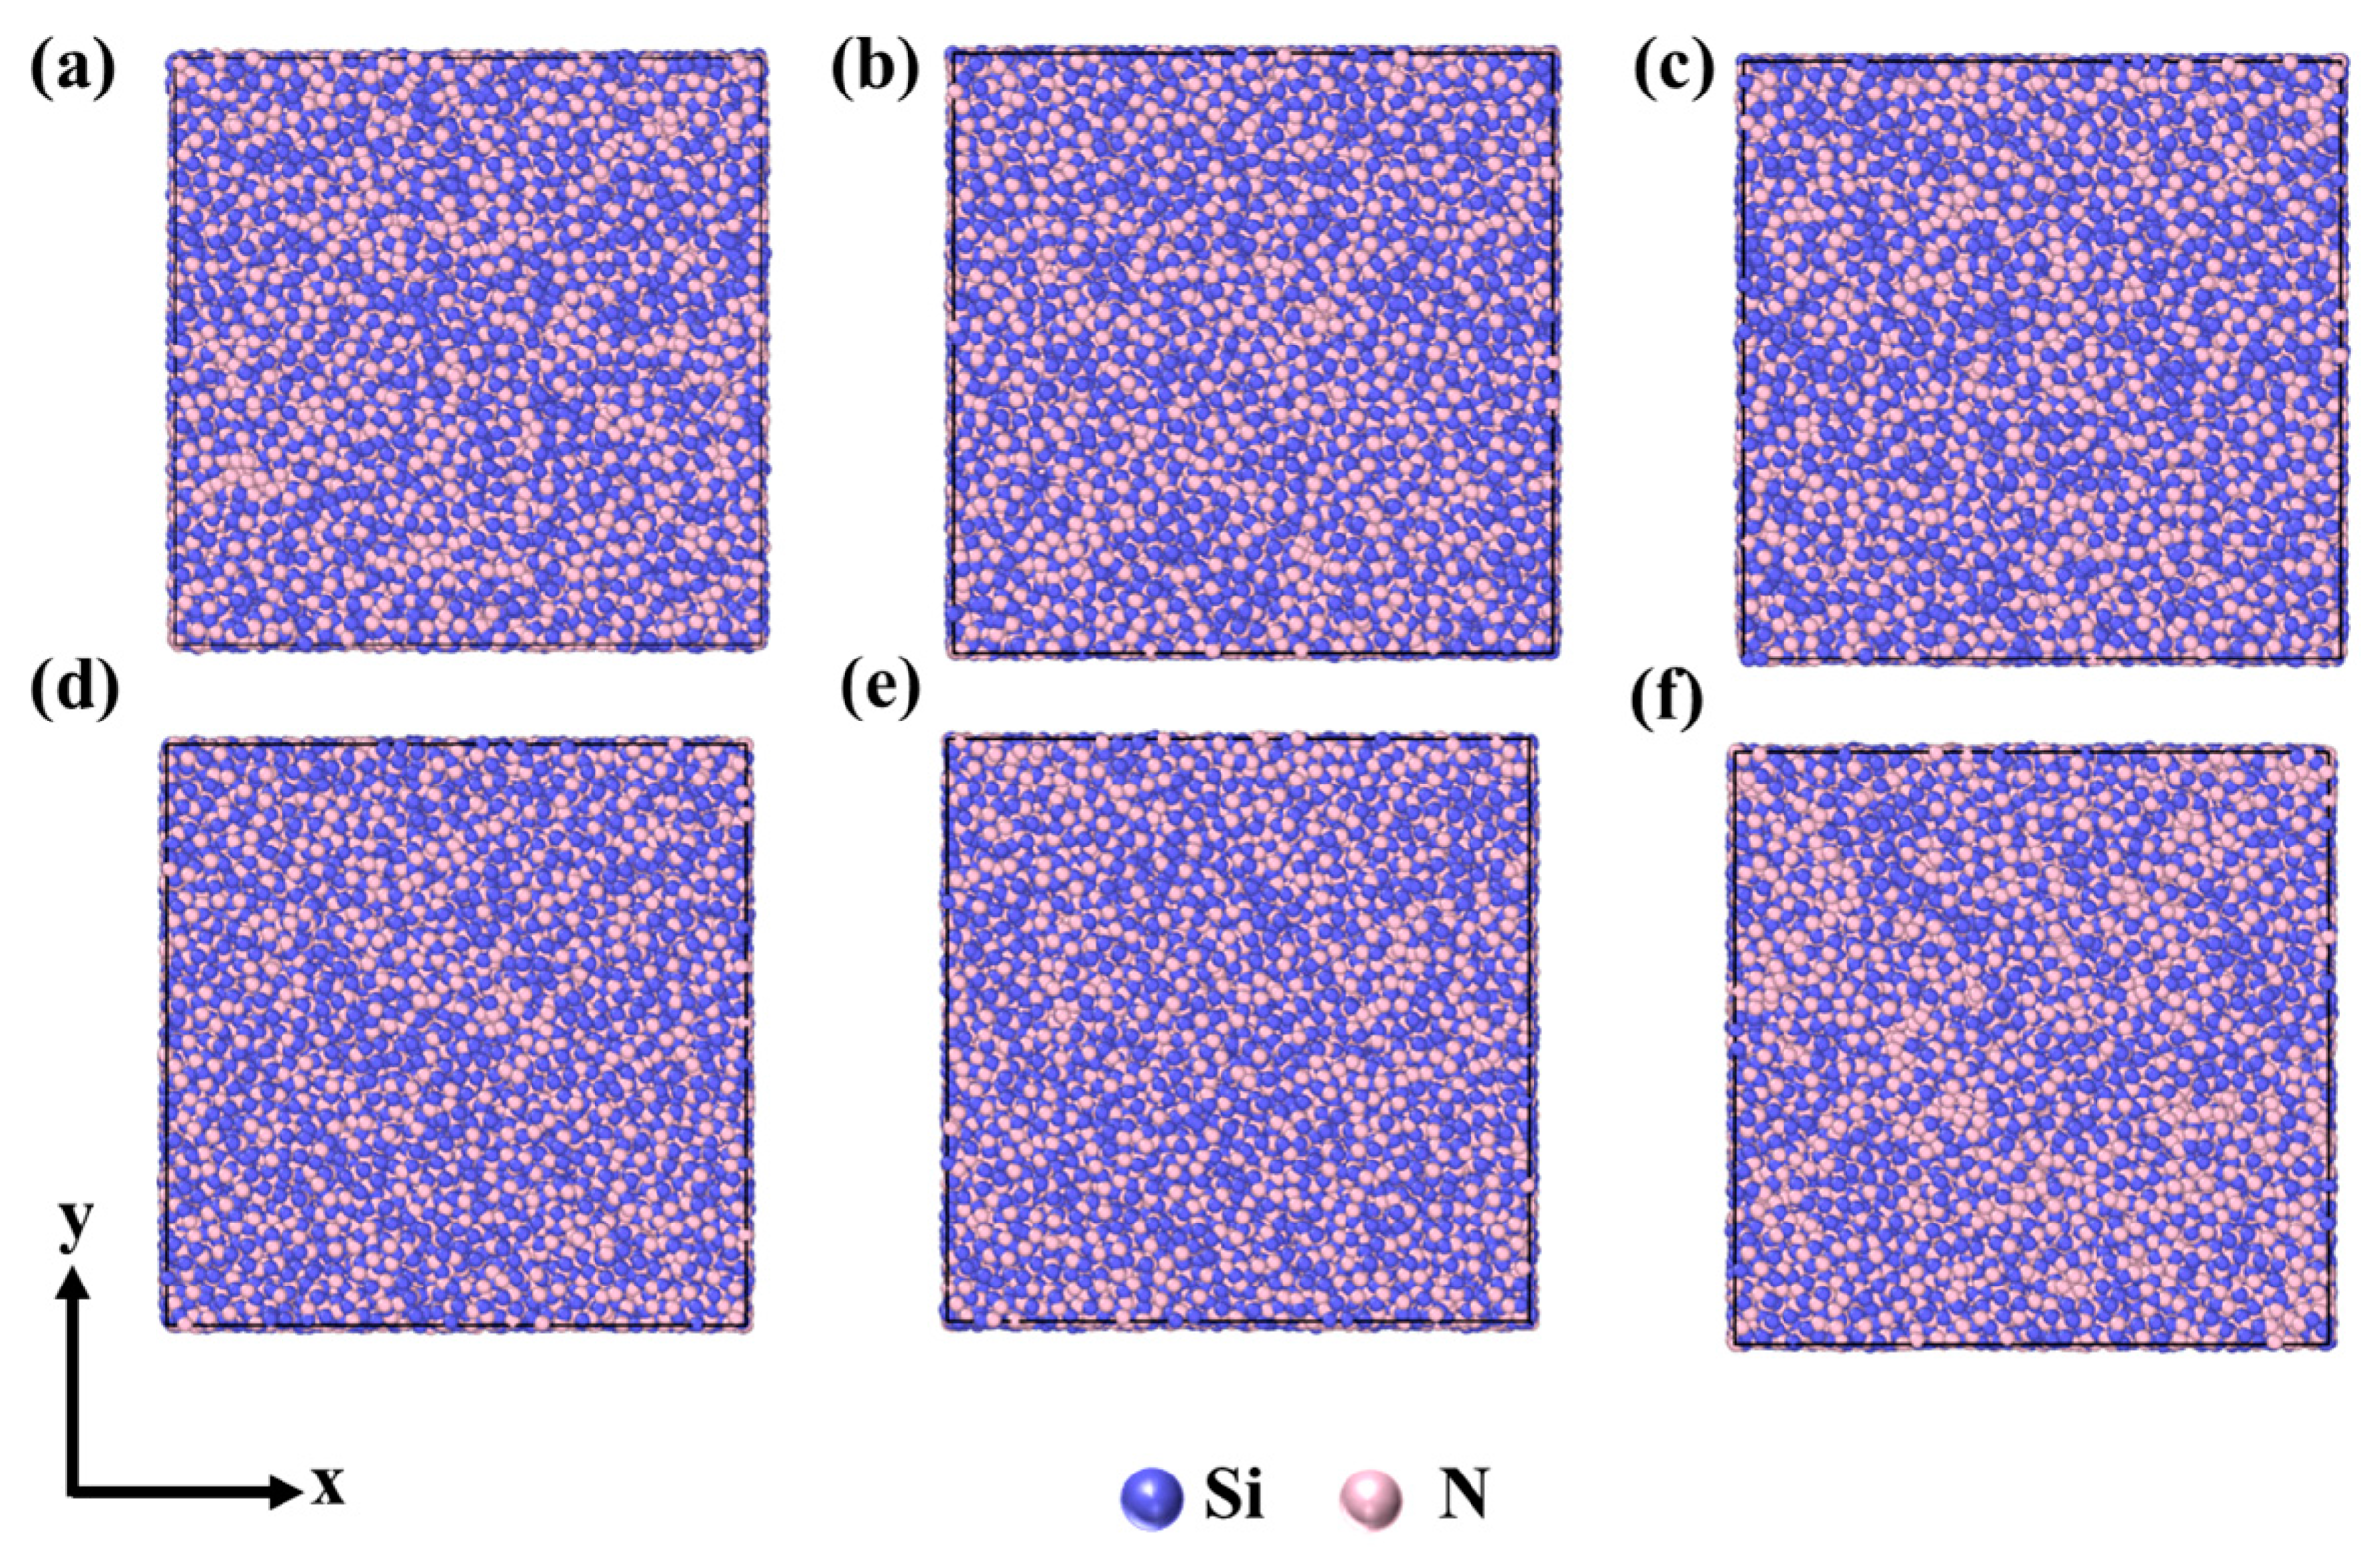
Similar to the empirical potentials, the NNP can also be used for different compositions with the same elements. To study the effect of compositions on SiNx structures, we used the NNP to simulate the heating process of SiNx and analyzed the simulation results, including RDFs, CNs, and BADs. The models of SiNx were built by LAMMPS, as shown in Figure 7. The parameters of SiNx models are shown in Table 1. The boundary condition, timestep, ensemble, and other parameters of MD simulations are the same as part 3 for Si3N4.
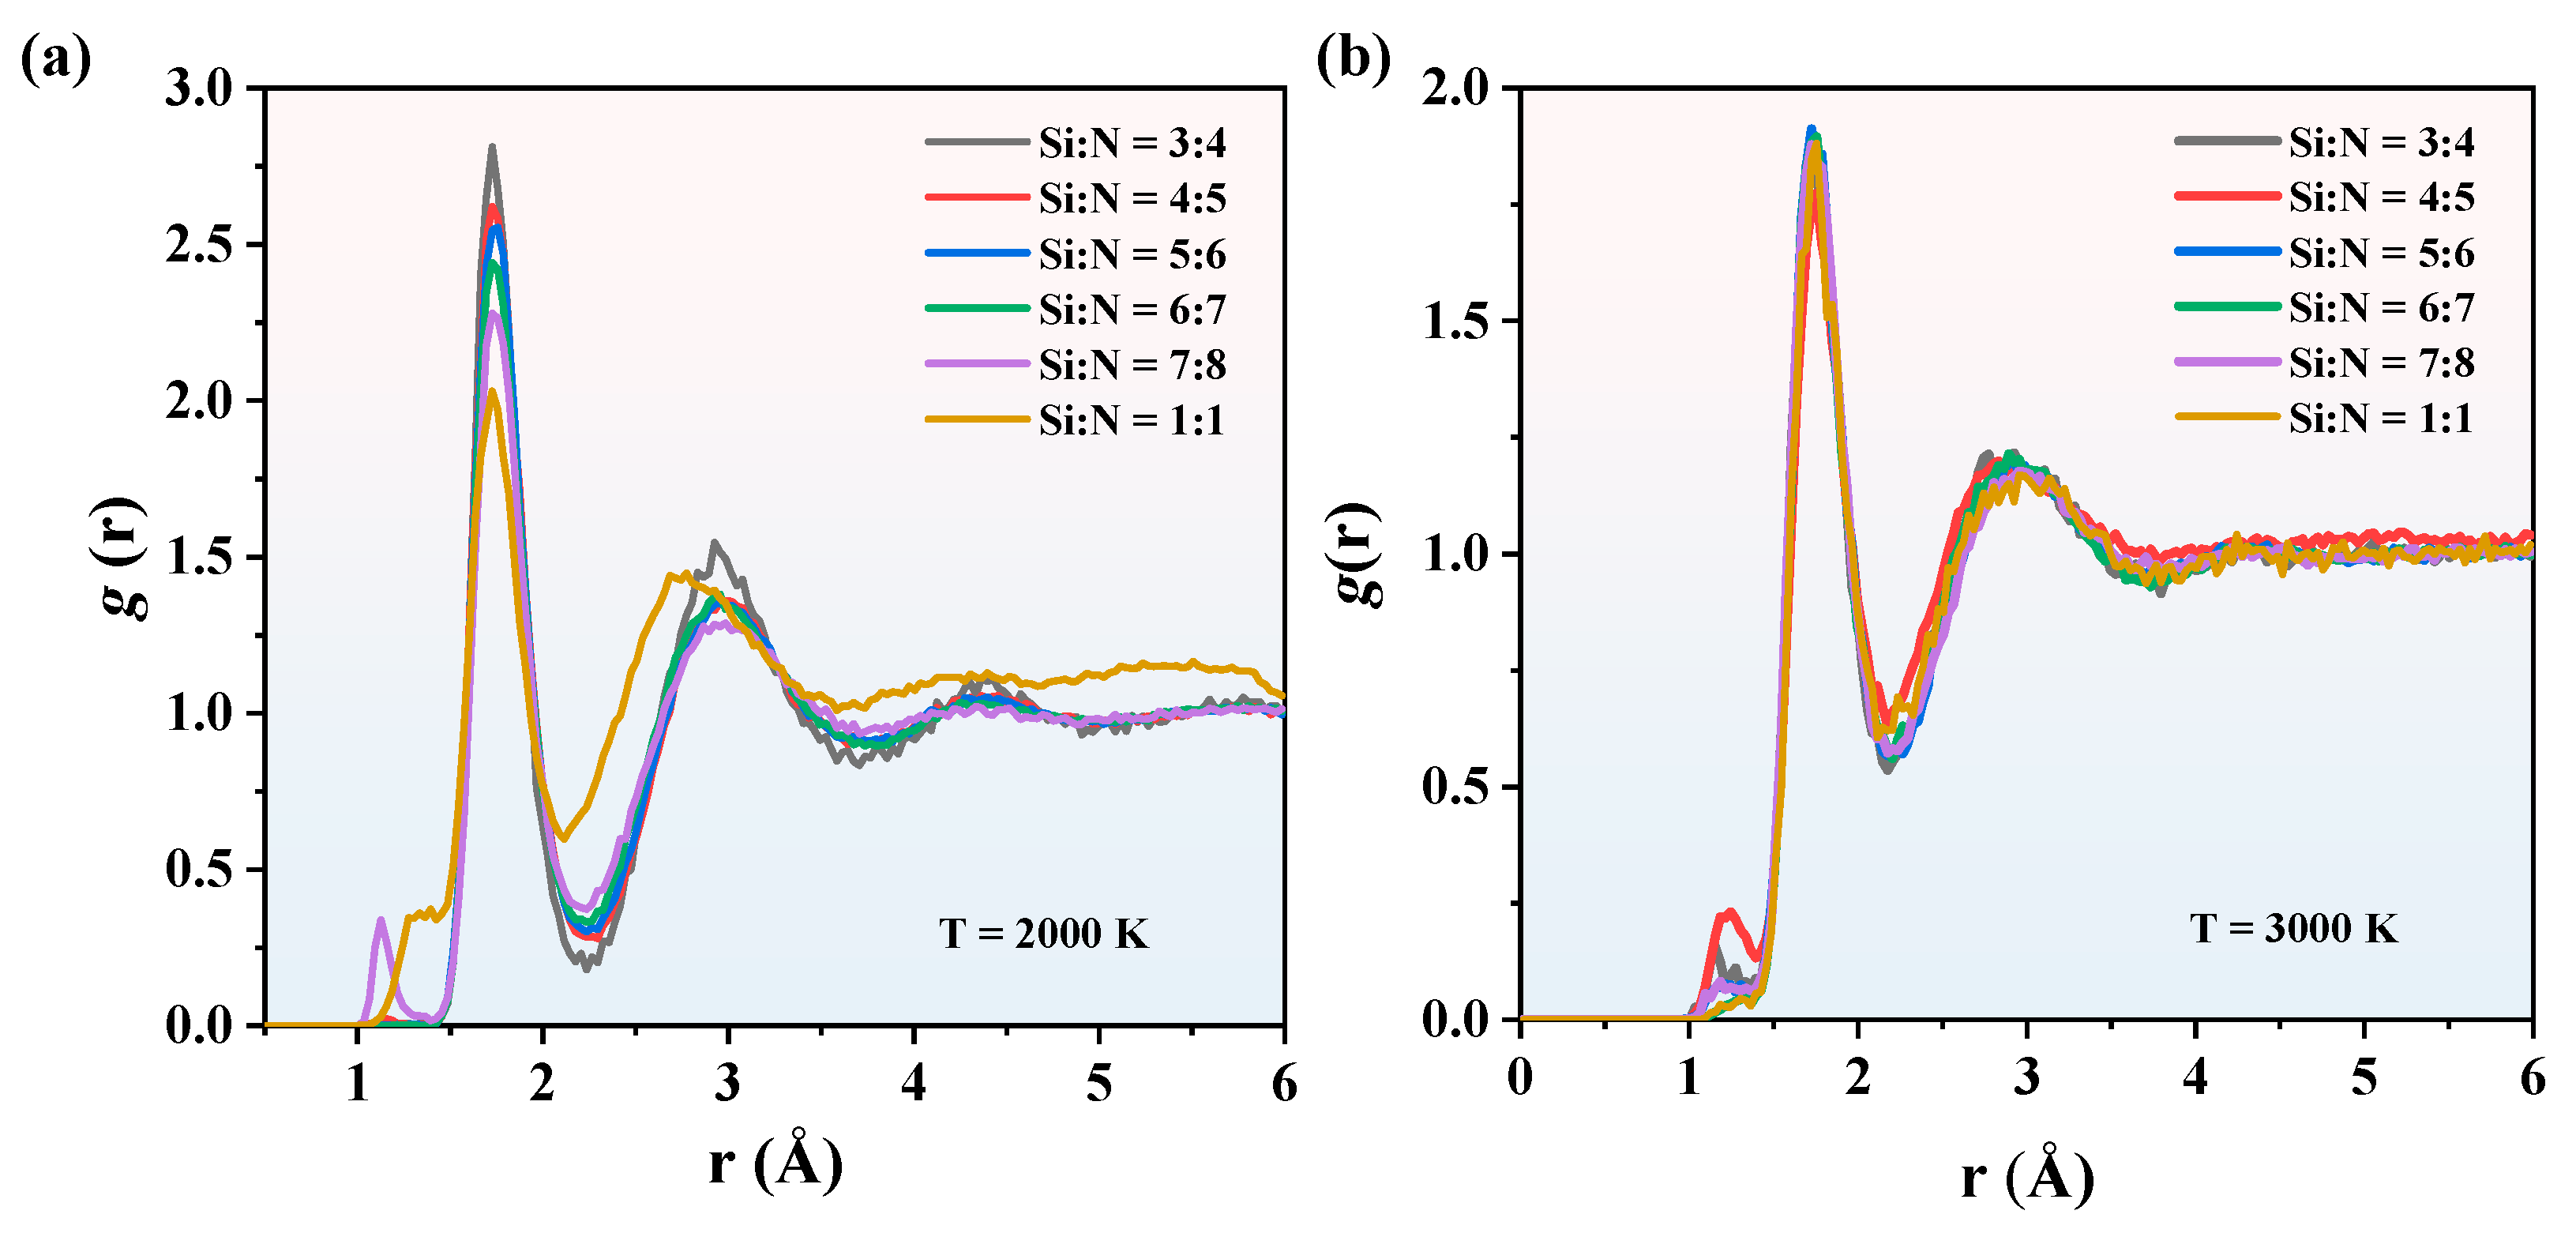
The RDFs of SiNx at 2000 K and 3000 K are shown in Figure 8. In terms of a given temperature, the g(r) peak values decrease while the proportion of Si composition increase, indicating that the pair distance decrease in SiNx with a higher Si proportion. In the case of 2000 K, the peak and valley values fluctuate more obviously. As the temperature increases to 3000 K, there are few differences between the peak values of different compositions, indicating that all the SiNx are in the same phase and there is less difference in microstructure as the temperature increases. The heating process for SiNx was calculated as well with the RDFs at different temperatures shown in Figure S1.
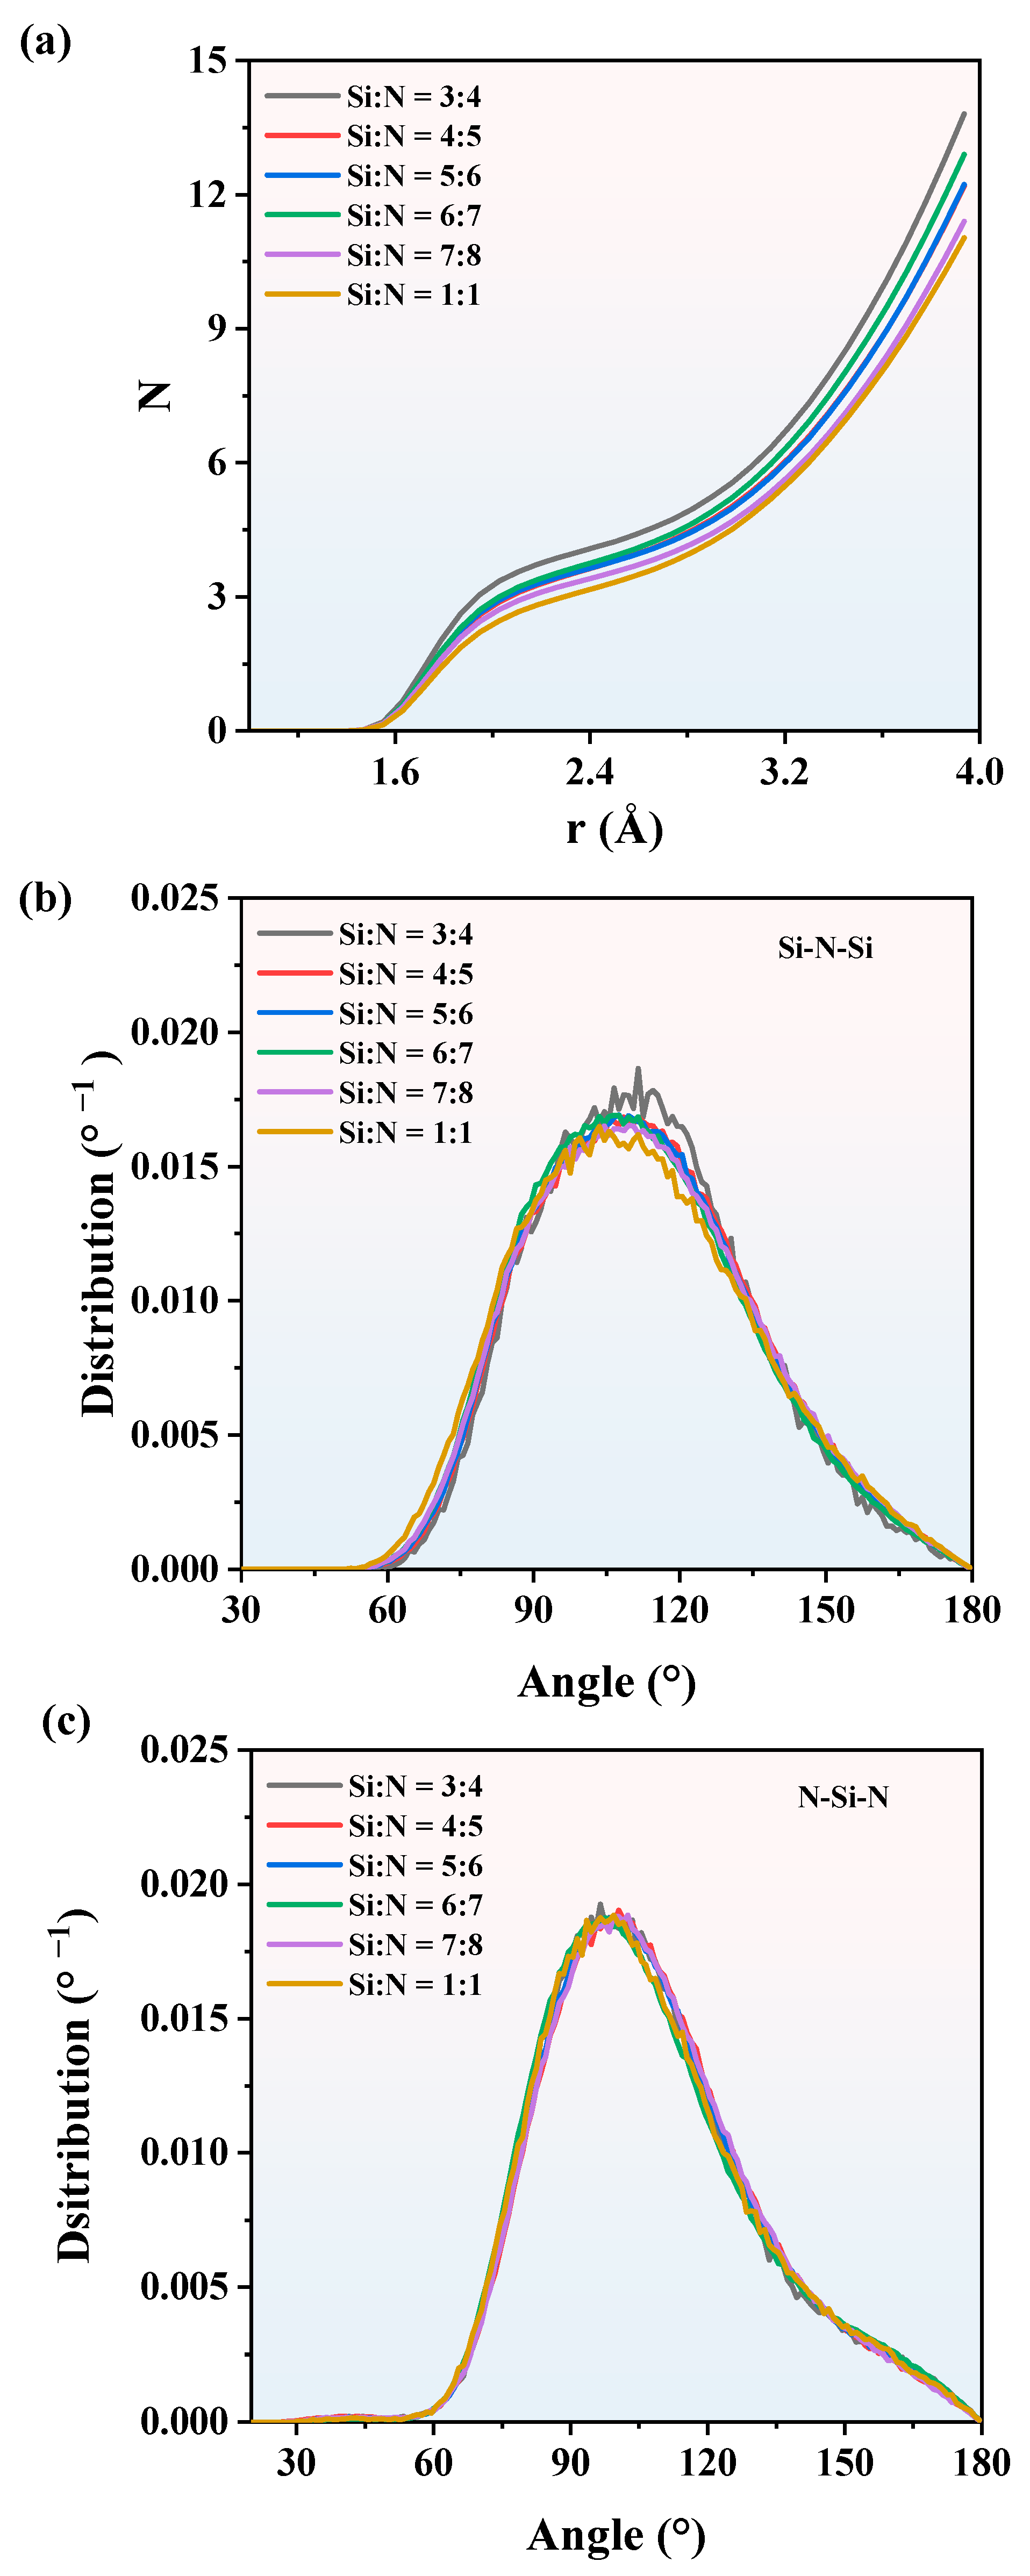
During the heating process, CNs and BADs at 3000 K are shown in Figure 9. The CNs of SiNx in Figure 9a share the same profile, which is all proportional to the pair distance. Among these CNs, SiNx, with a 3:4 composition, has the largest CN, which corresponds to the largest g(r) in the Si-poor model. Therefore, Si3N4 is expected to deliver the most stable configuration at the micro level. With the increase of x in SiNx, the CNs decrease slightly, indicating that the CNs are weakly affected by composition. The BADs of SiNx at 3000 K are shown in Figure 9b,c. Similar to the CNs, the composition has little influence on the BADs, especially for the N-Si-N BADs in Figure 9c. In summary, the RDFs, CNs, and BADs of SiNx are different, so the structures of SiNx are different as well. In the next section, we used tensile simulations to explain the impact of different compositions on SiNx mechanical properties from a macro perspective.

3.3. The NNP Applied for Tensile Tests

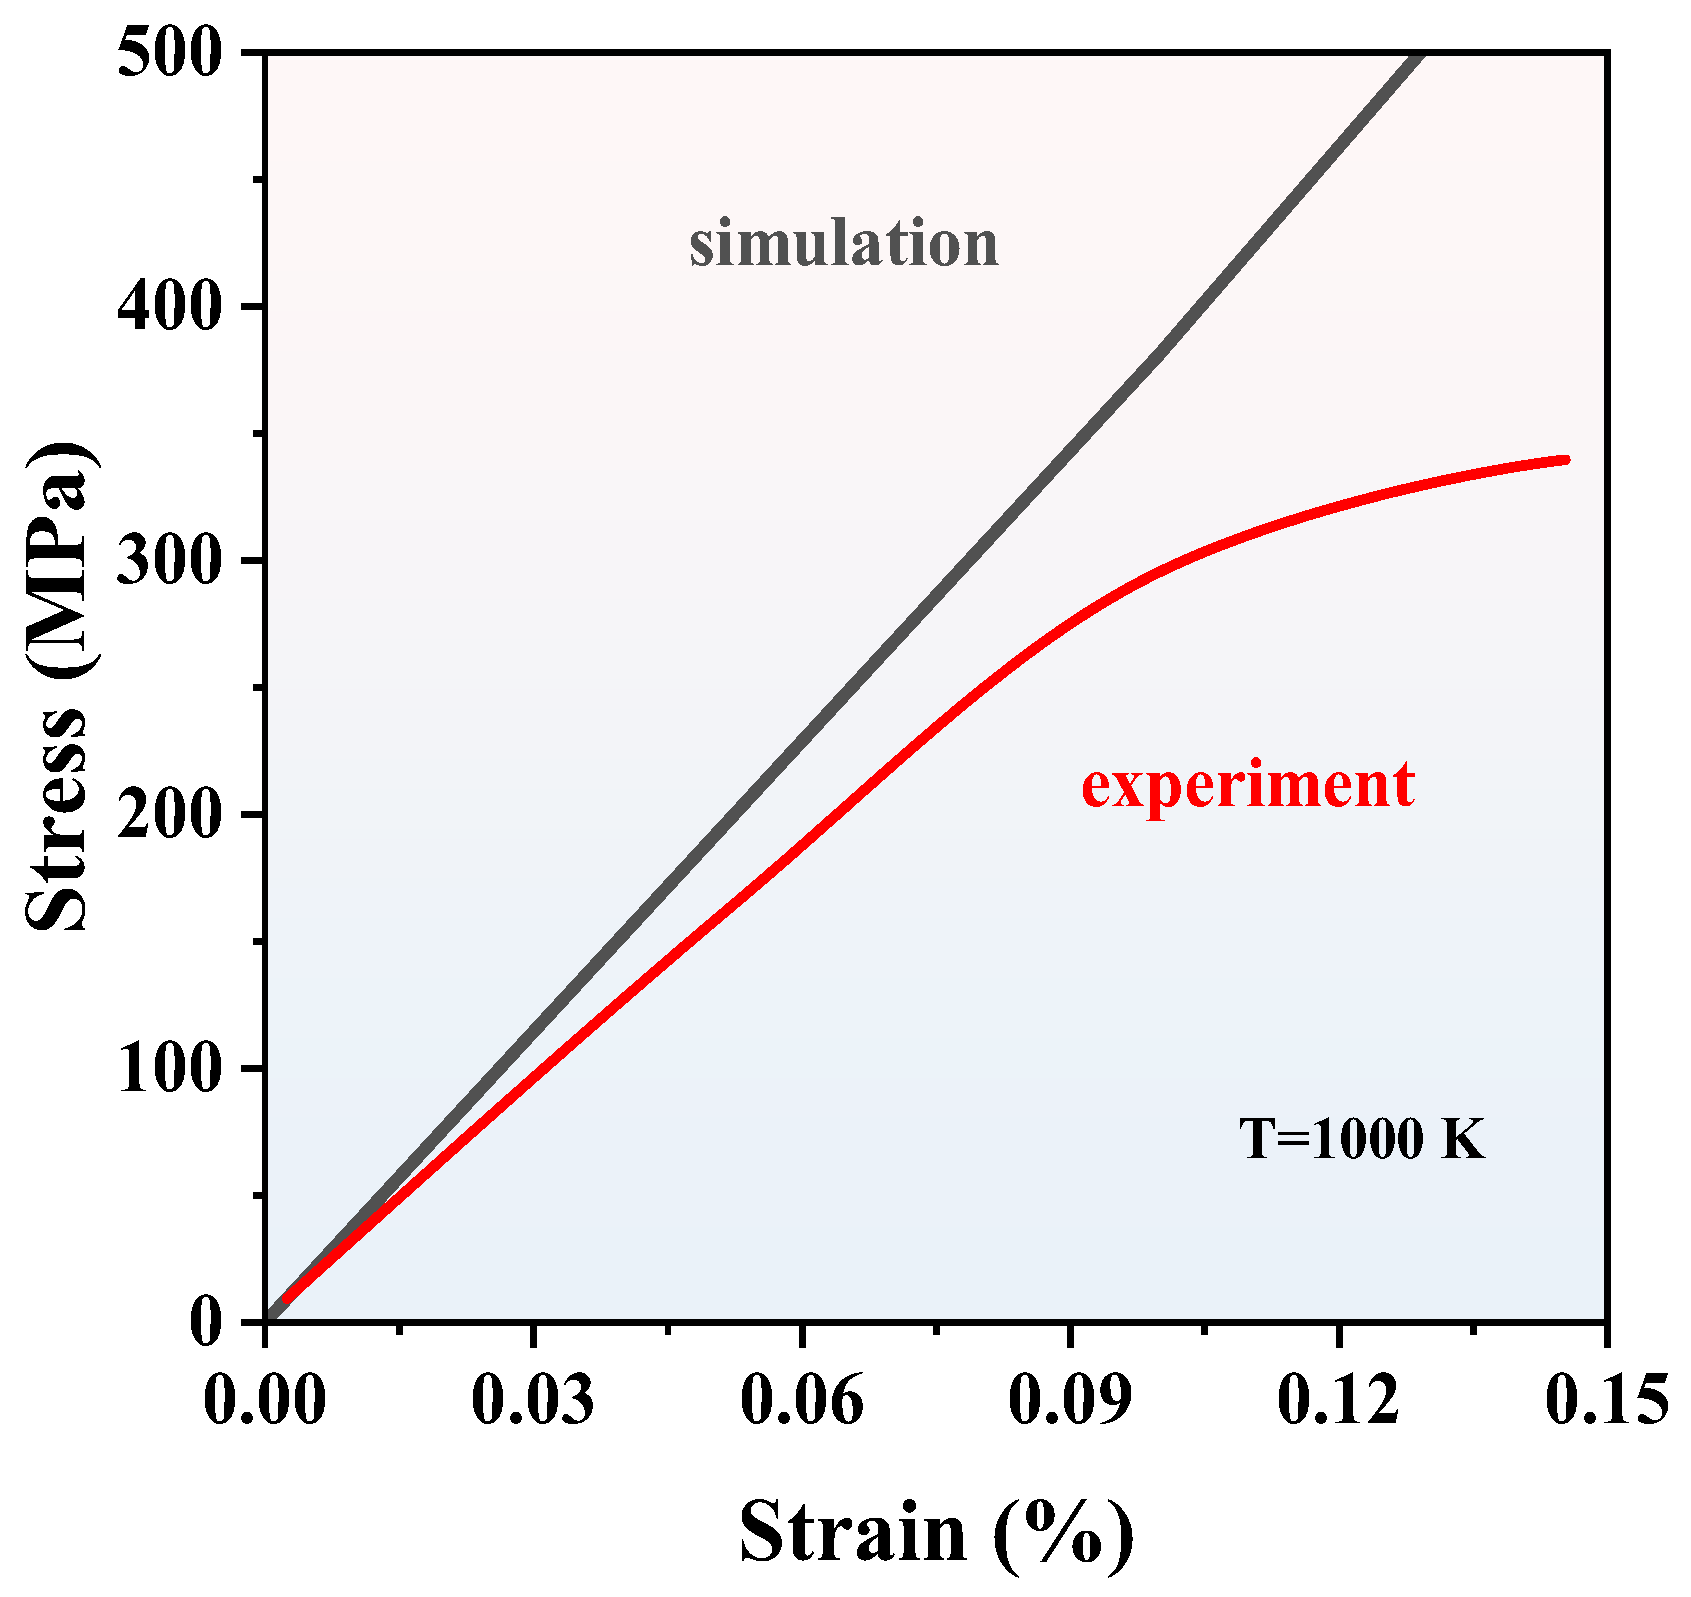
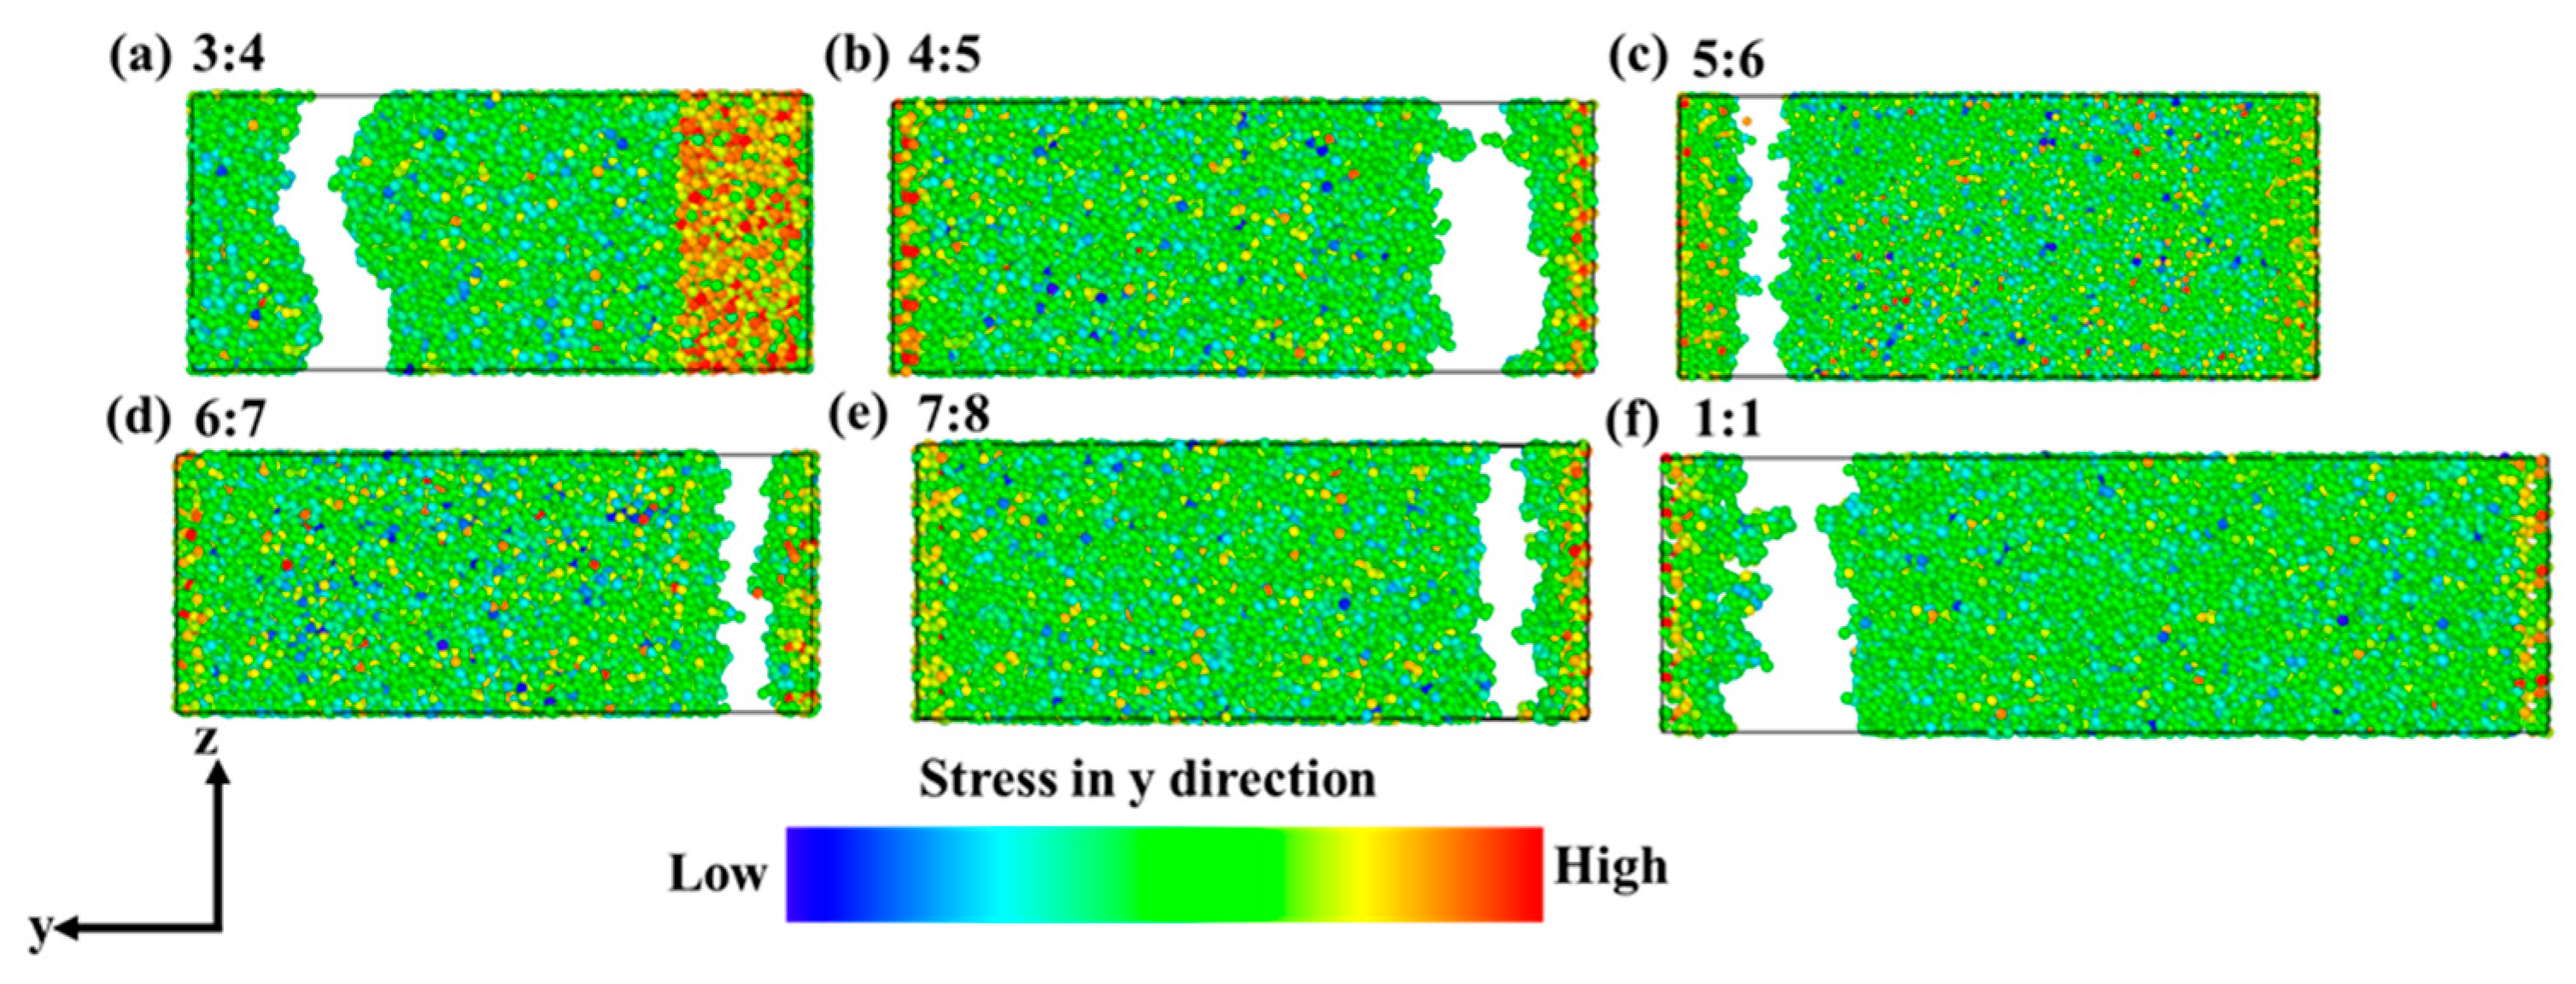
To evaluate the accuracy of tensile by MD, the simulated strain–stress curve of Si3N4 compared with the experimental result is shown in Figure 10. The elastic modulus E of the simulation and experiment is 284.6 GPa and 253.3 GPa, respectively, which are consistent well with the reported E in the previous reference [38,39]. As is known, the E depends on the size of the model [39,40]; the simulated E 10.9% higher than the experimental case is acceptable for the tensile test. It is impossible to fabricate the perfect single crystal Si3N4 in the experiment. The Si3N4 mechanical strength is determined by the defects and grain boundaries, so the experimental mechanical strength of Si3N4 is typically smaller than those of calculated results. The tensile tests of Si3N4 at different temperatures were calculated as well shown in Figure S2. The results show that the elastic modulus and peak values vary inversely with the temperature increasing, so when the temperature is 300 K, the mechanical properties of Si3N4 perform better than those at 1000 K and 3000 K. Since the accuracy of MD has been confirmed, the tensile tests of SiNx with compositions from 3:4 to 1:1 were calculated at 300 K. The tensile models of SiNx were repeated to supercells from the stable structures in part 4 with parameters of tensile models shown in Figure S3. The cross-sections of SiNx in the tensile tests are shown in Figure 11. It can be seen that the cross-section of Si3N4 is flat, and the strain is small, so the Si3N4 cracked immediately and exhibited brittleness properties. In terms of other SiNx, the lengths in the y direction are larger than that of Si3N4 when the fractures occurred, indicating that it takes a long time for the SiNx to crack. With the increase of x, the SiNx starts to exhibit flexibility, especially the SiN with the largest deformation when the fracture occurred.
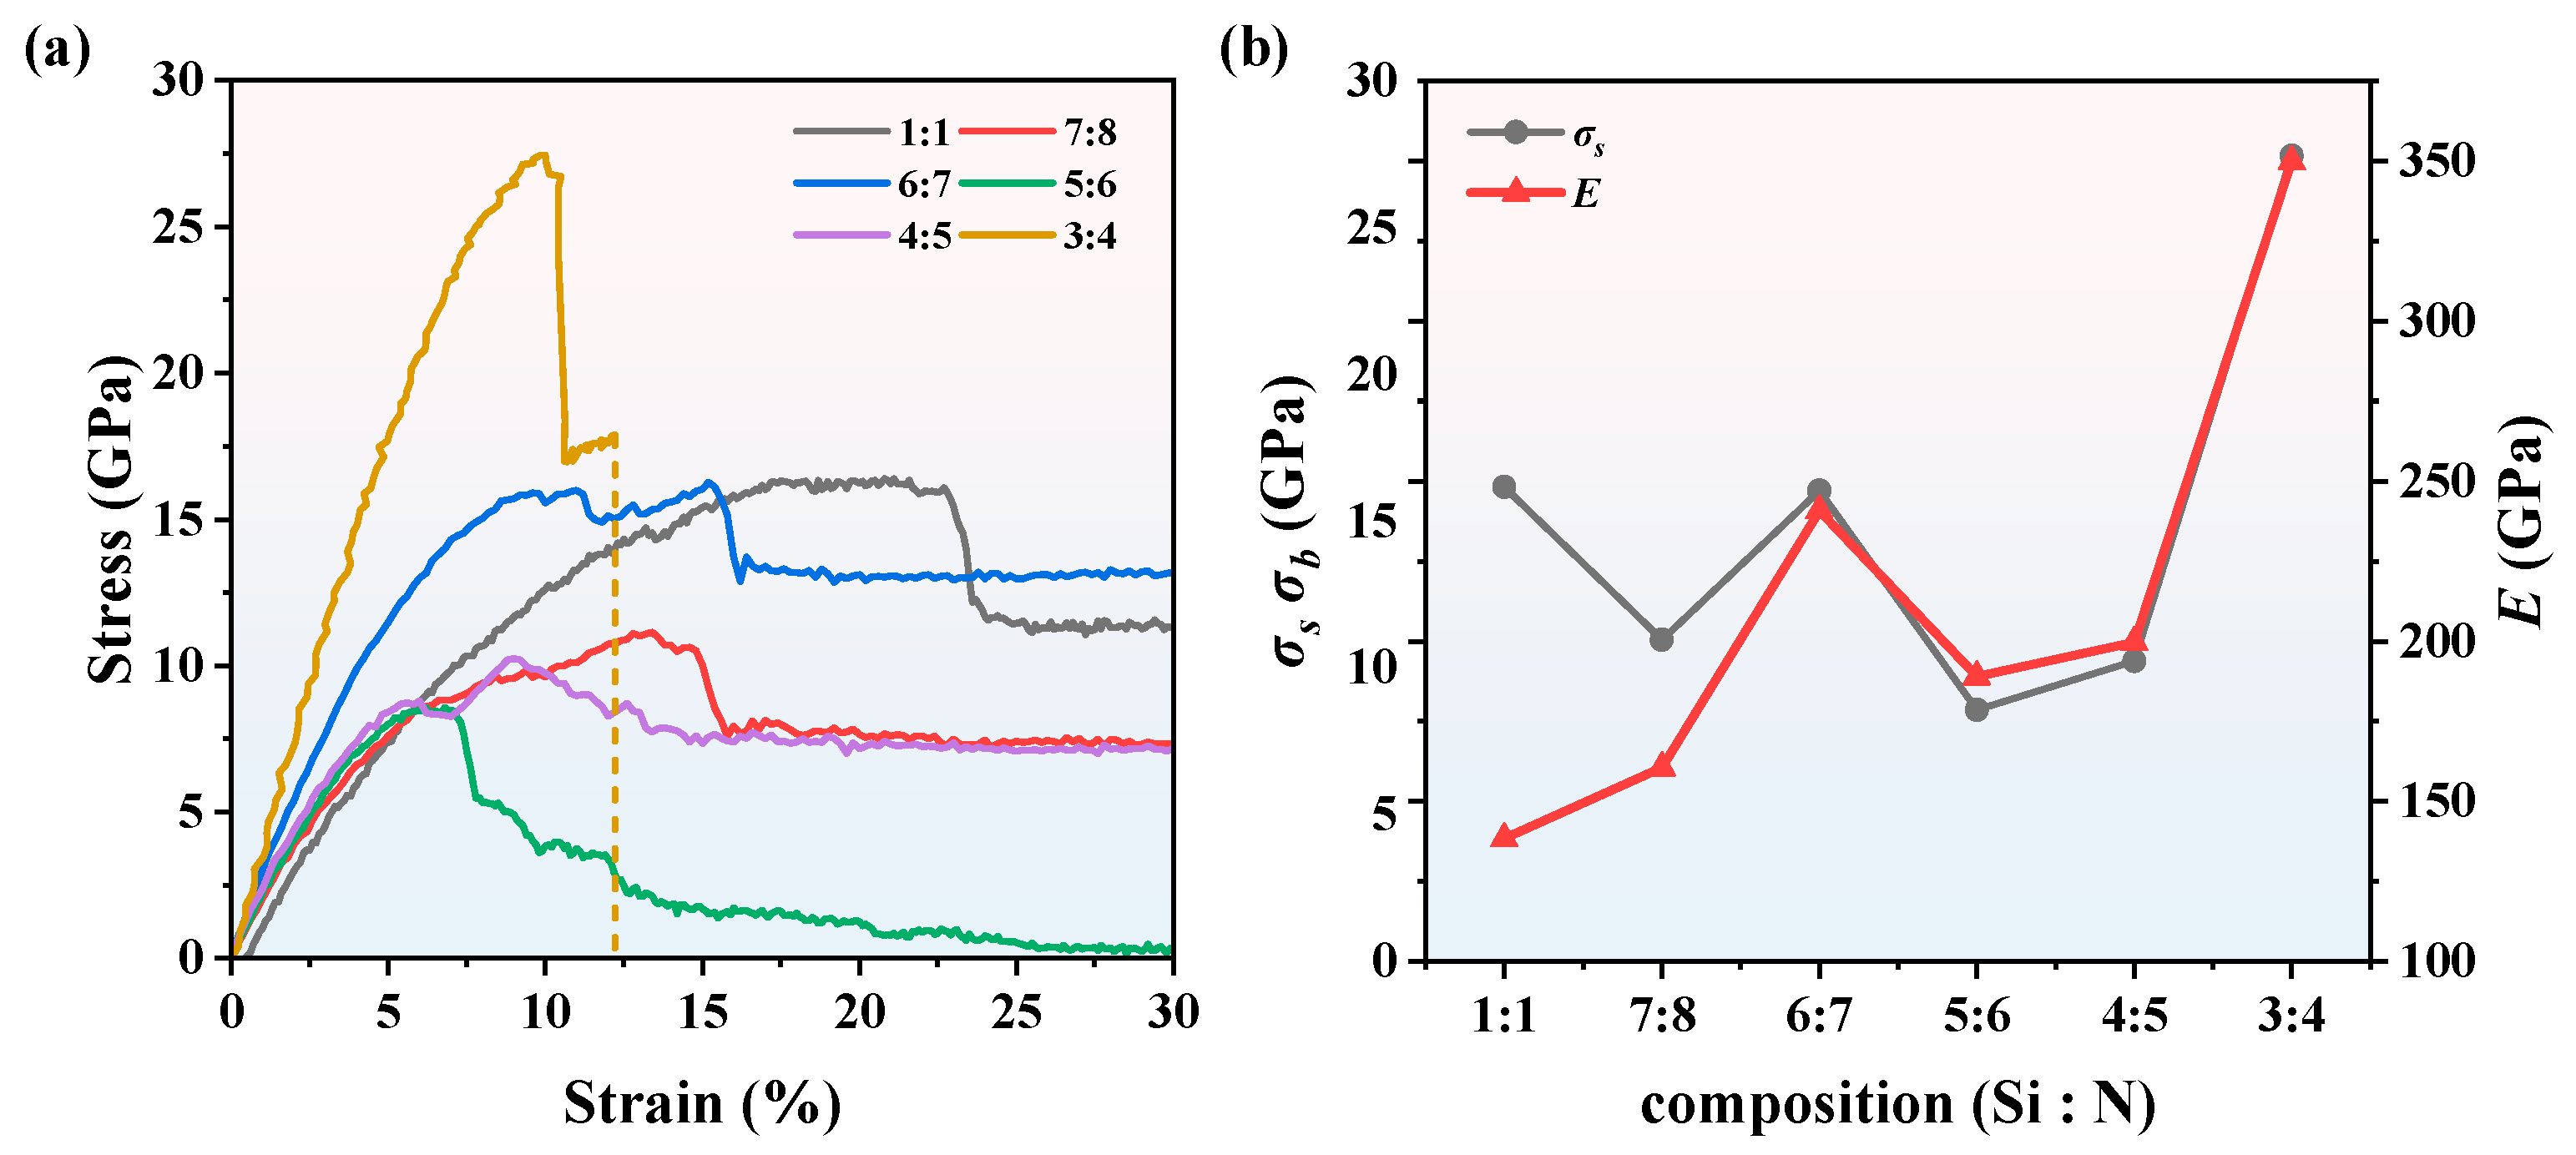
The strain–stress curves and mechanical properties of SiNx are shown in Figure 12. All the curves have a linear increase at the initial stage, which corresponds to an elastic deformation. The slopes of SiNx at the initial linear stage are different, indicating that the E varies with different compositions. The E is an important parameter of materials at the macro level, which represents the ability of an object to resist elastic deformation and reflects the bond strength between atoms, ions, or molecules at the micro level. The Si3N4 curve has a steep slope and large yield stress σs in the linear stage, illustrating that Si3N4 is a typical brittle material. On the contrary, another SiNx demonstrates ductile property, especially the SiN with an obvious yield stage. When the strain ranges from 10% to 22%, the SiN curve becomes flat in the yield stage. The flexibility of SiN significantly improved compared with its Si3N4 counterpart, which is consistent with the analysis in Figure 8. The E of the maximal and minimal slope is 349.78 GPa and 138.39 GPa for x = 4/3 and x = 1/1, respectively. The E is 199.68 GPa, 188.95 GPa, 240.82 GPa, and 160.48 GPa, respectively, when x = 5/4, 6/5, 7/6, and 8/7. Besides the E, the σs of SiNx are different as well, showing that fracture occurs at different stages during the tensile simulations. The maximal σs is 27.45 GPa of Si3N4. Although the σs of other SiNx decrease with higher x, the σs of SiNx fail to vary inversely with the x due to the amorphous structures of SiNx (x = 5/4, 6/5, 7/6, and 8/7). Among these curves, the 3:4 composition has the maximal E and σs, which can correspond to the largest RDFs and CNs in Figure 8 and Figure 9, respectively. The RDFs and CNs decrease with the decreasing of x, leading to the flexibility improvement of SiNx, since for Si3N4 x = 4/3 while for SiN x = 1. Meanwhile, the E of SiNx excluding Si3N4 decrease compared with that of Si3N4, which is generally inversely proportional to the RDFs. The results show that the RDFs and CNs at the micro level can reflect the macro mechanical properties of SiNx to a large extent.

4. Conclusions

In this work, the interatom potential for SiNx was created by the DEEPMD kit with a neural network. Based on the comparison of energies and forces from NNP and AIMD for tranSi3N4, we find that NNP can easily achieve DFT accuracy. The RDFs, CNs, and BADs simulations between the NNP and AIMD confirmed that the NNP is reliable enough to calculate the structure information Si3N4 as well. Then, we conducted comprehensive calculations to predict the RDFs, CNs, and BADs of SiNx. Therefore, we used tensile simulations to explain the impact of different compositions on SiNx properties from a macro perspective. Si3N4 is a typical brittle material with the largest E and σs. The flexibility of SiNx, excluding Si3N4, improved, leading to the decrease of E and σs. The E and σs fail to be inversely proportional with x due to the amorphous structures of SiNx. The RDFs and CNs at the micro level can reflect the macro mechanical properties of SiNx to a large extent. Among these compositions, x = 4/3 features high mechanical strength, owing to the largest CN and RDF. The E of SiNx, excluding Si3N4, decreases compared with that of Si3N4, leading to the flexibility improvement of SiNx, which is generally inversely proportional to the RDFs.

Supplementary Materials

The following supporting information can be downloaded at: https://www.mdpi.com/article/10.3390/nano13081352/s1, Figure S1: The RDFs of SiNx with different compositions in heating process; Figure S2: Amorphous Si3N4 tensile simulations; Figure S3: The whole process of fracture during tensile simulations; Table S1: The specific simulation parameters in SiNx tensile simulations.

Author Contributions

Conceptualization, H.X. and Z.L.; methodology, H.X. and Z.L.; formal analysis, H.X. and Z.L.; data curation, H.X., Z.L. and Y.G.; writing—original draft preparation, H.X.; writing—review and editing, H.X., Z.L., S.S., Y.G., Z.Z. and S.L.; project administration, Y.G.; funding acquisition, Y.G. and S.L. All authors have read and agreed to the published version of the manuscript.

Funding

This work is supported by Wuhan University. The authors acknowledge the financial support from the National Natural Science Foundation of China (Grant Nos. 62174122, U2241244, 51727901). The numerical calculations in this work were conducted on the supercomputing system in the Supercomputing Center of Wuhan University.

Data Availability Statement

The data that support the findings of this study are available from the corresponding author upon reasonable request.

Conflicts of Interest

The authors declare that they have no known competing financial interests or personal relationships that could have appeared to influence the work reported in this paper.

References

  1. Car, R.; Parrinello, M. Unified approach for molecular dynamics and density-functional theory. Phys. Rev. Lett. 1985, 55, 2471–2474. [Google Scholar] [CrossRef] [Green Version]
  2. Bergstra, J.A.; Bethke, I. Molecular dynamics. J. Logic. Algebr. Program. 2002, 51, 193–214. [Google Scholar] [CrossRef] [Green Version]
  3. Geerlings, P.; Boon, G.; Van Alsenoy, C.; De Proft, F. Density functional theory and quantum similarity. Int. J. Quantum Chem. 2005, 101, 722–732. [Google Scholar] [CrossRef]
  4. Morgon, N.H.; Custodio, R. The density-functional theory. Quim. Nova. 1995, 18, 44–55. [Google Scholar]
  5. Sandre, E.; Pasturel, A. An introduction to ab-initio molecular dynamics schemes. Mol. Simul. 1997, 20, 63–77. [Google Scholar] [CrossRef]
  6. Verlet, L. Computer “experiments” on classical fluids. I. thermodynamical properties of Lennard-Jones molecules. Phys. Rev. 1967, 159, 98. [Google Scholar] [CrossRef] [Green Version]
  7. Finnis, M.; Sinclair, J. A simple empirical N-body potential for transition metals. Philos. Mag. A 1984, 50, 45–55. [Google Scholar] [CrossRef]
  8. Daw, M.S.; Baskes, M.I. Embedded-atom method: Derivation and application to impurities, surfaces, and other defects in metals. Phys. Rev. B 1984, 29, 6443. [Google Scholar] [CrossRef] [Green Version]
  9. Vink, R.; Barkema, G.; Van der Weg, W.; Mousseau, N. Fitting the Stillinger–Weber potential to amorphous silicon. J. Non-Cryst. Solids. 2001, 282, 248–255. [Google Scholar] [CrossRef]
  10. Hossain, M.; Hao, T.; Silverman, B. Stillinger–Weber potential for elastic and fracture properties in graphene and carbon nanotubes. J. Phys. Condens. Matter. 2018, 30, 055901. [Google Scholar] [CrossRef]
  11. Tersoff, J. New empirical approach for the structure and energy of covalent systems. Phys. Rev. B 1988, 37, 6991. [Google Scholar] [CrossRef] [PubMed]
  12. Liang, T.; Shan, T.-R.; Cheng, Y.-T.; Devine, B.D.; Noordhoek, M.; Li, Y.; Lu, Z.; Phillpot, S.R.; Sinnott, S.B. Classical atomistic simulations of surfaces and heterogeneous interfaces with the charge-optimized many body (COMB) potentials. Mater. Sci. Eng. R Rep. 2013, 74, 255–279. [Google Scholar] [CrossRef]
  13. De Tomas, C.; Suarez-Martinez, I.; Marks, N.A. Graphitization of amorphous carbons: A comparative study of interatomic potentials. Carbon 2016, 109, 681–693. [Google Scholar] [CrossRef] [Green Version]
  14. Deringer, V.L.; Csányi, G. Machine learning based interatomic potential for amorphous carbon. Phys. Rev. B 2017, 95, 094203. [Google Scholar] [CrossRef] [Green Version]
  15. Rowe, P.; Csányi, G.; Alfè, D.; Michaelides, A. Development of a machine learning potential for graphene. Phys. Rev. B 2018, 97, 054303. [Google Scholar] [CrossRef] [Green Version]
  16. Behler, J.; Parrinello, M. Generalized neural-network representation of high-dimensional potential-energy surfaces. Phys. Rev. Lett. 2007, 98, 146401. [Google Scholar] [CrossRef] [PubMed]
  17. Zhang, L.; Han, J.; Wang, H.; Car, R.; Weinan, E. Deep potential molecular dynamics: A scalable model with the accuracy of quantum mechanics. Phys. Rev. Lett. 2018, 120, 143001. [Google Scholar] [CrossRef] [PubMed] [Green Version]
  18. Bonati, L.; Parrinello, M. Silicon liquid structure and crystal nucleation from ab-initio deep metadynamics. Phys. Rev. Lett. 2018, 121, 265701. [Google Scholar] [CrossRef] [Green Version]
  19. Wen, T.; Wang, C.-Z.; Kramer, M.; Sun, Y.; Ye, B.; Wang, H.; Liu, X.; Zhang, C.; Zhang, F.; Ho, K.-M. Development of a deep machine learning interatomic potential for metalloid-containing Pd-Si compounds. Phys. Rev. B 2019, 100, 174101. [Google Scholar] [CrossRef]
  20. Xu, N.; Shi, Y.; He, Y.; Shao, Q. A deep-learning potential for crystalline and amorphous Li–Si alloys. J. Phys. Chem. C 2020, 124, 16278–16288. [Google Scholar] [CrossRef]
  21. Gritsenko, V.A. Electronic structure of silicon nitride. Physics-Uspekhi 2012, 55, 498–507. [Google Scholar] [CrossRef]
  22. Kaloyeros, A.E.; Pan, Y.L.; Goff, J.; Arkles, B. Review-silicon nitride and silicon nitride-rich thin film technologies: State-of-the-art processing technologies, properties, and applications. ECS J. Solid State Sci. Technol. 2020, 9. [Google Scholar] [CrossRef]
  23. Popper, P. Applications of Silicon-Nitride. In Silicon Nitride 93; Hoffmann, M.J., Becher, P.F., Petzow, G., Eds.; Trans Tech Publications: Clausthal Zellerfe, 1994; Volumes 89–91, pp. 719–723. [Google Scholar]
  24. Li, L.Q.; Wang, S.F.; Ovcharenko, A.; Wang, W.Y. Molecular Dynamics Study of Nano-Tribological Properties of Silicon Nitride Films. In Proceedings of the ASME Design Engineering Technical Conferences and Computers and Information in Engineering Conference (DETC), Buffalo, NY, USA, 17–20 August 2014. [Google Scholar]
  25. Rettore, R.P.; Brito, M.A.M. Mechanical properties of silicon-nitride bonded silicon-carbide refractory and its relation microstructure. In Silicon Nitride 93; Hoffmann, M.J., Becher, P.F., Petzow, G., Eds.; Trans Tech Publications: Clausthal Zellerfe, 1994; Volumes 89–91, pp. 553–557. [Google Scholar]
  26. Wiederhorn, S.M.; Quinn, G.D.; Krause, R. High-temperature structural reliability of silicon-nitride. In Silicon Nitride 93; Hoffmann, M.J., Becher, P.F., Petzow, G., Eds.; Trans Tech Publications: Clausthal Zellerfe, 1994; Volumes 89–91, pp. 575–580. [Google Scholar]
  27. Gismatulin, A.A.; Gritsenko, V.A.; Yen, T.J.; Chin, A. Charge transport mechanism in SiNx-based memristor. Appl. Phys. Lett. 2019, 115, 253502. [Google Scholar] [CrossRef]
  28. Gismatulin, A.A.; Kamaev, G.N.; Kruchinin, V.N.; Gritsenko, V.A.; Orlov, O.M.; Chin, A. Charge transport mechanism in the forming-free memristor based on silicon nitride. Sci. Rep. 2021, 11. [Google Scholar] [CrossRef] [PubMed]
  29. Gritsenko, V.A.; Gismatulin, A.A.; Baraban, A.P.; Chin, A. Mechanism of stress induced leakage current in Si3N4. Mater. Res. Express. 2019, 6, 076401. [Google Scholar] [CrossRef]
  30. Gritsenko, V.A.; Gismatulin, A.A.; Chin, A. Multiphonon trap ionization transport in nonstoichiometric SiNx. Mater. Res. Express. 2019, 6, 036304. [Google Scholar] [CrossRef]
  31. Sun, C.; Liu, A.Y.; Samadi, A.; Chan, C.; Ciesla, A.; Macdonald, D. Transition metals in a cast-monocrystalline silicon ingot studied by silicon nitride gettering. Phys. Status Solidi-R. 2019, 13. [Google Scholar] [CrossRef]
  32. Liu, A.Y.; Sun, C.; Sio, H.C.; Zhang, X.Y.; Jin, H.; Macdonald, D. Gettering of transition metals in high-performance multicrystalline silicon by silicon nitride films and phosphorus diffusion. J. Appl. Phys. 2019, 125. [Google Scholar] [CrossRef]
  33. Wang, H.; Zhang, L.; Han, J.; Weinan, E. DeePMD-kit: A deep learning package for many-body potential energy representation and molecular dynamics. Comput. Phys. Commun. 2018, 228, 178–184. [Google Scholar] [CrossRef] [Green Version]
  34. Kresse, G.; Furthmüller, J. Efficient iterative schemes for ab initio total-energy calculations using a plane-wave basis set. Phys. Rev. B 1996, 54, 11169. [Google Scholar] [CrossRef]
  35. Perdew, J.P.; Burke, K.; Ernzerhof, M. Generalized gradient approximation made simple. Phys. Rev. Lett. 1996, 77, 3865. [Google Scholar] [CrossRef] [PubMed] [Green Version]
  36. Plimpton, S. Fast parallel algorithms for short-range molecular dynamics. J. Comput. Phys. 1995, 117, 1–19. [Google Scholar] [CrossRef] [Green Version]
  37. Peng, Y.; Wang, S.F.; Zhang, Y.; Gao, Y.N. Simulation and application of molecular dynamics in materials science. Adv. Mater. Res. 2012, 572, 232–236. [Google Scholar] [CrossRef]
  38. Kossowsky, R.; Miller, D.G.; Diaz, E.S. Tensile and creep strengths of hot-pressed Si3N4. J. Mater. Sci. 1975, 10, 983–997. [Google Scholar] [CrossRef]
  39. Yao, D.X.; Chen, H.B.; Zuo, K.H.; Xia, Y.F.; Yin, J.W.; Liang, H.Q.; Zeng, Y.P. High temperature mechanical properties of porous Si3N4 prepared via SRBSN. Ceram. Int. 2018, 44, 11966–11971. [Google Scholar] [CrossRef]
  40. Nakajima, H.; Chang, T.F.M.; Chen, C.Y.; Konishi, T.; Machida, K.; Toshiyoshi, H.; Yamane, D.; Masu, K.; Sone, M. A Study on Young’s Modulus of Electroplated Gold Cantilevers for MEMS Devices. In Proceedings of the 12th IEEE Annual International Conference on Nano/Micro Engineered and Molecular Systems (IEEE-NEMS), Los Angeles, CA, USA, 9–12 April 2017; pp. 264–267. [Google Scholar]
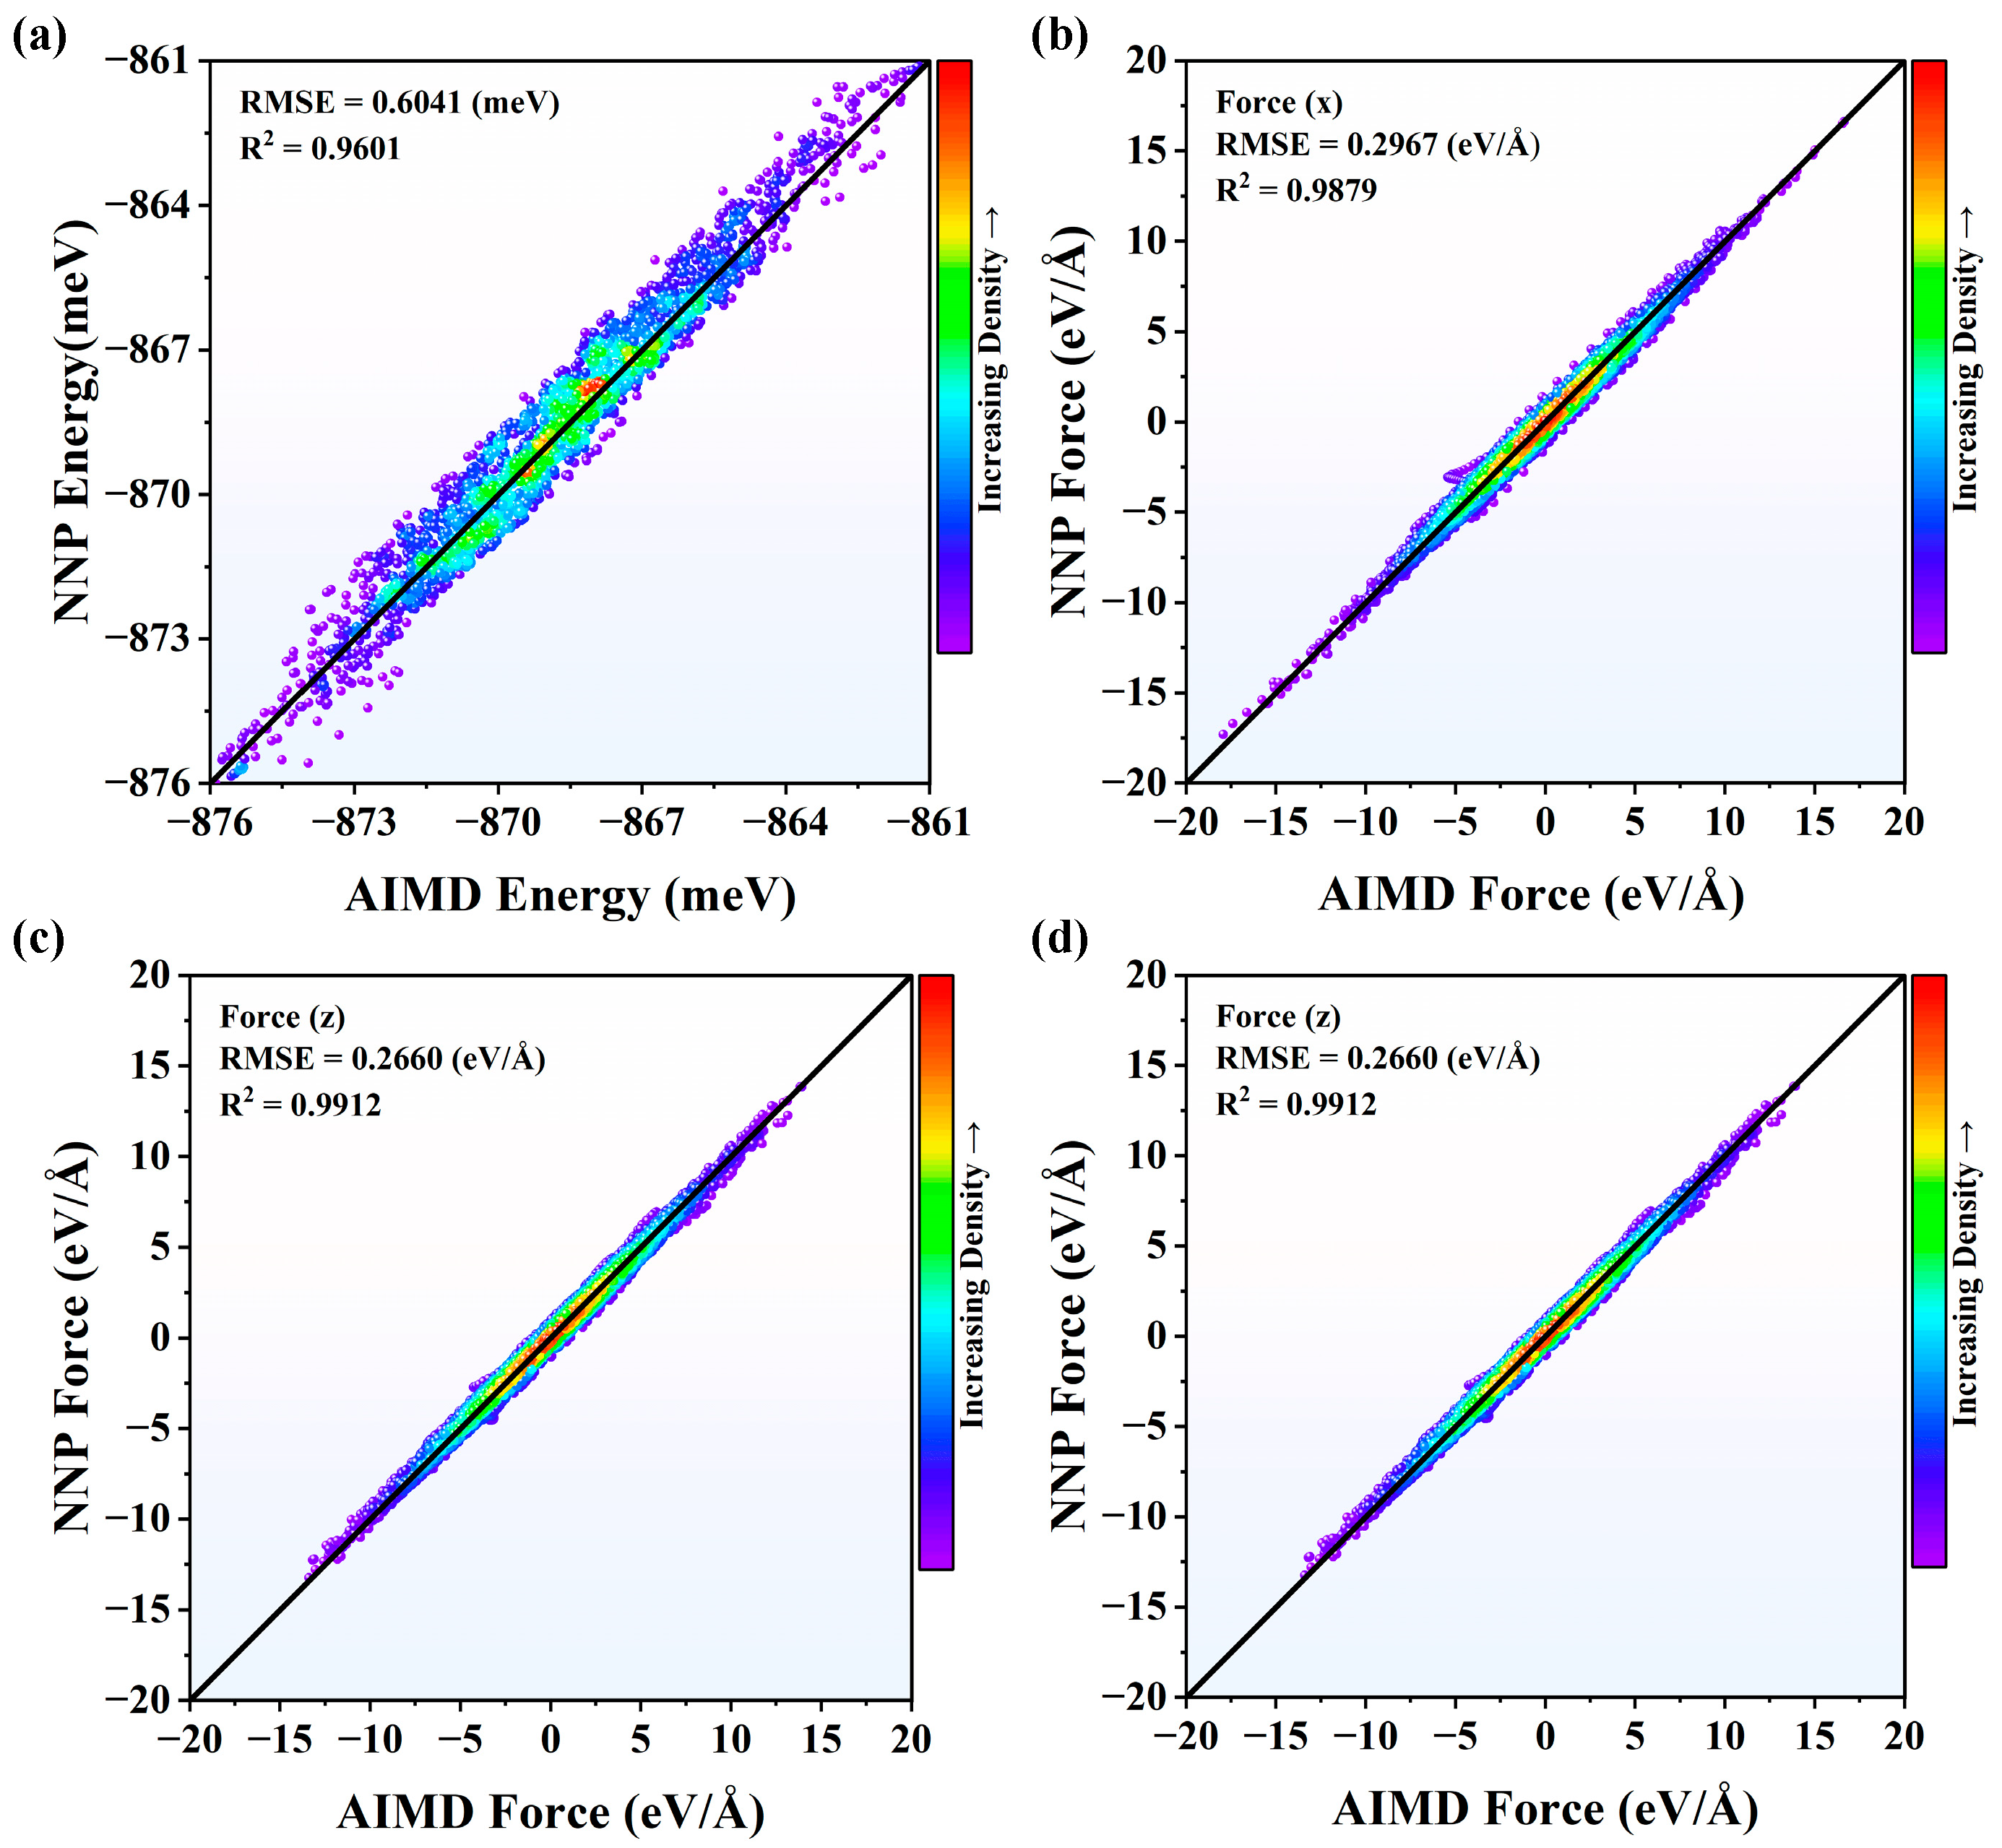
Figure 1. The comparisons of (a) energies and (bd) forces from NNP and AIMD for Si3N4 at 2000 K in x, y, and z directions.
Nanomaterials 13 01352 g001
Figure 2. The comparisons of (a) energies and (bd) forces from NNP and AIMD for Si3N4 at 3000 K in x, y, and z directions.
Nanomaterials 13 01352 g002
Figure 3. The comparisons of (a) Si3N4 RDFs between NNP + MD and AIMD calculations and (b) Si3N4 CNs between NNP + MD and AIMD calculations. The temperature is 2000 K.
Nanomaterials 13 01352 g003
Figure 4. The comparisons of (a) Si3N4 RDFs between NNP + MD and AIMD calculations and (b) Si3N4 CNs between NNP + MD and AIMD calculations. The temperature is 3000 K.
Nanomaterials 13 01352 g004
Figure 5. The BADs comparison of Si3N4 between NNP + MD and AIMD at 2000 K. (a) the N-Si-N BADs, (b) the Si-N-Si BADs.
Nanomaterials 13 01352 g005
Figure 6. The BADs comparison of Si3N4 between NNP + MD and AIMD at 3000 K. (a) the N-Si-N BADs, (b) the Si-N-Si BADs.
Nanomaterials 13 01352 g006
Figure 7. The models of SiNx. (a) x = 4/3, (b) x =5/4, (c) x = 6/5, (d) x = 7/6, (e) x = 8/7, (f) x = 1/1.
Nanomaterials 13 01352 g007
Figure 8. The RDFs of SiNx at (a) 2000 K and (b) 3000 K.
Nanomaterials 13 01352 g008
Figure 9. (a) The CNs of SiNx at 3000 K. The BADs of (b) Si-N-Si and (c) N-Si-N at 3000 K.
Nanomaterials 13 01352 g009
Figure 10. The simulated and experimental [39] strain–stress comparison of Si3N4. Reproduced with permission [39]. Copyright 2018 Elsevier.
Nanomaterials 13 01352 g010
Figure 11. The cross-sections of SiNx in the tensile tests. (a) x = 4/3, (b) x =5/4, (c) x = 6/5, (d) x = 7/6, (e) x = 8/7, (f) x = 1/1.
Nanomaterials 13 01352 g011
Figure 12. (a) The strain–stress curves of SiNx at 300 K. (b) The mechanical properties of SiNx.
Nanomaterials 13 01352 g012
Table 1. The simulation parameters in SiNx heating process.
Si:Nx (Å)y (Å)z (Å)Atoms
4:554545413500
5:654545413750
6:754545414625
7:854545413125
1:154545413500
Disclaimer/Publisher’s Note: The statements, opinions and data contained in all publications are solely those of the individual author(s) and contributor(s) and not of MDPI and/or the editor(s). MDPI and/or the editor(s) disclaim responsibility for any injury to people or property resulting from any ideas, methods, instructions or products referred to in the content.