Article

Synthesis of TiO2/Al2O3 Double-Layer Inverse Opal by Thermal and Plasma-Assisted Atomic Layer Deposition for Photocatalytic Applications

by
Hamsasew Hankebo Lemago
1,*,
Feras Shugaa Addin
1,
Dániel Atilla Kárajz
1,
Tamás Igricz
2,
Bence Parditka
3,
Zoltán Erdélyi
3,
Dóra Hessz
4,5 and
Imre Miklós Szilágyi
1,*
1
Department of Inorganic and Analytical Chemistry, Faculty of Chemical Technology and Biotechnology, Budapest University of Technology and Economics, Műegyetem rkp. 3., H-1111 Budapest, Hungary
2
Department of Organic Chemistry and Technology, Faculty of Chemical Technology and Biotechnology, Budapest University of Technology and Economics, Műegyetem rkp. 3., H-1111 Budapest, Hungary
3
Department of Solid-State Physics, Faculty of Sciences and Technology, University of Debrecen, H-4002 Debrecen, Hungary
4
Department of Physical Chemistry and Materials Science, Faculty of Chemical and Bioengineering, Budapest University of Technology and Economics, Műegyetem rkp. 3., H-1111 Budapest, Hungary
5
MTA-BME Lendület Quantum Chemistry Research Group, Műegyetem rkp. 3., H-1111 Budapest, Hungary
*
Authors to whom correspondence should be addressed.
Nanomaterials 2023, 13(8), 1314; https://doi.org/10.3390/nano13081314
Submission received: 5 February 2023 / Revised: 31 March 2023 / Accepted: 6 April 2023 / Published: 8 April 2023

Abstract

:
In comparison to conventional nano-infiltration approaches, the atomic layer deposition (ALD) technology exhibits greater potential in the fabrication of inverse opals (IOs) for photocatalysts. In this study, TiO2 IO and ultra-thin films of Al2O3 on IO were successfully deposited using thermal or plasma-assisted ALD and vertical layer deposition from a polystyrene (PS) opal template. SEM/EDX, XRD, Raman, TG/DTG/DTA-MS, PL spectroscopy, and UV Vis spectroscopy were used for the characterization of the nanocomposites. The results showed that the highly ordered opal crystal microstructure had a face-centered cubic (FCC) orientation. The proposed annealing temperature efficiently removed the template, leaving the anatase phase IO, which provided a small contraction in the spheres. In comparison to TiO2/Al2O3 plasma ALD, TiO2/Al2O3 thermal ALD has a better interfacial charge interaction of photoexcited electron–hole pairs in the valence band hole to restrain recombination, resulting in a broad spectrum with a peak in the green region. This was demonstrated by PL. Strong absorption bands were also found in the UV regions, including increased absorption due to slow photons and a narrow optical band gap in the visible region. The results from the photocatalytic activity of the samples show decolorization rates of 35.4%, 24.7%, and 14.8%, for TiO2, TiO2/Al2O3 thermal, and TiO2/Al2O3 plasma IO ALD samples, respectively. Our results showed that ultra-thin amorphous ALD-grown Al2O3 layers have considerable photocatalytic activity. The Al2O3 thin film grown by thermal ALD has a more ordered structure compared to the one prepared by plasma ALD, which explains its higher photocatalytic activity. The declined photocatalytic activity of the combined layers was observed due to the reduced electron tunneling effect resulting from the thinness of Al2O3.

1. Introduction

The rapid growth of the population and industrial development resulted in the discharge of toxic pollutants into the environment and the ecosystem as well [1]. Although the concentrations of the contaminants, such as pharmaceuticals, insecticides, surfactants, and endocrine disruptors (i.e., hormones), are found in minimal amounts, a profound effect on the environment has been observed [2,3,4]. In recent years, different approaches have been developed to reduce the harmful effect of trace organic chemicals from natural waters. Promising results and progress for semiconductor oxide inverse opals (IOs) in water purification processes have been frequently reported [5,6]. IOs are photonic crystals of a highly ordered three-dimensionally interconnected microporous skeleton accompanied by a high specific surface area and unique optical characteristics, such as the optical band gap [7], photo localization [8,9], negative refractive index [10], slow light effect [11,12], and super prism effect [13], for various applications such as photocatalysis [14,15], gas sensors [16], and energy storage [17,18]. These initiatives may boost the photocatalytic activity by increasing the electron–hole pair separation efficiency in the IO structures and extending the photo response range [19,20]. The growth of composites is a viable strategy to enhance photocatalytic performance and a useful means to accelerate the separation of electron–hole pairs in IO structures [21,22].
In fabricating the IO structures, a bottom-up approach is the most popular synthetic technique. This process passes through three different successive steps: (a) the deposition of a colloid crystal template on top of the substrate; (b) filling the nanosphere’s voids with the precursors of high-dielectric materials [23,24]; and (c) removing the original opal template using wet chemical etching and calcination in the case of SiO2 and polymer templates, respectively [25,26]. Additionally, techniques such as atomic layer deposition (ALD) [27,28], sol–gel [29,30], and hydrothermal methods [31,32] could be used for infiltration purposes. However, due to the extremely small void area between nanospheres, conventional infiltration processes, including chemical vapor deposition (CVD) and sol–gel, have limitations in completely infiltrating oxides in the voids of the template [33]. Since the aforementioned approaches have limitations in the infiltration of the voids, approaches such as ALD have been recently proposed to reverse these and associated effects.
Atomic layer deposition can be used to develop semiconductor oxides, such as TiO2, ZnO, WO3, Al2O3, and multiwalled nanostructures (i.e.,TiO2/ZnO, TiO2/FeO3, and Al2O3/TiO2) [34,35,36]. It allows atomic-scale control over thickness and a homogeneity vapor-phase thin-film growth technique. It is based on a succession of two self-limiting interactions between gas-phase precursor molecules and a solid surface. The self-limited surface reactions ensure that the films deposited by ALD grow atomically layer-by-layer, allowing accurate thickness control and the conformal deposition of thin films on high-aspect-ratio nanostructures [19].
Due to its potency in decomposing various pollutants into biodegradable compounds, TiO2 has been found an effective photocatalyst for the breakdown of pollutants [37,38,39] and it is also a widespread material to fabricate IOs. Moreover, recent studies have proven that the development of double-layered IOs with enhanced photocatalytic activity, such as TiO2/ZnO [40], TiO2/Fe3O4 [41], ZrO2/TiO2 [42], and Cu-doped TiO2 [43], have been shown to accelerate charge separation efficiency and extend the photoexcitation energy for efficient photocatalysis. Given that coupling effects may be attributed to the synergistic interfacial charge interactions among composites, this resulted in more interface between layers, for the efficient transfer of photo-generated electron–hole pairs to restrict the recombination. In addition, heterojunction at the oxide interfaces facilitates accelerated charge separation efficiency and the transfer of photoinduced charge carriers more than single bulk oxides [44,45,46].
Aluminium dioxide (Al2O3), however, is not considered to have photocatalytic activity, since it is usually amorphous with several defect sites, which can be recombination centers [47]. Nonetheless, the ALD-grown ultrathin amorphous Al2O3 layers exhibited photocatalytic properties. It was a question of how an ALD-grown TiO2/amorphous Al2O3 heterojunction would work as a photocatalyst. It has been seen that an ultra-thin-film Al2O3 ALD suppressed the photocatalytic activity of the TiO2 nano-particles [48,49], whereas E. Barajas-Ledesma et al. found that the Al2O3 doping enhances the photocatalytic activity of TiO2 thin films. Shenouda et. al. [50] also revealed that the ultra-thin-film Al2O3 ALD is an active photocatalyst for wastewater treatment. In this case, it was unclear whether the Al2O3 layer would also have a photocatalytic effect. The influence of thermal or plasma ALD for preparing photocatalytic Al2O3 had to be explored.
Hence, this study followed a two-step complete growth process to prepare TiO2, TiO2/thermal Al2O3, and TiO2/plasma Al2O3 inverse opal structures. Initially, TiO2 was grown on the PS opal by thermal ALD and the template was removed at a higher temperature to obtain the IO structure. Secondly, a thin layer of Al2O3 was also grown on the IO surface by using thermal or plasma ALD, and TiO2/thermal Al2O3 and TiO2/plasma Al2O3 plasma double layers were obtained. The opal template was prepared by vertical layer deposition using a glass substrate. This study aimed to fabricate TiO2 single and TiO2/Al2O3 double-layered IO composite structures and explore their photocatalytic activities. In order to determine the proper annealing temperature, thermal analysis was employed. The bare IO and its composite structures were studied by SEM-EDX (scanning electron microscope–energy dispersive X-ray microanalysis), XRD (X-ray diffraction), Raman, and UV–Vis spectroscopy.

2. Material and Methods

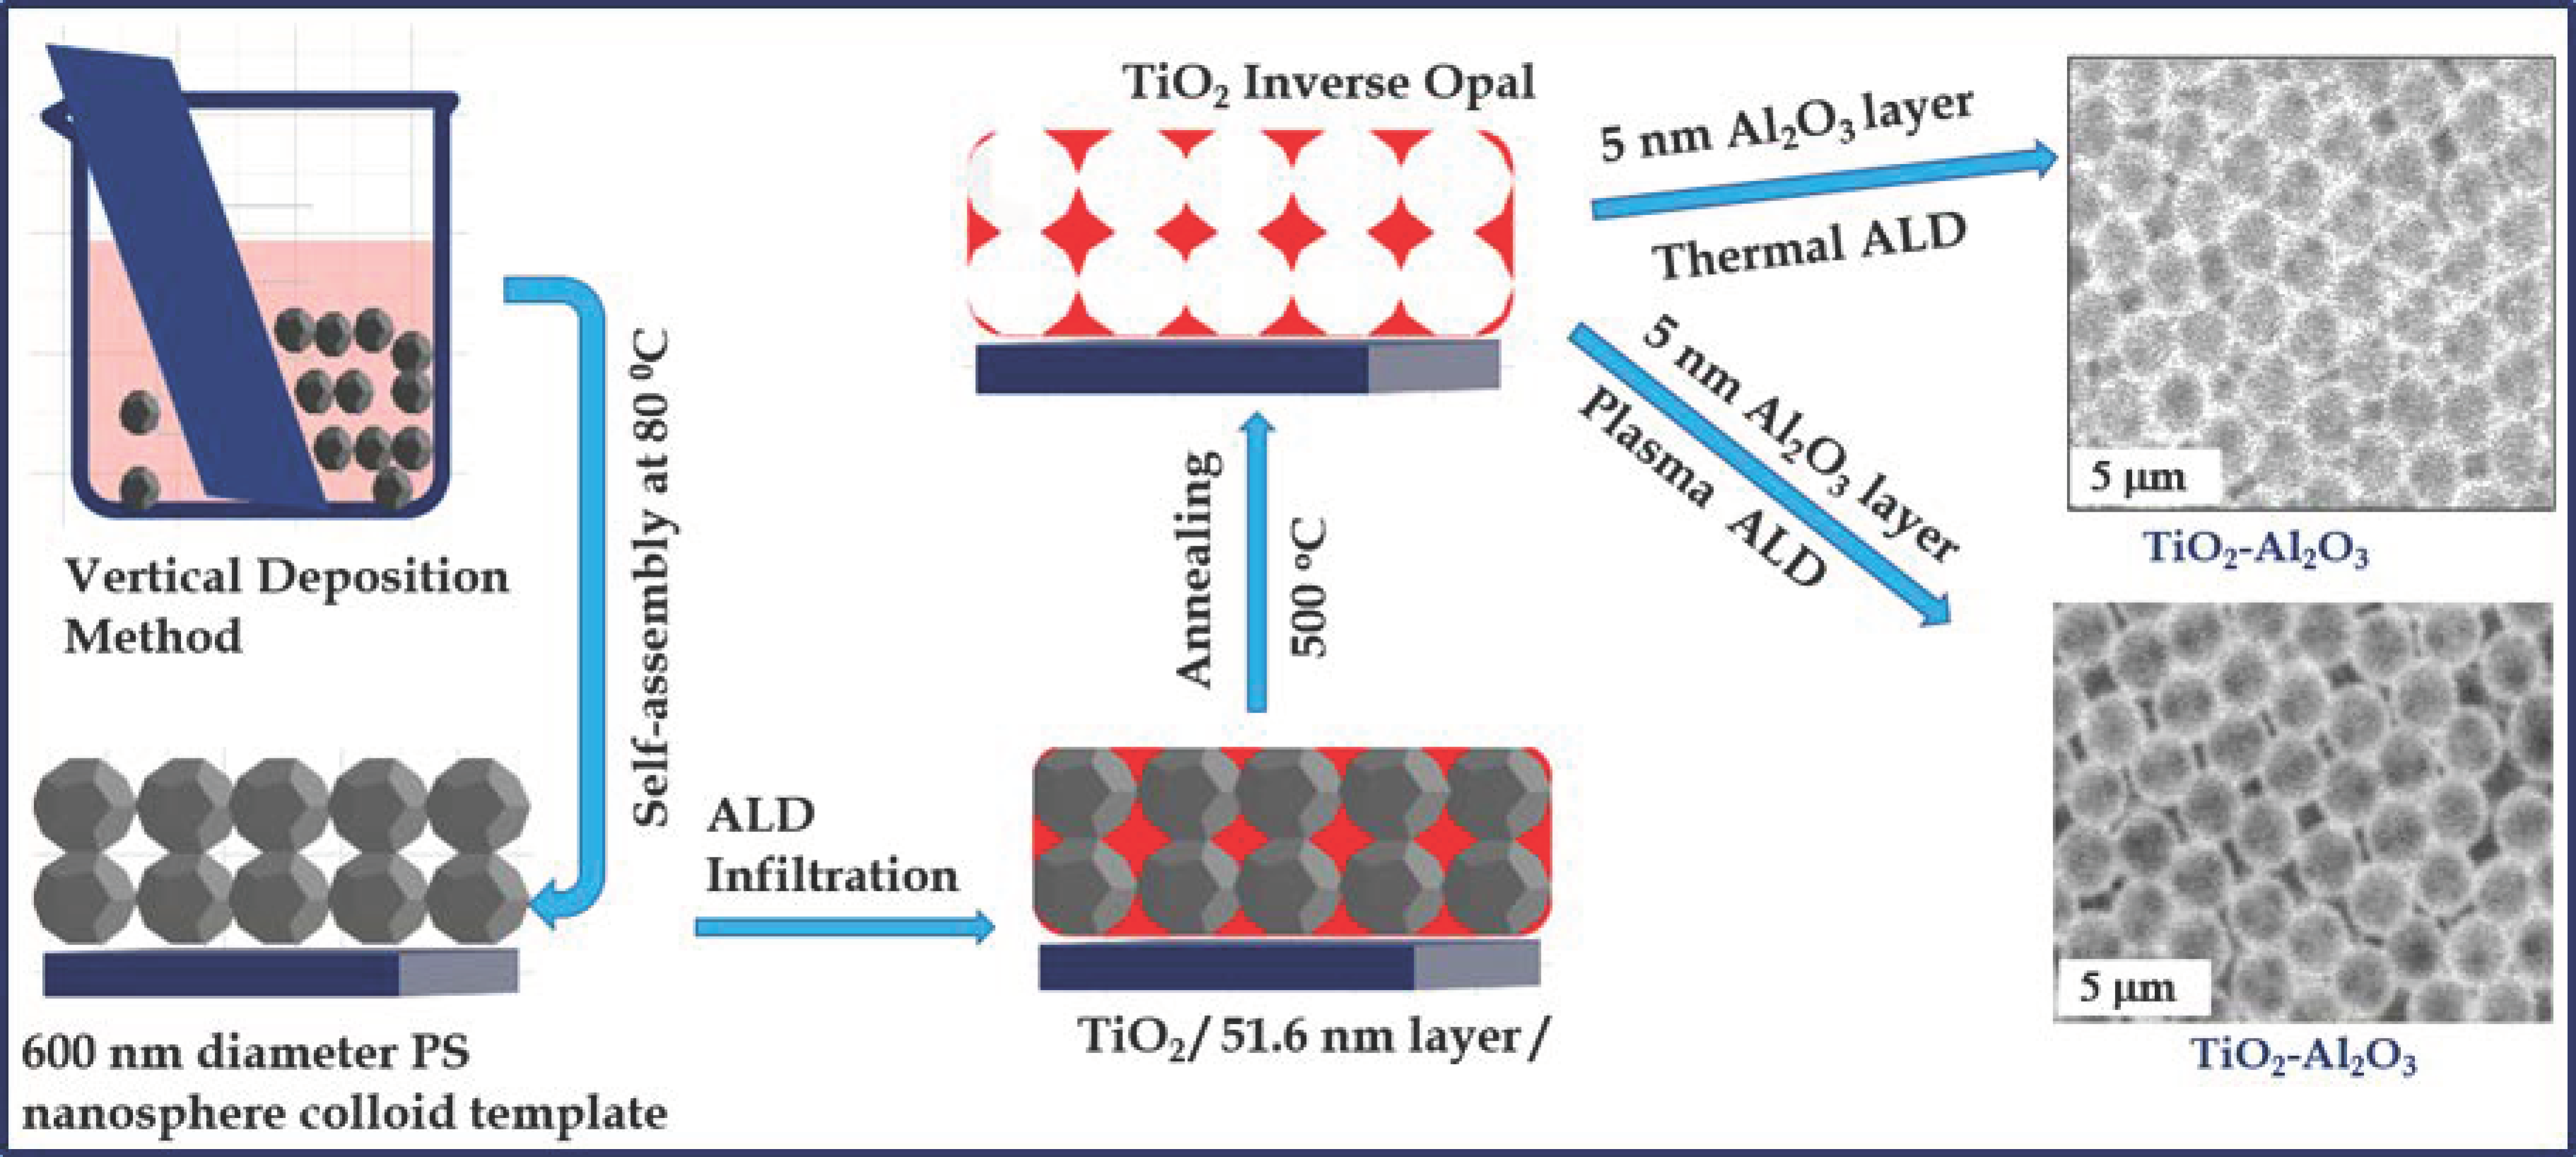
2.1. Preparation of Inverse Opal

The opal template was prepared from a PS suspension (Sigma Aldrich, Darmstadt, Germany,10% w/w and 600 nm particle size) after dilution to achieve a concentration of 0.3% by transferring 0.15 mL to a 5 mL flask and them placed in a closed glass container to avert its evaporation and ultrasonicated for 2 h to separate the aggregated nanospheres. A microscope glass slide (Knittel Glaser ca. 76 mm × 26 mm, Braunschweig, Germany) was used as a planar substrate, which was cleaned first with soap, ethyl alcohol, and ion exchange water. This substrate was soaked in a piranha solution (a mixture of H2SO4 and H2O2 in a 3:1 ratio) for 1 h to remove any organic residue on the glass surface and to make it more hydrophilic. The clean glass slides were placed in the PS suspension at a 45-degree angle position to achieve the successful vertical deposition self-assembly of colloidal particles. They were placed in the furnace at 50 °C for 14 h, so the colloidal crystal could form during the evaporation of the water through colloidal self-assembly, and were finally heated to 80 °C for 1.5 h. The schematic representation of the whole experimental procedure is shown in Figure 1.
The ALD parameters for TiO2 and Al2O3 deposition are shown in Table 1. For the ALD runs, a Beneq TFS-200-186 ALD reactor was used, while for TiO2 and Al2O3 depositions, TiCl4, TMA, and H2O precursors were used at 52.9 °C in a thermal-mode ALD. For plasma-assisted Al2O3 ALD deposition, TMA and O2 gas precursors were also used. Prior to the sample preparation, the deposition chamber had been heated to 45–50 °C. The pressure inside the vacuum chamber was 7.4 m bar while it was 1.2 m bar in the reactor. The RF power used for the plasma is 50 W.
Spectrometry ellipsometry was used to determine the film thickness of the samples. Si wafers were also introduced into the ALD system with the samples together to act as a seed layer and reference layer for the oxides.
Finally, the PS opal template was removed by annealing in a Nabertherm L9/11/B410 furnace. The samples were annealed in the air heated from room temperature to 500 °C for 4 h, and held there for 2 h, leaving behind a mechanically stable inverse opal.

2.2. Sample Characterization

For the PS opal sample, thermal analysis was carried out with a TA Instruments SDT 2960 simultaneous thermogravimetry/differential thermal analysis/derivative thermogravimetry (TG/DTG/DTA) device, in an air atmosphere with a heating rate of 10 °C/min and a flow rate of 130 cm3/min until 600 °C, simulating the environment during the removal of the polystyrene nanospheres. The evolved gaseous products were identified with a thermostat GSD 300 Balzers Instruments type quadrupole mass spectrometer (MS) coupled online to the TG/DTA device. The selected ions were followed in multiple ion detector (MID) modes. For the measurement, the thin PS film was scratched off from the glass surface and collected into the Pt crucibles.
The SEM images were taken with an FEI Inspect S50 scanning electron microscope, in a low vacuum system, using a backscattered electron detector. The samples were examined without any modification or treatment, and no conductive film (Au and Pd) was deposited on the samples to avoid possible signals due to their interference.
EDX spectra were measured by a Bruker Quantax 200 SEM at 20 kV. The elements were identified, and their atomic percentages in the study spots were calculated.
Raman spectra were measured by a Jobin Yvon Labram Raman spectroscope hyphenated with an Olympus BX41 microscope, using a green (532 nm) Nd-YAG laser in a range of 100–1800 cm−1.
X-ray diffractograms were recorded on a PAN analytical X’Pert Pro MPD X-ray diffractometer using Cu Kα radiation; the measurement range was 5°–65°. Diffraction patterns were referenced against the ICDD database for sample identification.
The photoluminescence spectra (PL) were recorded at room temperature on an Edinburgh Instruments FS5 spectrofluorometer. The excitation wavelength was 380 nm, and a 400 nm notch filter (FGL400) was placed in the emission beam.
A variable angle spectroscopic ellipsometer (SE, SEMILAB SE-2000) was used to determine the film thickness of the samples.
The reflectance UV–Vis spectra were recorded by the Avantes AvaSpec-2048 spectrophotometer.
The photocatalytic activity of the thin films was tested by the degradation of methylene blue (MB) dye under visible light illumination for 3 h. The test was carried out by immersing the film in a glass container with a 20 mL of 1.0 × 10⁻⁶ M MB solution. For visible light irradiation, six 18 W fluorescent lamps were placed in a stack of three lamps in two lines 10 cm apart. The sample solution was located 5 cm in front of the middle of the two lamps. The solution was thoroughly mixed by a magnetic stirrer for half an hour to allow adsorption–desorption equilibrium to occur. The decomposition of the dye was measured by an Avantes AvaSpec-2048 fiber optic spectrometer with an Ava Light–DHS light source and evaluated by its Ava Soft software. In every half-hour, 3 mL was taken from the solution, whose absorbance was measured in a quartz cuvette and was put back for further photocatalysis. The decomposition of the dye was examined by the decrease in the relative absorbance (At/A0) at the most intensive peak of MB at 665 nm.

3. Result and Discussion

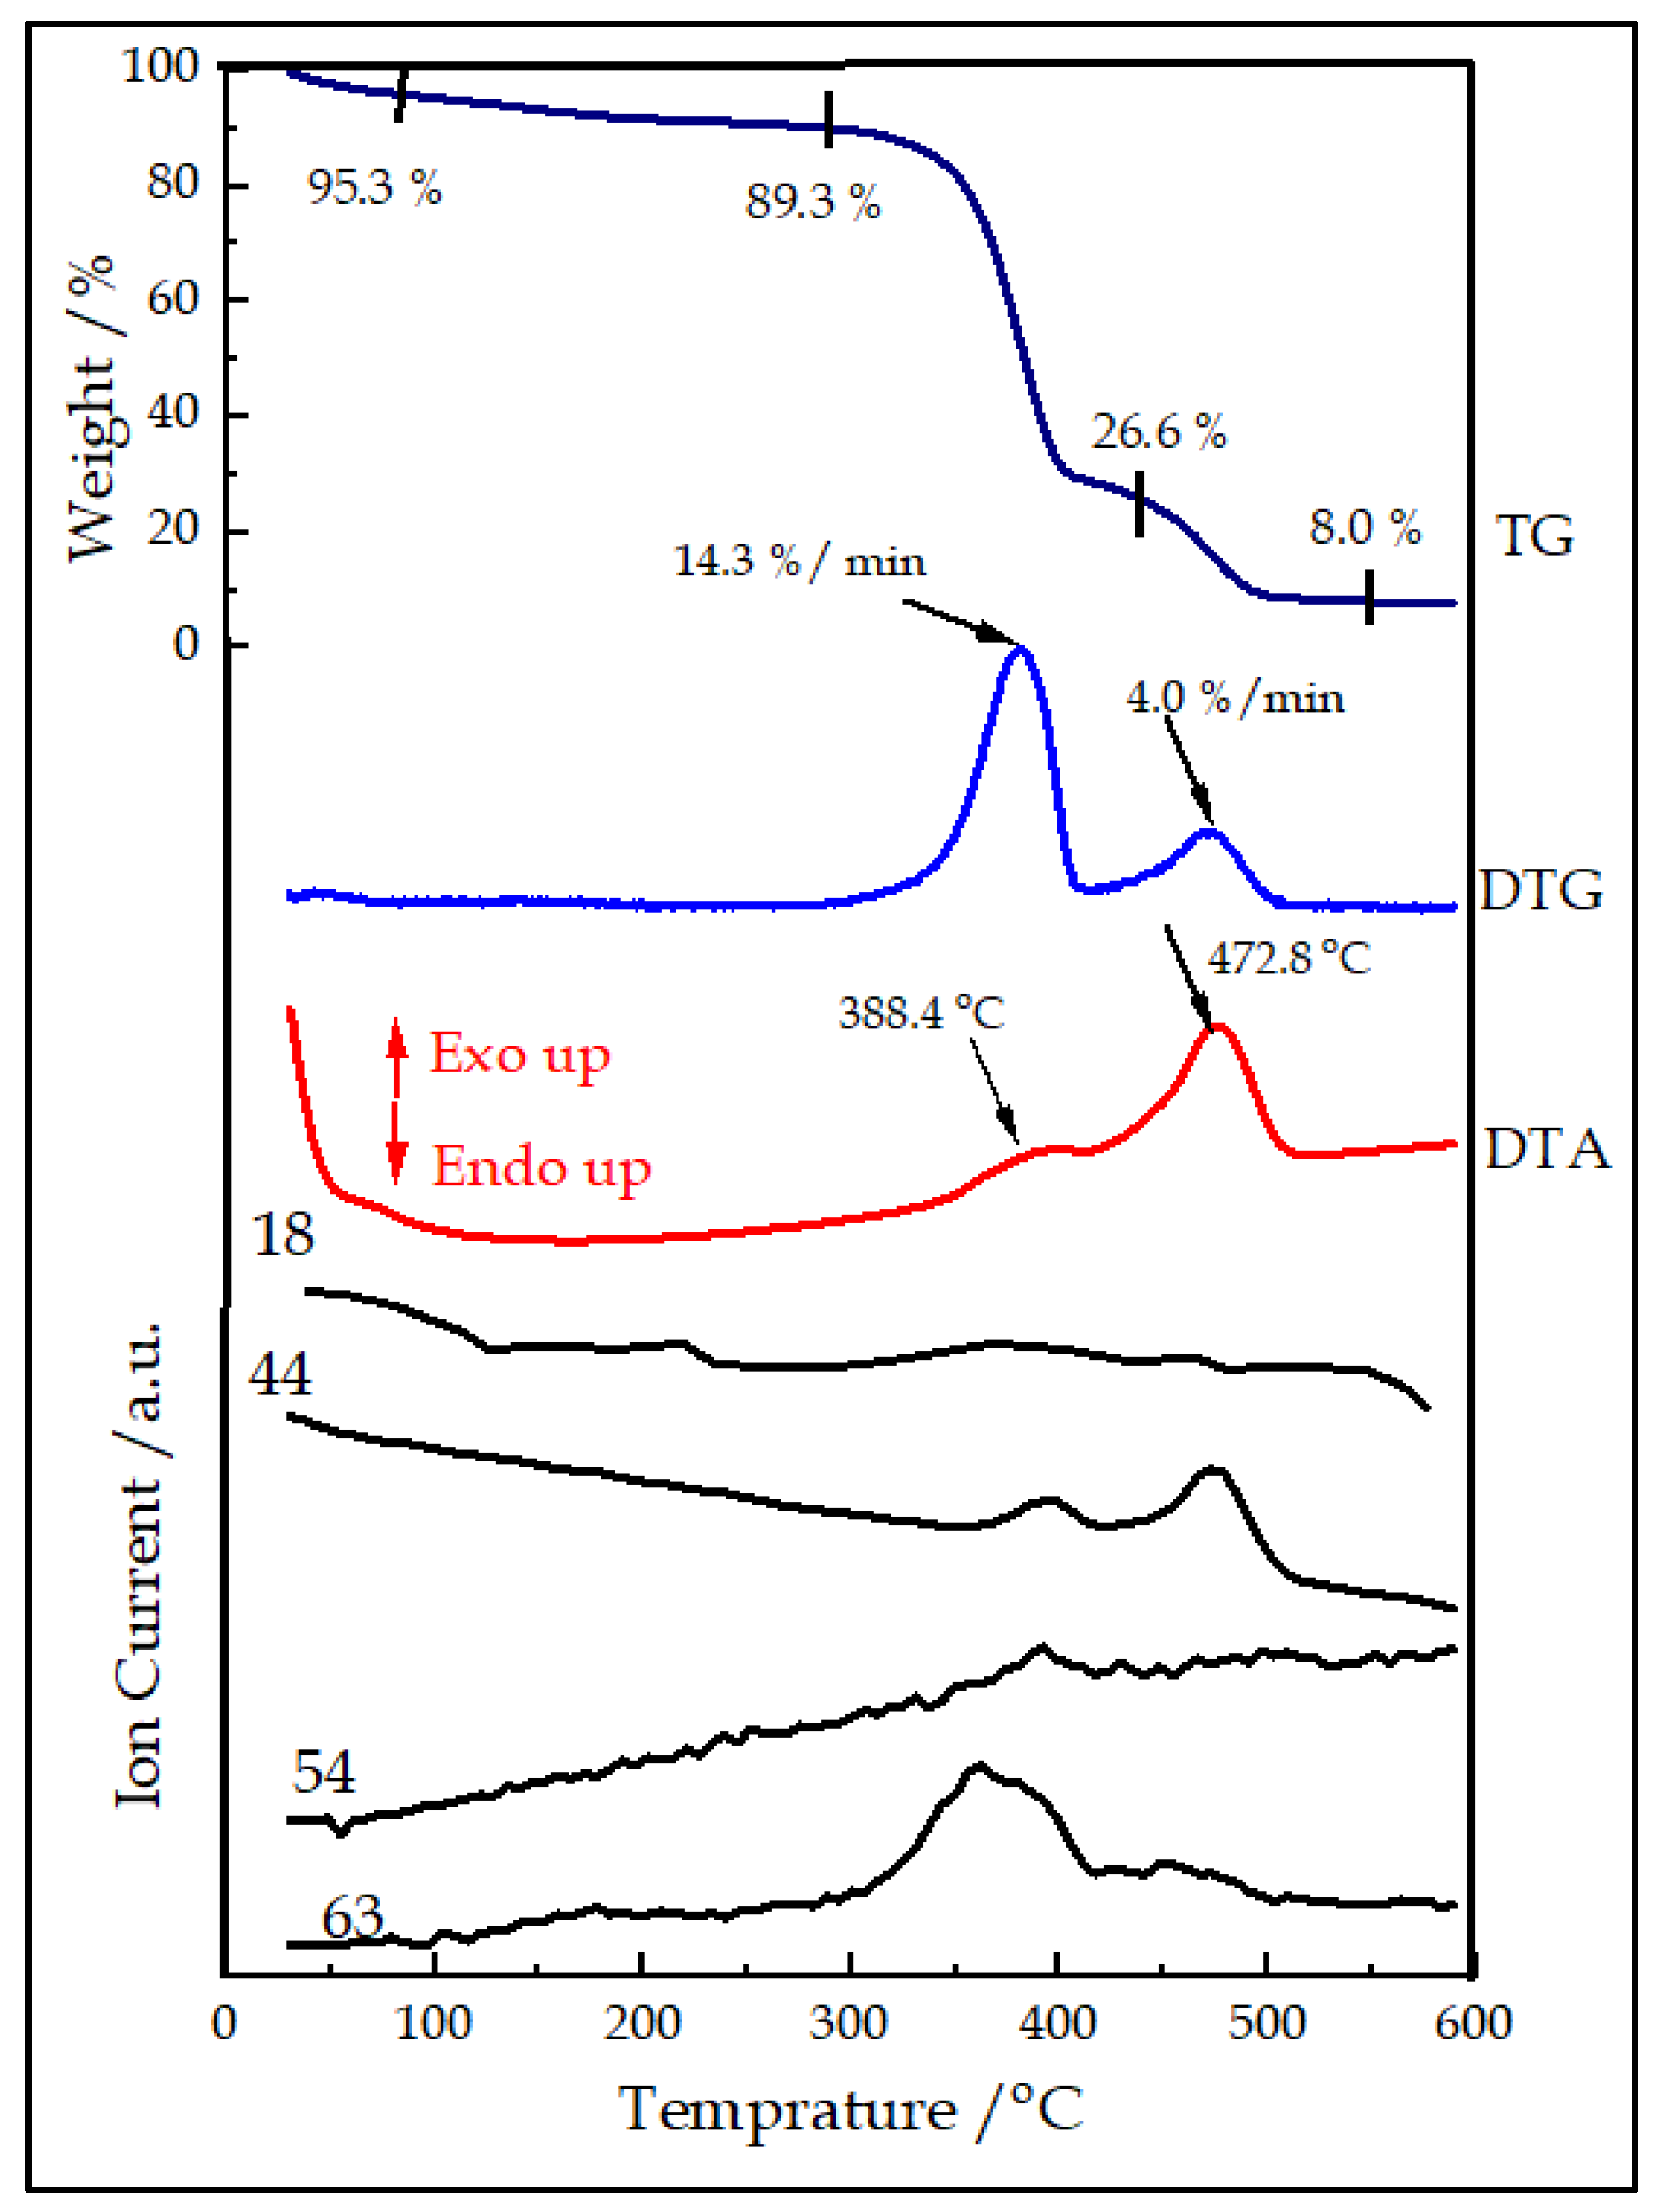
3.1. Opal Template as Determined by Thermal Analysis

The thermal analysis of the PS opal template showed that annealing at 600 °C was an effective technique to remove the template (Figure 2). It was observed that the template was thermally stable up to about 100 °C, with only an evolution of solvent (mass to charge ratio, m/z = 18, 4.6% mass loss). The TG/DTG curves showed two main stages (300–425 and 425–500 °C) of decomposition combined with the exothermic burning of the organic material. The first step was explained by the decomposition and combustion of the main part of the sacrificial polymer precursors, while the second step was the result of the burning of the remaining char. Based on the measurement, 500 °C was adequate as an annealing temperature to remove the polymer opal template and produce the IO structure. This also corroborated to Worzakowska [51] and Manikandan et al. [52].

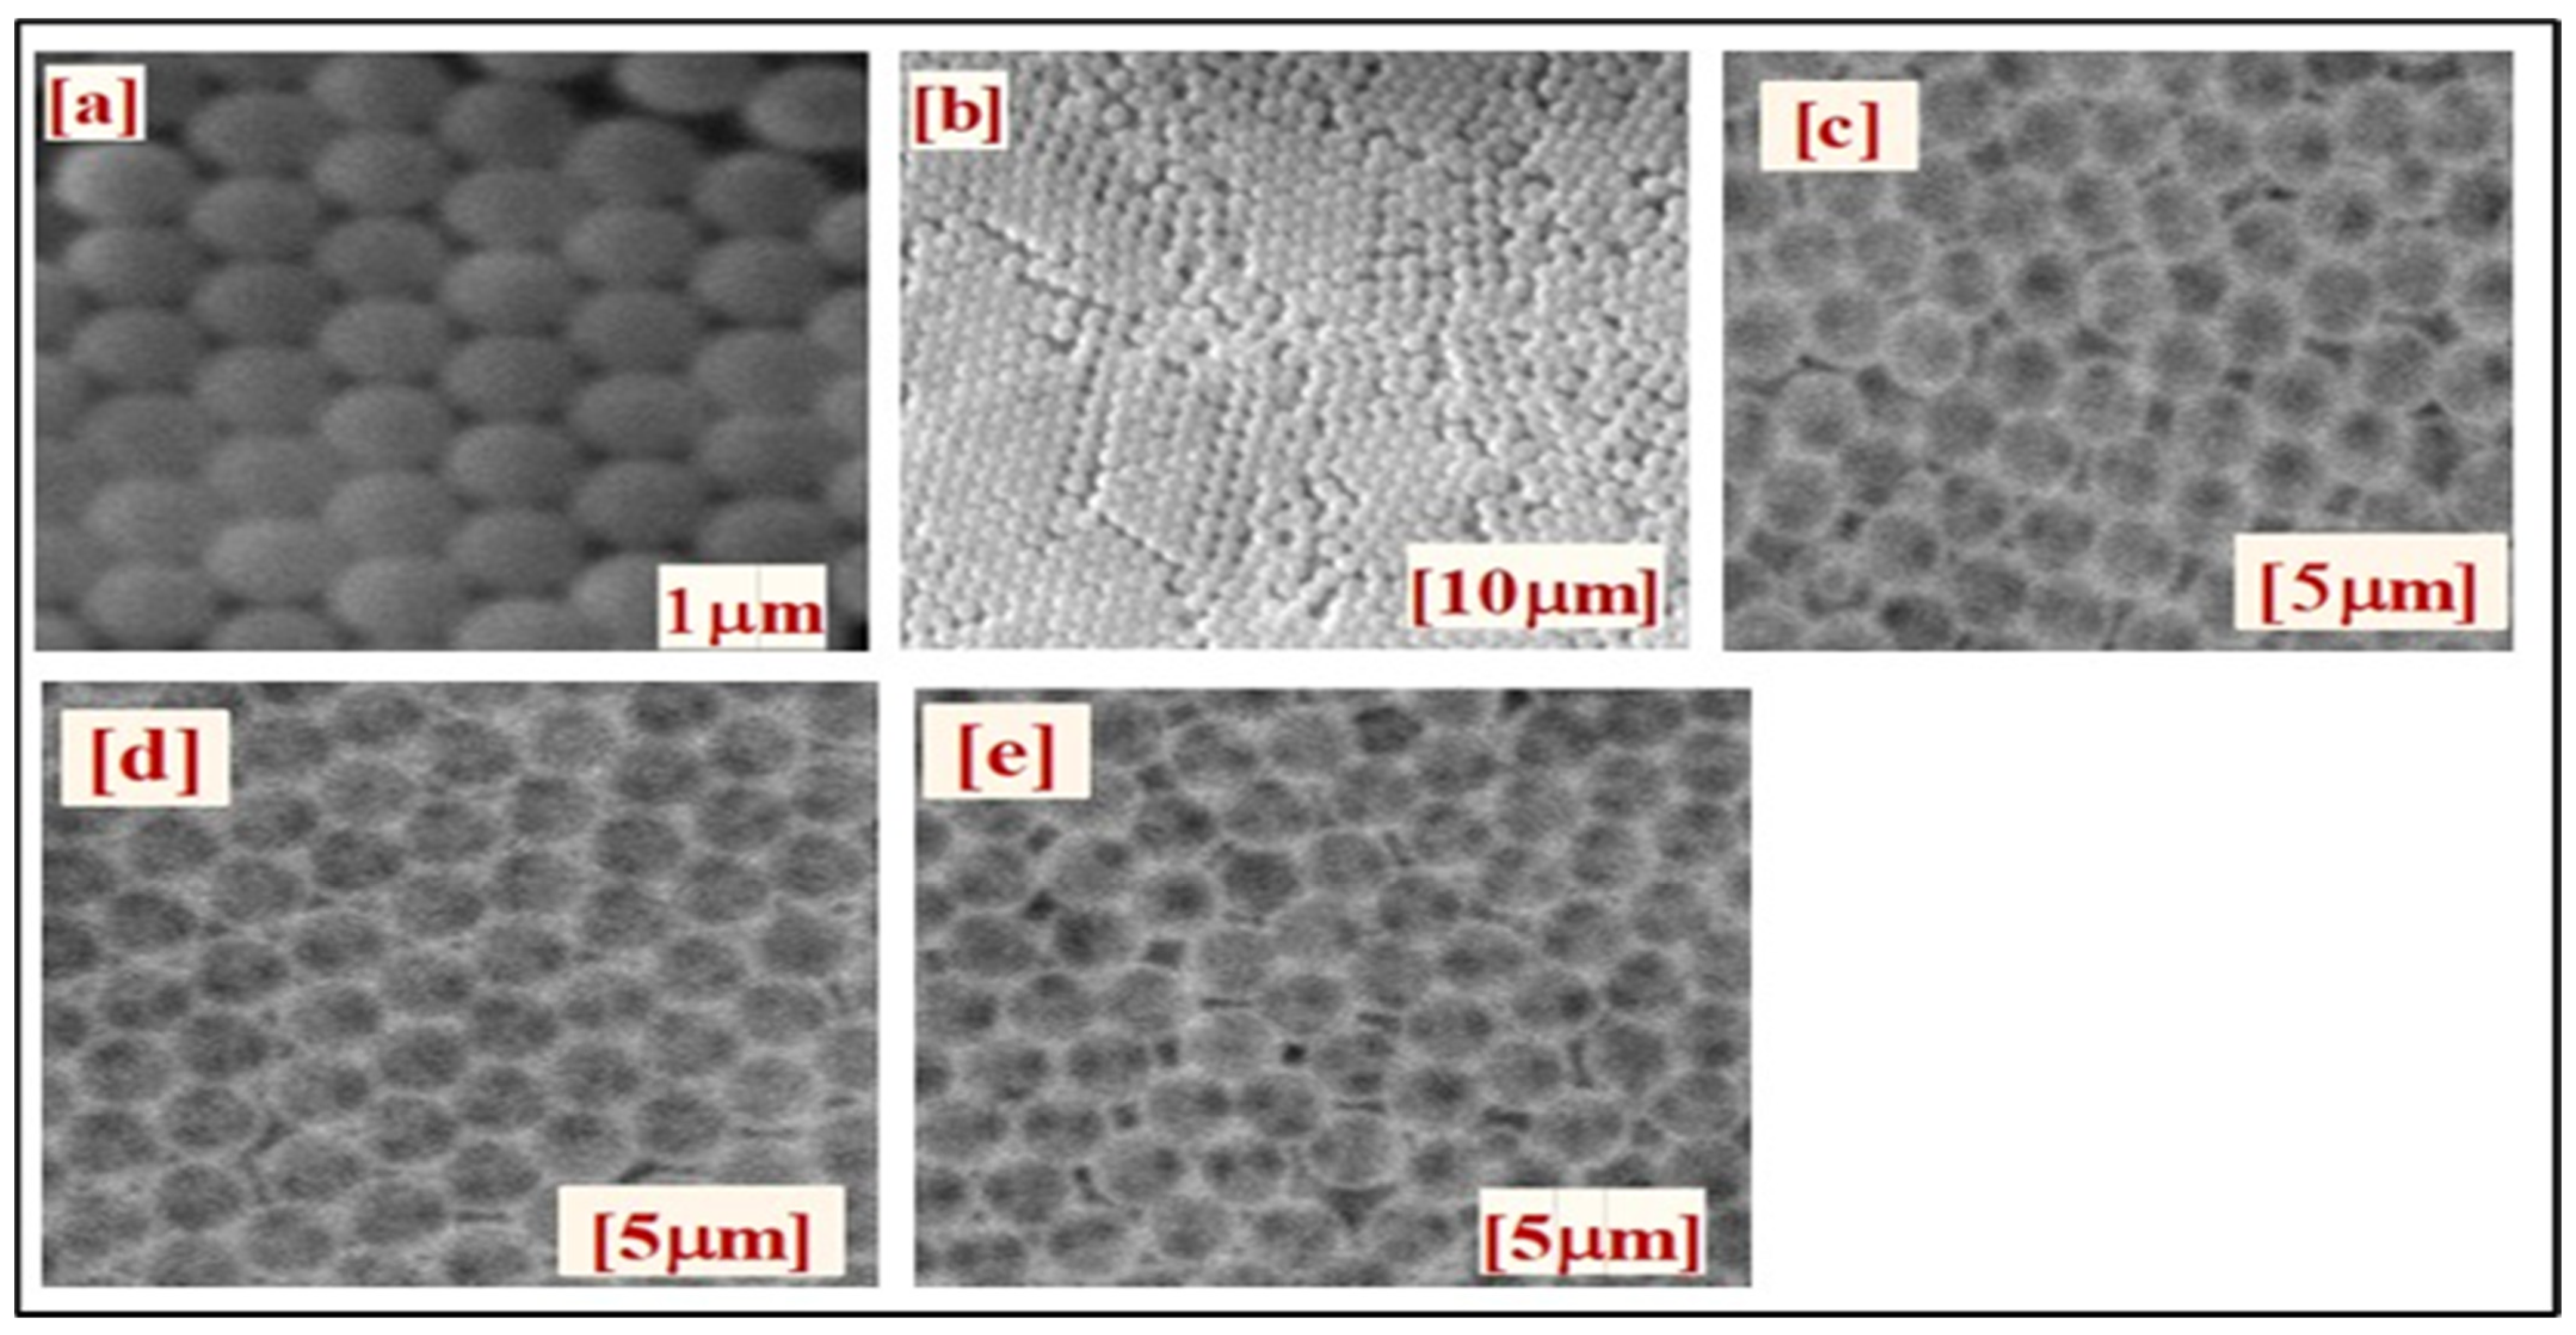
3.2. Morphological and Compositional Evaluation of the Samples

TiO2 and Al2O3/TiO2 IOs arrays were analyzed through infiltration methods in which the filling materials entered the PS nanosphere microstructure. The SEM images of an opal showed that they are highly porous and have uniform sphere sizes as shown in Figure 3. The IO and double-layer samples no longer showed consistent differences. In the template structure perspective, the layer’s interconnected and well-ordered periodic microporous structures also displayed a face-centered cubic (FCC) formation. However, minor cracks were observed due to the substantial volume shrinkage during annealing, as the IO shells contract by 16.67% after annealing.
As shown in Table 2, which details the composition of the samples from the EDX analysis, the pure IO and double-layer samples contained considerable amounts of Ti, Al, and O. Additionally, Cl and C were residues of TiCl4 and TMA precursors, and signals from the glass substrate (Na, Al, Si, and Ca) were detected.

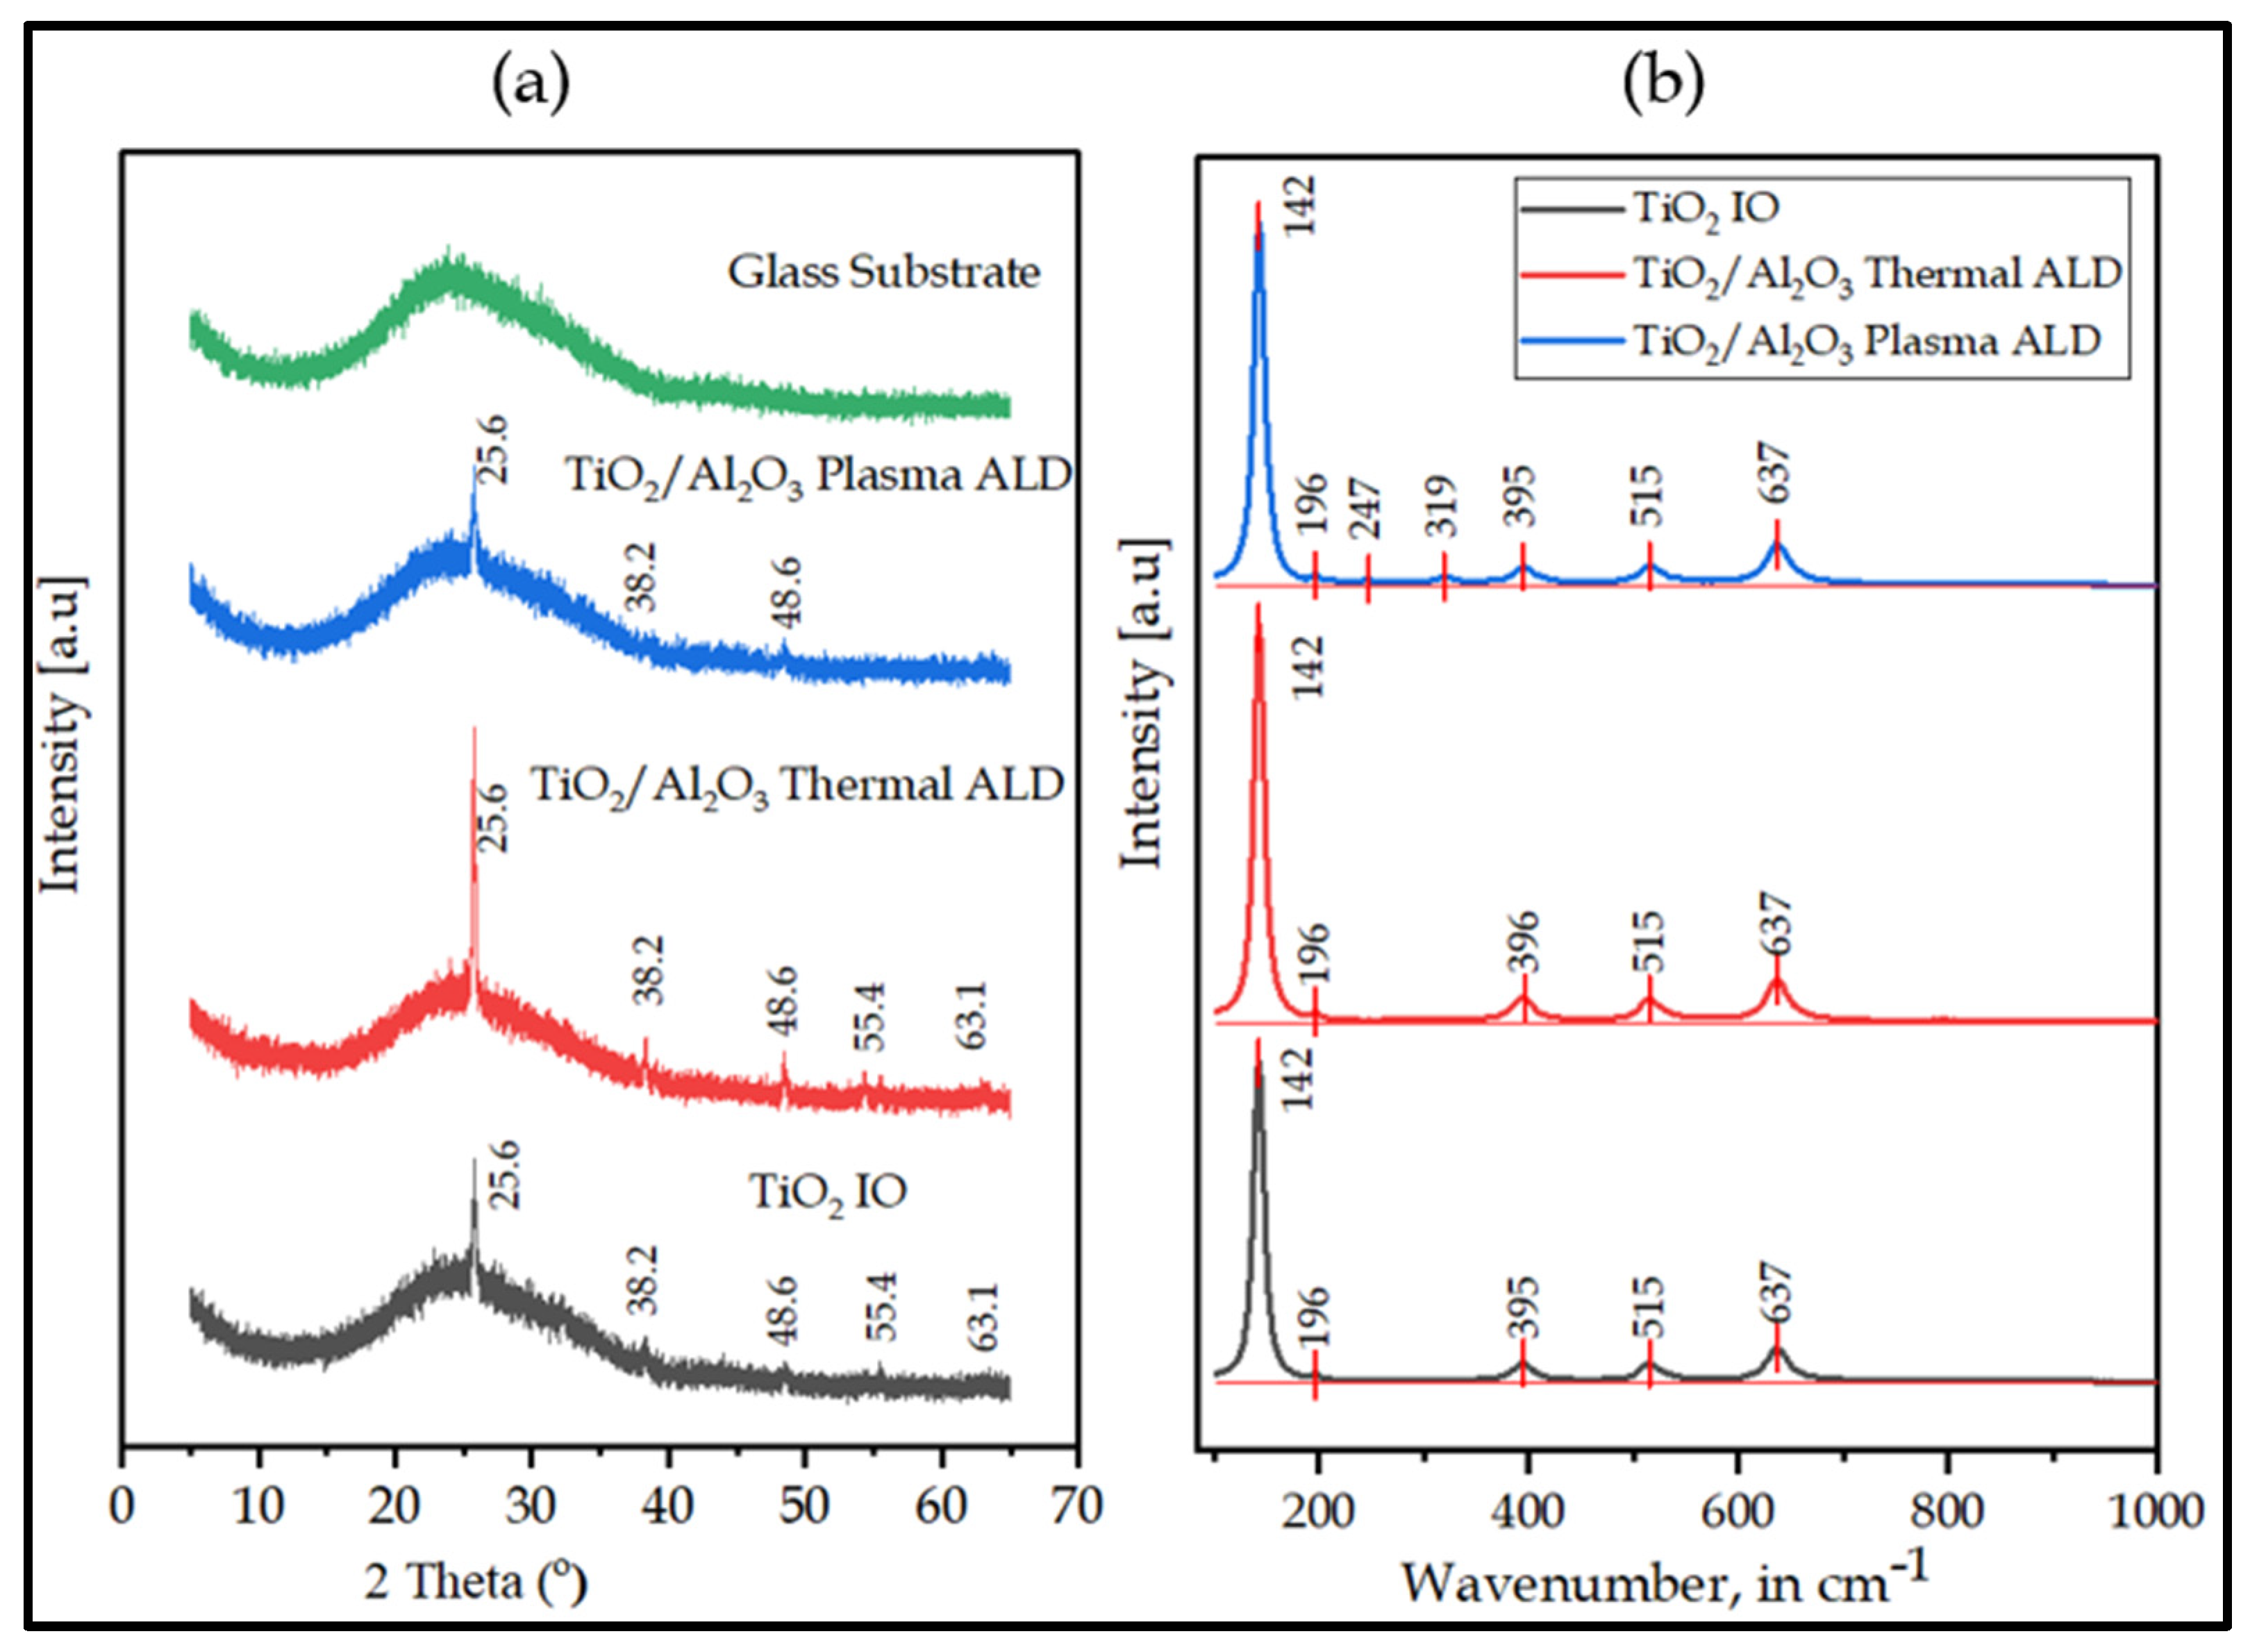
3.3. XRD and Raman Structural Analysis

The crystalline structure of the samples was characterized by both XRD and Raman (Figure 4a,b). The major XRD peaks were shown at 25.6°, 38.2°, 48.6°, 55.4°, and 63.1°, corresponding to TiO2 tetragonal anatase phase (ICCD card number: 98-009-2363). Similar results were reported by Yew et al. [53]. Hence, the annealing temperature (500 °C) was sufficient to crystallize the amorphous TiO2 to a stable anatase phase, which corroborated Chakraborty et al. [54]. Due to their trace amounts, the 5 nm Al2O3 layers synthesized by thermal or plasma ALD on IO were not enough to yield the XRD signal in the analysis, especially as the as-grown Al2O3 were expected to be amorphous. The crystal structure of the IO has not been altered by the thin Al2O3 layer grown by thermal ALD. In contrast to the thermal ALD, after the plasma reaction, peaks at 25.6°, 38.2°, and 48.6° were observed only, which resulted in a decrease in the peak intensity and crystallinity of the double layer. In addition, the broad diffraction band with no peaks between 20° and 30° is a typical soda lime glass used as a substrate.
The results from Raman spectroscopy (Figure 4b) showed peaks at ~142, ~395, ~519, and ~637 cm−1, which corresponded to tetragonal anatase TiO2 IO. Scepanovic et al. [55] reported a similar trend of Raman shifts for TiO2 IO nanostructure. Similar to XRD, the thin layers of amorphous Al2O3 grown by thermal or plasma ALD were not detected. Nevertheless, the polymer templates were removed entirely with annealing from the structure, as no D and G peaks of the carbon were visible.

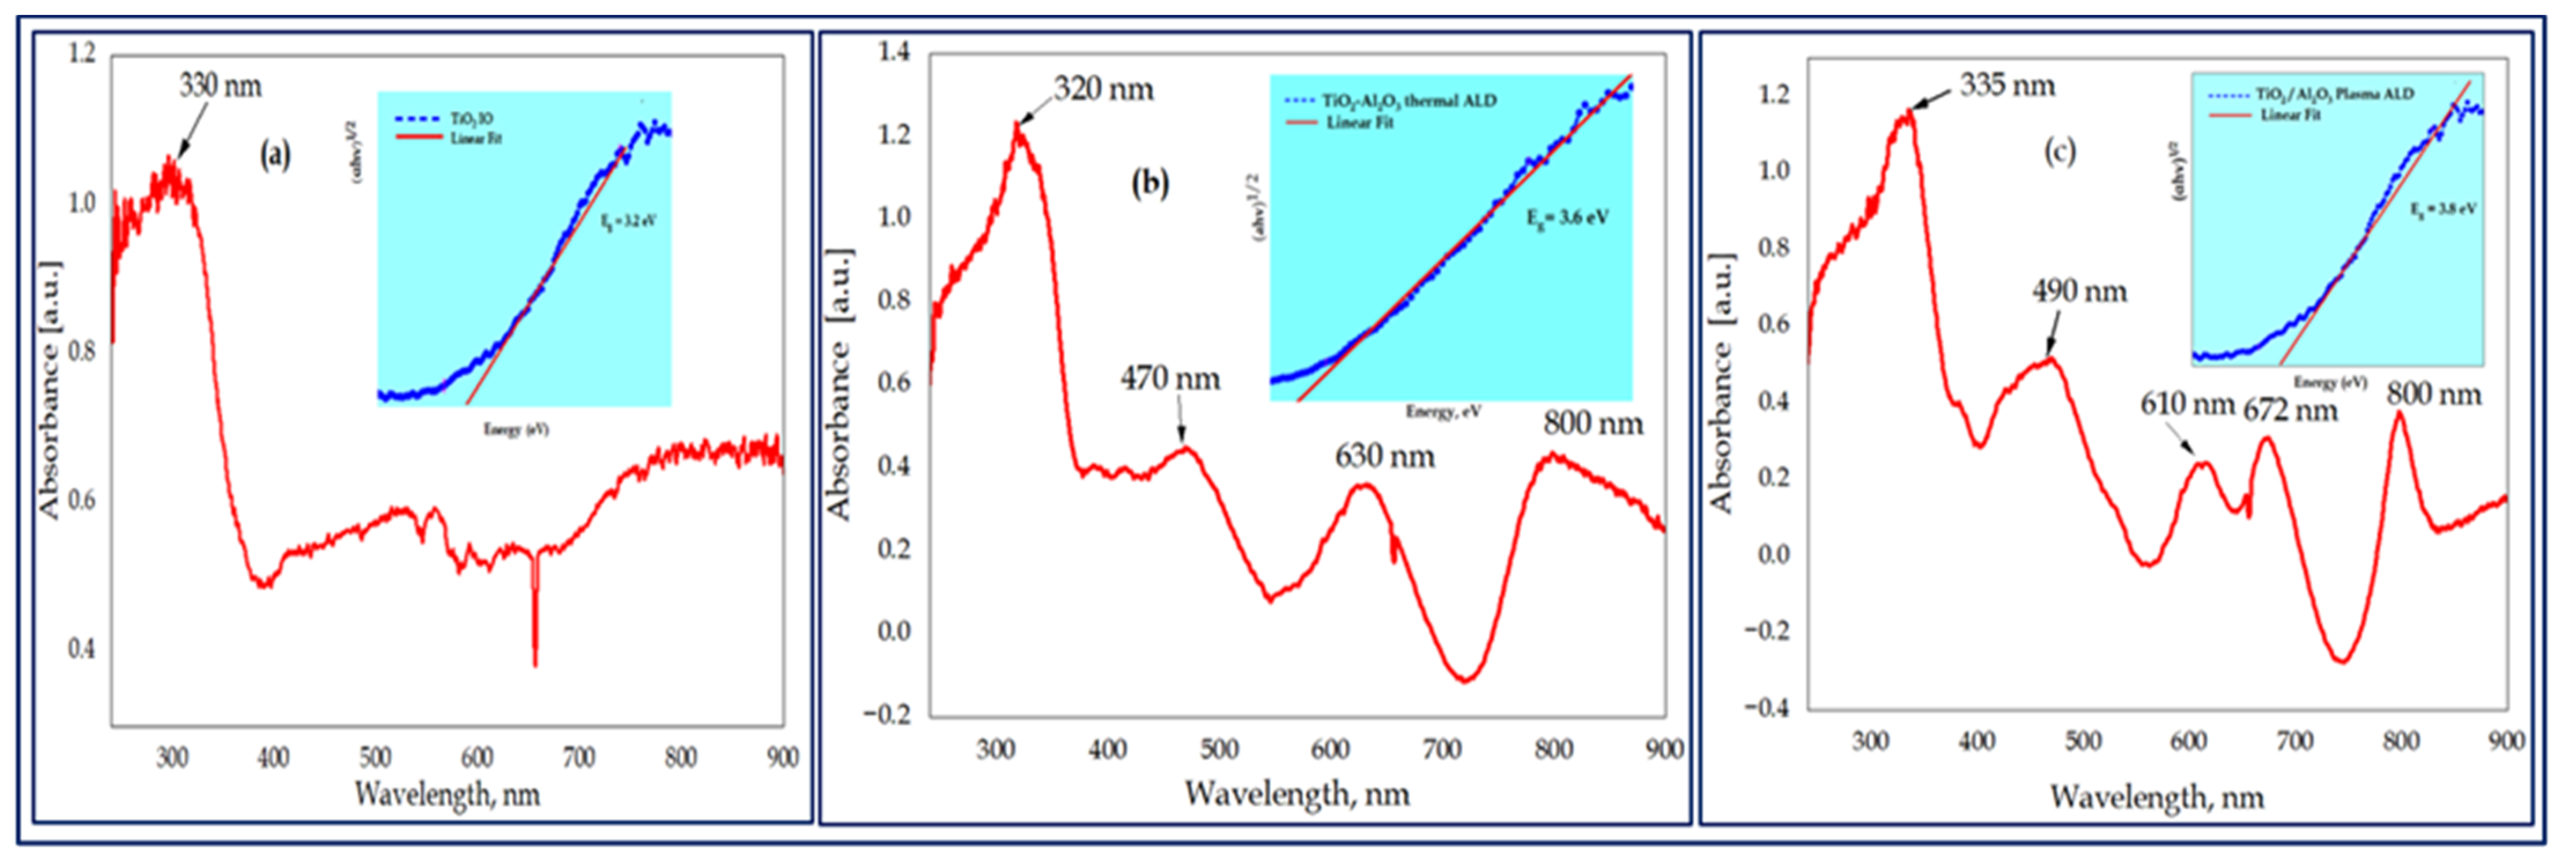
3.4. Optical Analysis

The pure TiO2 and its nanocomposite IO samples showed a sharply increased absorption intensity at shorter wavelengths with absorption edges of 330, 320, and 335 nm for TiO2, thermal, and plasma Al2O3 ALD-grown double-layer nanocomposites, respectively, as indicated in Figure 5a–c. Therefore, these strong edges of absorption amplified the extent of the light absorption due to the slow photon effects, i.e., light propagation at reduced group velocity, [56,57], evaluation through electronic transitions, and generating electron–hole pairs necessary for photocatalytic processes. The composite samples exhibited absorption edges in the visible region corresponding to 470, 630, and 800 nm of the thermal and 490, 610, 672, and 800 nm, of the plasma ALD samples, respectively. These sinusoidal absorption patterns in the vis region were comparable to the layer thickness and also the presence of Al2O3 ALD ultra-thin films in combination with an energy band gap (3.6 eV and 3.8 eV).
The basic absorption energy, which corresponds to the electron excitation from the valence band to the conduction band, was used to calculate the energy band gap (Eg) value of the thin films. The Tauc model was used for the absorption spectrum fitting approach to estimate the Eg of the sample [58].
(αhν)1/n = A (hν − Eg)
where α is the absorption coefficient, Eg is the energy band gap, hν is the photon energy, and A is the constant exponent analogous to the type of transition that occurs in the material where n = ½, and when it equals 2 it is corresponding to the allowed indirect and direct transition states.
In this study, the Tauc plot was calculated by n = ½ for the indirect band gap. This was achieved by plotting the graph between (ahv)1/n on the Y-axis and photon energy (Eg) on the X-axis and extrapolating the linear portion of the graph onto the X-axis of the linear region of the plot to (αhν)1/n = 0.
The evaluated indirect optical band gap values of the TiO2, TiO2/Al2O3 thermal, and TiO2/Al2O3 plasma ALD IO samples were found to be 3.2, 3.6, and 3.8 eV, respectively. In fact, the bulk Al2O3 materials have a higher band gap value, 8.7 eV [59], and thus the composite TiO2/Al2O3 was shifted the band gap to a reduced value. Due to the highly amorphous and less-ordered structure of the plasma ALD-grown Al2O3, the determined band gap value was lower than those reported for the plasma ALD Al2O3 layer thickness of 8 nm (4.3 eV) and 38 nm (4.75 eV) [39]. Hence, these results are in agreement with the literature for ultra-thin-film Al2O3, as reported by Shi et.al. [60] and Costina [61].

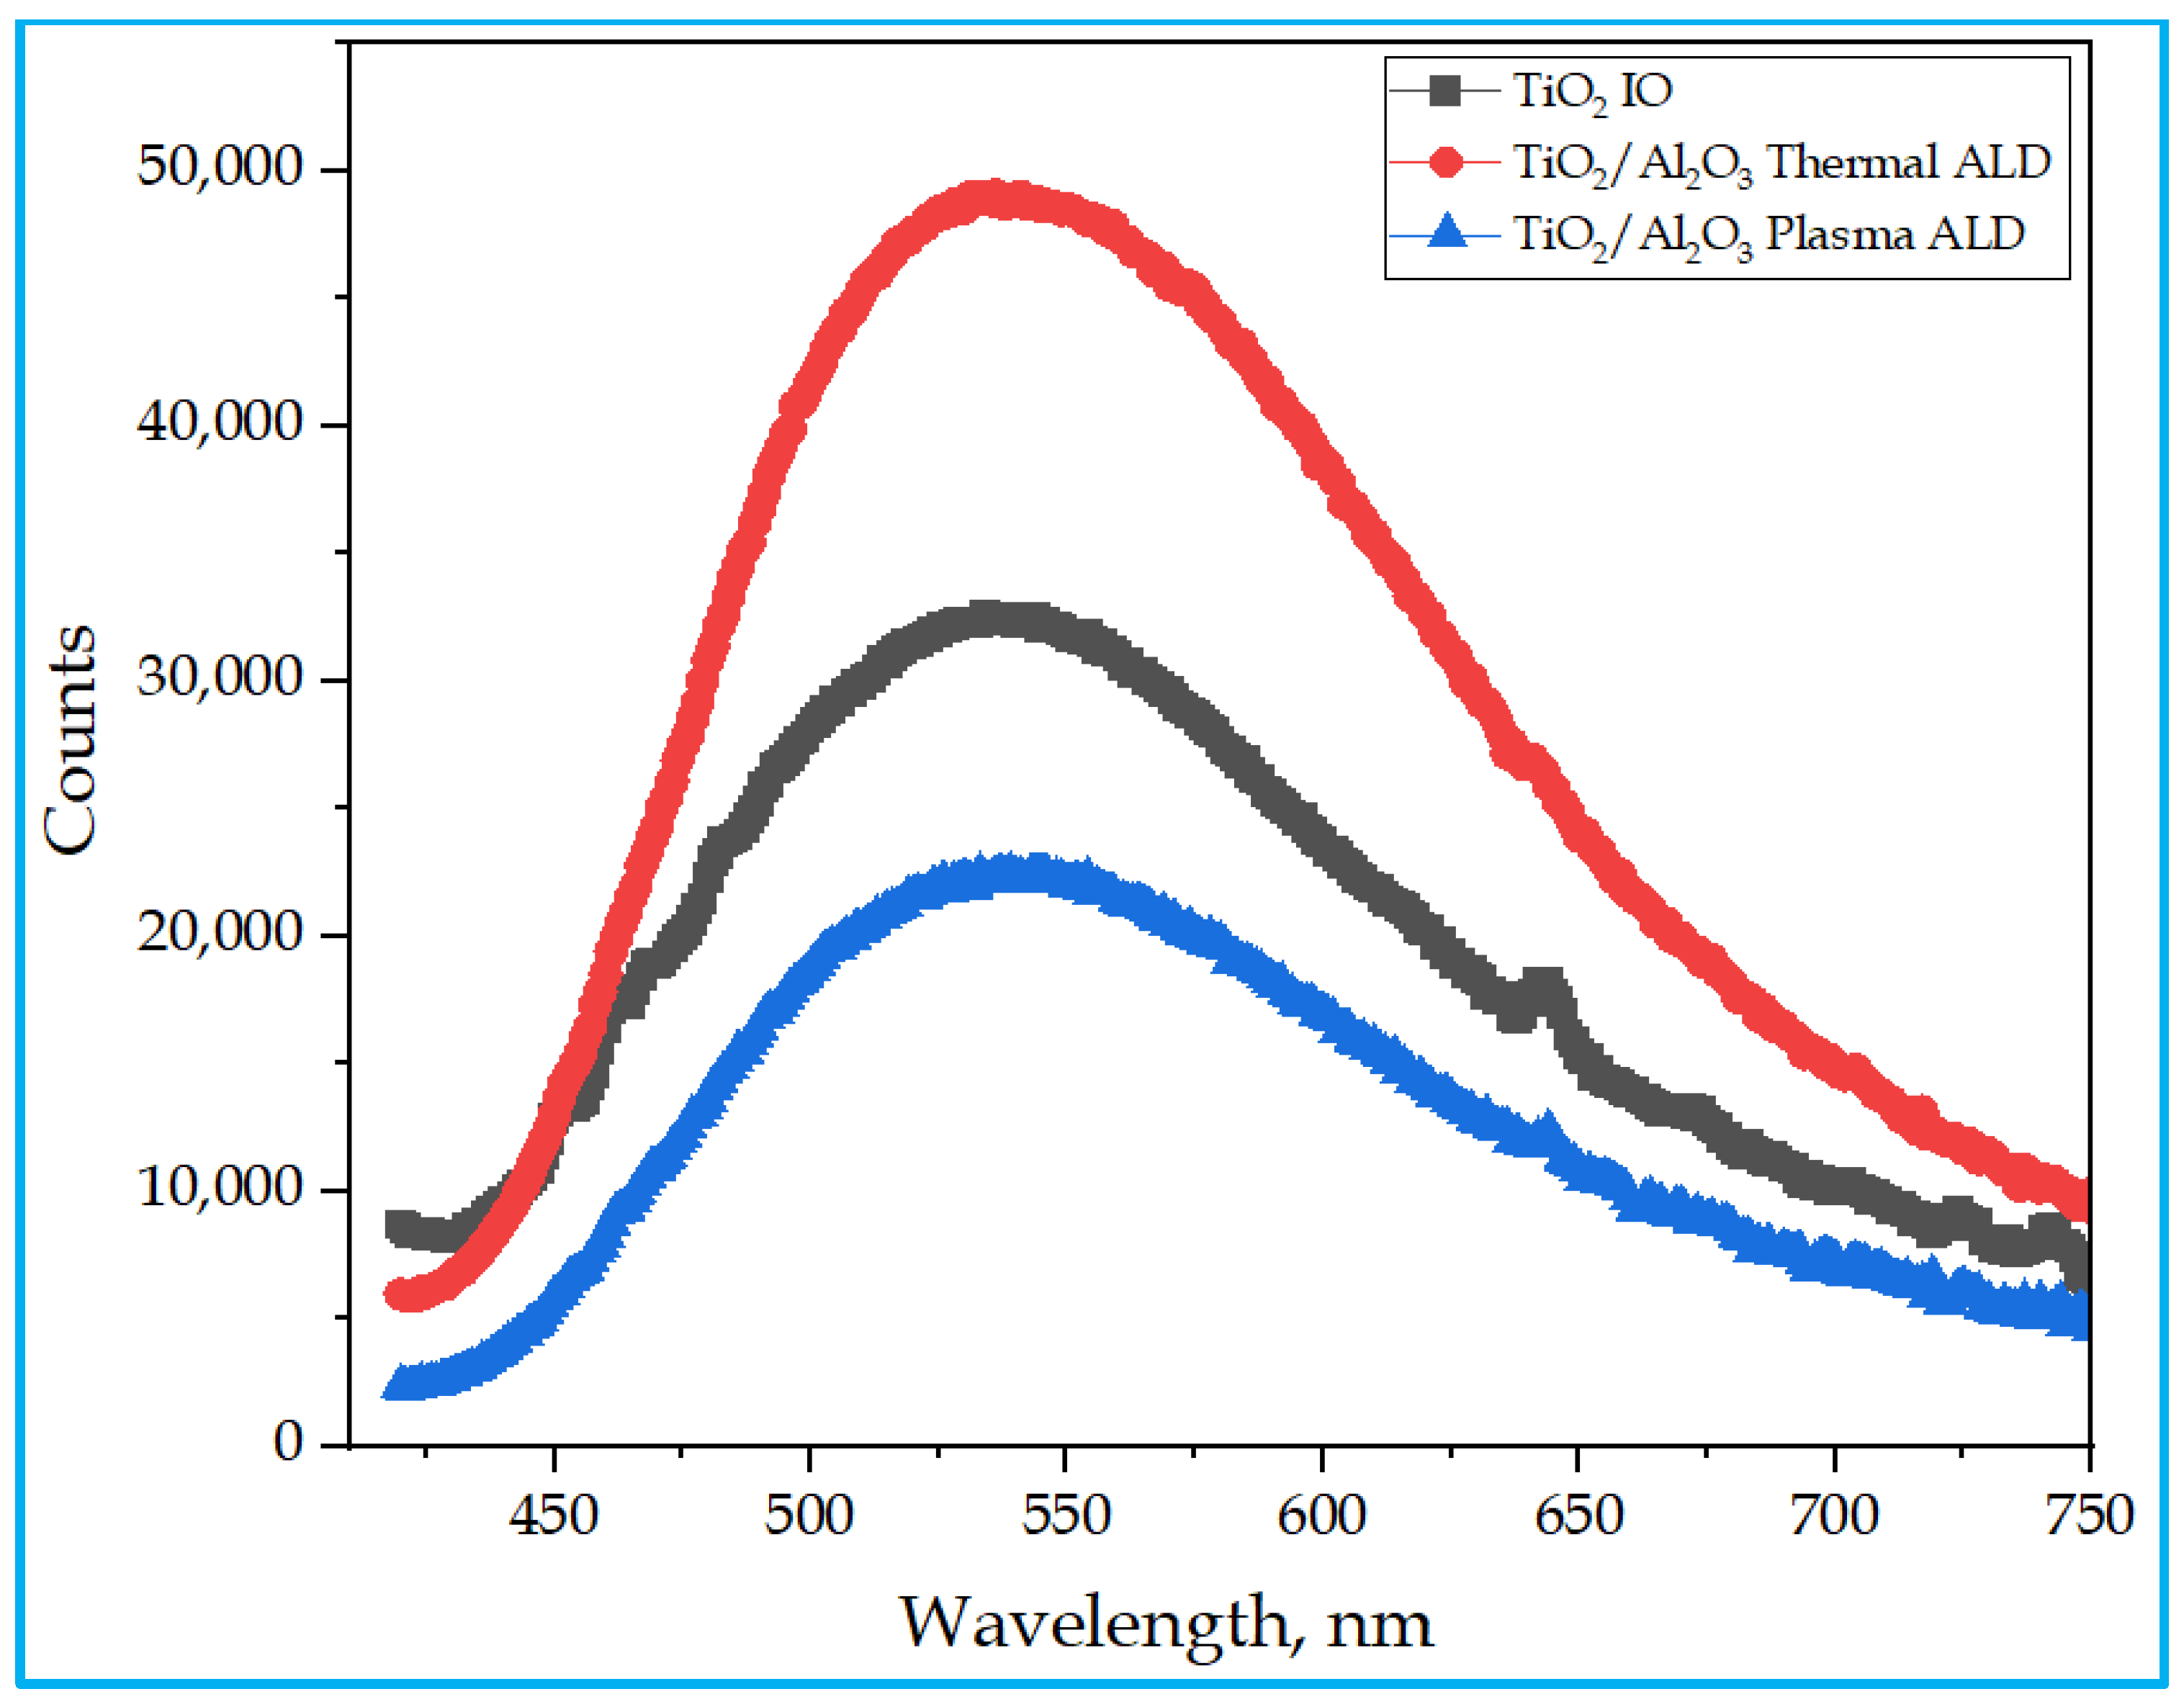
3.5. Photoluminescence (PL) Studies

Figure 6 shows the PL spectra of the three photocatalyst samples, obtained at room temperature, using an excitation wavelength of 380 nm. With an initial threshold wavelength of 420 nm and a cut-off wavelength of 800 nm, the shapes of the three curves are similar. Their broad peaks are located at close positions between ~515 nm (3.86 eV) and ~540 nm (3.68 eV). The wavelengths of the PL bands of our samples are close to the wavelength of the ‘green band’ observed around 515 nm in the PL spectra of anatase TiO2 films grown by ALD at different temperatures, where a ‘red band’ also appeared around 600 nm [62]. (The ‘green band’ was correlated with the surface oxygen vacancies on anatase TiO2 films; the ‘red band’ was related to defects of under-coordinated Ti3+ ions.) The relative intensities of the PL bands of our samples seem to correlate with the degree of their crystallinity. The TiO2/Al2O3 thermal film shows the most intense PL, which exhibits the strongest (101) anatase peak in the XRD pattern. The TiO2/Al2O3 plasma film produces the weakest luminescence of the three samples and this sample has only a weak (101) anatase peak in its powder diffractogram. In brief, the higher crystallinity shown by the XRD pattern is accompanied by the lower concentration of the non-radiative recombination centers, which is indicated by the more intense PL.

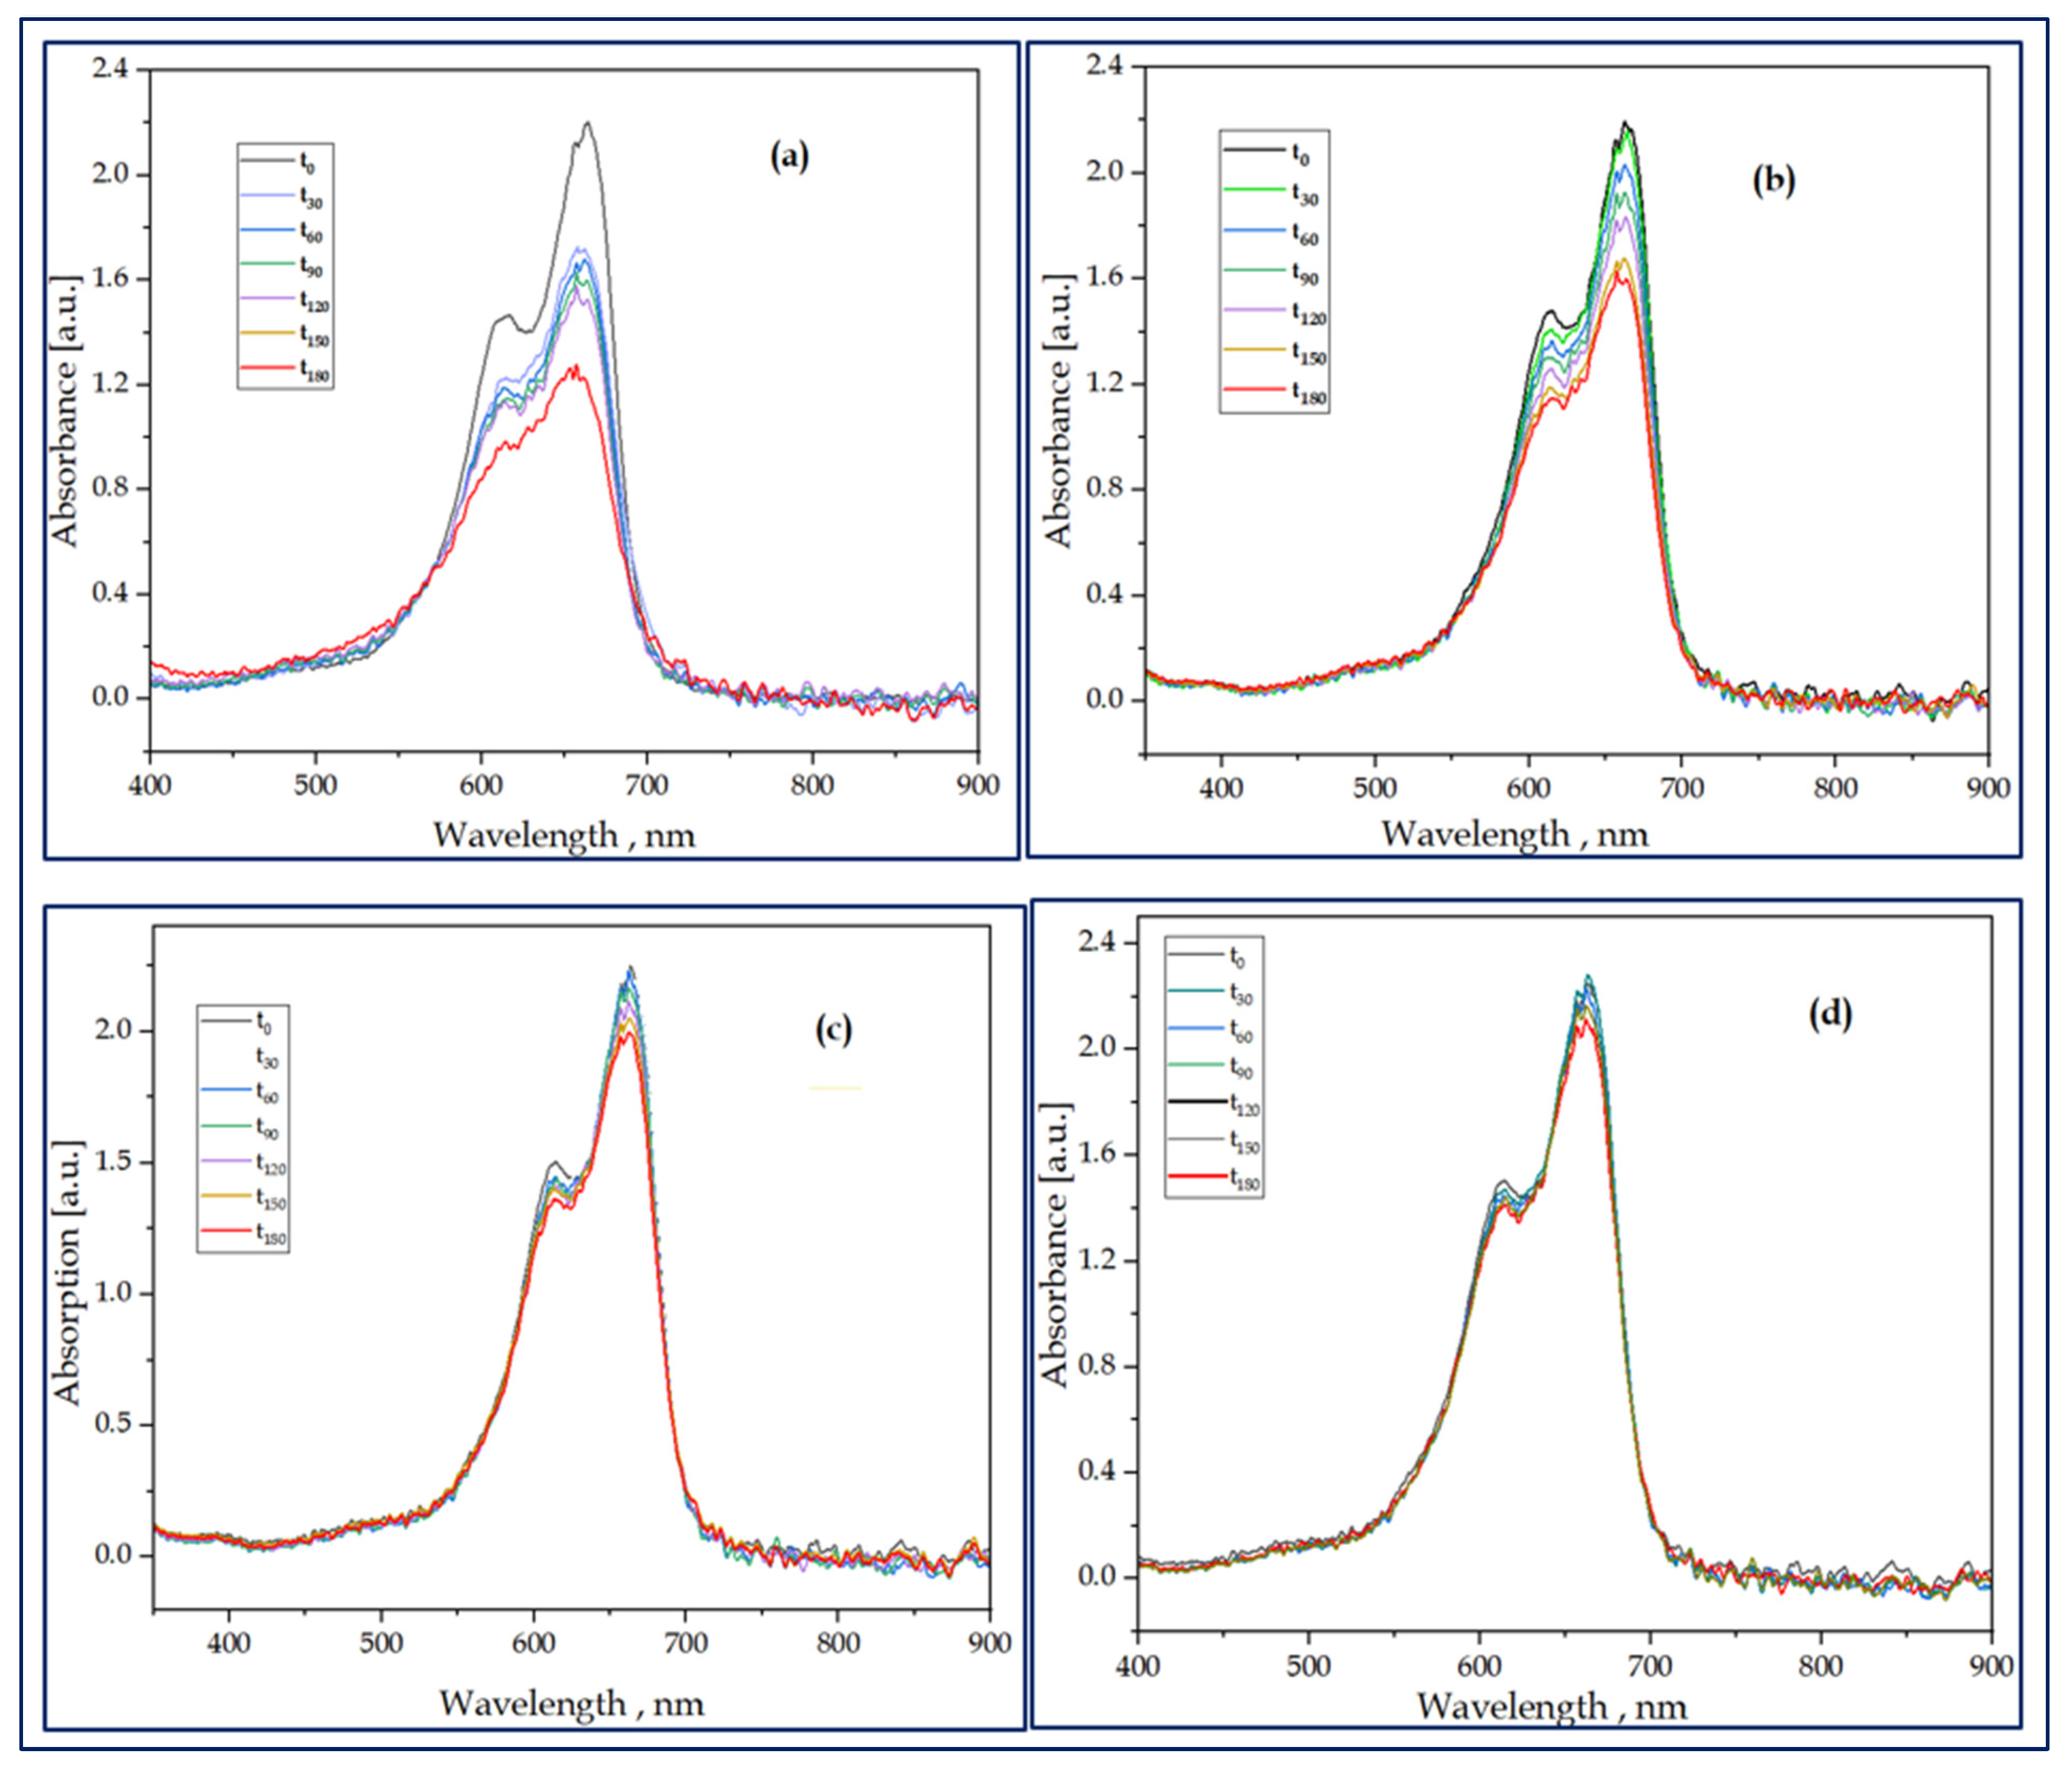
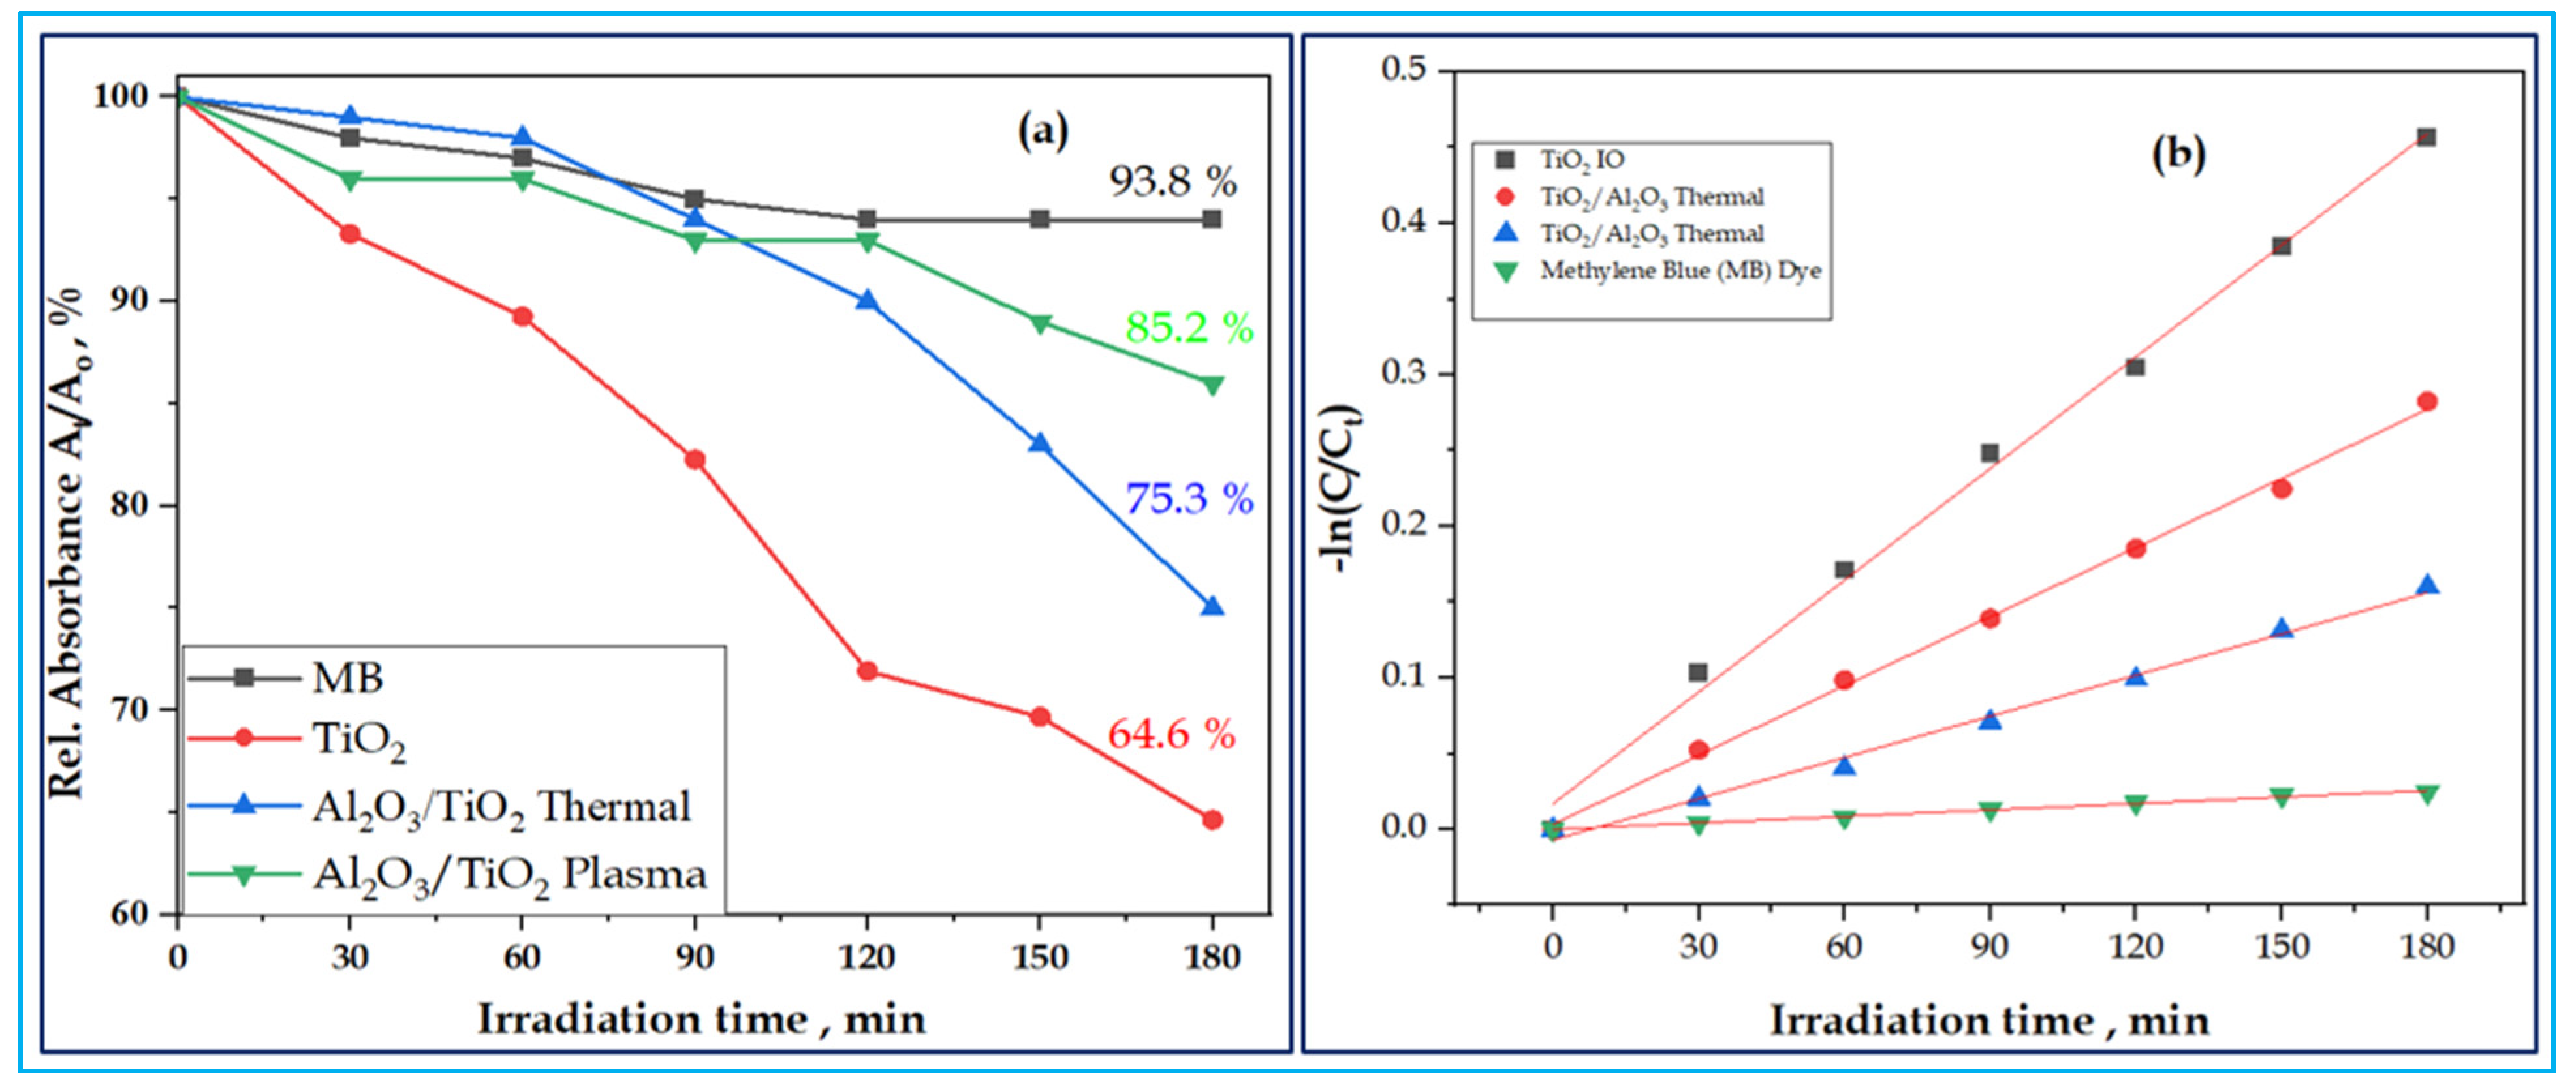
3.6. Photocatalytic Studies

The results of the photocatalytic activity of the samples are shown in Figure 7 and Figure 8. These figures further show the decolorization of MB dye in the solution of TiO2 IO and Al2O3/TiO2 thermal and plasma ALD under UV and visible light irradiation as a function of time (Figureand the decolorization of the MB in the solution, pseudo-defined by Equation (2),
Degradation (%) = (At/A0) × 100%
where At = the absorbance of the sample solution at time t, and A0 = the initial concentration. Based on the Beer–Lambert law, the At/A0 ratio was taken equal to the absorbance ratio At/A0 with At and A0 being the absorbance at the 665 nm band maximum of MB (after subtracting the background) at time t and at t = 0, respectively.
The rate of the decolorization of the MB in the sample solution and the rate constant were evaluated by using a pseudo-first-order equation, Equation (3)
ln [C0/Ct] = Kt
where C0 is the initial concentration of MB, Ct is the concentration after irradiation time t, and K is the rate constant.
The results of the present study were almost in agreement with the linear equation, and it was discovered that the photolysis reactions of the MB in the samples obeyed a pseudo-first-order kinetic model shown in the literature [63,64]. The linear plots of ln (C0/Ct) versus irradiation time, t, are shown in Figure 8b. The rate constant k values were calculated from the slopes of the lines and the coefficient of linear regression, R was calculated and summarized in the inset of Table 3. The summary makes it evident that the rate constant of the bare TiO2 has the largest k value, while both the combined thermal and plasma ultra-thin-film ALD Al2O3 layers exhibited decreased k values.
The measurement showed that all samples were effective in the decolorization of MB under visible light illumination, as shown in Figure 8a. The TiO2 IO achieved faster decolorization with a rate of 35.4% of MB in 3 h, while the composites, thermal and plasma Al2O3, had MB decolorization rates of 24.7% and 14.8% under visible light irradiation, respectively. The thermal ALD-grown ultra-thin-film Al2O3 layer showed an enhanced photocatalysis compared to the plasma-grown Al2O3 counterpart. The fact that the thermal ALD has a more ordered structure and narrow band gap energy boosted optical absorption in the UV and visible region and promoted the interaction. Therefore, the photocatalytic reaction would make considerably better use of the incident light and photogenerated electrons and holes, increasing the quantum efficiency. The suppressed photocatalytic activity of the combined ultra-thin-film Al2O3 layers as compared to the bare IO might be associated with the decreased electron tunnelling effect that resulted from the thickness of the Al2O3 layers [65].

4. Conclusions

The single TiO2, TiO2/Al2O3 thermal, and TiO2/Al2O3 plasma-assisted ALD-grown double-layered IO composites were successfully synthesized in the presence of a 600 nm PS opal template and microscope glass substrate. Thermal analysis maintained the adequate annealing temperature, 500 °C, which was appropriate to remove the opal completely. A well-ordered periodic microporous opal and IO structures display an FCC orientation, which is exactly planar to the surfaces of the template. A significant amount of TiO2 and Al2O3 were obtained in the EDX analysis due to the adequate amounts of Ti, O, and Al in the samples. The XRD and Raman analysis of the samples showed a tetragonal anatase crystal arrangement. This could be due to the inadequacy of Al2O3, which is 5 nm in amount and could be too small for XRD or Raman, even though the crystalline peaks associated with the double layers of Al2O3 were not found. The PL studies confirmed broad peaks for all samples at ~520 (2.38 eV) nm corresponding to green emissions and at 643 (3.09 eV) nm corresponding to red emissions for TiO2/Al2O3 thermal ALD. Therefore, the double layers have shown an interfacial charge interaction of photoexcited electron–hole pairs to restrict recombination between the layers. The UV Vis results showed a strong absorption band edge in the UV and visible regions due to the narrow energy band gaps of 3.2 eV, 3.6 eV, and 3.8 eV for TiO2, TiO2/Al2O3 thermal, and TiO2/Al2O3 plasma-assisted ALD-grown IO samples, respectively. It can be inferred that the lower bang gap energy and more ordered structure of thermal ALD-grown Al2O3 exhibited enhanced photocatalytic activity compared to the plasma-assisted ultra-thin-film Al2O3 composite sample.

Author Contributions

Conceptualization, H.H.L., F.S.A., D.A.K., B.P., Z.E. and I.M.S.; methodology, H.H.L., F.S.A., D.A.K., T.I., B.P., Z.E., D.H. and I.M.S.; formal analysis, H.H.L. and F.S.A.; investigation, H.H.L., F.S.A., D.A.K., B.P., Z.E., D.H. and I.M.S.; resources, Z.E. and I.M.S.; writing—original draft preparation, H.H.L.; writing—review and editing, H.H.L. and I.M.S.; supervision, Z.E. and I.M.S.; funding acquisition Z.E. and I.M.S. All authors have read and agreed to the published version of the manuscript.

Funding

This research received no external funding.

Data Availability Statement

Not applicable.

Acknowledgments

The research reported in this paper and carried out at BME has been supported by the NRDI Fund TKP2021 BME-NVA based on the charter of bolster issued by the NRDI Office under the auspices of the Ministry for Innovation and Technology. Moreover, the project no. TKP2021-NKTA-34 has also been implemented with the support provided by the National Research, Development, and Innovation Fund of Hungary, financed under the TKP2021-NKTA funding scheme and we thank Stipendium Hungaricum for sponsoring study in Budapest University of Technology and Economics.

Conflicts of Interest

The authors declare no conflict of interest.

References

  1. Bilal, M.; Rasheed, T.; Mehmood, S.; Tang, H.; Ferreira, L.F.R.; Bharagava, R.N.; Iqbal, H.M.N. Mitigation of Environmentally-Related Hazardous Pollutants from Water Matrices Using Nanostructured Materials—A Review. Chemosphere 2020, 253, 126770. [Google Scholar] [CrossRef] [PubMed]
  2. Pal, A.; Gin, K.Y.H.; Lin, A.Y.C.; Reinhard, M. Impacts of Emerging Organic Contaminants on Freshwater Resources: Review of Recent Occurrences, Sources, Fate and Effects. Sci. Total Environ. 2010, 408, 6062–6069. [Google Scholar] [CrossRef]
  3. Theerthagiri, J.; Lee, S.J.; Karuppasamy, K.; Arulmani, S.; Veeralakshmi, S.; Ashokkumar, M.; Choi, M.Y. Application of Advanced Materials in Sonophotocatalytic Processes for the Remediation of Environmental Pollutants. J. Hazard. Mater. 2021, 412, 125245. [Google Scholar] [CrossRef] [PubMed]
  4. Tijani, J.O.; Fatoba, O.O.; Babajide, O.O.; Petrik, L.F. Pharmaceuticals, Endocrine Disruptors, Personal Care Products, Nanomaterials and Perfluorinated Pollutants: A Review. Environ. Chem. Lett. 2016, 14, 27–49. [Google Scholar] [CrossRef]
  5. Gao, J.; Tian, W.; Zhang, H.; Wang, S. Engineered Inverse Opal Structured Semiconductors for Solar Light-Driven Environmental Catalysis. Nanoscale 2022, 14, 14341–14367. [Google Scholar] [CrossRef] [PubMed]
  6. Pham, K.; Temerov, F.; Saarinen, J.J. Multicompound Inverse Opal Structures with Gold Nanoparticles for Visible Light Photocatalytic Activity. Mater. Des. 2020, 194, 108886. [Google Scholar] [CrossRef]
  7. Costa, J.C.S.; Taveira, R.J.S.; Lima, C.F.R.A.C.; Mendes, A.; Santos, L.M.N.B.F. Optical Band Gaps of Organic Semiconductor Materials. Opt. Mater. 2016, 58, 51–60. [Google Scholar] [CrossRef]
  8. Xu, X. Photon Localization in Amorphous Photonic Crystal. Appl. Phys. B Lasers Opt. 2007, 86, 467–471. [Google Scholar] [CrossRef]
  9. Liu, T.; Li, X.; Yuan, X.; Wang, Y.; Li, F. Enhanced Visible-Light Photocatalytic Activity of a TiO2 Hydrosol Assisted by H2O2: Surface Complexation and Kinetic Modeling. J. Mol. Catal. A Chem. 2016, 414, 122–129. [Google Scholar] [CrossRef]
  10. Notomi, M. Negative Refractive Optics in Photonic Crystals. Phys. Simul. Optoelectron. Devices IX 2001, 4283, 428. [Google Scholar] [CrossRef]
  11. Baba, T. Slow Light in Photonic Crystals. Nat. Photonics 2008, 2, 465–473. [Google Scholar] [CrossRef]
  12. Yu, J.; Lei, J.; Wang, L.; Zhang, J.; Liu, Y. TiO2 Inverse Opal Photonic Crystals: Synthesis, Modification, and Applications—A Review. J. Alloys Compd. 2018, 769, 740–757. [Google Scholar] [CrossRef]
  13. Kosaka, H.; Kawashima, T. Superprism Phenomena in Photonic Crystals. Phys. Rev. B Condens. Matter Mater. Phys. 1998, 58, R10096–R10099. [Google Scholar] [CrossRef]
  14. Meng, S.; Li, D.; Zheng, X.; Wang, J.; Chen, J.; Fang, J.; Shao, Y.; Fu, X. ZnO Photonic Crystals with Enhanced Photocatalytic Activity and Photostability. J. Mater. Chem. A 2013, 1, 2744–2747. [Google Scholar] [CrossRef]
  15. Zhang, X.; John, S. Enhanced Photocatalysis by Light-Trapping Optimization in Inverse Opals. J. Mater. Chem. A 2020, 8, 18974–18986. [Google Scholar] [CrossRef]
  16. Ji, H.; Zeng, W.; Li, Y. Gas Sensing Mechanisms of Metal Oxide Semiconductors: A Focus Review. Nanoscale 2019, 11, 22664–22684. [Google Scholar] [CrossRef] [PubMed]
  17. Patil, B.H.; Jang, K.; Lee, S.; Kim, J.H.; Yoon, C.S.; Kim, J.; Kim, D.H.; Ahn, H. Periodically Ordered Inverse Opal TiO2/Polyaniline Core/Shell Design for Electrochemical Energy Storage Applications. J. Alloys Compd. 2017, 694, 111–118. [Google Scholar] [CrossRef]
  18. Armstrong, E.; O’Dwyer, C. Artificial Opal Photonic Crystals and Inverse Opal Structures-Fundamentals and Applications from Optics to Energy Storage. J. Mater. Chem. C 2015, 3, 6109–6143. [Google Scholar] [CrossRef] [Green Version]
  19. Justin Kunene, T.; Kwanda Tartibu, L.; Ukoba, K.; Jen, T.C. Review of Atomic Layer Deposition Process, Application and Modeling Tools. Mater. Today Proc. 2022, 62, S95–S109. [Google Scholar] [CrossRef]
  20. Fathi, F.; Monirinasab, H.; Ranjbary, F.; Nejati-Koshki, K. Inverse Opal Photonic Crystals: Recent Advances in Fabrication Methods and Biological Applications. J. Drug Deliv. Sci. Technol. 2022, 72, 103377. [Google Scholar] [CrossRef]
  21. Marschall, R. Semiconductor Composites: Strategies for Enhancing Charge Carrier Separation to Improve Photocatalytic Activity. Adv. Funct. Mater. 2014, 24, 2421–2440. [Google Scholar] [CrossRef]
  22. Katwal, R.; Kothari, R.; Pathania, D. An Overview on Degradation Kinetics of Organic Dyes by Photocatalysis Using Nanostructured Electrocatalyst; Elsevier Inc.: Amsterdam, The Netherlands, 2020; pp. 195–213. ISBN 9780128218419. [Google Scholar] [CrossRef]
  23. Von Freymann, G.; Kitaev, V.; Lotsch, B.V.; Ozin, G.A. Bottom-up Assembly of Photonic Crystals. Chem. Soc. Rev. 2013, 42, 2528–2554. [Google Scholar] [CrossRef] [PubMed] [Green Version]
  24. Fang, J.; Xuan, Y.; Li, Q. Preparation of Polystyrene Spheres in Different Particle Sizes and Assembly of the PS Colloidal Crystals. Sci. China Technol. Sci. 2010, 53, 3088–3093. [Google Scholar] [CrossRef]
  25. Subban, C.V.; Smith, I.C.; Disalvo, F.J. Interconversion of Inverse Opals of Electrically Conducting Doped Titanium Oxides and Nitrides. Small 2012, 8, 2824–2832. [Google Scholar] [CrossRef] [PubMed]
  26. George, S.M. Atomic Layer Deposition: An Overview. Chem. Rev. 2010, 110, 111–131. [Google Scholar] [CrossRef]
  27. Cai, J.; Sun, Q.; Meng, X. Novel Nanostructured Materials by Atomic and Molecular Layer Deposition. AIMS Mater. Sci. 2018, 5, 957–999. [Google Scholar] [CrossRef]
  28. Eswar, N.K.R.; Singh, S.A.; Heo, J. Atomic Layer Deposited Photocatalysts: Comprehensive Review on Viable Fabrication Routes and Reactor Design Approaches for Photo-Mediated Redox Reactions. J. Mater. Chem. A 2019, 7, 17703–17734. [Google Scholar] [CrossRef]
  29. Inui, C.; Tsuge, Y.; Kura, H.; Fujihara, S.; Shiratori, S.; Sato, T. Preparation of One-Dimensional Photonic Crystals by Sol-Gel Process for Magneto-Optical Materials. Thin Solid Films 2008, 516, 2454–2459. [Google Scholar] [CrossRef]
  30. Galusha, J.W.; Tsung, C.K.; Stucky, G.D.; Bartl, M.H. Optimizing Sol-Gel Infiltration and Processing Methods for the Fabrication of High-Quality Planar Titania Inverse Opals. Chem. Mater. 2008, 20, 4925–4930. [Google Scholar] [CrossRef]
  31. Djurisic, A.B.; Chen, X.Y.; Leung, Y.H. Recent Progress in Hydrothermal Synthesis of Zinc Oxide Nanomaterials. Recent Pat. Nanotechnol. 2012, 6, 124–134. [Google Scholar] [CrossRef]
  32. Zheng, Y.; Zhao, H.; Cai, Y.; Jurado-Sánchez, B.; Dong, R. Recent Advances in One-Dimensional Micro/Nanomotors: Fabrication, Propulsion and Application. Nano-Micro Lett. 2023, 15, 20. [Google Scholar] [CrossRef] [PubMed]
  33. Knoops, H.C.M.; Potts, S.E.; Bol, A.A.; Kessels, W.M.M. Atomic Layer Deposition, 2nd ed.; Elsevier B.V.: Amsterdam, The Netherlands, 2015; Volume 3, ISBN 9780444633057. [Google Scholar]
  34. Justh, N.; Bakos, L.P.; Hernádi, K.; Kiss, G.; Réti, B.; Erdélyi, Z.; Parditka, B.; Szilágyi, I.M. Photocatalytic Hollow TiO2 and ZnO Nanospheres Prepared by Atomic Layer Deposition. Sci. Rep. 2017, 7, 4337. [Google Scholar] [CrossRef] [PubMed] [Green Version]
  35. Pei, J.; Ma, W.; Li, R.; Li, Y.; Du, H. Preparation and Photocatalytic Properties of TiO2-Al2O3 Composite Loaded Catalysts. J. Chem. 2015, 2015, 806568. [Google Scholar] [CrossRef] [Green Version]
  36. Cao, Y.Q.; Zi, T.Q.; Zhao, X.R.; Liu, C.; Ren, Q.; Fang, J.-B.; Li, W.M.; Li, A.D. Enhanced Visible Light Photocatalytic Activity of Fe2O3 Modified TiO2 Prepared by Atomic Layer Deposition. Sci. Rep. 2020, 10, 13437. [Google Scholar] [CrossRef]
  37. Lee, S.Y.; Park, S.J. TiO2 Photocatalyst for Water Treatment Applications. J. Ind. Eng. Chem. 2013, 19, 1761–1769. [Google Scholar] [CrossRef]
  38. Bedia, J.; Muelas-Ramos, V.; Peñas-Garzón, M.; Gómez-Avilés, A.; Rodríguez, J.J.; Belver, C. A Review on the Synthesis and Characterization of Metal Organic Frameworks for Photocatalytic Water Purification. Catalysts 2019, 9, 52. [Google Scholar] [CrossRef] [Green Version]
  39. Khan, M.M.; Adil, S.F.; Al-mayouf, A.; Adil, S.F. Editorial Article Metal Oxides as Photocatalysts. J. Saudi Chem. Soc. 2015, 19, 462–464. [Google Scholar] [CrossRef] [Green Version]
  40. Halim, W.; Moumen, A.; Ouaskit, S.; Errien, N. Photocatalytic Properties of TiO2/ZnO Thin Film. Mol. Cryst. Liq. Cryst. 2016, 627, 49–55. [Google Scholar] [CrossRef]
  41. Barreca, D.; Carraro, G.; Warwick, M.E.A.; Kaunisto, K.; Gasparotto, A.; Gombac, V.; Sada, C.; Turner, S.; Van Tendeloo, G.; Maccato, C.; et al. Fe2O3-TiO2 Nanosystems by a Hybrid PE-CVD/ALD Approach: Controllable Synthesis, Growth Mechanism, and Photocatalytic Properties. CrystEngComm 2015, 17, 6219–6226. [Google Scholar] [CrossRef]
  42. Karunakaran, C.; Magesan, P.; Gomathisankar, P.; Vinayagamoorthy, P. Photocatalytic Degradation of Dyes by Al2O3-TiO2 and ZrO2-TiO2 Nanocomposites. Mater. Sci. Forum 2013, 734, 325–333. [Google Scholar] [CrossRef]
  43. Zhu, X.; Wen, G.; Liu, H.; Han, S.; Chen, S.; Kong, Q.; Feng, W. One-Step Hydrothermal Synthesis and Characterization of Cu-Doped TiO2 Nanoparticles/Nanobucks/Nanorods with Enhanced Photocatalytic Performance under Simulated Solar Light. J. Mater. Sci. Mater. Electron. 2019, 30, 13826–13834. [Google Scholar] [CrossRef]
  44. Lei, J.; Chen, B.; Lv, W.; Zhou, L.; Wang, L.; Liu, Y.; Zhang, J. An Inverse Opal TiO2/g-C3N4 Composite with a Heterojunction for Enhanced Visible Light-Driven Photocatalytic Activity. Dalt. Trans. 2019, 48, 3486–3495. [Google Scholar] [CrossRef] [PubMed]
  45. Yin, Z.; Zhang, X.; Yuan, X.; Wei, W.; Xiao, Y.; Cao, S. Constructing TiO2@Bi2O3 Multi-Heterojunction Hollow Structure for Enhanced Visible-Light Photocatalytic Performance. J. Clean. Prod. 2022, 375, 134112. [Google Scholar] [CrossRef]
  46. Liu, J.; Sun, C.; Fu, M.; Long, J.; He, D.; Wang, Y. Enhanced Photochemical Catalysis of TiO2 Inverse Opals by Modification with ZnO or Fe2O3 using ALD and the Hydrothermal Method. Mater. Res. Express 2018, 5, 025509. [Google Scholar] [CrossRef]
  47. Kinnunen, S.; Arstila, K.; Sajavaara, T. Al2O3 ALD Films Grown Using TMA + rare Isotope 2H216O and 1H218O Precursors. Appl. Surf. Sci. 2021, 546, 2–8. [Google Scholar] [CrossRef]
  48. Guo, J.; van Bui, H.; Valdesueiro, D.; Yuan, S.; Liang, B.; van Ommen, J.R. Suppressing the Photocatalytic Activity of TiO2 Nanoparticles by Extremely Thin Al2O3 Films Grown by Gas-Phase Deposition at Ambient Conditions. Nanomaterials 2018, 8, 61. [Google Scholar] [CrossRef] [PubMed] [Green Version]
  49. Jang, E.; Sridharan, K.; Park, Y.M.; Park, T.J. Eliminated Phototoxicity of TiO2 Particles by an Atomic-Layer-Deposited Al2O3 Coating Layer for UV-Protection Applications. Chem. Eur. J. 2016, 22, 12022–12026. [Google Scholar] [CrossRef]
  50. Shenouda, S.S.; Hussien, M.S.A.; Parditka, B.; Csík, A.; Takats, V.; Erdélyi, Z. Novel Amorphous Al-Rich Al2O3 Ultra-Thin Films as Active Photocatalysts for Water Treatment from Some Textile Dyes. Ceram. Int. 2020, 46, 7922–7929. [Google Scholar] [CrossRef]
  51. Worzakowska, M. Thermal and Mechanical Properties of Polystyrene Modified with Esters Derivatives of 3-Phenylprop-2-En-1-Ol. J. Therm. Anal. Calorim. 2015, 121, 235–243. [Google Scholar] [CrossRef] [Green Version]
  52. Manikandan Nair, K.C.; Thomas, S.; Groeninckx, G. Thermal and Dynamic Mechanical Analysis of Polystyrene Composites Reinforced with Short Sisal Fibres. Compos. Sci. Technol. 2001, 61, 2519–2529. [Google Scholar] [CrossRef]
  53. Yew, R.; Karuturi, S.K.; Liu, J.; Tan, H.H.; Wu, Y.; Jagadish, C. Exploiting Defects in TiO2 Inverse Opal for Enhanced Photoelectrochemical Water Splitting. Opt. Express 2019, 27, 761. [Google Scholar] [CrossRef] [PubMed] [Green Version]
  54. Chakraborty, R.; Dey, A.; Mukhopadhyay, A.K. Loading Rate Effect on Nanohardness of Soda-Lime-Silica Glass. Metall. Mater. Trans. A Phys. Metall. Mater. Sci. 2010, 41, 1301–1312. [Google Scholar] [CrossRef]
  55. Šćepanović, M.J.; Grujič-Brojčin, M.U.; Dohčević-Mitrović, Z.D.; Popović, Z.V. Effects of Confinement, Strain and Nonstoichiometry on Raman Spectra of Anatase TiO2 Nanopowders. Mater. Sci. Forum 2006, 518, 101–106. [Google Scholar] [CrossRef]
  56. Ginter, J.; Piwoński, I. Evaluation of the Synergistic Effect between Slow Photons and Electron Trapping on the Photocatalytic Properties of TiO2 Photonic Crystals. Mater. Res. Bull. 2018, 107, 100–110. [Google Scholar] [CrossRef]
  57. Likodimos, V. Photonic Crystal-Assisted Visible Light Activated TiO2 Photocatalysis. Appl. Catal. B Environ. 2018, 230, 269–303. [Google Scholar] [CrossRef]
  58. Greenwood, D.A. Amorphous and Liquid Semiconductors. Opt. Acta Int. J. Opt. 1973, 17, 952. [Google Scholar] [CrossRef]
  59. Hu, B.; Yao, M.; Xiao, R.; Chen, J.; Yao, X. Optical Properties of Amorphous Al2O3 Thin Films Prepared by a Sol-Gel Process. Ceram. Int. 2014, 40, 14133–14139. [Google Scholar] [CrossRef]
  60. Shi, S.; Qian, S.; Hou, X.; Mu, J.; He, J.; Chou, X. Structural and Optical Properties of Amorphous Al2O3 Thin Film Deposited by Atomic Layer Deposition. Adv. Condens. Matter Phys. 2018, 2018, 7598978. [Google Scholar] [CrossRef] [Green Version]
  61. Costina, I.; Franchy, R. Band Gap of Amorphous and Well-Ordered Al2O3 on Ni3Al(100). Appl. Phys. Lett. 2001, 78, 4139–4141. [Google Scholar] [CrossRef] [Green Version]
  62. Jin, C.; Liu, B.; Lei, Z.; Sun, J. Structure and Photoluminescence of the TiO2 Films Grown by Atomic Layer Deposition Using Tetrakis-Dimethylamino Titanium and Ozone. Nanoscale Res. Lett. 2015, 10, 95. [Google Scholar] [CrossRef] [Green Version]
  63. Selvam, N.C.S.; Narayanan, S.; Kennedy, L.J.; Vijaya, J.J. Pure and Mg-Doped Self-Assembled ZnO Nano-Particles for the Enhanced Photocatalytic Degradation of 4-Chlorophenol. J. Environ. Sci. 2013, 25, 2157–2167. [Google Scholar] [CrossRef] [PubMed]
  64. Konstantinou, I.K.; Albanis, T.A. TiO2-Assisted Photocatalytic Degradation of Azo Dyes in Aqueous Solution: Kinetic and Mechanistic Investigations: A Review. Appl. Catal. B Environ. 2004, 49, 1–14. [Google Scholar] [CrossRef]
  65. Zhang, P.; Tachikawa, T.; Fujitsuka, M.; Majima, T. Atomic Layer Deposition-Confined Nonstoichiometric TiO2 Nanocrystals with Tunneling Effects for Solar Driven Hydrogen Evolution. J. Phys. Chem. Lett. 2016, 7, 1173–1179. [Google Scholar] [CrossRef] [PubMed]
Figure 1. Experimental route for synthesis of the TiO2 IO and Al2O3/TiO2 composites by ALD and vertical layer deposition.
Nanomaterials 13 01314 g001
Figure 2. Illustrates the thermal analysis curve for PS opal template in air.
Nanomaterials 13 01314 g002
Figure 3. SEM images of PS opal: (a,b); pure TiO2 IO: (c); Al2O3 thermal ALD on IO: (d); and Al2O3 plasma ALD on IO: (e).
Nanomaterials 13 01314 g003
Figure 4. (a) XRD; (b) Raman Spectroscopy.
Nanomaterials 13 01314 g004
Figure 5. A linear fit to the straight part of the hν vs (αhν)1/2 plot (Tauc plot) intercepts the energy axis at the optical band gap energy: the indirect energy band gap for TiO2 IO (a), Al2O3/TiO2 thermal ALD, and (b) Al2O3/TiO2 plasma ALD (c).
Nanomaterials 13 01314 g005
Figure 6. PL spectra of the samples.
Nanomaterials 13 01314 g006
Figure 7. Photocatalytic decolorization of the MB dye in the presence of TiO2 (a), TiO2/Al2O3 thermal ALD (b), TiO2/Al2O3 plasma ALD (c), and MB dye (d).
Nanomaterials 13 01314 g007
Figure 8. Photocatalytic performance—relative absorbance in % vs. irradiation time in minutes (a) and pseudo-first-order linear plots of ln (C0/Ct) vs. irradiation time for the kinetics of the sample materials (b).
Nanomaterials 13 01314 g008
Table 1. TiO2 and Al2O3 thermal and plasma-assisted ALD deposition condition.
SampleDeposited
Oxides
Temp. °CNo. of ALD CyclesPulse/Purge Time (s) for 1 CycleThickness (nm)Pressure (mbar)
(Chamber)(Reactor)
TiO2TiO252.96710.3 s TiCl4-3 s N2/0.3 s H2O-3 s N251.66.81.3
TiO2/Al2O3 ThermalAl2O352.970.15 s TMA-0.5 s N2/0.15 s H2O-0.5 s N256.81.4
TiO2/Al2O3 PlasmaAl2O352.990.15 s TMA-2 s N2/2 s O2-N2 Plasma/2 s N257.01.4
Table 2. EDX Compositional analysis of the samples.
Sample % w/w
Ti
% w/w
Al
% w/w
O
% w/w
C
% w/w
Si
% w/w
Ca
% w/w
Cl
% w/w
Na
TiO223.4-64.03.28.0--1.4
TiO2/Al2O3 Thermal18.12.664.33.87.91.40.31.6
TiO2/Al2O3 Plasma 19.02.565.62.87.81.40.31.6
Table 3. The rate constant, K, and linear regression square, R2 of the sample.
Sample R2Rate Constant, K (×10−2 min−1)
TiO20.99570.24
TiO2/Al2O3 Thermal 0.99810.16
TiO2/Al2O3 Plasma 0.99320.089
MB0.9940.014
Disclaimer/Publisher’s Note: The statements, opinions and data contained in all publications are solely those of the individual author(s) and contributor(s) and not of MDPI and/or the editor(s). MDPI and/or the editor(s) disclaim responsibility for any injury to people or property resulting from any ideas, methods, instructions or products referred to in the content.

