Article

Engineering of ZnO/rGO towards NO2 Gas Detection: Ratio Modulated Sensing Type and Heterojunction Determined Response

Zhejiang Province Key Laboratory of Magnetism, College of Materials Science and Engineering, China Jiliang University, Hangzhou 310018, China
*
Author to whom correspondence should be addressed.
Nanomaterials 2023, 13(5), 917; https://doi.org/10.3390/nano13050917
Submission received: 9 February 2023 / Revised: 26 February 2023 / Accepted: 27 February 2023 / Published: 1 March 2023

Abstract

:
Nanoscale heterostructured zinc oxide/reduced graphene oxide (ZnO/rGO) materials with p–n heterojunctions exhibit excellent low temperature NO2 gas sensing performance, but their doping ratio modulated sensing properties remain poorly understood. Herein, ZnO nanoparticles were loaded with 0.1~4% rGO by a facile hydrothermal method and evaluated as NO2 gas chemiresistor. We have the following key findings. First, ZnO/rGO manifests doping ratio-dependent sensing type switching. Increasing the rGO concentration changes the type of ZnO/rGO conductivity from n-type (<0.6% rGO) to mixed n/p -type (0.6~1.4% rGO) and finally to p-type (>1.4% rGO). Second, interestingly, different sensing regions exhibit different sensing characteristics. In the n-type NO2 gas sensing region, all the sensors exhibit the maximum gas response at the optimum working temperature. Among them, the sensor that shows the maximum gas response exhibits a minimum optimum working temperature. In the mixed n/p-type region, the material displays abnormal reversal from n- to p-type sensing transitions as a function of the doping ratio, NO2 concentration and working temperature. In the p-type gas sensing region, the response decreases with increasing rGO ratio and working temperature. Third, we derive a conduction path model that shows how the sensing type switches in ZnO/rGO. We also find that p–n heterojunction ratio (np–n/nrGO) plays a key role in the optimal response condition. The model is supported by UV-vis experimental data. The approach presented in this work can be extended to other p–n heterostructures and the insights will benefit the design of more efficient chemiresistive gas sensors.

1. Introduction

The emission of harmful gases (NOx) has a serious impact on the physical and mental health of humans. There is an urgent need for reliable methods to monitor toxic gases in the air in real time. Gas sensors have attracted a great deal of attention for applications in atmospheric monitoring, medical diagnostics, and the detection of volatile organic compounds (VOCs) [1,2,3]. Among the many gas sensors, the metal oxides semiconductor (MOS) sensors have been widely study due to its high response, low production costs and long-term stability [4].
Zinc oxide (ZnO) is an important n-type MOS material with a bandgap of 3.37 eV [5]. It is widely used in chemiresistive gas sensor [6,7] due to excellent chemical and physical properties such as high binding energy, high electron mobility, and non-toxicity to the environment [8,9,10,11,12]. It exhibits excellent gas-sensitive properties towards NO2 [13,14]. However, ZnO is often limited due to their high optimum working temperature (150 to 300 °C). Employing heterostructure is one of the effective ways to decrease the working temperature and enhance the sensor response. To satisfy the requirements of low working temperature with enhanced response [15], reduced graphene oxide (rGO) is often doped on ZnO to form rGO/ZnO heterostructure with p–n heterojunction. Besides its high surface area, electron mobility, chemical stability, and conductivity [16,17,18,19,20,21,22,23], rGO holds many defect sites [24,25] providing more adsorption sites for gas sensing. Sensors based on ZnO/rGO have attracted much attention due to the synergistic effect of ZnO and rGO [26,27,28,29,30,31].
In ZnO/rGO heterostructure, rGO content plays important role in gas sensing performance [32,33,34,35]. The sensing type of ZnO/rGO composites switch from n-type to p-type with increasing doping of rGO. It is divided into three working intervals: (1) With little rGO doping, the material shows n-type response. For example, Cao et al. prepared four ZnO/rGO composites and reported parts per billion (ppb) NO2 gas sensing with n-type response [36]. (2) With a medium rGO doping, the material exhibits mixed n- and p-type sensing properties. As shown in our previous study [37], the ZnO/rGO composite exhibits reversible switching from p- to n-type sensing which modulated by NO2 gas concentration and temperature. (3) With higher rGO loading, the ZnO/rGO is expected to exhibit a p-type response. The whole procedures are rarely investigated and remains challenging to uderstand. Therefore, the systematic research on the sensing performance caused by the ratio variation is essential for rational design of hybrid materials with heterojunctions exhibiting enhanced sensing property.
Herein, we systematically study rGO doping ratio-dependent sensing type switching of ZnO/rGO materials. ZnO nanoparticles were loaded with 0.1~4% rGO by a facile hydrothermal method and evaluated as NO2 gas chemiresistor. Increasing the rGO concentration changes the type of ZnO/rGO conductivity from n-type (<0.6% rGO) to mixed n/p-type (0.6~1.4% rGO) and finally to p-type (>1.4% rGO). Different sensing regions exhibit different sensing characteristics. In the n-type NO2 gas sensing region, all the sensors exhibit the maximum gas response at the optimum working temperature. In the mixed n/p-type region, the material displays abnormal reversal from n- to p-type sensing transitions as a function of the doping ratio, NO2 concentration and working temperature. In the p-type gas sensing region, the response decreases with increasing rGO and working temperature. Based on our observation, we derive a conduction path model that shows how the sensing type switches in ZnO/rGO with increasing of rGO doping. We also find that p–n heterojunction ratio (np–n/nrGO) plays a key role in the optimal response condition.

2. Materials and Methods

2.1. Materials

Potassium permanganate, hydrogen peroxide, and [Zn (CH3COO)2·2H2O] were purchased from Lingfeng Chemical Reagent Co., Ltd., Shanghai, China. Absolute ethanol and hydrochloric acid were purchased from Aladdin Reagent Co., Ltd., Suzhou, China. The corresponding solutions were prepared using distilled water. All required replacement parts were analytically pure and used directly without any further purification.

2.2. Preparation of ZnO Nanoparticles and rGO

The graphene oxide used in this article was prepared by Hummers’ method [38].
1.09 g of [Zn (CH3COO)2·2H2O] was mixed into methanol solvent to prepare a 0.1 M solution. The solution stirred in an oil bath at 70 °C, 0.5 M sodium hydroxide solution was added dropwise to the solution until the pH = 8 and a white precipitate appeared. The precipitate was kept at 120 °C for 4 h. The resulting product was calcined at 600 °C for 2 h to obtain ZnO nanoparticles.
The 1.0 g of ZnO nanoparticles and a certain amount of graphene oxide were added to 30 mL of deionized water. The mixture was placed in an ultrasonic stirrer for 30 min, followed by stirring with a magnetic stirrer for 30 min. After the mixture was placed into a hydrothermal autoclave with 50 mL PTFE liner, it was sealed and placed at 180 °C for 9 h. After the reaction kettle was cooled to room temperature, the product was removed, washed, and then dried. These samples were labeled as ZnO-x rGO (x = 0, 0.1, 0.2, 0.4, 0.6, 0.8, 1.0, 1.2, 1.4, 1.6, 2.0, 3.0, 4.0%).

2.3. Material Characterization

The crystal structure and phase purity of the prepared products were studied by X-ray diffraction (XRD, Holland Panalytical, Almelo, Holland. PRO PW3040/6: X-ray source Cu Kα, working voltage 30 KV, current 25 mA). The microstructure and micromorphology of the samples were observed by field emission scanning electron microscopy (FESEM, S-4800. Hitachi Limited, Tokyo, Japan) and high-resolution transmission electron microscopy (HRTEM, JEOL-2010. JEOL, Takashima, Tokyo, Japan). The optical absorption properties of the samples were characterized by UV-Vis diffuse reflectance spectrophotometry (UV-Vis Spectrophotometer, UV-2600. Shimadzu, Osaka, Japan). The chemical composition was analyzed by X-ray photoelectron spectroscopy (XPS, Thermo Fisher Scientific, New York, NY, USA. ESCALAB 250 Xi spectrometer).

2.4. Gas-Sensing Measurements

First, the ZnO/rGO composite powder was mixed with an appropriate amount of ethanol and ground well with a mortar and pestle. It was evenly applied to the interdigitated electrode with a brush and then dried at 80 °C for 6 h. Finally, it was placed in the CGS-4TPS measurement system (Alitech Technology Co., Ltd., Beijing, China) for testing. The change in the resistance of the sensor was recorded by varying the concentration of the incoming gas and the ambient temperature.

3. Results

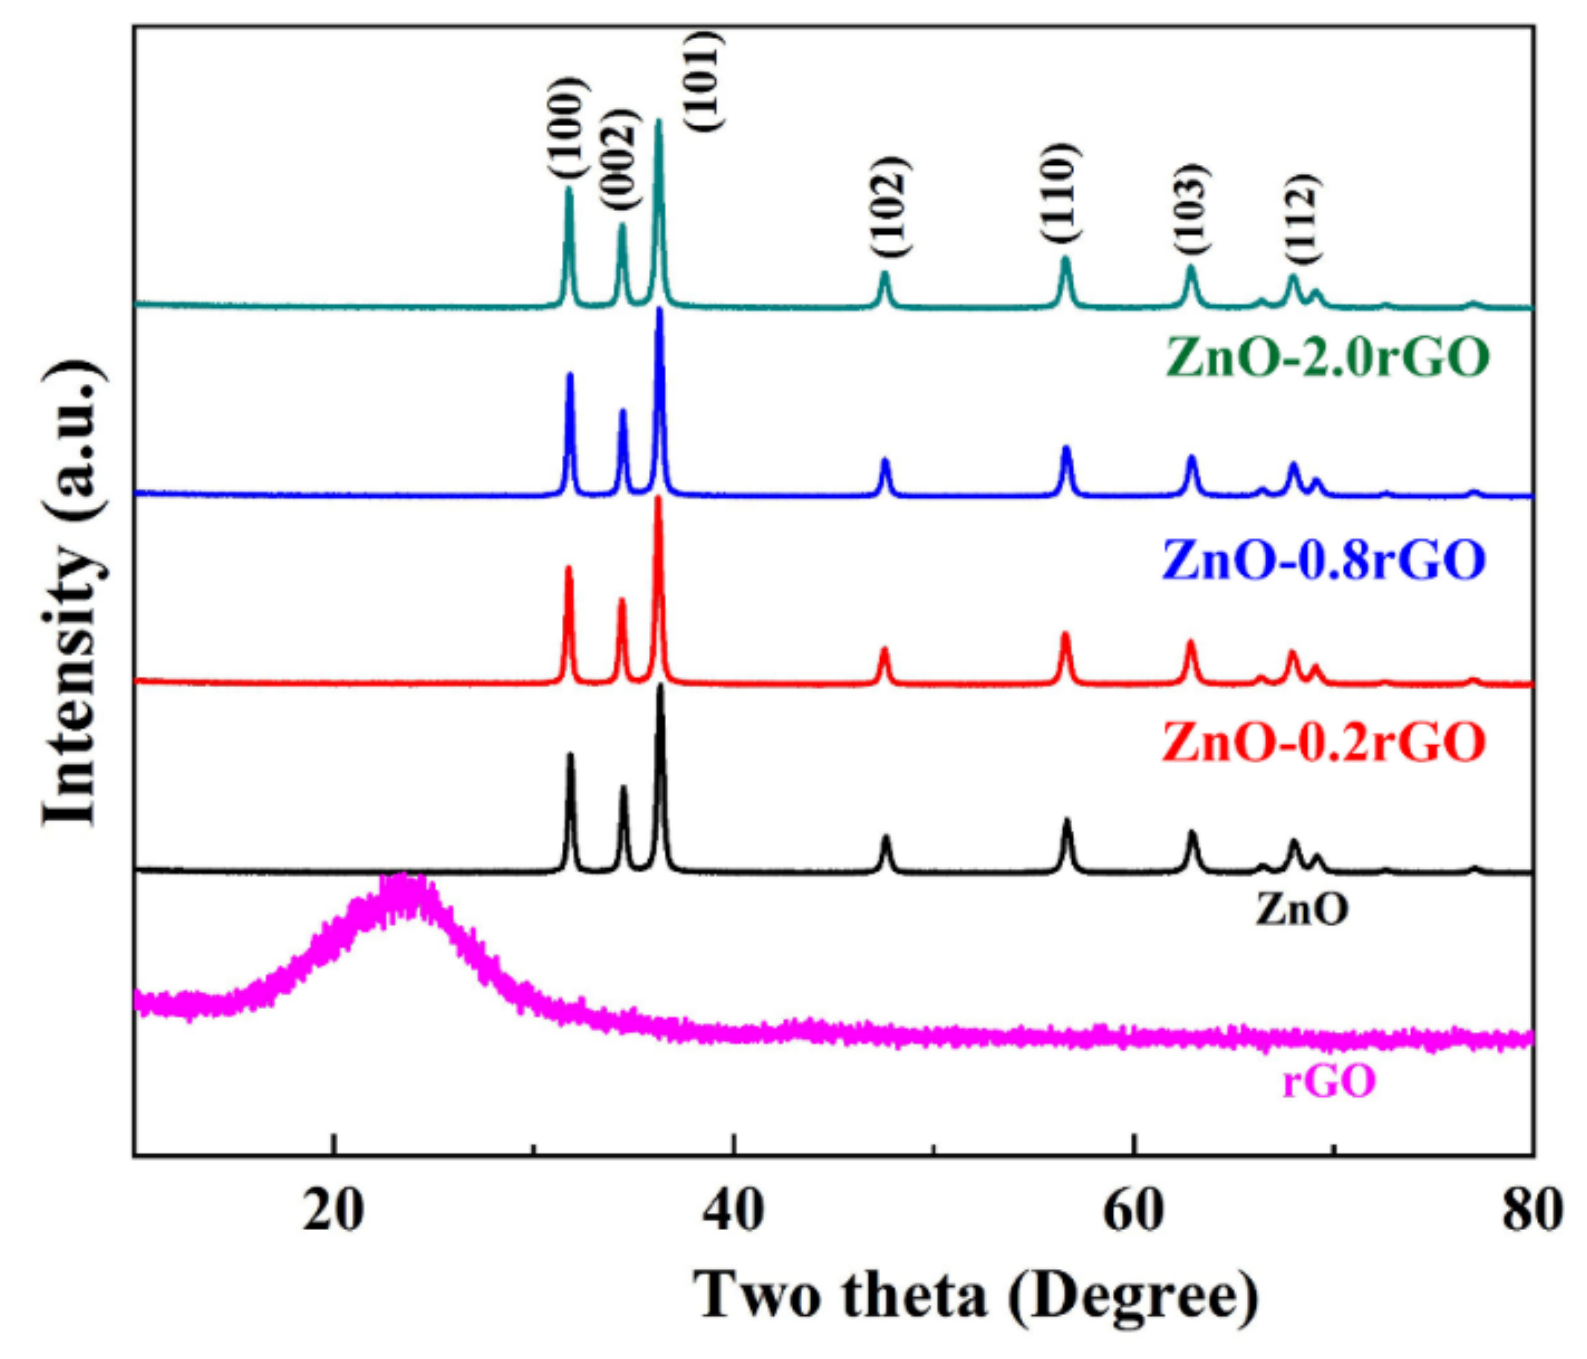
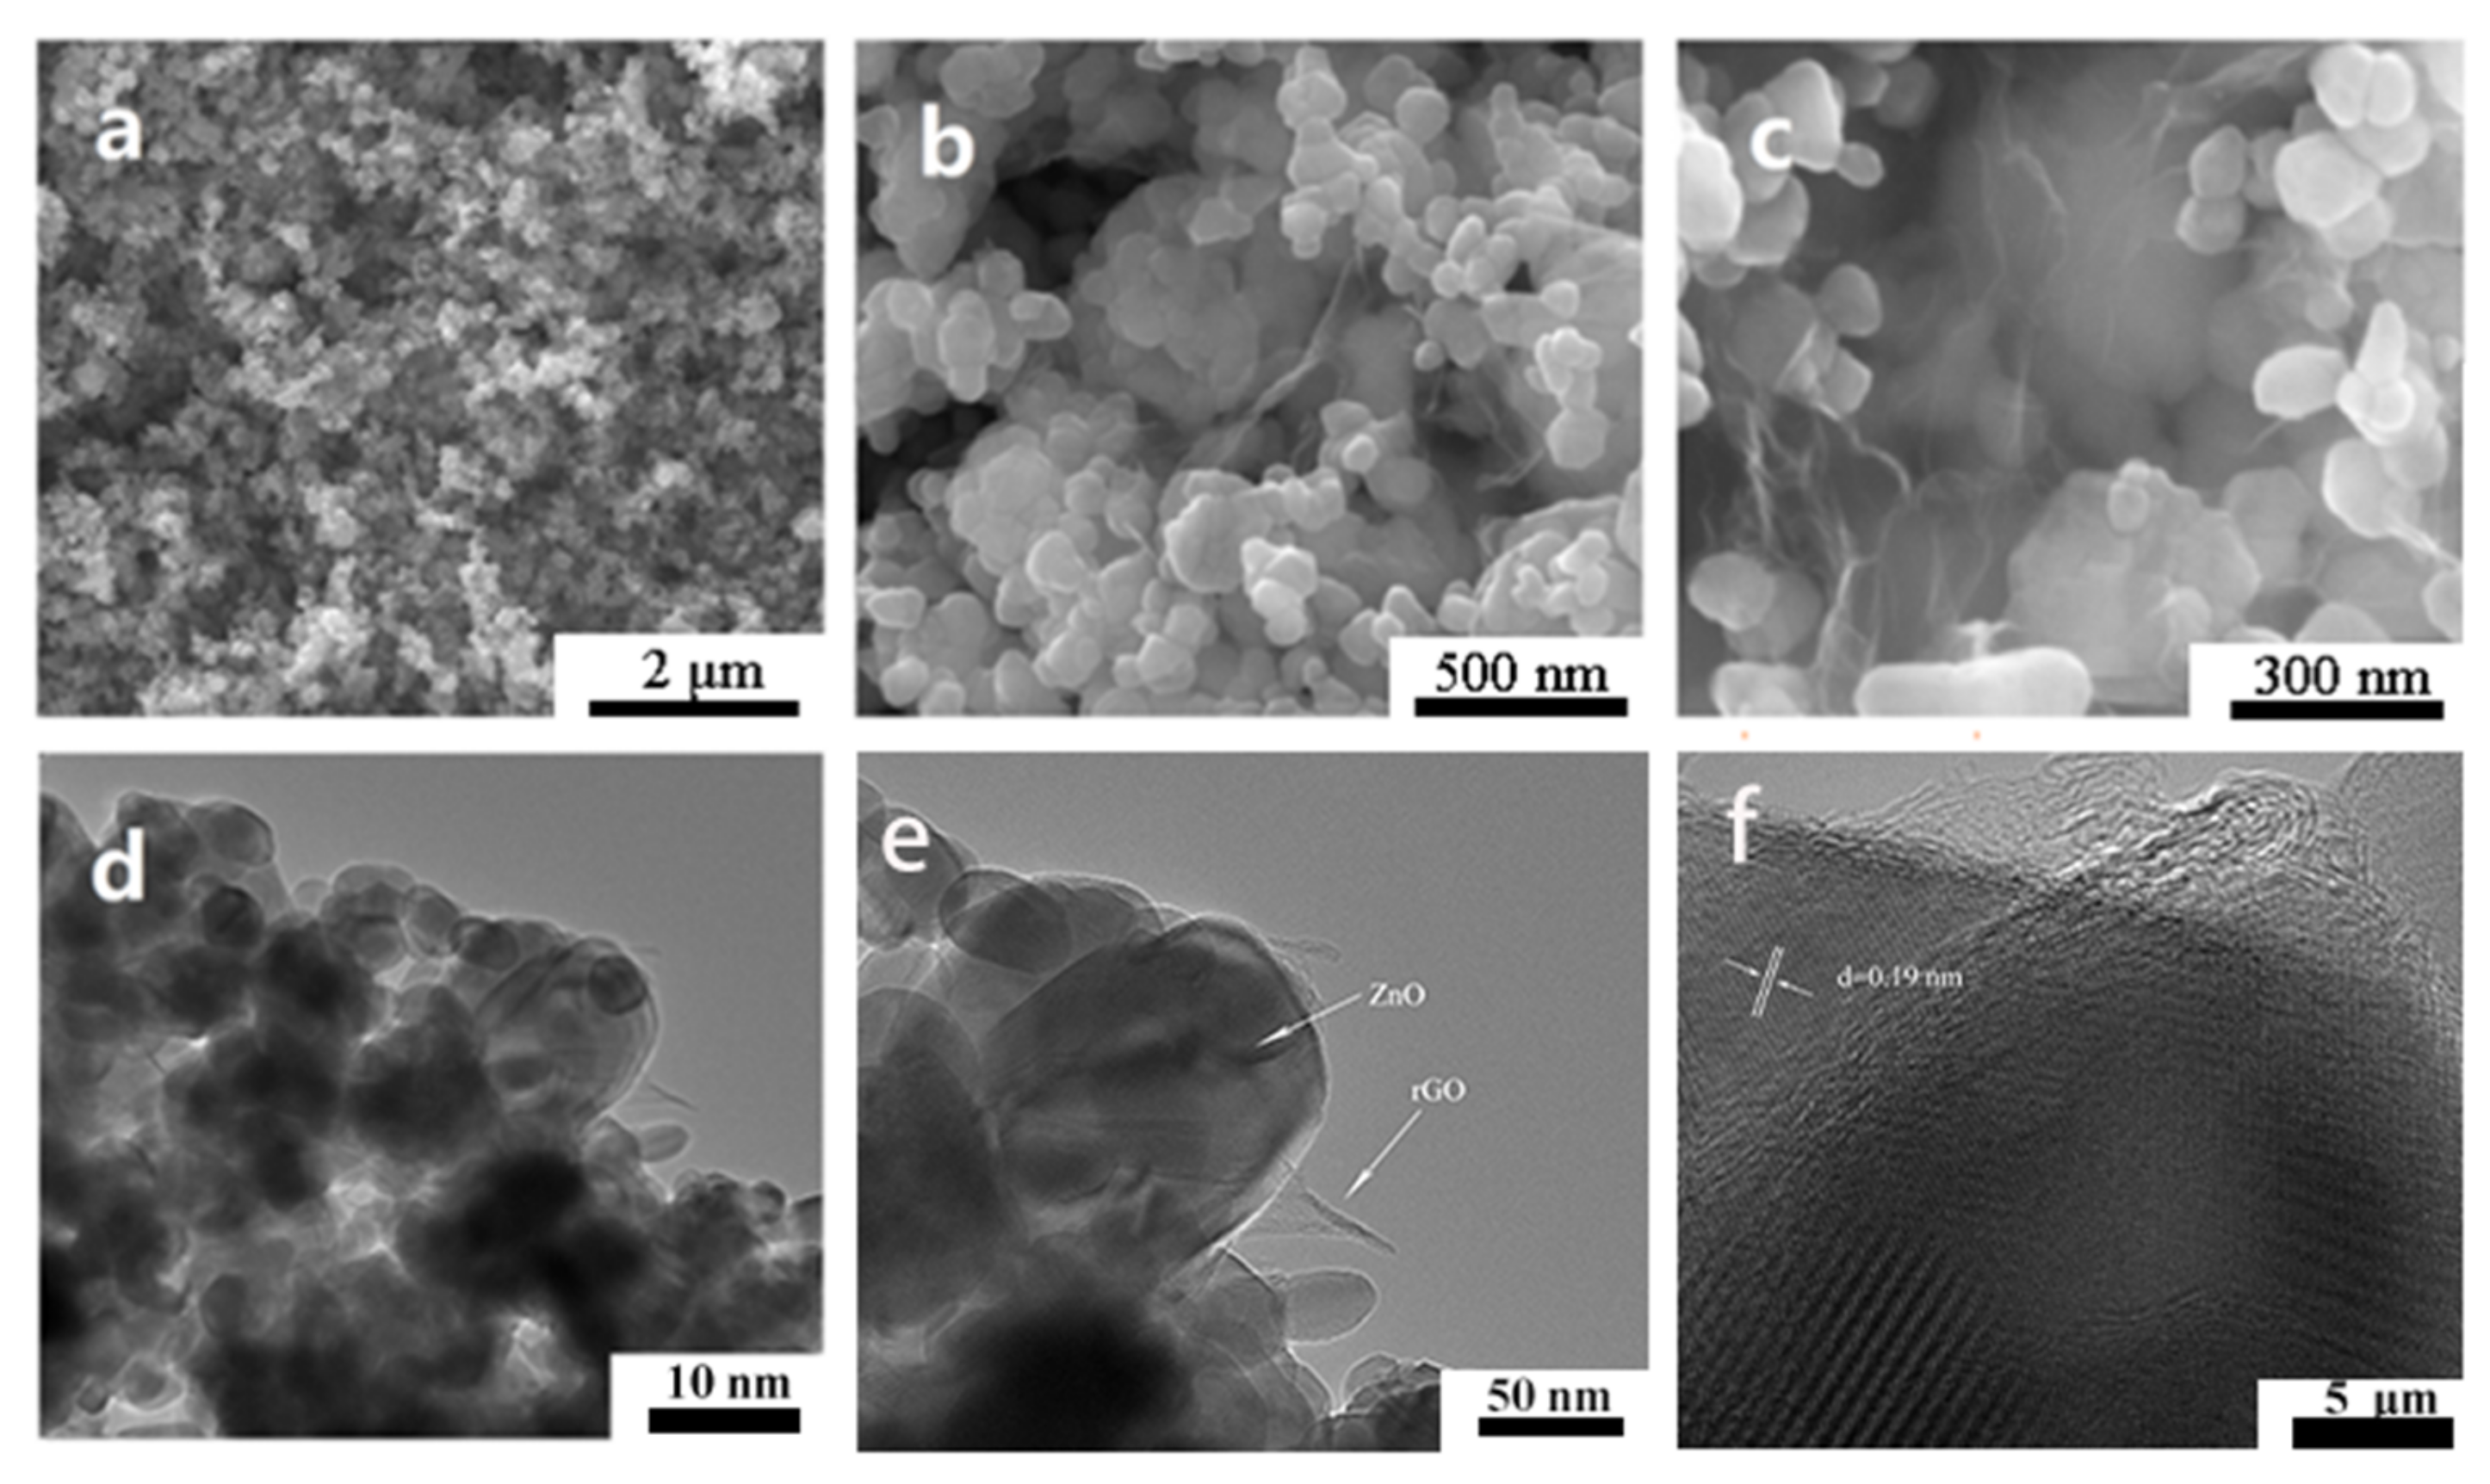
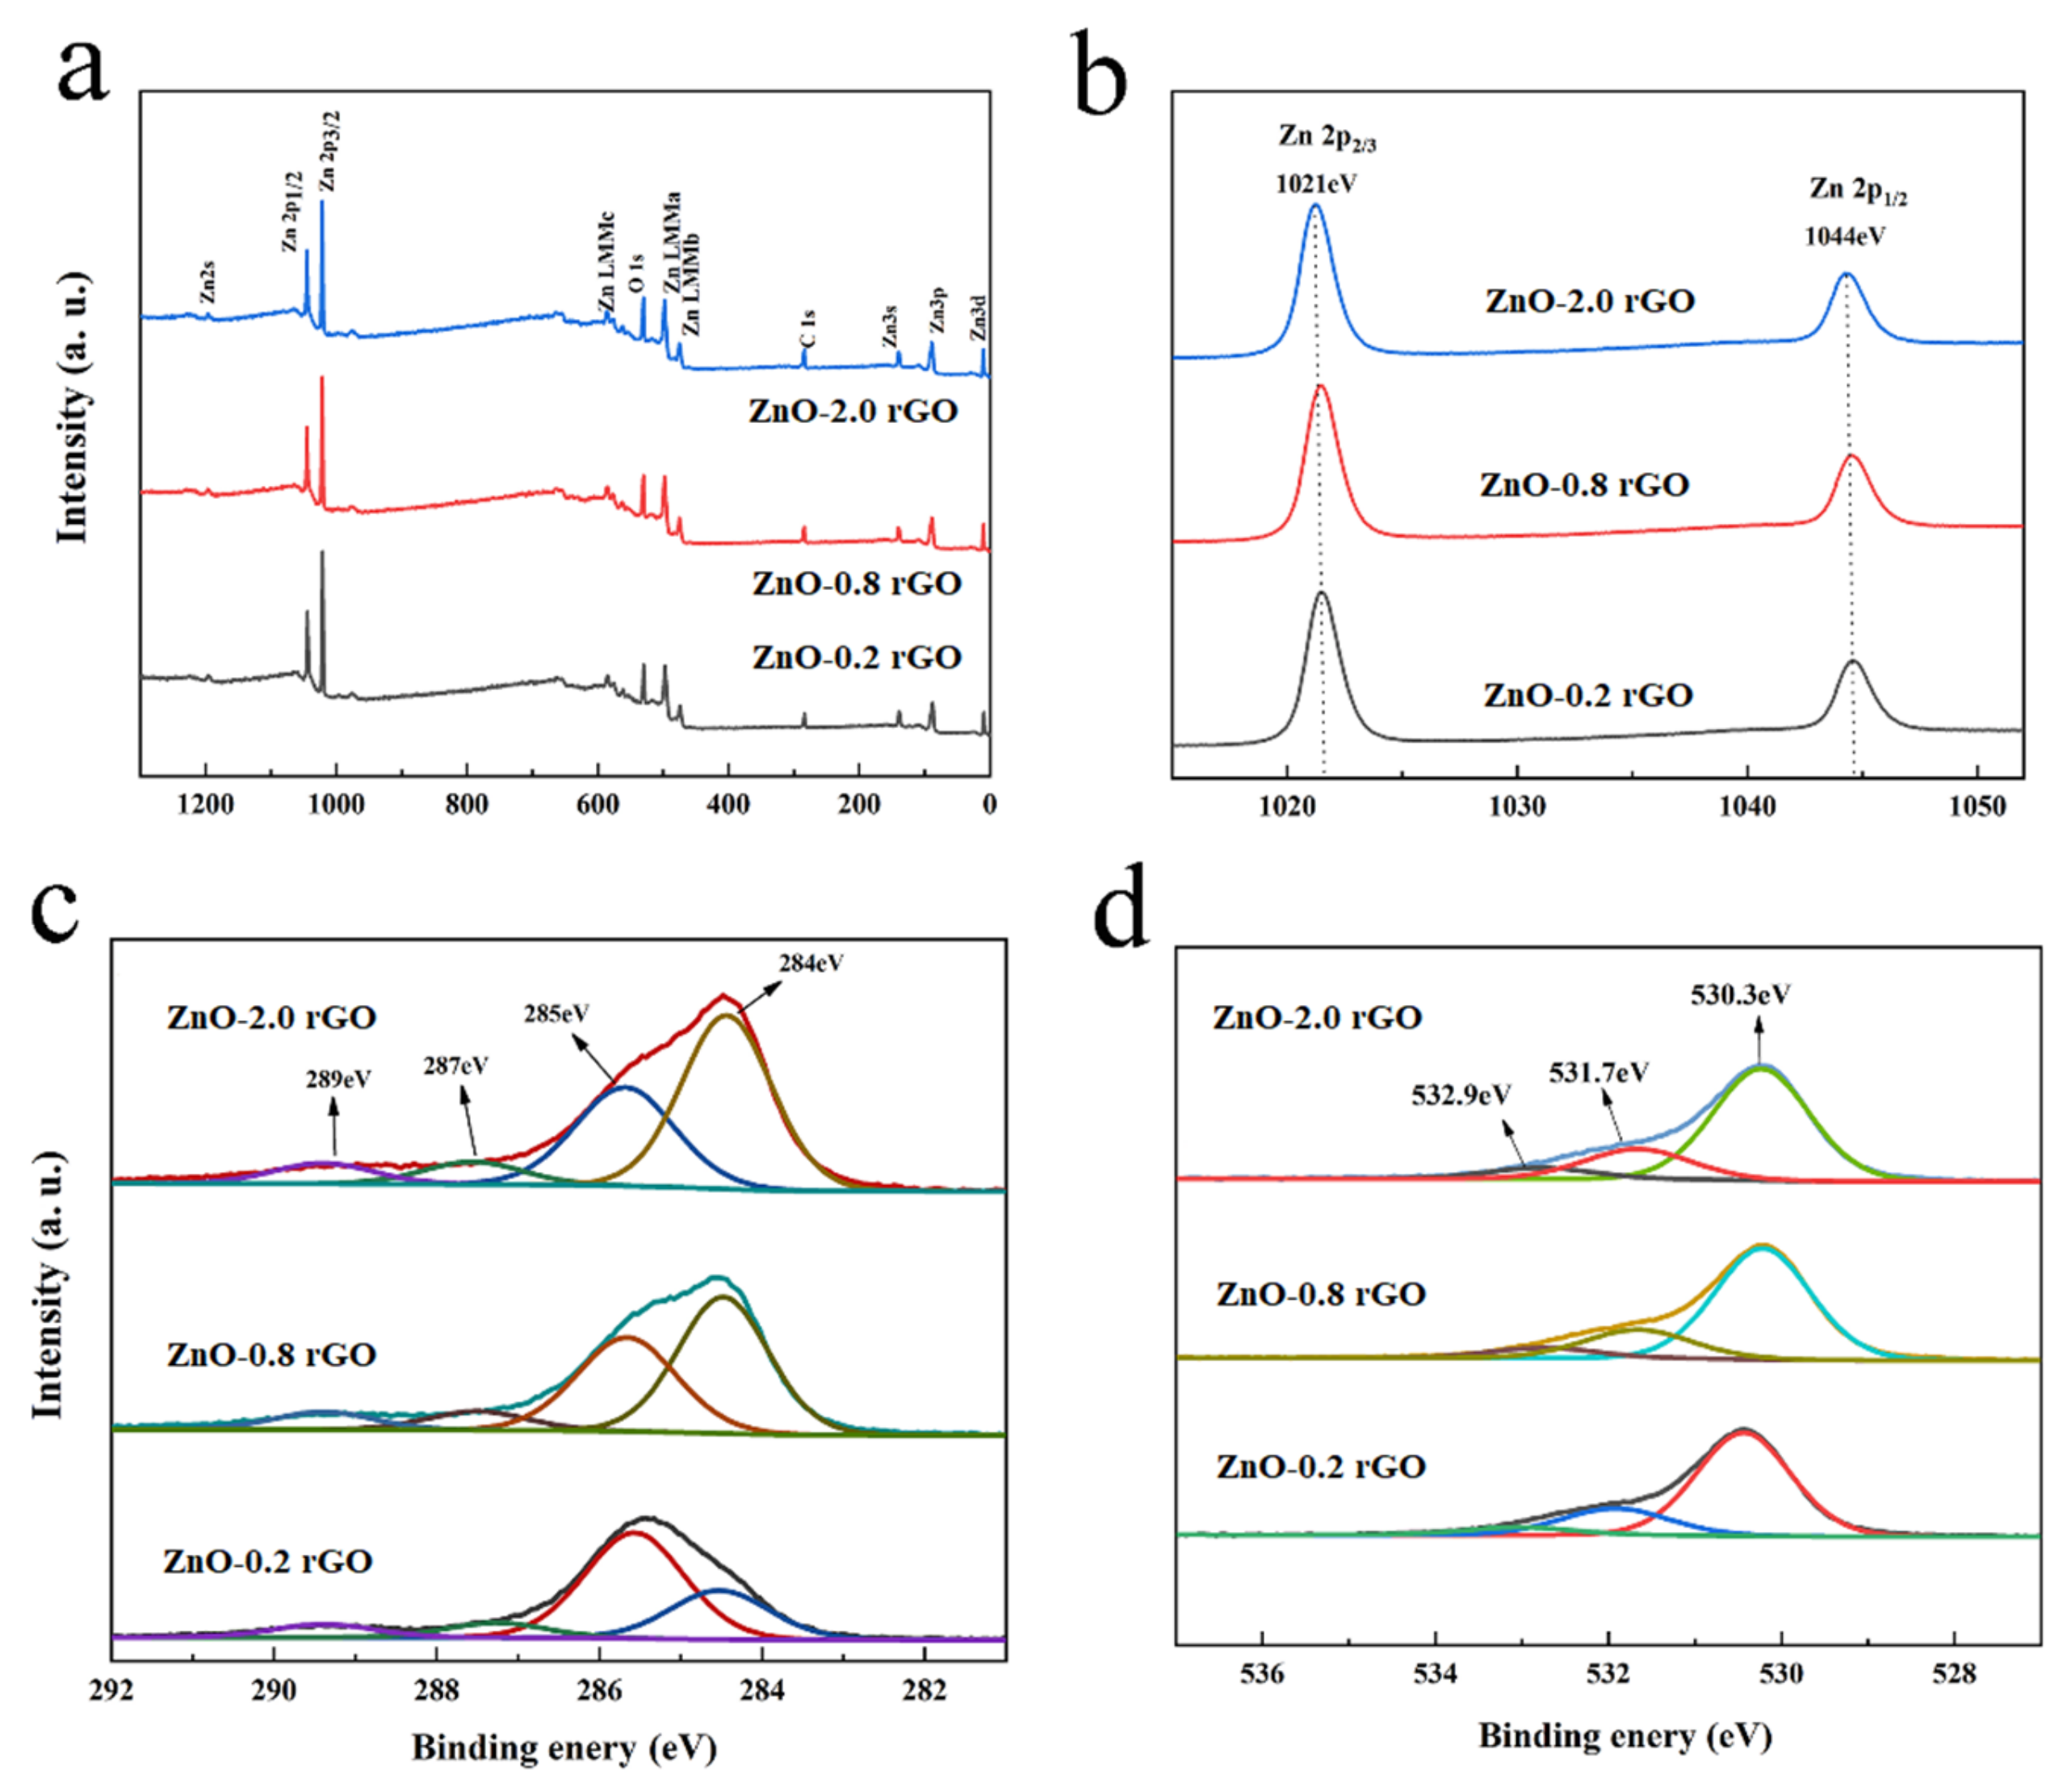
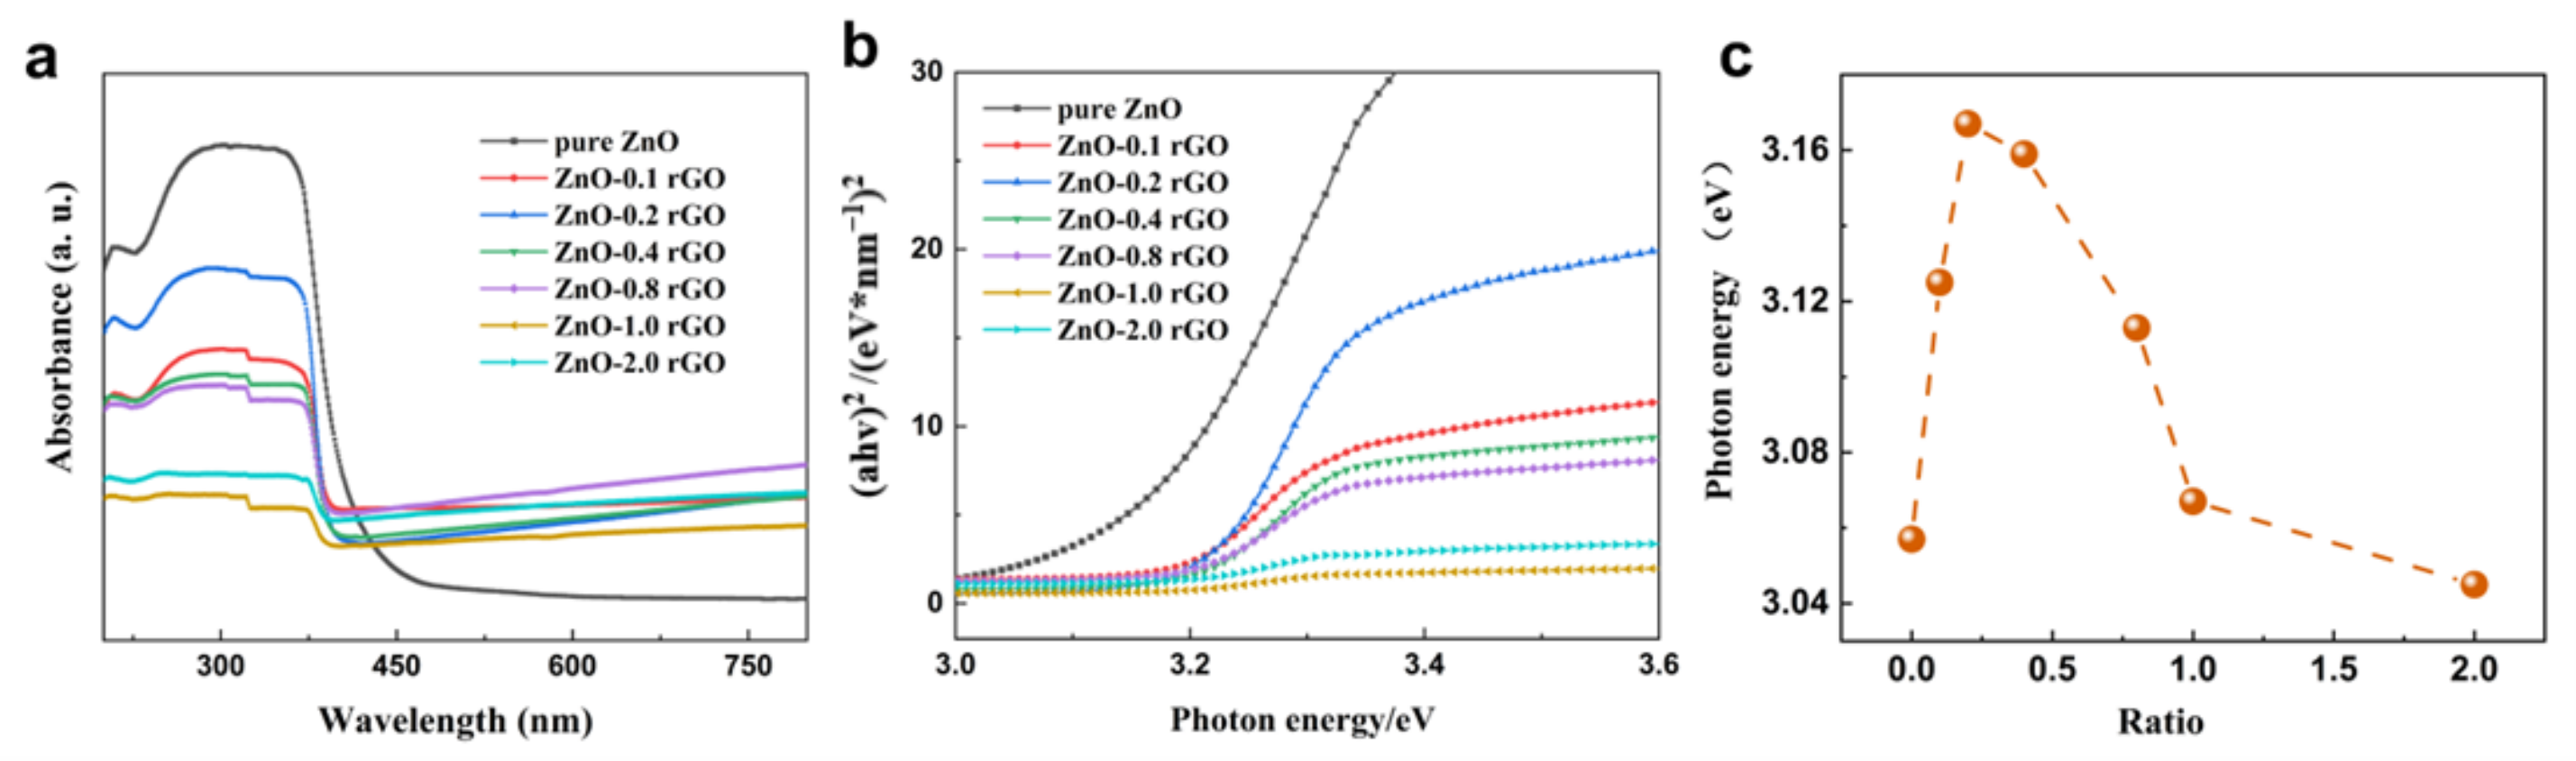
3.1. Materials Characterization

Figure 1 depicts the XRD patterns of rGO, ZnO, ZnO-0.2 rGO, ZnO-0.8 rGO, and ZnO-2.0 rGO. For rGO, there is only a broad diffraction peak (002) at 25°. The weak broad peak in rGO disappears in the ZnO/rGO due to the small content and high dispersion of rGO in ZnO/rGO. And the ZnO and ZnO-rGO nanocomposites with various rGO contents show high intensity of the diffraction peaks indicating a good crystallinity of the materials. The peaks at 31.9, 34.6, 36.5, 47.7 and 56.7° are assigned to (100), (002), (101), (102) and (110) planes of hexagonal wurtzite zinc oxide (JCPDS-36-145) [39,40]. No change in diffraction peaks of the ZnO-rGOs with that of ZnO indicates surface hybridization of rGO on ZnO because the lattice constant of ZnO remains unchanged.
The microstructure and morphology of ZnO and ZnO-rGO were analyzed by SEM and TEM. Figure 2 shows the typical results. The pure ZnO consists of 20–100 nm nanoparticles (Figure 2a). The sheet-like rGO is clearly observed after hybridization of ZnO with rGO (Figure 2b,c). TEM images (Figure 2d,e) show that the ZnO-0.2 rGO consists of ZnO nanoparticles covered with rGO. The higher magnification image (Figure 2f) shows a clear view of the interface between ZnO and rGO which offers the possibility of forming p–n junctions to improve the gas-sensing properties of the ZnO-rGO. The lattice fringes with a d-spacing of 0.19 corresponds to the (101) plane of wurtzite hexagonal structure ZnO.
XPS was used to confirm the chemical state of the component elements in the samples. Figure 3 shows the XPS spectra of the ZnO-x rGO (x = 0.2, 0.8, 2.0) composites. Figure 3a confirms the presence of Zn, C and O elements. The characteristic peaks of Zn 2p, Zn 2p1/2, and Zn 2p3/2 are exhibited at around 1196 eV, 1045 eV, and 1022 eV, respectively. Figure 3b displays the Zn 2p high-resolution spectrum. The peaks at approximately 1044 eV and 1021 eV are attributed to Zn 2p1/2 and Zn 2p3/2, respectively [41,42]. In Figure 3c, four characteristic peaks appear at 284.53 eV, 285.65 eV, 287.28 eV and 289.43 eV, corresponding to C=C, C-C, C-O and C=O in graphene, respectively. In addition, the plot of O 1s was fitted to three sections corresponding to the lattice oxygen O of ZnO in the composite with hexagonal fibrillated zincite structure OL (530.3 eV), chemisorbed oxygen OC (531.7 eV), and C=O (532.9 eV). Among them, the lattice oxygen OL content of the composites is around 72%, while the chemisorbed oxygen OC (531.7 eV) content is around 21%.
Figure 4a shows the UV-vis DRS spectrum of the ZnO-x rGO (x = 0, 0.1, 0.2, 0.4, 0.6, 0.8, 1.0, 2.0), which shows that the presence of rGO leads to an observable shift in the spectra [43]. As shown in Figure 3b, the optical band gap of ZnO-x rGO was estimated using Equation (1).
Eg = h v   A h v C 1 2
where h v are horizontal coordinates, and A h v C 1 2 . are vertical coordinates. The tangent line can be obtained as Eg, and hv can be replaced by 1240/λ, where λ is the wavelength; A is the degree of light absorption; and C is a constant. The band gap exhibits a maximum with increasing rGO doping (Figure 3c). And ZnO-0.2 rGO has a maximum optical band gap. The change in the band gap can be attributed to the interaction of Zn-O-C with ZnO-rGO. Similar results are also shown by other researchers. Puneetha J et al. [44] found that ZnO/GO nanohybrid materials have a small red shift (6 nm) compared with the pure ZnO. They ascribe those to the chemical binding (Zn-O-C) between ZnO and GO. Rahimi et al. [45] find that the Eg value decline from 3.2 eV (ZnO) to 2.8 eV for ZnO nanorod/graphene quantum dot composites respectively. They ascribe those to the chemical bonds formed such as Zn-O-C or Zn-C bonds in the composites. The larger percent of p–n junctions in the material, the wider optical band gap of is expected. In our observation, it is interesting to find that sensor based on ZnO-0.2 rGO with a maximum band gap shows the best sensitivity toward NO2 sensing in the n-type sensing region (Section 3.2).

3.2. Gas Sensing Property

The ZnO-x rGO samples (x = 0, 0.1, 0.2, 0.4, 0.6, 0.8, 1.0, 1.2, 1.4, 1.6, 2.0, 3.0, 4.0) obtained by the hydrothermal method were used to prepare gas sensors. The sensing properties of the composites were tested at various temperatures at different NO2 concentrations. The sensor sensitivity was calculated according to Equation (2).
Sensitivity = R g R a 1
where Rg and Ra are the resistances of the sensing elements in the presence of NO2 gas and air, respectively. The sensitivity is positive (negative) which indicates that the material is an n-type (p-type) semiconductor. Figure 5 depicts the sensitivity of the samples toward 4 ppm NO2. The composites behave as n-type semiconductors, when the doping concentration is low (x = 0, 0.1, 0.2, 0.4, 0.6) as shown in the red area. However, as the doping concentration increases (x = 0.6, 0.8, 1.0, 1.2, 1.4) as shown in the yellow area, the sensors begin to change from p- to n- type. Finally, when the doping concentration is high (x = 1.6, 2.0, 3.0, 4.0, 5.0) as shown in the blue area, sensors exhibit p-type responses.
n-type sensing: Sensors based on the ZnO-x rGO (x = 0, 0.1, 0.2, 0.4, 0.6) show n-type conductivity (Figure 6). The resistance of the sensors increases when they come into contact with NO2. Small amount of rGO addition to form p–n junctions do not change the sensing type. The results showed that all sensors have an optimal temperature with maximum sensitivity. This is a consequence of competition between gas adsorption and desorption [46]. Among them, the ZnO-0.2 rGO has the highest sensitivity of 56 at 4 ppm NO2 with a low optimal working temperature of 125 °C. And the maximum response of the sensor to different ratio has a good nonlinear correlation, which conforms to the Lorentz function (Figure 7). The correlation coefficient is R2 = 0.99959 in the range of 0~0.6%. It means that the sensitivity is related to the charge carriers inside the material [47,48,49]. This is related to the percentage of p–n junctions in the complex as shown in UV-vis spectrum (Figure 4).
Switching from n- to p-Type: ZnO and rGO are n-type and p-type semiconductors, respectively. When a small amount of rGO is introduced into ZnO, the material remains an n-type semiconductor because it acts as a dopant. However, when the proportion of rGO continues to increase and reaches a threshold, the material transforms into a p-type semiconductor when rGO becomes the dominant factor. A p–n mixing region appears before the composite completely transitions to a p-type semiconductor. To find this sensing type region, sensors based on ZnO-x rGO (x = 0.6, 0.8, 1.0, 1.2, 1.4, 1.6) were tested at different operating temperatures from 50 to 250 °C at 4 ppm (Figure 8) or 1 ppm (Figure 9) NO2, sensor sensitivity was calculated according to Sensitivity = R a R g −1. These samples undergo p–n conversion at different test concentrations due to different doping ratios of rGO. ZnO-0.6 rGO and ZnO-0.8 rGO show the transition from p-type to n-type in 4 ppm NO2 gas (Figure 8). ZnO-1.0 rGO, ZnO-1.2 rGO and ZnO-1.4 rGO (Figure 9) show the p–n transition in 1 ppm NO2. The n- to p-type sensing transitions as a function of the doping ratio, NO2 concentration and working temperature can be explained by mechanisms based on charge transfer and surface reactions, as explained in our previous article [37].
p-type sensing: As the amount of rGO continues to increase and reaches a threshold, rGO becomes the dominant factor and therefore the material transforms into a p-type sensing. When the doping ratio is increased to 0.6%, the composite starts to exhibit a p-type response in the low-temperature region (30–100 °C) at 4 ppm (Figure 10). As shown in the Figure 10a, the ZnO-0.4 rGO complex is n-type response, while ZnO-0.6 rGO exhibits a p-type response. As shown in Figure 10b, ZnO-0.8 rGO exhibit the maximum value of the p-type response in the p–n transition region. The sensitivity decreases with increasing rGO doping ratio in the p-type region. Compared with n-type complexes, the optimal operating temperature of p-type materials is reduced to 75 °C.
Recovery time: As shown in Figure 9, the recovery time of the sensing materials show a max with the increasing of temperature. In order to make a clear observation, we made a diagram (recover time VS temperature) for the two samples (ZnO-1% rGO and ZnO-2% rGO) with good response. As shown in the Figure 11, the recovery time increased first and then decreased with the increase of temperature. The material first shows p-type response and then starts to turn to n-type response. At 175 degrees, both n- and p-type sensing occur in the materials. There is competition between p-type response and n-type response, which might make the recovery time longer. At the second stage, with the further increase of the temperature, the materials display n-type sensing. Since the desorption of the gas molecular is faster at higher temperature, the recovery time decrease with the increasing of the temperature at this stage.
Overview: In the n-type region we find the maximum sensitivity, while in the p-type region we observe that the sensitivity decreases continuously as the doping ratio of rGO increases and maximum sensitivity appears in the p–n transition region. To observe the changes in sensitivity occurring for different ratios of ZnO-x rGO (x = 0.1, 0.2, 0.4, 0.6, 0.8, 1.0, 2.0, 3.0, 4.0), we plotted the sensitivity plot with respect to temperature and doping ratio. As shown in Figure 12, it is clear from the plot that the maximum sensitivity of the n-type sensing materials is ZnO-0.2 rGO at 125 °C, while the maximum sensitivity of the p-type sensing materials is ZnO-0.8 rGO at 75 °C. It shows that n-type sensing materials exhibit optimum sensitivity at high temperature (the red area), the best working temperature of p-type material is low temperature environment (the blue area). It (Line 4-2-5) indicates a change in sensitivity with increasing temperature, which is related to the change in internal carrier concentration. The change of temperature will affect the change of electron concentration inside the material and the adsorption and desorption equilibrium on the surface [46]. It (line 1-2-3) indicates a change in sensitivity with increasing ratio. It is the result of the joint action of p–n junction and rGO. ZnO-0.2 rGO has the maximum sensitivity at 125 °C in the n-type region because the p–n junction has the greatest effect at this time and the smallest concentration of electron carriers. It (lines 4-6-7) also shows that the sensitivity decreases with increasing rGO ratio. It (line 3-6) indicates a change in sensitivity with decreasing temperature. RGO plays a major role in the whole blue region, while it plays an auxiliary role in p–n. When the temperature is 75 °C, the hole carrier of ZnO-0.8 rGO is relatively small, and the role of p–n junction is greater than that of other conditions, so it has the maximum sensitivity.

4. Discussion

Carrier transition mechanism and surface chemical reaction are used to explain the mechanism of material sensitivity change [37]. As shown in Scheme 1, upon rGO loading, the electrons of ZnO conduction band flow to rGO and form p–n junction on the contact surface. When working temperature changes, the carrier concentration in the material and the adsorption and desorption balance on the surface of the material will change accordingly, resulting in changes in sensitivity.
Under air condition, oxygen adsorbs on the surface of the material and captures electrons from the valence band. Reaction (1) is the reaction of oxygen on the material surface. There are two different states of adsorbed oxygen: O2 (below 100 °C) and O (100~200 °C). When NO2 gas molecules are adsorbed on the material surface, they are chemically adsorbed as NO2 (reaction (2)). At the same time, some NO2 will react with O or O2 (reaction (3)), leading to the change of carrier in the materials and the resistance of the materials.
O 2 g + 2 e 2 O ads .
NO 2 g + e NO 2 ads .
NO 2 g + 2 O ads . NO 2 ads . + O 2 g + e
In order to further understanding the doping ratio modulated sensing properties, the conduction path model is proposed. As shown in Scheme 2, with low and moderate graphene loading, graphene sheets are not interconnected (Scheme 2a), and the conductivity is caused by electrons (Ie−). Graphene sheets begin to interconnect with increasing graphene doping (Scheme 2b), and the conduction path is mainly through ZnO nanoparticles and rGO (Ie− + Ih+). As the rGO content further increases (Scheme 2c), graphene becomes a major part of the conductivity (Ih+).
The difference in the conductivity path indicates a change in the sensing type in the composite. However, the key factors that affect the sensitivity of the composite are the p–n junction and rGO. The formation of the p–n junction led to extensive expansion of the depletion region when NO2 is adsorbed on the surface [50]. The sensor resistance increases significantly due to the deep extension of depletion regions compared to pure ZnO. The p–n junction contributes to the sensitivity of the composite. But rGO give poor response due to its weak Van der Waals interactions with NO2 gases [46]. Therefore, the joint effect of the p–n junction and rGO is proposed. And it is expressed as ψ = np–n/nrGO, where np–n is the content of the p–n junction in the whole composite and nrGO is the content of rGO in the whole composite.
Scheme 3 shows the increasing trend of np–n and nrGO with increasing rGO content. In the first part (Scheme 3a), as the rGO content increases, np–n increases faster than nrGO. The p–n junction plays a major role in the material response when the graphene loading level is low. There can be a large number of p–n junctions at this low-weight graphene content due to the very low graphene density. ψ will rise (np–n >> nrGO). After the introduction of NO2, the sensor resistance increased due to the extension of the depletion regions. The sensitivity of the composite increases with increasing ψ when the graphene loading level is 0~0.2% (Scheme 3a). The response is optimal in the case of prepared graphene-zinc oxide composites with a graphene loading of approximately 0.2%.
The second part is that nrGO increases faster than np–n as the rGO content continues to increase. The role of rGO in composites is becoming increasingly significant. The sample will undergo two processes: a. Composites will remain an n-type semiconductor (Scheme 3b); b. The semiconductor type of the composite changes from n-type to p-type with temperature or gas concentration (Scheme 3c). At higher graphene concentrations (0.4~1.4%), the dispersed conducting graphene sheets start to partially connect, resulting in a shorter resistance path through the graphene sheets and a larger dropping in resistance in air, as shown in Scheme 2b. When exposed to NO2, the p–n junction still plays a key role, but its content is low relative to graphene, and the conductive pathway is partly through graphene, the sensors resistance will be increased less. The sensitivity starts to decrease (Scheme 3b). At the same time, when the external conditions change, the sensing type of the material will also be transformed (Scheme 3c). When the material is a p-type semiconductor (1.6 ~4.0%), graphene becomes the only conductive path in Scheme 2c. The content of the p–n junction is much smaller than that of rGO (np–n << nrGO). ψ decreases with increasing doping of rGO, and the sensitivity of the sample also decreases. The sensitivity decreases with decreasing ψ at higher graphene concentrations (0.4~4.0%) (Scheme 3b–d).
As shown Scheme 3, the trend of sensitivity is to increase and then decrease. The model shows that the trend of ψ = np–n/nrGO also increases and then decreases. Meanwhile, UV-vis DRS can directly detect the trend of n in line with the trend of sensitivity, which further validates that ψ is a key factor affecting the sensitivity. Based on the proposed influencing factors (ψ = np–n/nrGO), the same holds true for SnO2 /rGO. In the study by Li G D et al. [51]. The 0.2 wt% rGO-SnO2 nanocomposites show a higher response to 3 ppm NO2 at 125 °C than pure rGO, 0.1 wt% rGO-SnO2, 0.4 wt% rGO-SnO2, 0.6 wt% rGO-SnO2 and pure SnO2. The rGO-SnO2 complex exhibits an n-type response, and the response increases and then decreases with increasing graphene content. This result is consistent with our results. The rGO-SnO2 complex exhibits a p-type response. Zhu X Y et al. [52]. prepared four different ratios of rGO-SnO2 (rGO, rGO—1 mg/mL SnO2, rGO—2 mg/mL SnO2, rGO—2 mg/mL SnO2). The experimental results revealed an increased sensing response with increasing SnO2 concentration from 0 to 10 mg/mL. which means that the sensing response decreases as np–n/nrGO decreases. Similar response enhancement can be achieved if other materials can form high-density or heterogeneous junctions, and the best ratio of sensitivity is determined by the ψ value.

5. Conclusions

In summary, nanomaterial ZnO/rGO composites with different rGO loading ratio were prepared by a facile hydrothermal method. Gas sensor based on those materials were fabricated for NO2 detection. A series of comparison experiments confirmed that the sensing type (n-type, p-type or mix n- and p-type) was modulated by rGO ratio. Based on the observation, a conduction path model was proposed to show how the sensing type switches in the materials. And the p–n heterojunction ratio (np–n/nrGO) of the material plays a key role in the optimal response condition. The approach presented in this work can be extended to other heterostructures and the insights will benefit the rational design of more efficient chemiresistive gas sensors.

Author Contributions

Conceptualization, D.L. and H.J.; methodology, D.L. and H.J.; validation, D.L. and H.J; formal analysis, D.L. and H.J.; investigation, D.L.and H.J.; resources, D.L. and H.J.; data curation, D.L. and H.J.; writing original draft preparation, D.L.; visualization, D.L.; supervision, D.J., J.L. and X.Z. All authors have read and agreed to the published version of the manuscript.

Funding

This research was funded by Natural Science Foundation of Zhejiang Province grant number [LY20E020011].

Data Availability Statement

The data presented in this study are available on request from the corresponding author.

Acknowledgments

We are very grateful to the teachers in the carbon material research group of College of Materials and Chemistry at China Jiliang university and provided research facilities for this work.

Conflicts of Interest

The authors declare no conflict of interest.

References

  1. Yuan, K.P.; Wang, C.Y.; Zhu, L.Y.; Yang, J.H.; Li, X.X.; Huang, W.; Wang, Y.Y.; Lu, H.L.; Zhang, D.W. Fabrication of a micro-electromechanical system-based acetone gas sensor using CeO2 nanodot-decorated WO3 nanowires. ACS Appl. Mater. Interfaces 2020, 12, 14095–14104. [Google Scholar] [CrossRef]
  2. Zhao, H.G.; Liu, L.C.; Lin, X.Z.; Dai, J.X.; Liu, S.; Fei, T.; Zhang, T. Proton-Conductive Gas Sensor: A new way to realize highly selective ammonia detection for analysis of exhaled human breath. ACS Sens. 2020, 5, 346–352. [Google Scholar] [CrossRef]
  3. Zhou, T.T.; Sang, Y.T.; Sun, Y.L.; Wu, C.Y.; Wang, X.X.; Tang, X.; Zhang, T.; Wang, H.; Xie, C.S.; Zeng, D.W. Gas adsorption at metal sites for enhancing gas sensing performance of ZnO@ZIF-71 nanorod arrays. Langmuir 2019, 35, 3248–3255. [Google Scholar] [CrossRef]
  4. Tian, S.Q.; Yang, F.D.; Zeng, D.W.; Xie, C.S. Solution-processed gas sensors based on ZnO nanorods array with an exposed (0001) facet for enhanced gas-sensing properties. J. Phys. Chem. C 2012, 116, 10586–10591. [Google Scholar] [CrossRef]
  5. Balasubramani, V. Impedance Spectroscopy-Based Reduced Graphene Oxide-Incorporated ZnO Composite Sensor for H2S Investigations. ACS Omega 2019, 4, 9976–9982. [Google Scholar] [CrossRef] [Green Version]
  6. Lee, D.; Jung, J.; Kim, S.; Envelope, H. Gas Detection and Recovery Characteristics at Room Temperature Observed in a Zr 3 N 4-based Memristor Sensor Array. Sens. Actuators B Chem. 2023, 376, 132993. [Google Scholar] [CrossRef]
  7. Gooding, J.J. Developing Chemical Sensors That Employ Consumer Electronics Has Pitfalls as well as Rewards. ACS Sens. 2022, 7, 2493–2494. [Google Scholar] [CrossRef]
  8. Shishiyanu, S.T.; Shishiyanu, T.S.; Lupan, O.I. Sensing characteristics of tin doped ZnO thin films as NO2 gas sensor. Sens. Actuators B Chem. 2005, 107, 379–386. [Google Scholar] [CrossRef]
  9. Zhang, Z.Y.; Xu, M.Z.; Liu, L.; Ruan, X.; Yan, J.F. Novel SNO2@ZnO Hierarchical Nanostructures for Highly Sensitive and Selective NO2 Gas Sensing. Sens. Actuators B Chem. 2017, 4005, 32106. [Google Scholar] [CrossRef]
  10. Kang, Y.L.; Yu, F.; Zhang, L.; Wang, W.H.; Chen, L.; Li, Y.C. Review of ZnO-based nanomaterials in gas sensors. Solid State Ion. 2021, 360, 115544. [Google Scholar] [CrossRef]
  11. Hsu, C.L.; Chang, L.F.; Hsueh, T.J. Light-activated humidity and gas sensing by ZnO nanowires grown on LED at room temperature. Sens. Actuators B Chem. 2017, 249, 265–277. [Google Scholar] [CrossRef]
  12. Diep, V.M.; Armani, A.M. Flexible light-emitting nanocomposite based on ZnO nanotetrapods. Nano Lett. 2016, 16, 7389–7393. [Google Scholar] [CrossRef]
  13. Gaiardo, A.; Fabbri, B.; Giberti, A. ZnO and Au/ZnO thin films: Room-temperature chemoresistive properties for gas sensing applications. Sens. Actuators B Chem. 2016, 237, 1085–1094. [Google Scholar] [CrossRef]
  14. Zhu, L.; Zeng, W. A novel coral rock-like ZnO and its gas sensing. Mater. Lett. 2017, 209, 244–246. [Google Scholar] [CrossRef]
  15. Sahoo, M.; Antony, R.P.; Mathews, T.; Dash, S.; Tyagi, A.K. Raman studies of chemically and thermally reduced graphene oxide. AIP Conf Proc. 2013, 1512, 1262–1263. [Google Scholar]
  16. Zhang, J.; Yang, H.; Shen, G.; Cheng, P.; Zhang, J.; Guo, S. Reduction of graphene oxide vialascorbic acid. Chem Commun. 2010, 46, 1112–1114. [Google Scholar] [CrossRef]
  17. Zhang, H.; Yu, L.; Li, Q.; Du, Y.; Ruan, S. Reduced graphene oxide/α-Fe2O3 hybrid nanocomposites for room temperature NO2 sensing. Sens. Actuators B Chem. 2017, 241, 109–115. [Google Scholar] [CrossRef]
  18. Stankovich, S.; Dikin, D.A.; Piner, R.D.; Kohlhaas, K.A.; Kleinhammes, A.; Jia, Y.Y.; Wu, Y.; SonBinh, T.N.; Rodney, S.R. Synthesis of graphene-based nanosheets via chemical reduction of exfoliated graphite oxide. Carbon 2007, 45, 1558–1565. [Google Scholar] [CrossRef]
  19. Singh, V.; Joung, D.; Zhai, L.; Das, S.; Khondaker, S.I.; Seal, S. Graphene based materials: Past, present and future. Prog. Mater. Sci. 2011, 56, 1178–1271. [Google Scholar] [CrossRef]
  20. Castro Neto, A.H.; Guinea, F.; Peres, N.M.R.; Novoselov, K.S.; Geim, A.K. The electronic properties of graphene. Rev. Mod. Phys. 2009, 81, 109–162. [Google Scholar] [CrossRef] [Green Version]
  21. Choi, W.; Lahiri, I.; Seelaboyina, R.; Kang, Y.S. Synthesis of graphene and its applications: A review. Crit. Rev. Solid State Mater. Sci. 2010, 35, 52–71. [Google Scholar] [CrossRef]
  22. Montejo-Alvaro, F.; Oliva, J.; Zarate, A.; Herrera-Trejo, M.; Hdz-García, H.M.; Mtz-Enriquez, A.I. Icosahedral transition metal clusters (M13, M = Fe, Ni, and Cu) adsorbed on graphene quantum dots, a DFT study. Phys. E Low Dimens. Syst. Nanostruct. 2019, 110, 52–58. [Google Scholar] [CrossRef]
  23. Kumar, R.; Kaur, A. Chemiresistive gas sensors based on thermally reduced graphene oxide for sensing sulphur dioxide at room temperature. Diam. Relat. Mater. 2020, 109, 108039. [Google Scholar] [CrossRef]
  24. Sanjit, M.M.; Ali, M.; Hyoun, W.K.; Sang, S.K. Reduced Graphene Oxide (rGO)-Loaded Metal-Oxide Nanofiber Gas Sensors: An Overview. Sensors 2021, 21, 1352. [Google Scholar]
  25. Randeniya, L.K.; Shi, H.; Barnard, A.S.; Fang, J.H.; Philip, J.; Martin, K.O. Harnessing the influence of reactive edges and defects of graphene substrates for achieving complete cycle of room-temperature molecular sensing. Small 2013, 9, 3993–3999. [Google Scholar] [CrossRef]
  26. Rumjit, N.P.; Thomas, P.; Lai, C.W.; Wong, Y.H. Review—Recent Advancements of ZnO/rGO Nanocomposites (NCs) for Electrochemical Gas Sensor Applications. J. Electrochem. Soc. 2021, 168, 027506. [Google Scholar] [CrossRef]
  27. Liu, Z.; Yu, L.; Guo, F.; Liu, S.; Qi, L.J.; Shan, M.Y.; Fan, X.H. Facial development of high-performance room temperature NO2 gas sensors based on ZnO nanowalls decorated rGO nanosheets. Appl. Surf. Sci. 2017, 423, 721–727. [Google Scholar] [CrossRef]
  28. Qi, L.J.; Yu, L.M.; Liu, Z.Y.; Guo, F.; Gu, Y.Q.; Fan, X.H. An enhanced optoelectronic NO2 gas sensors based on direct growth ZnO nanowalls in situ on porous rGO. J. Alloys Compd. 2018, 749, 244–249. [Google Scholar] [CrossRef]
  29. Acharyya, D.; Saini, A.; Bhattacharyya, P. Influence of rGO Cladding in Improving the Sensitivity and Selectivity of ZnO Nanoflowers based Alcohol Sensor. IEEE Sens. J. 2018, 18, 1820–1827. [Google Scholar] [CrossRef]
  30. Abdollahi, H.; Samkan, M.; Hashemi, M.M. Fabrication of rGO nano-sheets wrapped on Ni doped ZnO nanowires p-n heterostructure for Hydrogen gas sensing. New J. Chem. 2019, 43, 19253–19264. [Google Scholar] [CrossRef]
  31. Xu, P.; Wang, P.; Wang, Q.; Wei, R.; Li, Y.; Xin, Y.J.; Zheng, T.; Hu, L.M.; Wang, X.J.; Zhang, G. Facile synthesis of Ag2O/ZnO/rGO heterojunction with enhanced photocatalytic activity undersimulated solar light: Kinetics and mechanism. J. Hazard. Mat. 2021, 403, 124011. [Google Scholar] [CrossRef]
  32. Thomas, A.; Jeyaprakash, B.G. Selective detection of ammonia by rGO decorated nanostructured ZnO for poultry and farm field applications. Synth. Met. 2022, 290, 117140. [Google Scholar] [CrossRef]
  33. Tran, K.D.; Nguyen, T.S.; Nguyen, T.L.; Phan, H.P.; Nguyen, N.V.; Le, V.T.; Chu, M.H.; Nguyen, V.D.; Nguyen, D.H.; Nguyen, V.H. Extraordinary H2S gas sensing performance of ZnO/rGO external and internal heterojunctions. J. Alloys Compd. 2021, 879, 160457. [Google Scholar]
  34. Miller, D.R.; Akbar, S.A.; Morris, P.A. Nanoscale metal oxide-based heterojunctions for gas sensing: A review. Sens. Actuators B Chem. 2014, 204, 250–272. [Google Scholar] [CrossRef]
  35. Degler, D.; Weimar, U.; Barsan, N. Current understanding of the fundamental mechanisms of doped and loaded semiconducting metal-oxide-based gas sensing materials. ACS Sens. 2019, 4, 2228–2249. [Google Scholar] [CrossRef] [PubMed]
  36. Cao, P.; Cai, Y.; Pawar, D.; Navale, S.T.; Rao, C.N.; Han, S.; Lu, Y. Down to ppb level NO2 detection by ZnO/rGO heterojunction based chemiresistive sensors. Chem. Eng J. 2020, 401, 125491. [Google Scholar] [CrossRef]
  37. Li, D.L.; Lu, J.F.; Zhang, X.J.; Peng, X.L.; Li, J.; Yang, Y.T.; Hong, B.; Wang, X.Q.; Jin, D.F.; Jin, H.X. Reversible Switching from P- to N-Type NO2 Sensing in ZnO Rods/rGO by Changing the NO2 Concentration, Temperature, and Doping Ratio. J. Phys. Chem. C 2022, 126, 14470–14478. [Google Scholar] [CrossRef]
  38. Hummers, W.S.; Offeman, R.E. Preparation of graphitic oxide. J. Am. Chem. Soc. 1958, 208, 1334–1339. [Google Scholar] [CrossRef]
  39. Wang, H.; Zhou, L.; Liu, Y.; Liu, F.; Liang, X.; Liu, F.; Gao, Y.; Yan, X.; Lu, G. UV-activated ultrasensitive and fast reversible ppb NO2 sensing based on ZnO nanorod modified by constructing interfacial electric field with In2O3 nanoparticles. Sens. Actuators B Chem. 2020, 305, 127498. [Google Scholar] [CrossRef]
  40. Ameen, S.; Akhtar, M.S.; Shin, H.S. Highly sensitive hydrazine chemical sensor fabricated by modified electrode of vertically aligned zinc oxide nanorods. Talanta 2012, 100, 377–383. [Google Scholar] [CrossRef]
  41. Wang, Z.; Gao, S.; Fei, T.; Liu, S.; Zhang, T. Construction of ZnO/SNO2 Heterostructure on Reduced Graphene Oxide for Enhanced Nitrogen Dioxide Sensitive Performances at Room Temperature. ACS Sens. 2019, 4, 2048–2057. [Google Scholar] [CrossRef]
  42. Sun, N.; Tian, Q.Y.; Bian, W.G.; Wang, X.; Dou, H.G.; Li, C.J.; Zhang, Y.C.; Gong, C.Y.; You, X.Y.; Du, X.M.; et al. Highly sensitive and lower detection-limit NO2 gas sensor based on Rh-doped ZnO nanofibers prepared by electrospinning. Appl Surf Sci. 2023, 614, 156213. [Google Scholar] [CrossRef]
  43. Khorramshahi, V.; Karamdel, J.; Yousefi, R. High acetic acid sensing performance of Mg-doped ZnO/rGO nanocomposites. Ceram. Int. 2019, 45, 7034–7043. [Google Scholar] [CrossRef]
  44. Puneetha, J.; Kottam, N.; Rathna, A. Investigation of photocatalytic degradation of crystal violet and its correlation with bandgap in ZnO and ZnO/GO nanohybrid. Inorg. Chem. Commun. 2021, 125, 108460. [Google Scholar]
  45. Rahimi, K.; Yazdani, A.; Ahmadirad, M. Facile preparation of zinc oxide nanorods surrounded by graphene quantum dots both synthesized via separate pyrolysis procedures for photocatalyst application. Mater. Res. Bull. 2018, 98, 148–154. [Google Scholar] [CrossRef]
  46. Ren, H.; Gu, C.; Joo, S.W.; Zhao, J.; Sun, Y.; Huang, J. Effective hydrogen gas sensor based on NiO@rGO nanocomposite. Sens. Actuators B Chem. 2018, 266, 506–513. [Google Scholar] [CrossRef]
  47. Zhao, S.; Shen, Y.; Hao, F.; Kang, C.; Meng, F. P-n junctions based on CuO-decorated ZnO nanowires for ethanol sensing application. Appl. Surf. Sci. 2021, 538, 148140. [Google Scholar] [CrossRef]
  48. Yadav, A.; Gupta, A.; Chauhan, P.S. Reduced graphene oxide based hybrid functionalized films for hydrogen detection: Theoretical and experimental studies. Sens. Int. 2021, 2, 100072. [Google Scholar]
  49. Susan, S.; Mahsa, N.; Seyed, A.Z. Selective and reproducible performance for 1-propanol gas sensor at room temperature. Mater. Chem. Phys. 2021, 271, 124884. [Google Scholar]
  50. Tammanoon, N.; Wisitsoraat, A.; Sriprachuabwong, C.; Phokharatkul, D.; Tuantranont, A.; Phanichphant, S.; Liewhiran, C. Ultrasensitive NO2 sensor based on ohmic metal semiconductor interfaces of electrolytically exfoliated graphene/flame-spray-made SNO2 nanoparticles composite operating at low temperatures. ACS Appl. Mater. Interfaces 2015, 7, 24338–24352. [Google Scholar] [CrossRef]
  51. Li, G.D.; Shen, Y.B.; Zhou, F.; Hao, F.L.; Fang, P.; Wei, D.Z.; Meng, D.; San, X.G. Design and application of highly responsive and selective rGO-SNO2 nanocomposites for NO2 monitoring. Mater. Charact. 2020, 163, 110284. [Google Scholar] [CrossRef]
  52. Zhu, X.Y.; Guo, Y.C.; Ren, H.; Gao, C.; Zhou, Y. Enhancing the NO2 gas sensing properties of rGO/SNO2 nanocomposite films by using microporous substrates. Sens. Actuators B Chem. 2017, 248, 560–570. [Google Scholar] [CrossRef]
Figure 1. XRD patterns of rGO, ZnO, ZnO-0.2 rGO, ZnO-0.8 rGO, ZnO-2.0 rGO.
Nanomaterials 13 00917 g001
Figure 2. SEM images of ZnO antiparticles (a) and ZnO-0.2 rGO (b,c); TEM images of ZnO-0.2 rGO at low (d,e) and high (f) magnification.
Nanomaterials 13 00917 g002
Figure 3. XPS spectra of ZnO-x rGO (x = 0.2, 0.8, 2.0): (a) survey scan spectrum; (b) Zn 2p spectrum; (c) C 1s spectrum; (d) O 1s spectrum.
Nanomaterials 13 00917 g003
Figure 4. (a) UV-vis DRS spectra of ZnO-x rGO (x = 0, 0.1, 0.2, 0.4, 0.6, 0.8, 1.0, 2.0). (b) Graphical estimation of band gap; (c) Varation of band gap with addition of rGO.
Nanomaterials 13 00917 g004
Figure 5. Variation of the sensitivity of the sensors base on the ZnO-x rGO with temperature and addition of rGO toward 4 ppm NO2.
Nanomaterials 13 00917 g005
Figure 6. Response curves of the ZnO-x rGO (x = 0, 0.1, 0.2, 0.4, 0.6) with temperature (100–225 °C) at a concentration of 4 ppm NO2 on the left.
Nanomaterials 13 00917 g006
Figure 7. Correlation between the response of the ZnO-x rGO (x = 0, 0.1, 0.2, 0.4, 0.6) sensor and ratio.
Nanomaterials 13 00917 g007
Figure 8. Dynamic sensing transients of (a) ZnO-0.6% rGO and (b) ZnO-0.8% rGO at 4 ppm to 30−225 °C.
Nanomaterials 13 00917 g008
Figure 9. Dynamic sensing transients of (a) ZnO-1.0% rGO, (b) ZnO-1.2% rGO and (c) ZnO-1.4% rGO at 1 ppm to 30–225 °C.
Nanomaterials 13 00917 g009
Figure 10. (a) response of the ZnO/x% rGO (x = 0.4, 0.6, 0.8, 1.0, 2.0, 3.0, 4.0) to 4 ppm at 30–100 °C; (b) Response curves of the ZnO/x% rGO (x = 0.6, 0.8, 1.0, 2.0, 3.0, 4.0) in the subsidiary vignette.
Nanomaterials 13 00917 g010
Figure 11. Temperature dependence of recovery time of ZnO-1.0% rGO and ZnO-1.2% rGO at 1 ppm NO2 gas concentration.
Nanomaterials 13 00917 g011
Figure 12. Response of sensors based on the ZnO-x rGO (x = 0.1, 0.2, 0.4, 0.6, 0.8, 1.0, 2.0, 3.0, 4.0) to 4 ppm NO2 gas at different temperature (30–225 °C).
Nanomaterials 13 00917 g012
Scheme 1. Mechanism diagram of temperature and NO2 gas affecting material sensitivity.
Nanomaterials 13 00917 sch001
Scheme 2. Three conductive paths: (a) Conducting through ZnO; (b) Conducting through ZnO and rGO; (c) Conducting through rGO.
Nanomaterials 13 00917 sch002
Scheme 3. Variation of the response with the rGO doping ratio in consideration of np–n/nrGO: (a) the region of the n-type response increasing with rGO loading; (b) the region of the n-type response decreasing with rGO loading; (c) the region of switching from n- to p-Type; (d) the region of the p-type response. np–n: The amount of p–n junction; nrGO: the amount of rGO; (↑↑) increases faster than (↑).
Nanomaterials 13 00917 sch003
Disclaimer/Publisher’s Note: The statements, opinions and data contained in all publications are solely those of the individual author(s) and contributor(s) and not of MDPI and/or the editor(s). MDPI and/or the editor(s) disclaim responsibility for any injury to people or property resulting from any ideas, methods, instructions or products referred to in the content.

