Article

MoO3/S@g-C3N4 Nanocomposite Structures: Synthesis, Characterization, and Hydrogen Catalytic Performance

by
Alhulw H. Alshammari
*,
Majed Alshammari
,
Sultan Alhassan
,
Khulaif Alshammari
,
Turki Alotaibi
and
Taha Abdel Mohaymen Taha
Physics Department, College of Science, Jouf University, Sakaka P.O. Box 2014, Saudi Arabia
*
Author to whom correspondence should be addressed.
Nanomaterials 2023, 13(5), 820; https://doi.org/10.3390/nano13050820
Submission received: 1 February 2023 / Revised: 14 February 2023 / Accepted: 21 February 2023 / Published: 23 February 2023

Abstract

:
Hydrogen production as a source of clean energy is high in demand nowadays to avoid environmental issues originating from the use of conventional energy sources i.e., fossil fuels. In this work and for the first time, MoO3/S@g-C3N4 nanocomposite is functionalized for hydrogen production. Sulfur@graphitic carbon nitride (S@g-C3N4)-based catalysis is prepared via thermal condensation of thiourea. The MoO3, S@g-C3N4, and MoO3/S@g-C3N4 nanocomposites were characterized using X-ray diffraction (XRD), Fourier transform infrared spectroscopy (FTIR), Field Emission Scanning Electron Microscope (FESEM), STEM, and spectrophotometer. The lattice constant (a = 3.96, b = 13.92 Å) and the volume (203.4 Å3) of MoO3/10%S@g-C3N4 were found to be the highest compared with MoO3, MoO3/20-%S@g-C3N4, and MoO3/30%S@g-C3N4, and that led to highest band gap energy of 4.14 eV. The nanocomposite sample MoO3/10%S@g-C3N4 showed a higher surface area (22 m2/g) and large pore volume (0.11 cm3/g). The average nanocrystal size and microstrain for MoO3/10%S@g-C3N4 were found to be 23 nm and −0.042, respectively. The highest hydrogen production from NaBH4 hydrolysis ~22,340 mL/g·min was obtained from MoO3/10%S@g-C3N4 nanocomposites, while 18,421 mL/g·min was obtained from pure MoO3. Hydrogen production was increased when increasing the masses of MoO3/10%S@g-C3N4.

1. Introduction

The use of conventional energy sources, i.e., fossil fuels, has led to the global climate change crisis, which has become a serious environmental issue [1,2]. The negative impact of using such energy sources resides in their emissions of toxic gases such as NOX, COX, and SOX. Exposure to these gases at certain concentrations may cause serious health issues in humans and animals [3,4,5]. Therefore, people have been stimulated to use renewable energy sources like solar cells and hydrogen production, aiming to maintain the stability of the environment [1,2,6]. Solar cells have been used for the conversion of sunlight to power. The efficiency of solar cells is limited to the condition of the weather, hence, the solar cell produces more power on a sunny day compared with a cloudy day. In addition, the power generated by the solar cells must be stored in batteries to be used whenever needed. Economically, generating power from solar cells is not favorable due to their low efficiency and high cost of energy storage. Therefore, hydrogen production has superior proprieties to solar cells, and so it becomes a hotspot topic nowadays. Hydrogen exists in nature as an abundant element i.e., water [7].
Nanomaterials have a significantly large surface area to volume ratio due to their small dimensions. The surface properties of nanomaterials will have an impact on the entire material, particularly when their sizes are comparable in terms of length [2,6]. Thus, the properties of the bulk materials can be improved upon or modified. Since a pioneer study that was published in 1972 about the use of TiO2 electrodes for water splitting into hydrogen [8], many photocatalytic studies have been conducted for hydrogen production using nanomaterials i.e., metal oxides, carbon nitride, nanosheets doped with sulfur, graphitic carbon nitride (GCN), conjugated polymers, etc. [9,10,11]. Graphitic carbon nitride is a layered substance made of carbon and nitrogen atoms. Simple thermal condensation of urea, thiourea, and melamine into anodic alumina templates is used to synthesize GCN nanostructures. The high thermal stability of the GCN structures extends to 600 °C and these structures are highly chemically stable when exposed to acid, base, and organic solvent attacks. The band gap of these materials is approximately 2.7 eV [12]. Additionally, these materials are promising materials for fuel cells, photocatalysis, heterogeneous catalysis, light emitting devices, and surface modification [12,13].
There are several study reports on the preparatory, structural, optical, and many other characteristics of metal nanocomposites, as well as their applications in various fields. Building nanocomposite structures with distinctive morphologies and large surface areas is a frequent structural engineering technique for presenting more active sites.
Material composites such as Molybdenum disulfide MoS2/graphene as co-catalytic to TiO2 have achieved a high rate of hydrogen production ~165.3 μmol h−1 [14]. Molybdenum Oxide (MoO3) is known to be environmentally friendly, inexpensive, and own high activity, therefore it has been extensively used for electrocatalysis [1,15,16]. On other hand, the use of MoO3 for hydrogen production has limitations during HER electrocatalyst because of its strong Molybdenum and Hydrogen (Mo-H) bond, which highly resists hydrogen adsorption and indeed has a negative impact on hydrogen production [1,17,18]. Therefore, developing new strategies to decrease the adsorption of hydrogen on the sites of Mo metal is highly needed to improve the MoO3 catalytic process. Recently, various methods have been conducted to resolve the issue of catalytic activity when producing a robust electrode, for instance, the design of interface structure, defect engineering, and doping metal with anion and cation [19,20,21,22,23]. Doping the composition with suitable ions is the most effective and common method because it leads to structural improvement. Therefore, doping the MoO3 with anion elements can reduce its density states and lead to weak Mo-H bonding during the HER electrocatalyst [24,25]. Moreover, doping the MoO3 with cations has enhanced its electronic structure, that it led to the kinetics expedition of the HER catalytic reaction. The catalytic activity and the surface area of the MoO3 nanosheet in the alkaline medium, when doped with copper (Cu) atom, have been enhanced [1]. In addition, the electron–hole recombination of MoO3 typically leads to low photocatalytic efficiency, therefore coating the MoO3 with suitable materials delays the electron–hole recombination. Recently, semiconducting materials like g-C3N4 have been used to overcome the photocatalytic issues for other nanocomposites. For example, g-C3N4/TaON [26], g-C3N4/ZnO [27], and g-C3N4/Bi2WO6 [28] because it has remarkable photocatalytic performance [29,30]. The g-C3N4 is a soft polymeric semiconductor, which can be readily coated on other nanocomposites.
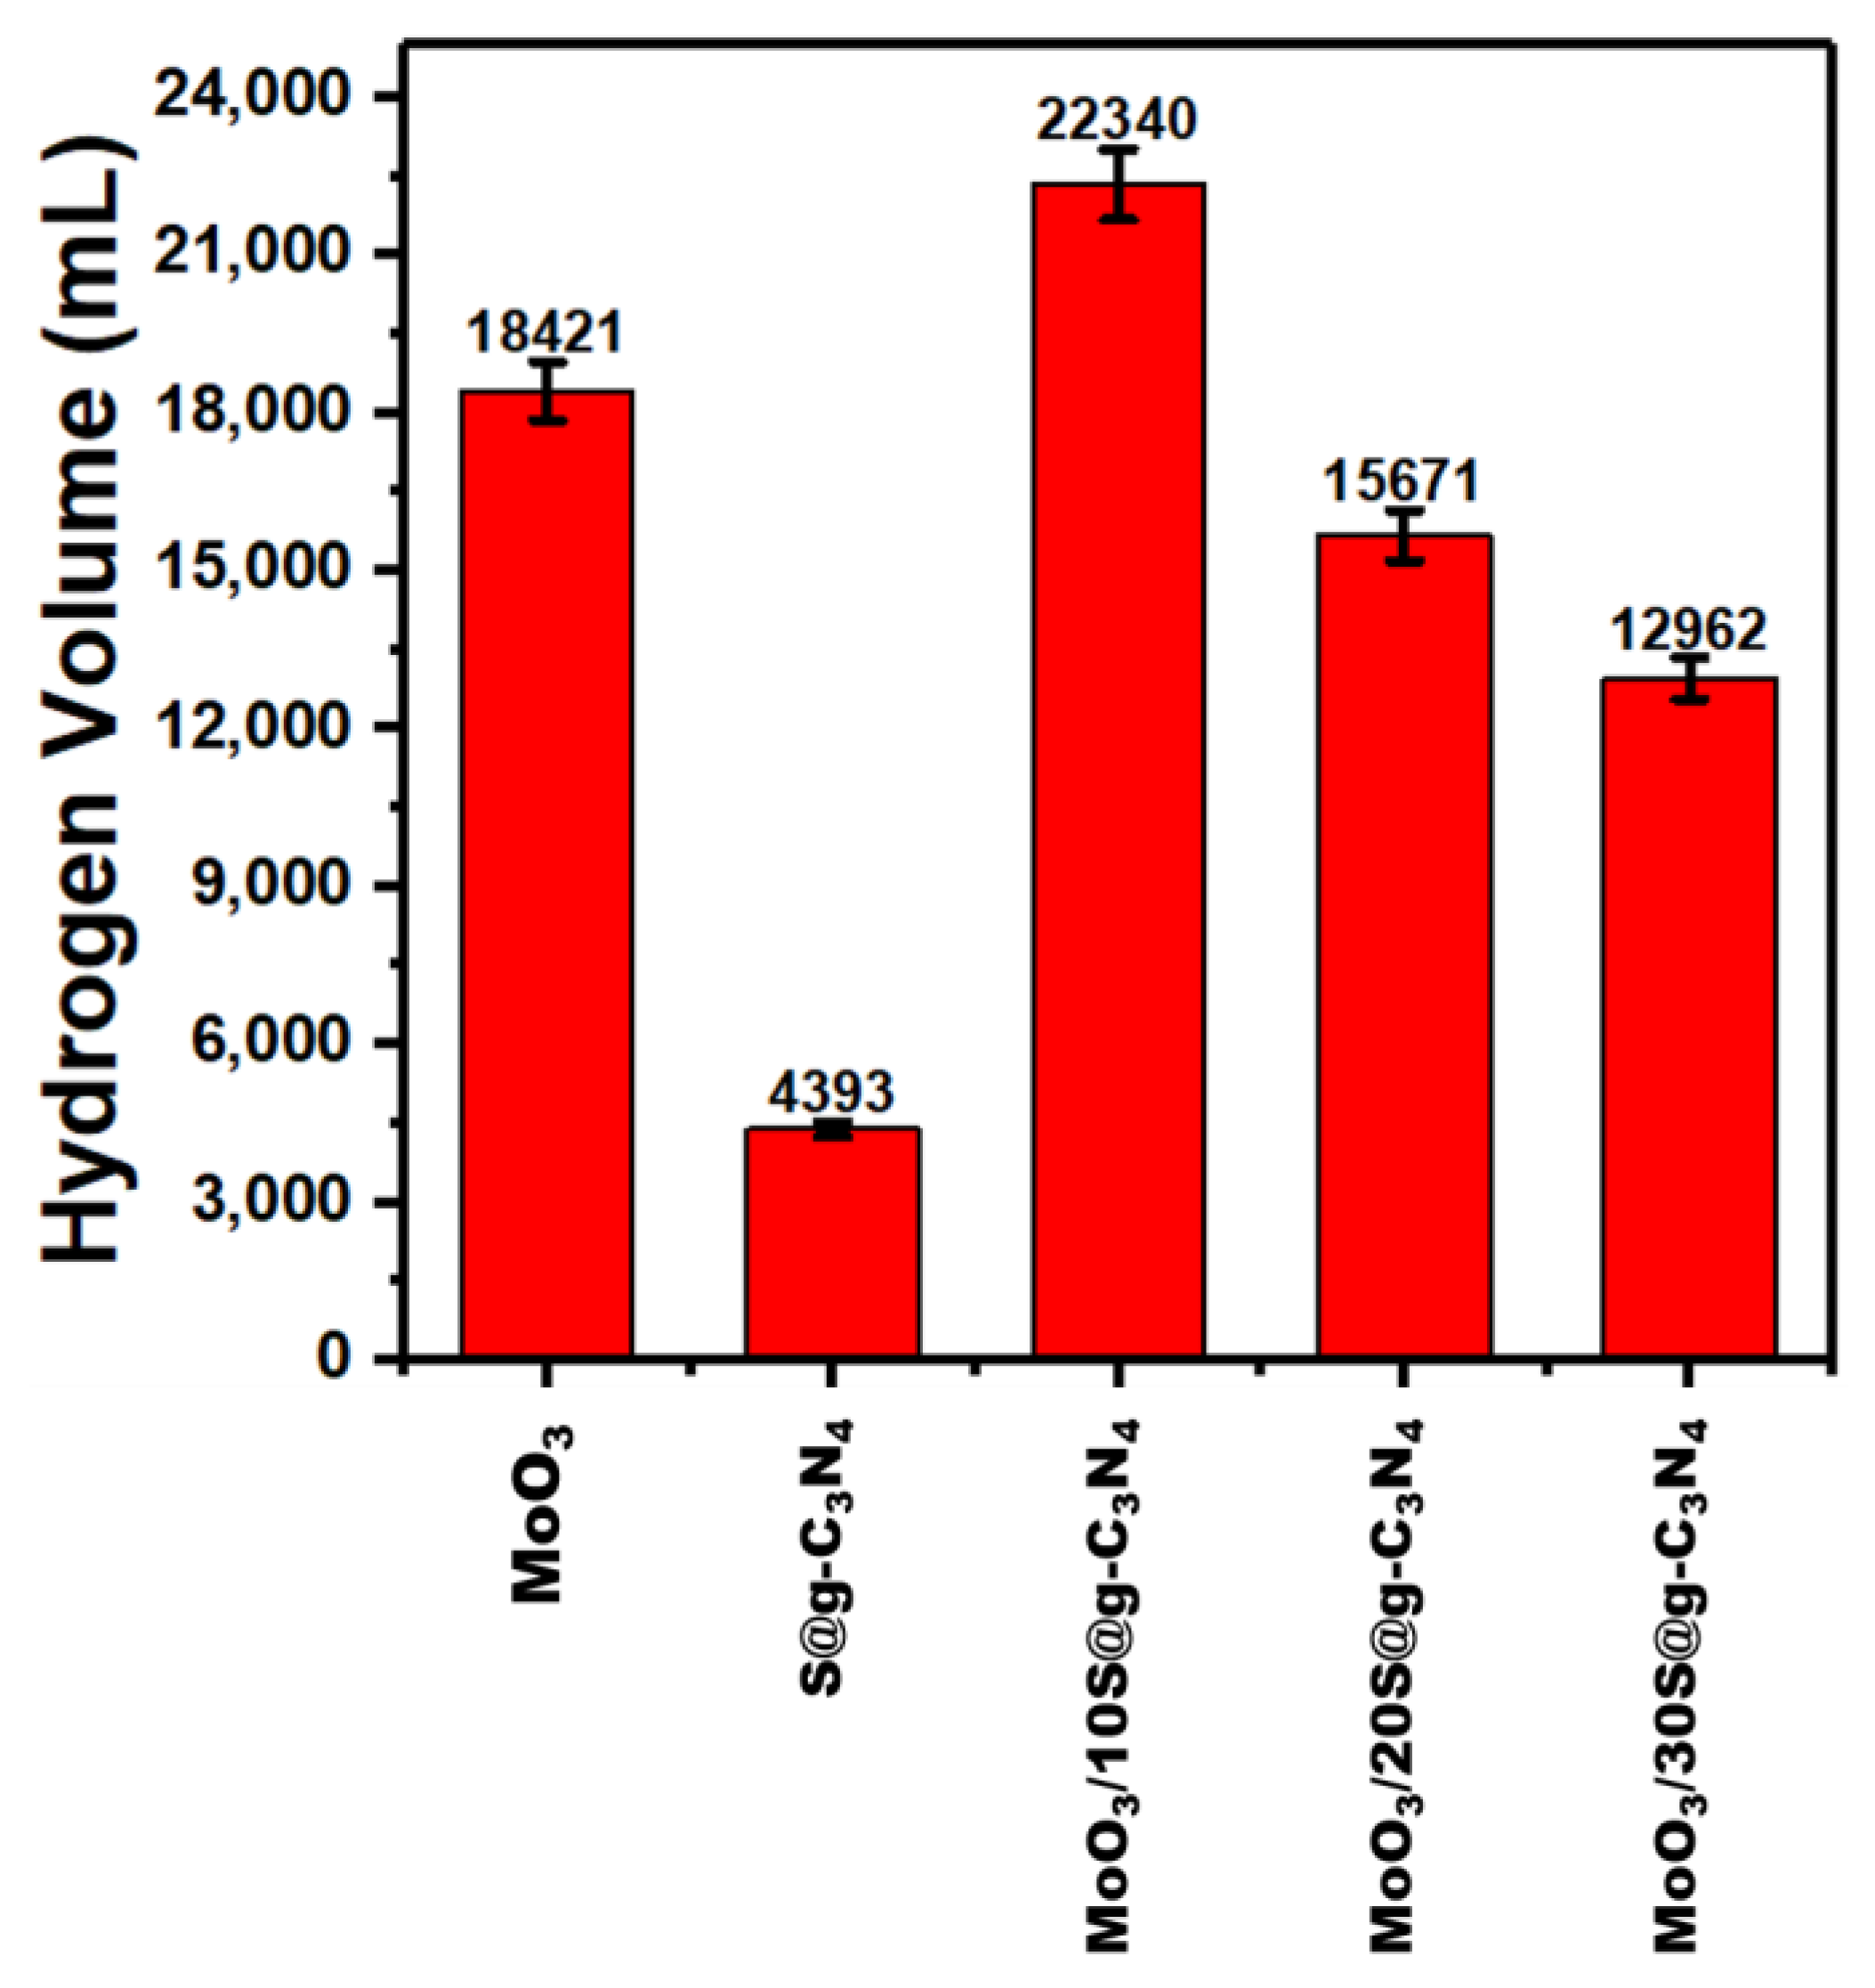
Therefore, in this work, the MoO3/S@g-C3N4 is functionalized for hydrogen production. When S@g-C3N4 and MoO3 were combined, the S@g-C3N4 was coated on the surface of MoO3 and turned to be positively charged. In addition to that, the combination of MoO3 and S@g-C3N4 has led to a large band gap energy of ~4.14 eV. These outcomes delayed electron–hole recombination, which enhanced its photocatalytic performance and increased hydrogen production. The highest hydrogen production from NaBH4 hydrolysis ~22,340 mL/g·min was obtained from MoO3/10-S@g-C3N4 nanocomposites while 18,421 mL/g·min was obtained from pure MoO3.

2. Experimental

2.1. Chemicals and Reagents

Thiourea and extra pure sodium borohydride were provided from Loba Chemie, Mumbai, India. MoO3 nanopowder, ethanol absolute, and methanol absolute were supplied from Sigma-Aldrich, Darmstadt, Germany.

2.2. Nanocomposite Preparation

Sulfur@carbon nitride nanosheet was prepared via thermal condensation. 15 g of thiourea are inserted into a porcelain crucible and heated at 550 °C for 2 h at a heating rate of 3.0 °C/min. The crucible was taken from the furnace and the yellow powder was washed with distilled water.
MoO3/S@g-C3N4 catalyst nanocomposites were prepared with different proportions of carbon nitride. The powders of MoO3 (90, 80, 70 wt%) and S@g-C3N4 (10, 20 and 30 wt%) were mixed in ethanol for 1 h on a magnetic stirrer at 300 K. Then, the solution was subjected to an ultrasonic bath for 1 h. After that, the solution was dried at 100 °C overnight. The obtained powder was ground very well for 30 min.

2.3. Characterization of Nanocomposite

An effective method for determining the crystalline structure based on the interaction of materials and electromagnetic radiation is the XRD analysis. The data of XRD spectra were conducted using a Shimadzu diffractometer (XRD 7000, Kyoto, Japan). Software can be employed to index the crystal structures of samples by comparing the obtained XRD patterns to the crystalline database. Identification of the functional groups in the material can be completed with the use of FTIR spectroscopy. The ATR spectra were obtained using a Shimadzu spectrometer (FTIR–Tracer 100, Kyoto, Japan). The scanning electron microscope is a tool for the morphological analysis of materials that scans the surface with a focused electron beam. FESEM micrographs were recorded on the Quattro ESEM’s environmental scanning electron microscope (Thermo Fisher Scientific, Waltham, MA, United States). The samples were placed on carbon tape and their surface was coated with gold. STEM microscopy analysis was completed on a Talos F200i TEM/STEM electron microscope (Thermo Fisher Scientific, Waltham, MA, USA). In order to investigate the physical characteristics of porous materials, such as specific surface area, pore size distribution, and pore volume, we have completed N2 sorption/desorption analysis. NOVA 4200e chemo-physisorption surface area analyzer was used to get the conventional N2 adsorption isotherms point-by-point by measuring the quantity of nitrogen adsorbed and the equilibrium pressure at 77 K. The samples were initially outgassed for a continuous 24 h at 150 °C and 1 millitorr vacuum. The sample is cleaned and ready for the collection of adsorption data after this outgassing procedure. The UV-Vis analysis is an important technique for determining a semiconductor band gap and for analyzing a photocatalyst capacity for absorption. The optical absorption spectroscopy data were conducted on a Thermo Scientific Evolution 200 UV-Vis spectrophotometer (Waltham, MA, USA). The samples were dissolved in distilled water via ultrasonic waves to get a suspension.

2.4. Hydrogen Catalytic Performance

Catalytic hydrogen evolution at room temperature was used to assess the catalytic activity of the prepared composites. The hydrogen catalytic tests were completed in a 250 mL conical flask with 0.25 g of NaBH4 solution that was hydrolyzed with 10.0 mL methanol. The reaction temperature for the system was constant as the glass flask was placed in a water bath. No stirring was employed in the reaction flask. The temperature of the water bath was kept constant at 25 °C. The masses of catalyst and NaBH4 were mixed very well and then inserted into the conical flask. After that, 10 mL methanol was added to the glass flask and the stopwatch started simultaneously. The volume of generated hydrogen gas was measured by measuring the displacement of the water level in the burette.

3. Results and Discussion

3.1. XRD Analysis

The XRD patterns’ peaks of nanocomposites MoO3, S@g-C3N4, and MoO3/S@g-C3N4 are shown in Figure 1a. The diffraction peaks correspond to (020), (110), (021), (120), (400), (060), and (622) planes with peak positions at 2θ = 12.8°, 23.4°, 25.6°, 27.4°, 33.8°, 39.2°, and 49.4°, respectively. All of the peaks of MoO3 belong to data of the orthorhombic structure according to JCPDF card number (35-0609) [31]. The average nanocrystal size of MoO3/S@g-C3N4 was calculated as shown in Table 1, using the Scherer equation [32,33,34]:
D = 0.9 λ β cos θ
where λ is the X-ray radiation of wavelength and β is the full width at half maximum.
The S@g-C3N4 diffraction peaks at 27.5° and 13.02° correspond to the (002) and (100) planes, which is consistent with the interplanar staking peaks characteristic of aromatic systems and the inter-layer structure packing, respectively [35]. In the case of MoO3/S@g-C3N4 composites, however, the S@g-C3N4 diffraction peaks are not clearly recognized. This outcome indicates that S@g-C3N4 nanosheets coat the surface of the MoO3 nanocrystal. All of the diffraction peaks of MoO3/S@g-C3N4 composites are observed to shift from 27.2° to 27.4° with different S@g-C3N4 concentrations, and this is a result of the two lines overlapping. Consequently, the different concentration of S@g-C3N4 in the expanded XRD diffraction pattern confirms the coexistence of MoO3 and g-C3N4 in the MoO3/S@g-C3N4 composites. Moreover, the less-ordered crystalline structure of S@g-C3N4 is expected to show an intense thermal etching process with many defects, which is intended to improve catalytic activity.
The plots obtained by the Rietveld refinement of MoO3, MoO3/10%S@g-C3N4, MoO3/20S@g-C3N4, and MoO3/30S@g-C3N4 are shown in Figure 1b–d. Crystallography open database (COD) was used to find matching reference patterns, which were used to set the initial values for space group, cell parameters, and atom coordinates. The background was improved by applying the cosine Fourier series with six different coefficients that could be modified, and the Bragg reflection profile was characterized by the Thompson-Cox-Hastings pseudo-Voigt function. Several factors were refined, including unit cell parameters, scale factor, structure factor, occupancy, position parameters, etc. The observed and calculated diffractograms are in good agreement for both types of synthesis processes, as shown in Figure 1c,d. Also, Table 1 provides an overview of the comparison of lattice parameters and quality of fit. It is crucial to note that there is a change in lattice parameters for the MoO3/10%S@g-C3N4 sample when compared to other concentrations of wt% S@g-C3N4; an increase in lattice constants that can be ascribed to the S@g-C3N4 doping on MoO3 structure. In particular, an increase in the value of the lattice constant “b” was found at 10 wt% MoO3/S@g-C3N4 concentration and a decrease in the lattice parameter “b” was observed for samples containing 20 wt% and 30 wt% of S@g-C3N4. The decrease in the lattice parameter “b” suggests that the MoO3 crystal structure is under compression [36]. Previous work has shown that the lattice parameter can be increased due to the oxygen vacancies, and that might be decreased by raising the annealing temperature, which decreases oxygen vacancies and enhances crystallinity [37,38,39].

3.2. FTIR Structure Analysis

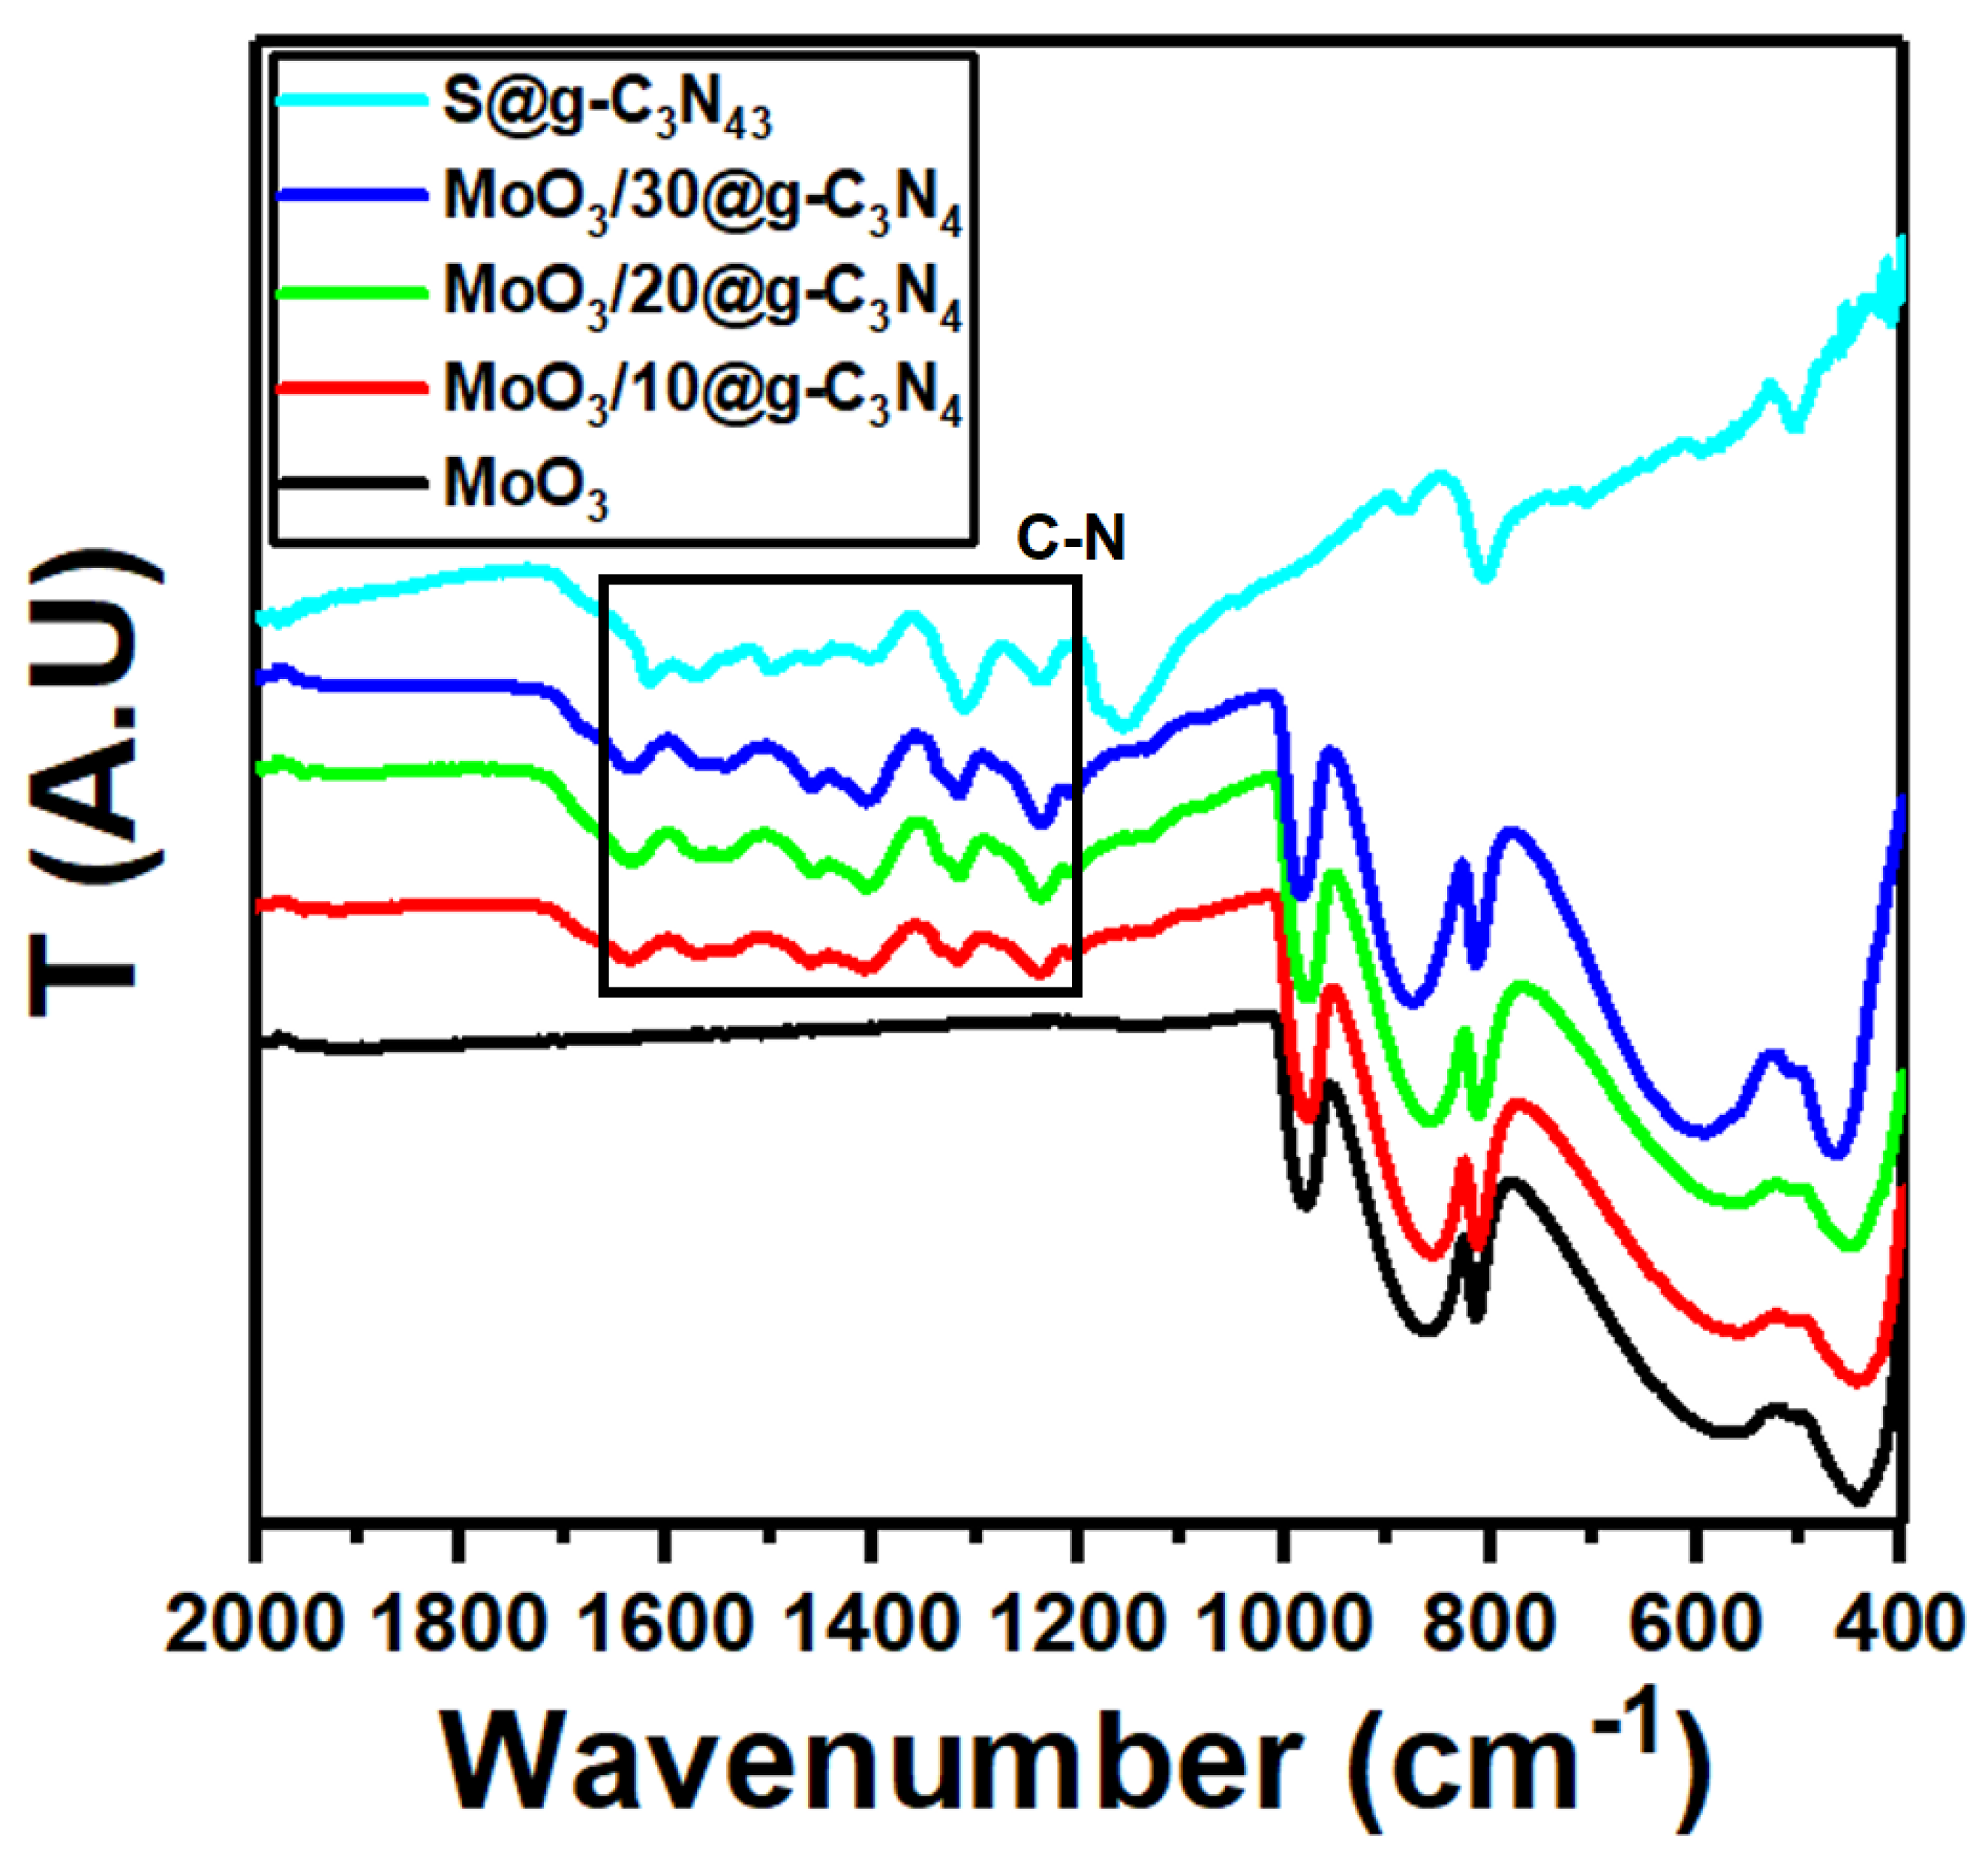
The FT-IR spectra of MoO3, S@g-C3N4, and different concentrations of MoO3/S@g-C3N4 composites are shown in Figure 2. The peak at 1643 cm−1 for pure S@g-C3N4 is attributable to C=N stretching vibration modes, while the peaks at 1242, 1322, 1405 cm−1, and 1563 cm−1 are correlated with aromatic C-N stretching [40,41]. The band at 809 cm−1 corresponds to the C-N heterocycles with out-of-plane bending modes [42]. The vibrations in pure MoO3 appeared at approximately 561, 866, and 990 cm−1, which are formed by the oxygen stretching mode associated with three metal atoms, the oxygen stretching mode in the Mo-O-Mo units, and the Mo=O stretching mode, respectively [43,44]. The characteristic vibrations for MoO3 and S@g-C3N4 persist in MoO3/S@g-C3N4 composites and the absorption bands in MoO3/S@g-C3N4 slightly enhanced as the S@g-C3N4 concentration increases. These outcomes agree with the XRD structural data.

3.3. ESEM and STEM Microscopy

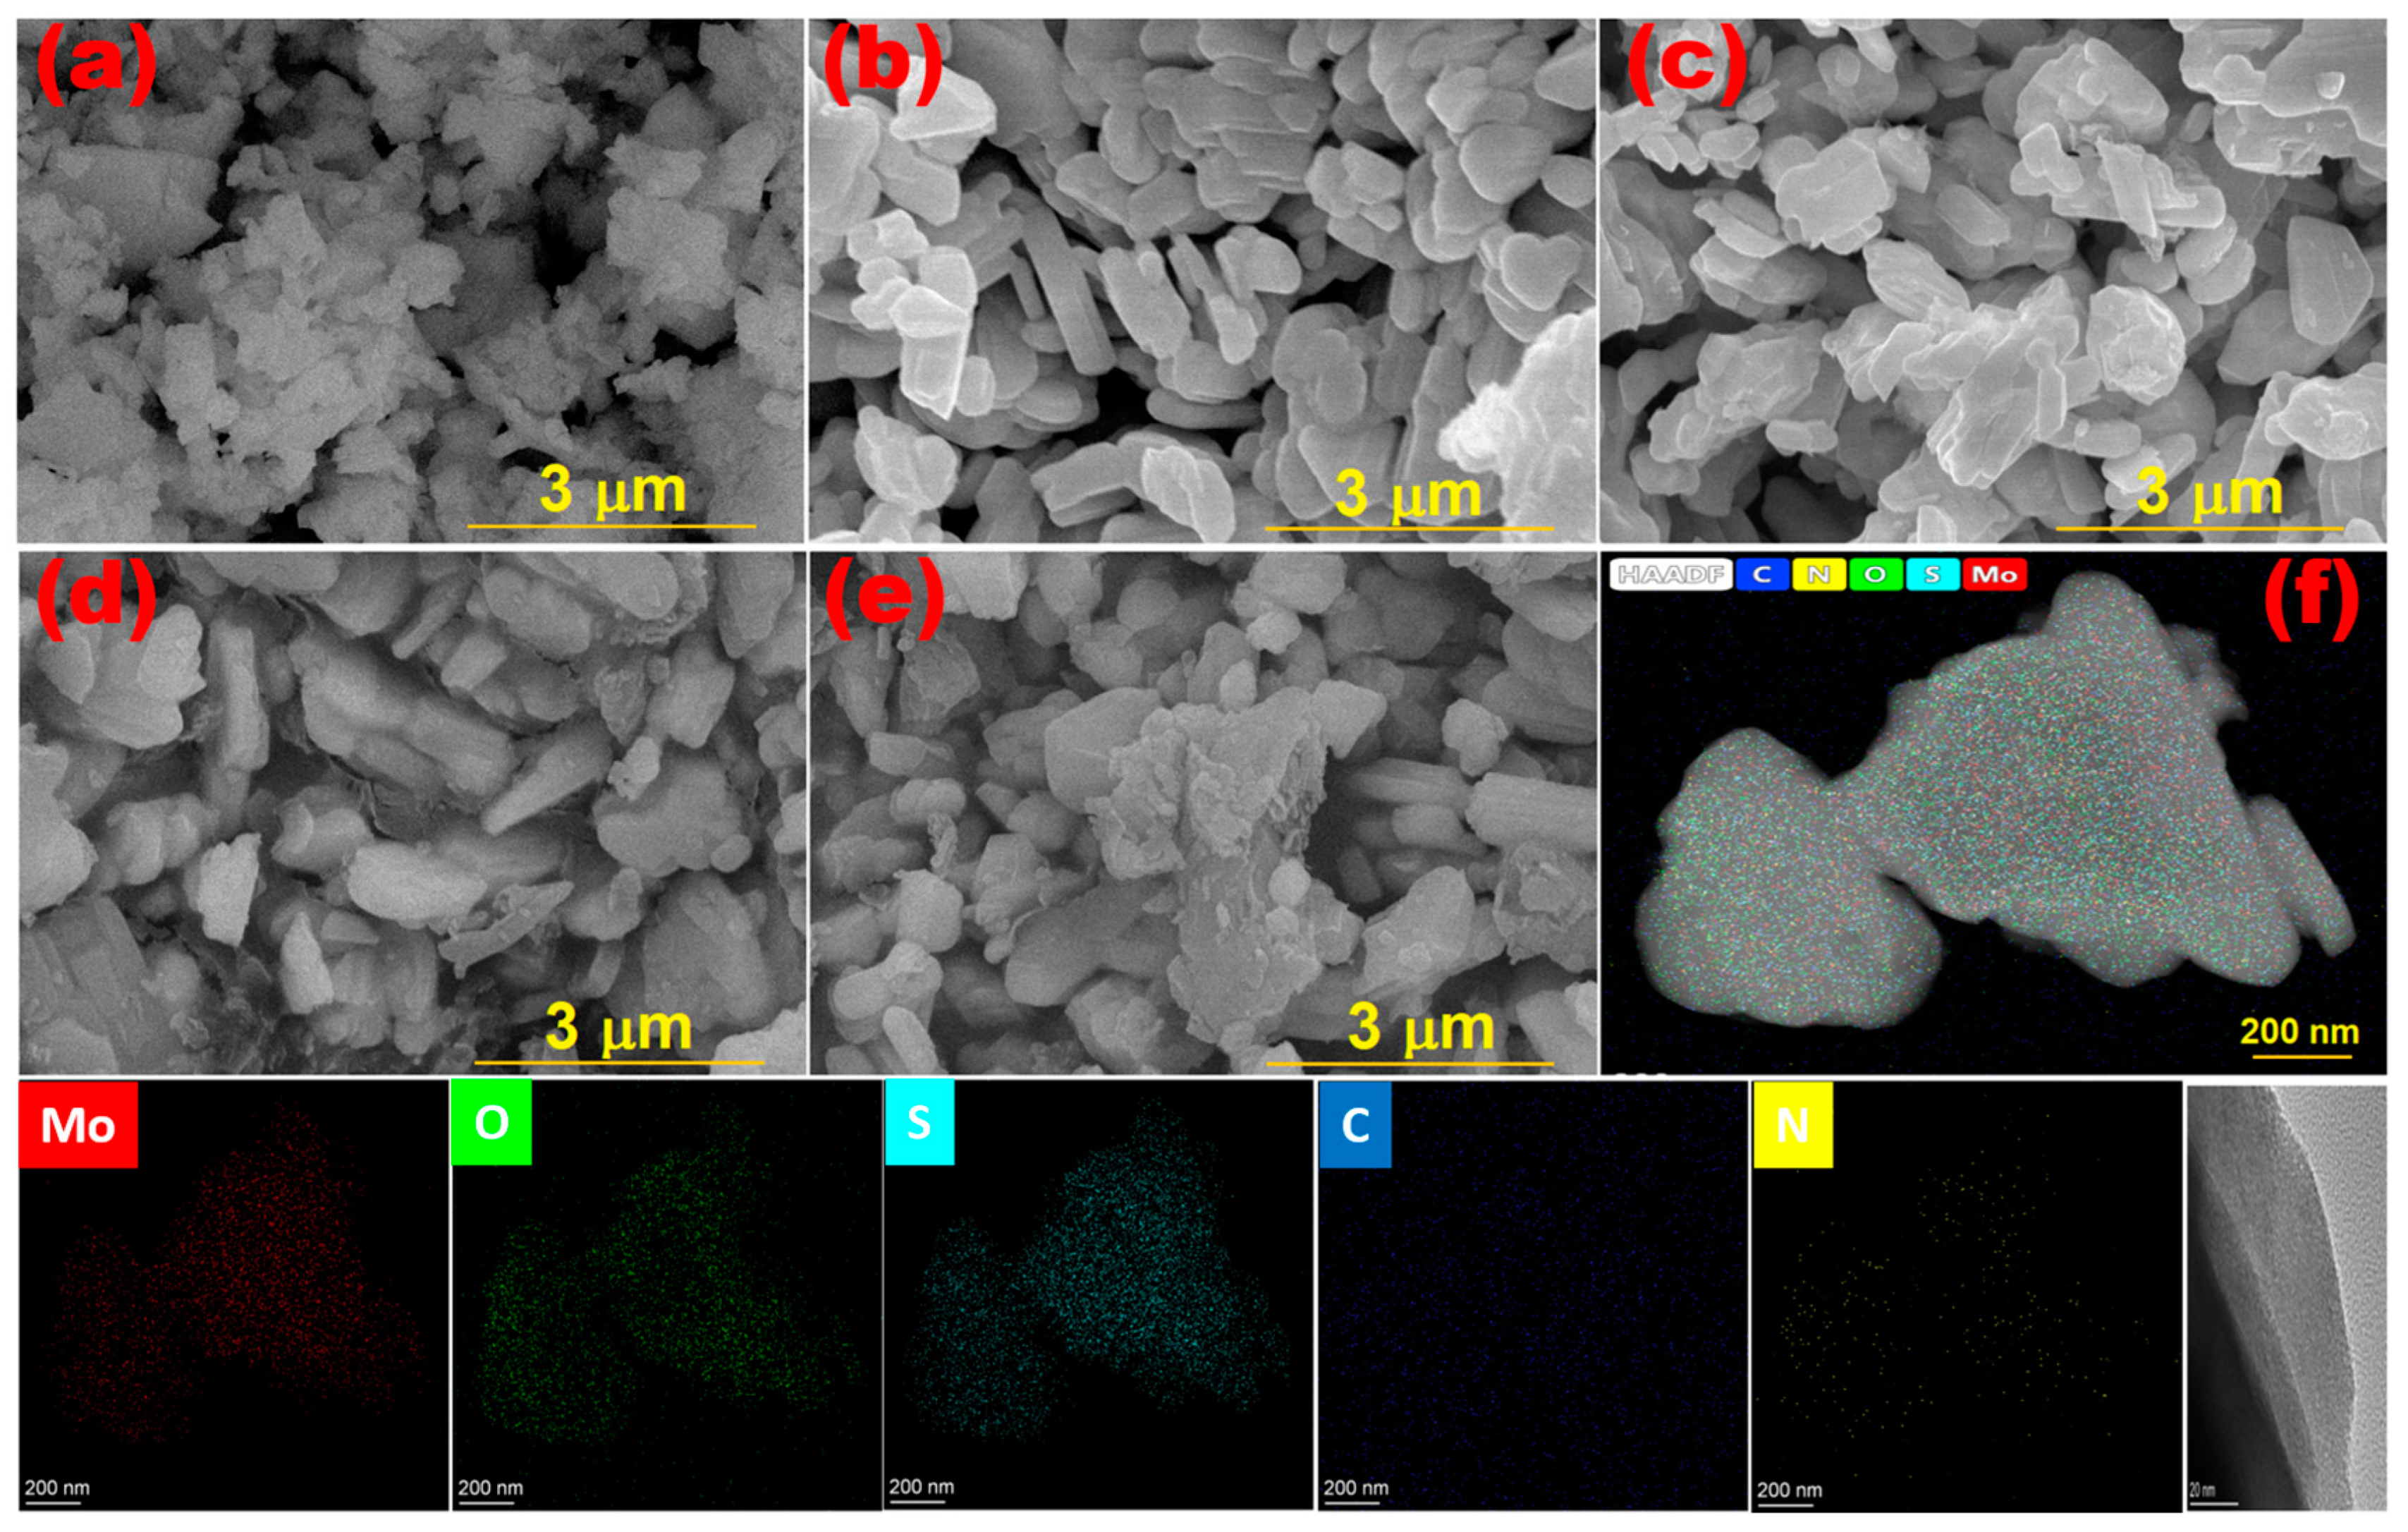
The morphology of materials composites enhances the understanding of their microstructure and contributes to the identification of suitable applications. Therefore, the surfaces of the MoO3/S@g-C3N4 nanocomposites were scanned using the FESEM microscope and the images were collected in Figure 3a–e. The S@g-C3N4 shown in Figure 3a takes the form of scattered flakes because of the sticky layers [45]. While the micrograph for MoO3 nanocrystals showed orthorhombic shapes (Figure 3b). In the images of MoO3/S@g-C3N4 nanocomposites (Figure 3c–e), MoO3 crystals appear wrapped with thin random flakes of carbon nitride. Moreover, the thickness of the S@g-C3N4 layers increases with increasing content from 10 to 30%. These observations are evidence of the strong interaction between MoO3 and S@g-C3N4.
In Figure 3f, a STEM image of the MoO3/10%S@g-C3N4 was shown and the formation of the sticky flakes coating the surface of MoO3 was confirmed. It also showed the mapping of Mo, oxygen, sulfur, carbon, and nitrogen atoms. The distribution of elements is homogeneous and thus confirms the formation of the nanocomposite. Moreover, the STEM image confirms the scans of SEM.

3.4. Surface Area and Pore Size

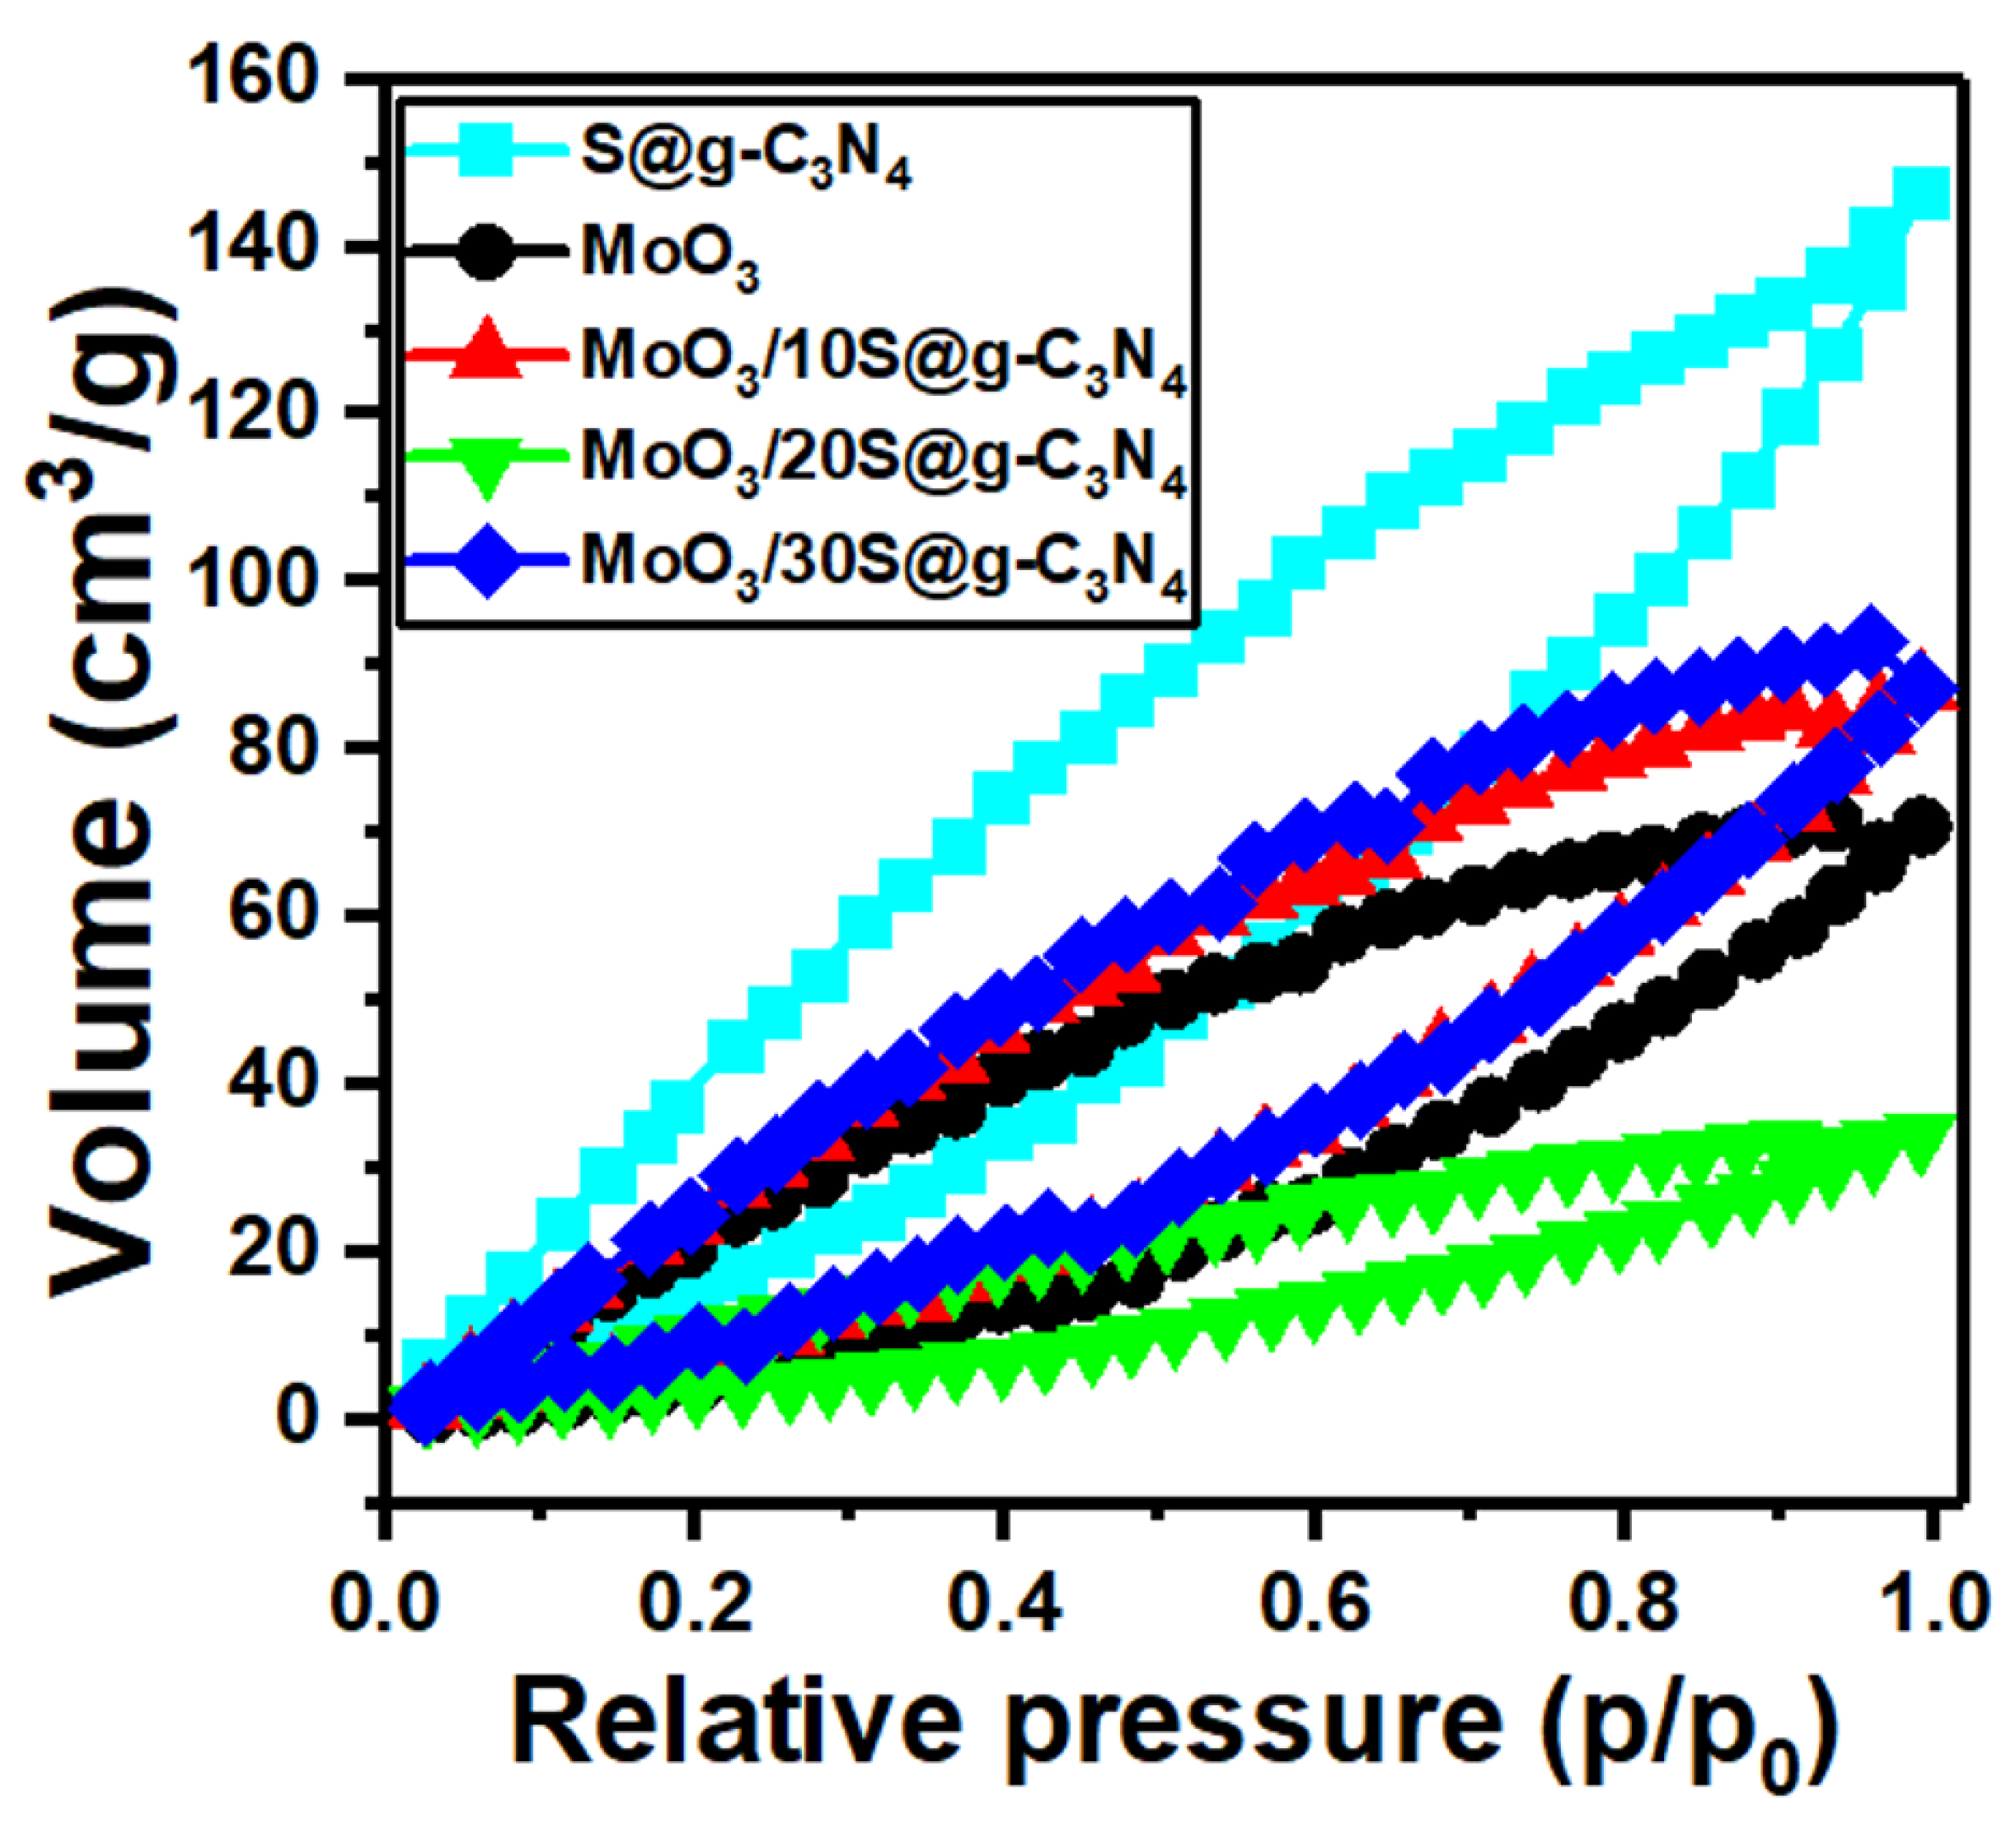
The adsorption−desorption isotherms for the MoO3/S@g-C3N4 nanocomposites are displayed in Figure 4. These isotherms belong to type IV mesoporous materials. The surface area of samples is often determined using a traditional Brunauer-Emmet-Teller (BET) model. Moreover, the surface area BET for these nanocomposites was determined. The surface area values are 40.0, 19.0, 22, 9.0, and 2.5 m2/g for the samples S@g-C3N4, MoO3, MoO3/10%S@g-C3N4, MoO3/20%S@g-C3N4, and MoO3/30%S@g-C3N4, respectively.
The nanocomposite sample MoO3/10%S@g-C3N4 revealed a higher surface area. The increased surface area promotes the reaction rate simply by introducing more active sites to the reactants. The BJH pore volume data were 0.18, 0.1, 0.11, 0.04, and 0.01 cm3/g for the samples S@g-C3N4, MoO3, MoO3/10%S@g-C3N4, MoO3/20%S@g-C3N4, and MoO3/30%S@g-C3N4, respectively. Accordingly, the nanocomposite sample MoO3/10%S@g-C3N4 showed a higher surface area and large pore volume. Large pore volumes work in a different way, in that larger pore volumes can offer more interior voids as nano-reactors to physically confine the reactants in specific areas, enhance active species concentrations, and therefore dynamically promote mass transfer. Therefore, this sample contains more active sites and has a high adsorption capacity.

3.5. UV-Vis Spectroscopy

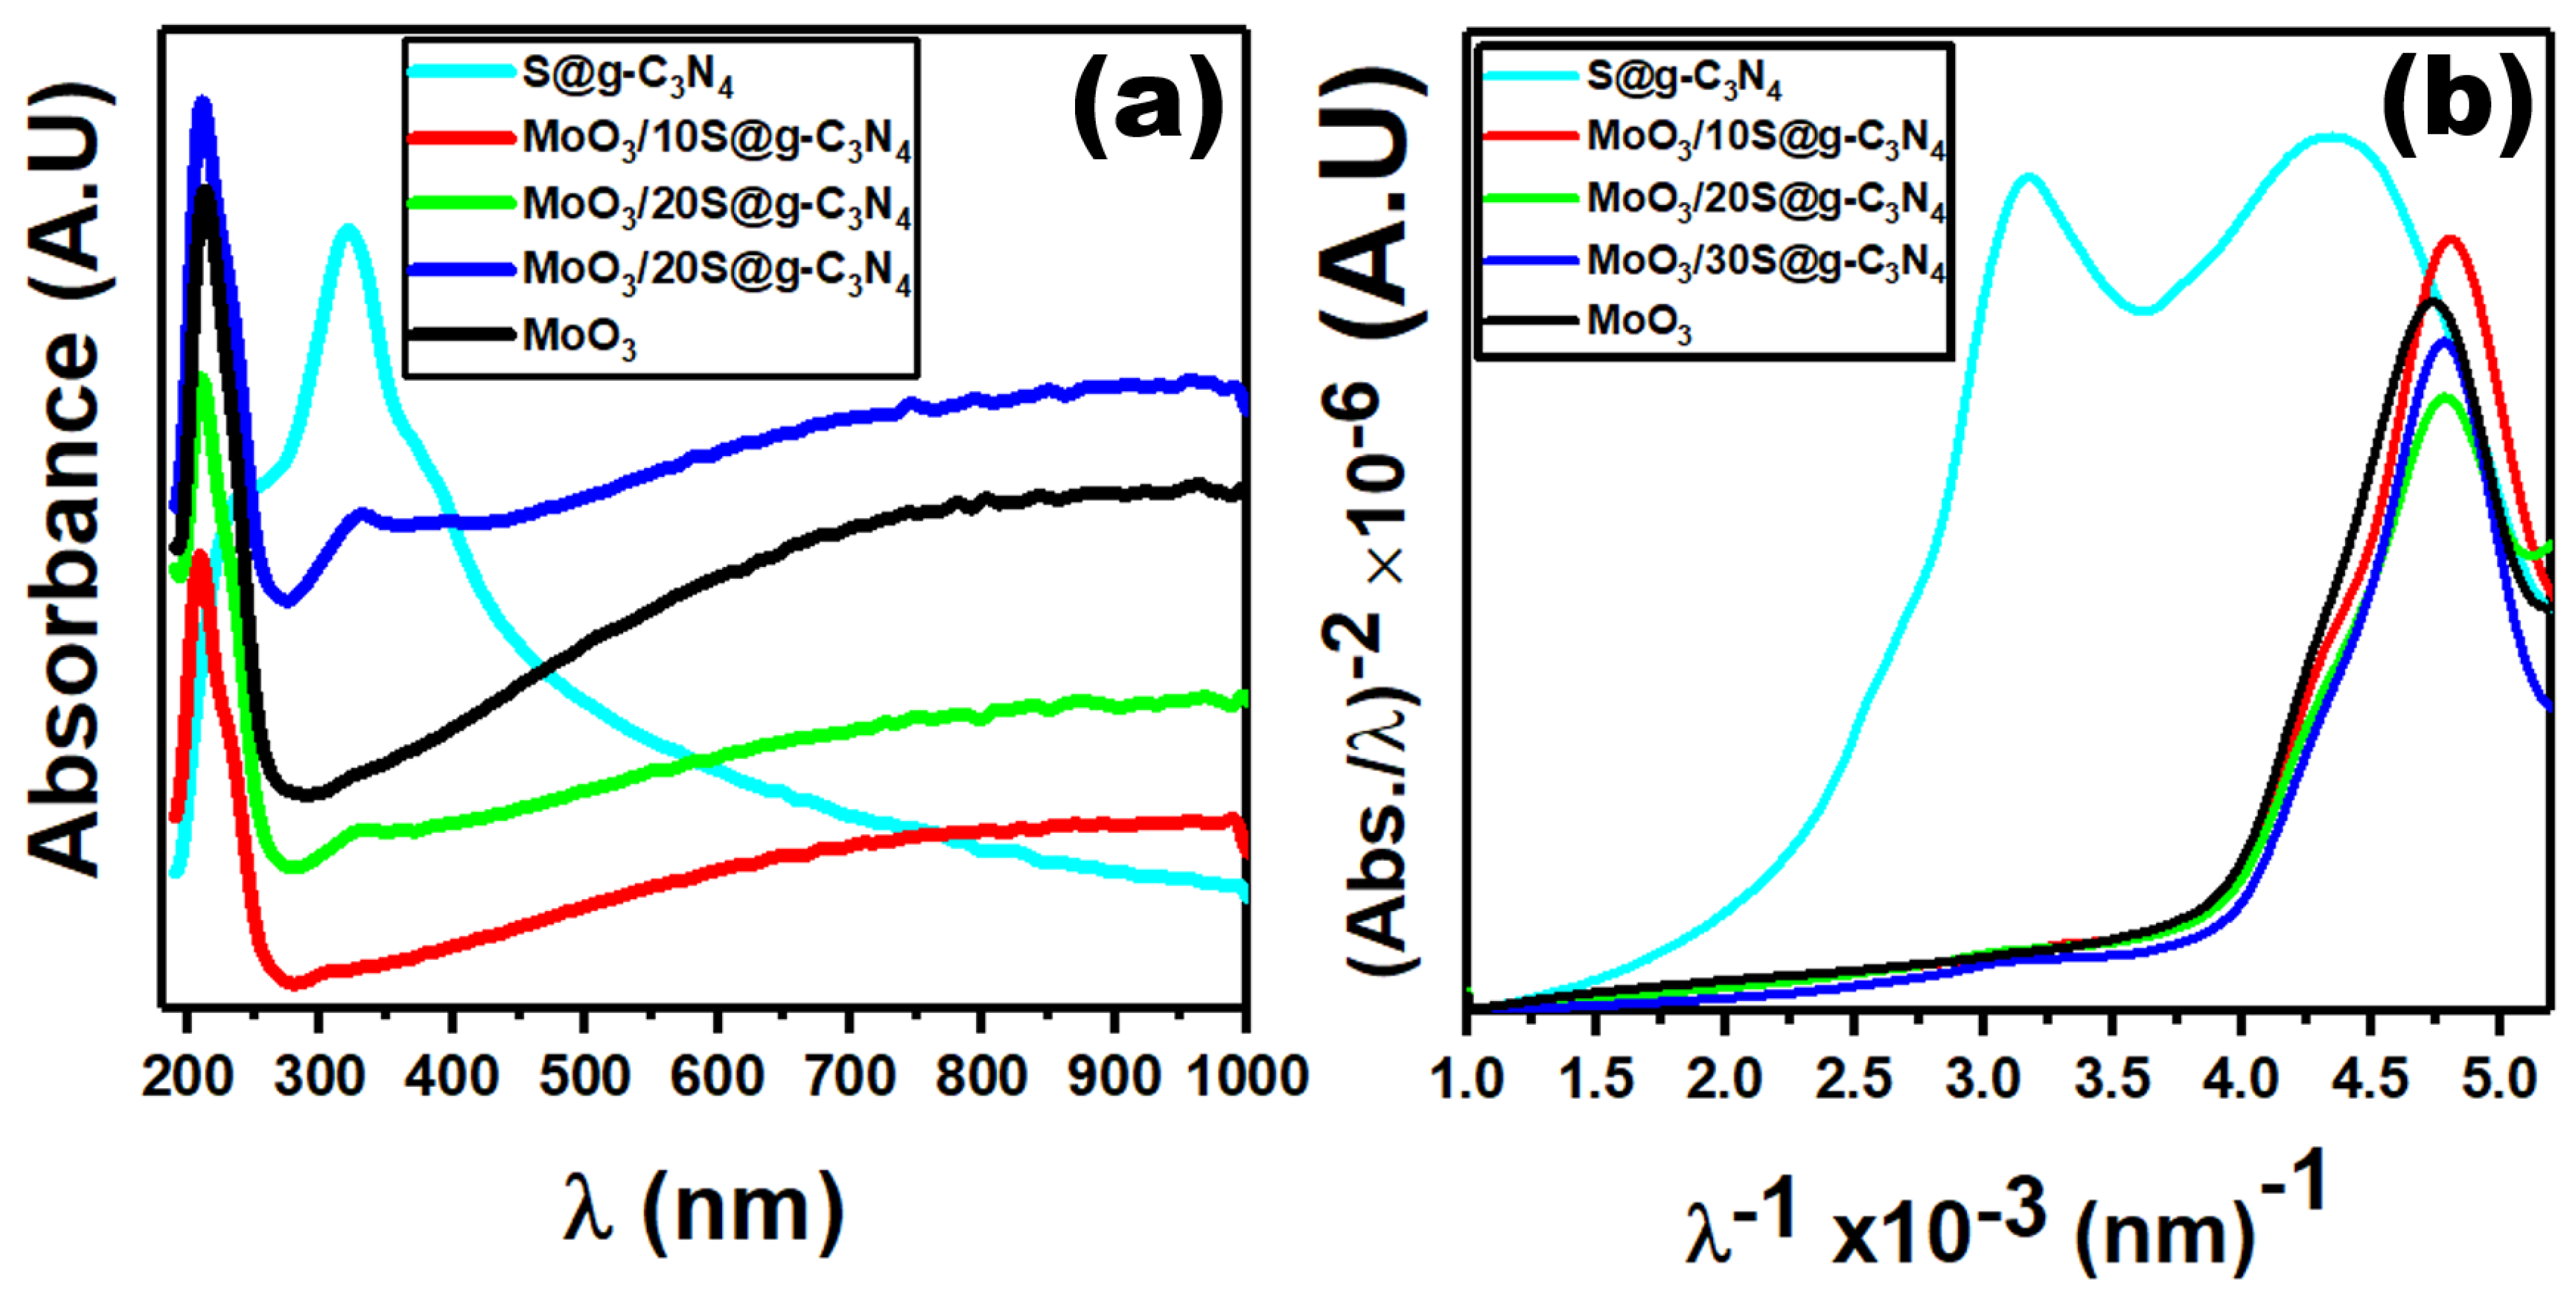
The optical measurements aim to calculate the optical band gap of S@g-C3N4, MoO3/10%S@g-C3N4, MoO3/20%S@g-C3N4, MoO3/30%S@g-C3N4, and MoO3 nanocomposites. We demonstrated optical absorption spectra to elucidate the optical properties using a spectrophotometer. Due to n→π* electronic transitions, the absorbance spectra exhibit a high absorption peak centered at 322 nm. We use Tauc’s plot and the ASF formula to determine the optical band gap. For crystalline materials, the following equations are used to study the absorption coefficient and incident photon energy [46,47]:
α   ( v ) h v = k ( h v E g a b ) r
α   ( v ) = k ( h c ) r 1 ( 1 λ 1 λ g a b ) r
where α   ( v ) is the absorption coefficient, E g a b is the optical gap, h v represents incident photon energy, k is a constant, r is the optical charge carrier direct transition index which is equal to 1/2. λ g a b , E g a b represents the optical gap ( E g a b ( e V ) = 1239.83 λ g a b ), and h and c are Plank’s constant and the light velocity, respectively. In order to calculate the optical band gap, we use Beer-Lambert’s law. This law is determined by A ( λ ) = ( α 1 2.303 ) α 2 where α 1 and α 2 are the solution concentration and absorbance, respectively. Thus, Equation (2) becomes [48]:
A ( λ ) = D λ ( 1 λ 1 λ g a b ) 1 2
where D is represented as D = k   ( h c ) m 1   α 1 2.303 . Figure 5 shows the plot of ( A λ λ ) 2 against λ 1 , where we extrapolate the straight-line portion of this plot at ( A λ λ ) 2 = 0 . Then, we determined the E g a p A S F value, which was 2.4 eV for S@g-C3N4 nanosheet. Moreover, the energy gaps of MoO3, MoO3/10%S@g-C3N4, MoO3/20%S@g-C3N4, and MoO3/30%S@g-C3N4 nanostructures were 3.86, 4.14, 4.0, and 4.12 eV, respectively. The energy gap for MoO3/10%S@g-C3N4 is that of MoO3, MoO3/20%S@g-C3N4, and MoO3/30%S@g-C3N4. The lattice constant and the volume of 10%S@g-C3N4, MoO3 are increased leading to higher band gap energy [49]. The efficiency of the photocatalyst is enhanced by increasing the band gap energy. The increased band gaps are attributed to the strong quantum effect produced by the ultra-thin atomic-thick S@g-C3N4 nanosheets. For example, doping CdS, Fe2O3, and WO3 with TiO2 improve the optical absorption and charge carrier separations. The larger the band gaps, the greater the reductive capacity, and hence a more favorable thermodynamic driving force for H2 generation. The sample (MoO3/10%S@g-C3N4) is expected to improve hydrogen production [50].
Mulliken electronegativity theory was used to predict the location of the CB and VB edges of MoO3/S@g-C3N4. Accordingly, the following formula can be used to estimate the location of the valence band (EVB) [51]:
E V B = χ E + 0.5 E g
where χ is the MoO3 electronegativity (6.4 eV), E is electron free energy (4.5 eV), and Eg is the determined band gap [52]. Further, the position of conduction band (ECB) is estimated according to valence band and the band gaps [53]:
E C B = E g E V B
The calculated values of valence band positions are 3.83, 3.97, 3.90, and 3.96 eV for MoO3, MoO3/10%S@g-C3N4, MoO3/20%S@g-C3N4, and MoO3/30%S@g-C3N4 nanocomposites. The conduction band energies for the same nanocomposite samples are 0.03, −0.11, −0.04, and −0.1 eV. The activity of a catalyst for each reaction is influenced by changes in the conduction and valence bands caused by coating with S@g-C3N4.

3.6. Hydrogen Catalytic Performance

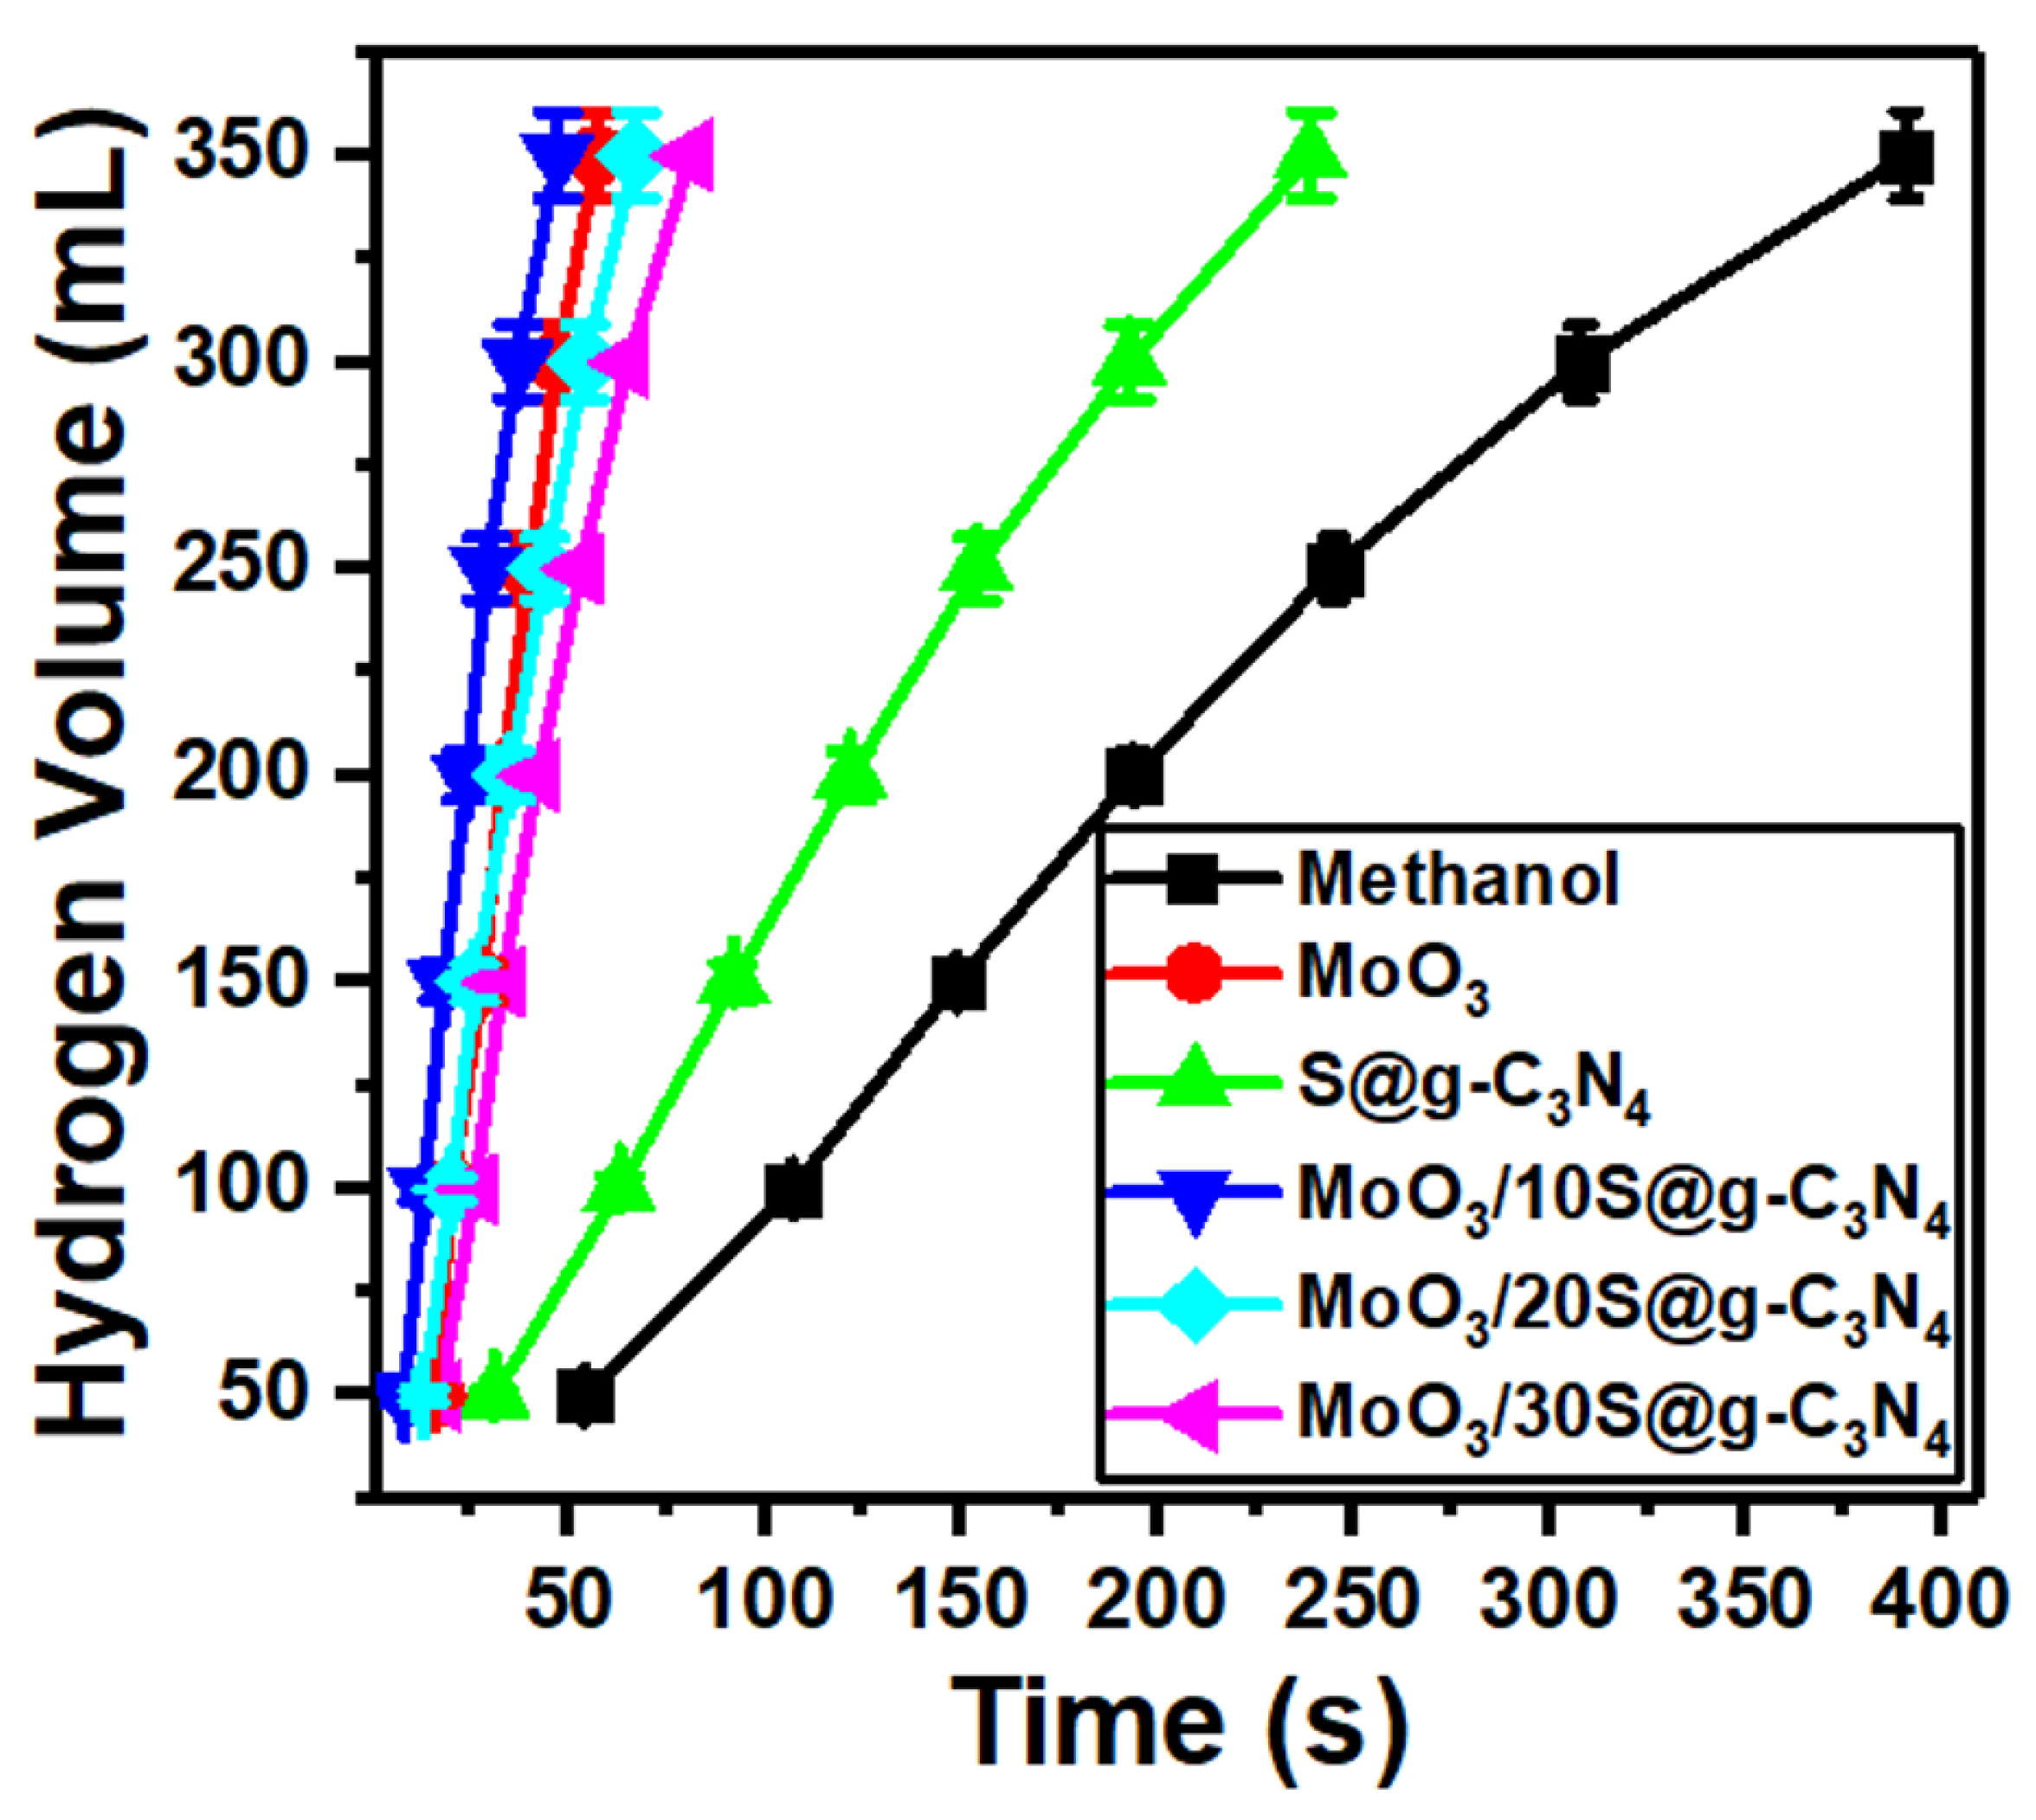
Self-hydrolysis of NaBH4 at room temperature generates a very low volume of hydrogen due to an increase in pH during the hydrolysis reaction. The main reason for the pH raise is the induced by-product of strongly basic sodium metaborate (NaBO2) ion [54]. Therefore, to implement an H2 economy, the development of a catalyst with the ability to cause a high generation rate at room temperature is necessary and essential. High hydrogen generation rates with great control are accomplished via a catalyst. Primary alcohols are used as reactants in the place of water or as a partial substitute for water in a different method of producing hydrogen from sodium borohydride. Methanol is the lightest alcohol and has the highest reactivity toward sodium borohydride, making it an effective alternative to water as a reactant for the generation of hydrogen [55]. The measurements of hydrogen evolution from the reaction of NaBH4-methanolysis are shown in Figure 6. 20 mg of catalysts (MoO3, S@g-C3N4, and MoO3/S@g-C3N4) were used to test their efficiency in producing hydrogen. The catalysts connected with the amino group catalyze the NaBH4 hydrolysis and methanolysis for the production of hydrogen according to the mechanism of Langmuir-Hinshelwood; as the molecules of methanol and NaBH4 adsorbed on the surface of the catalyst [56]. Otherwise, NaBH4 can be adsorbed without methanol on the catalyst surface as described by the mechanism of Michaelis-Menten [57]. It can be concluded from the foregoing that the surface properties of the catalyst are of great importance in the production of hydrogen.
In methanol, NaBH4 is initially decomposed into Na+ and BH4 ions. A second stage might be the adsorption of the produced BH4 ions onto the charged surface of the MoO3/S@g-C3N4 catalyst. Thus, the large positive area located on the surface of the catalyst will increase the adsorption of BH4 ions. 1.0 mole of H2 is produced by the interaction of the hydrogen atom with a negative charge in the structure of the catalyst complex-H that is induced because of electron transfer and the hydrogen atom with positive charge of methanol. BH3 and the methoxy ion of 3.0 mole of methanol combine simultaneously to generate B(CH3O). Finally, 4H2 is generated and NaB(OCH3)4 was produced [56,57].
From Figure 6, it can be seen that the maximum amount of hydrogen produced is accelerated with the addition of nanocomposites. In addition, the fastest hydrogen evolution was revealed with the sample MoO3/10%S@g-C3N4. The methanolysis of NaBH4 material includes two products of Na+ and BH4 ions. Thereafter, the developed BH4 ions are adsorbed on the charged surface of the MoO3/10%S@g-C3N4. Thus, a catalyst with a high positively-charged surface adsorb BH4 ions in short times [58]. Moreover, the fitting of hydrogen volume versus time for S@g-C3N4, MoO3, MoO3/10%S@g-C3N4, MoO3/20%S@g-C3N4, and MoO3/30%S@g-C3N4 nanocomposites give slopes of 1.60, 8.0, 8.71, 6.22, and 4.74, respectively. The nanocomposite sample MoO3/10%S@g-C3N4 showed the highest slope (8.71) and thus possesses the highest hydrogen generation rate.
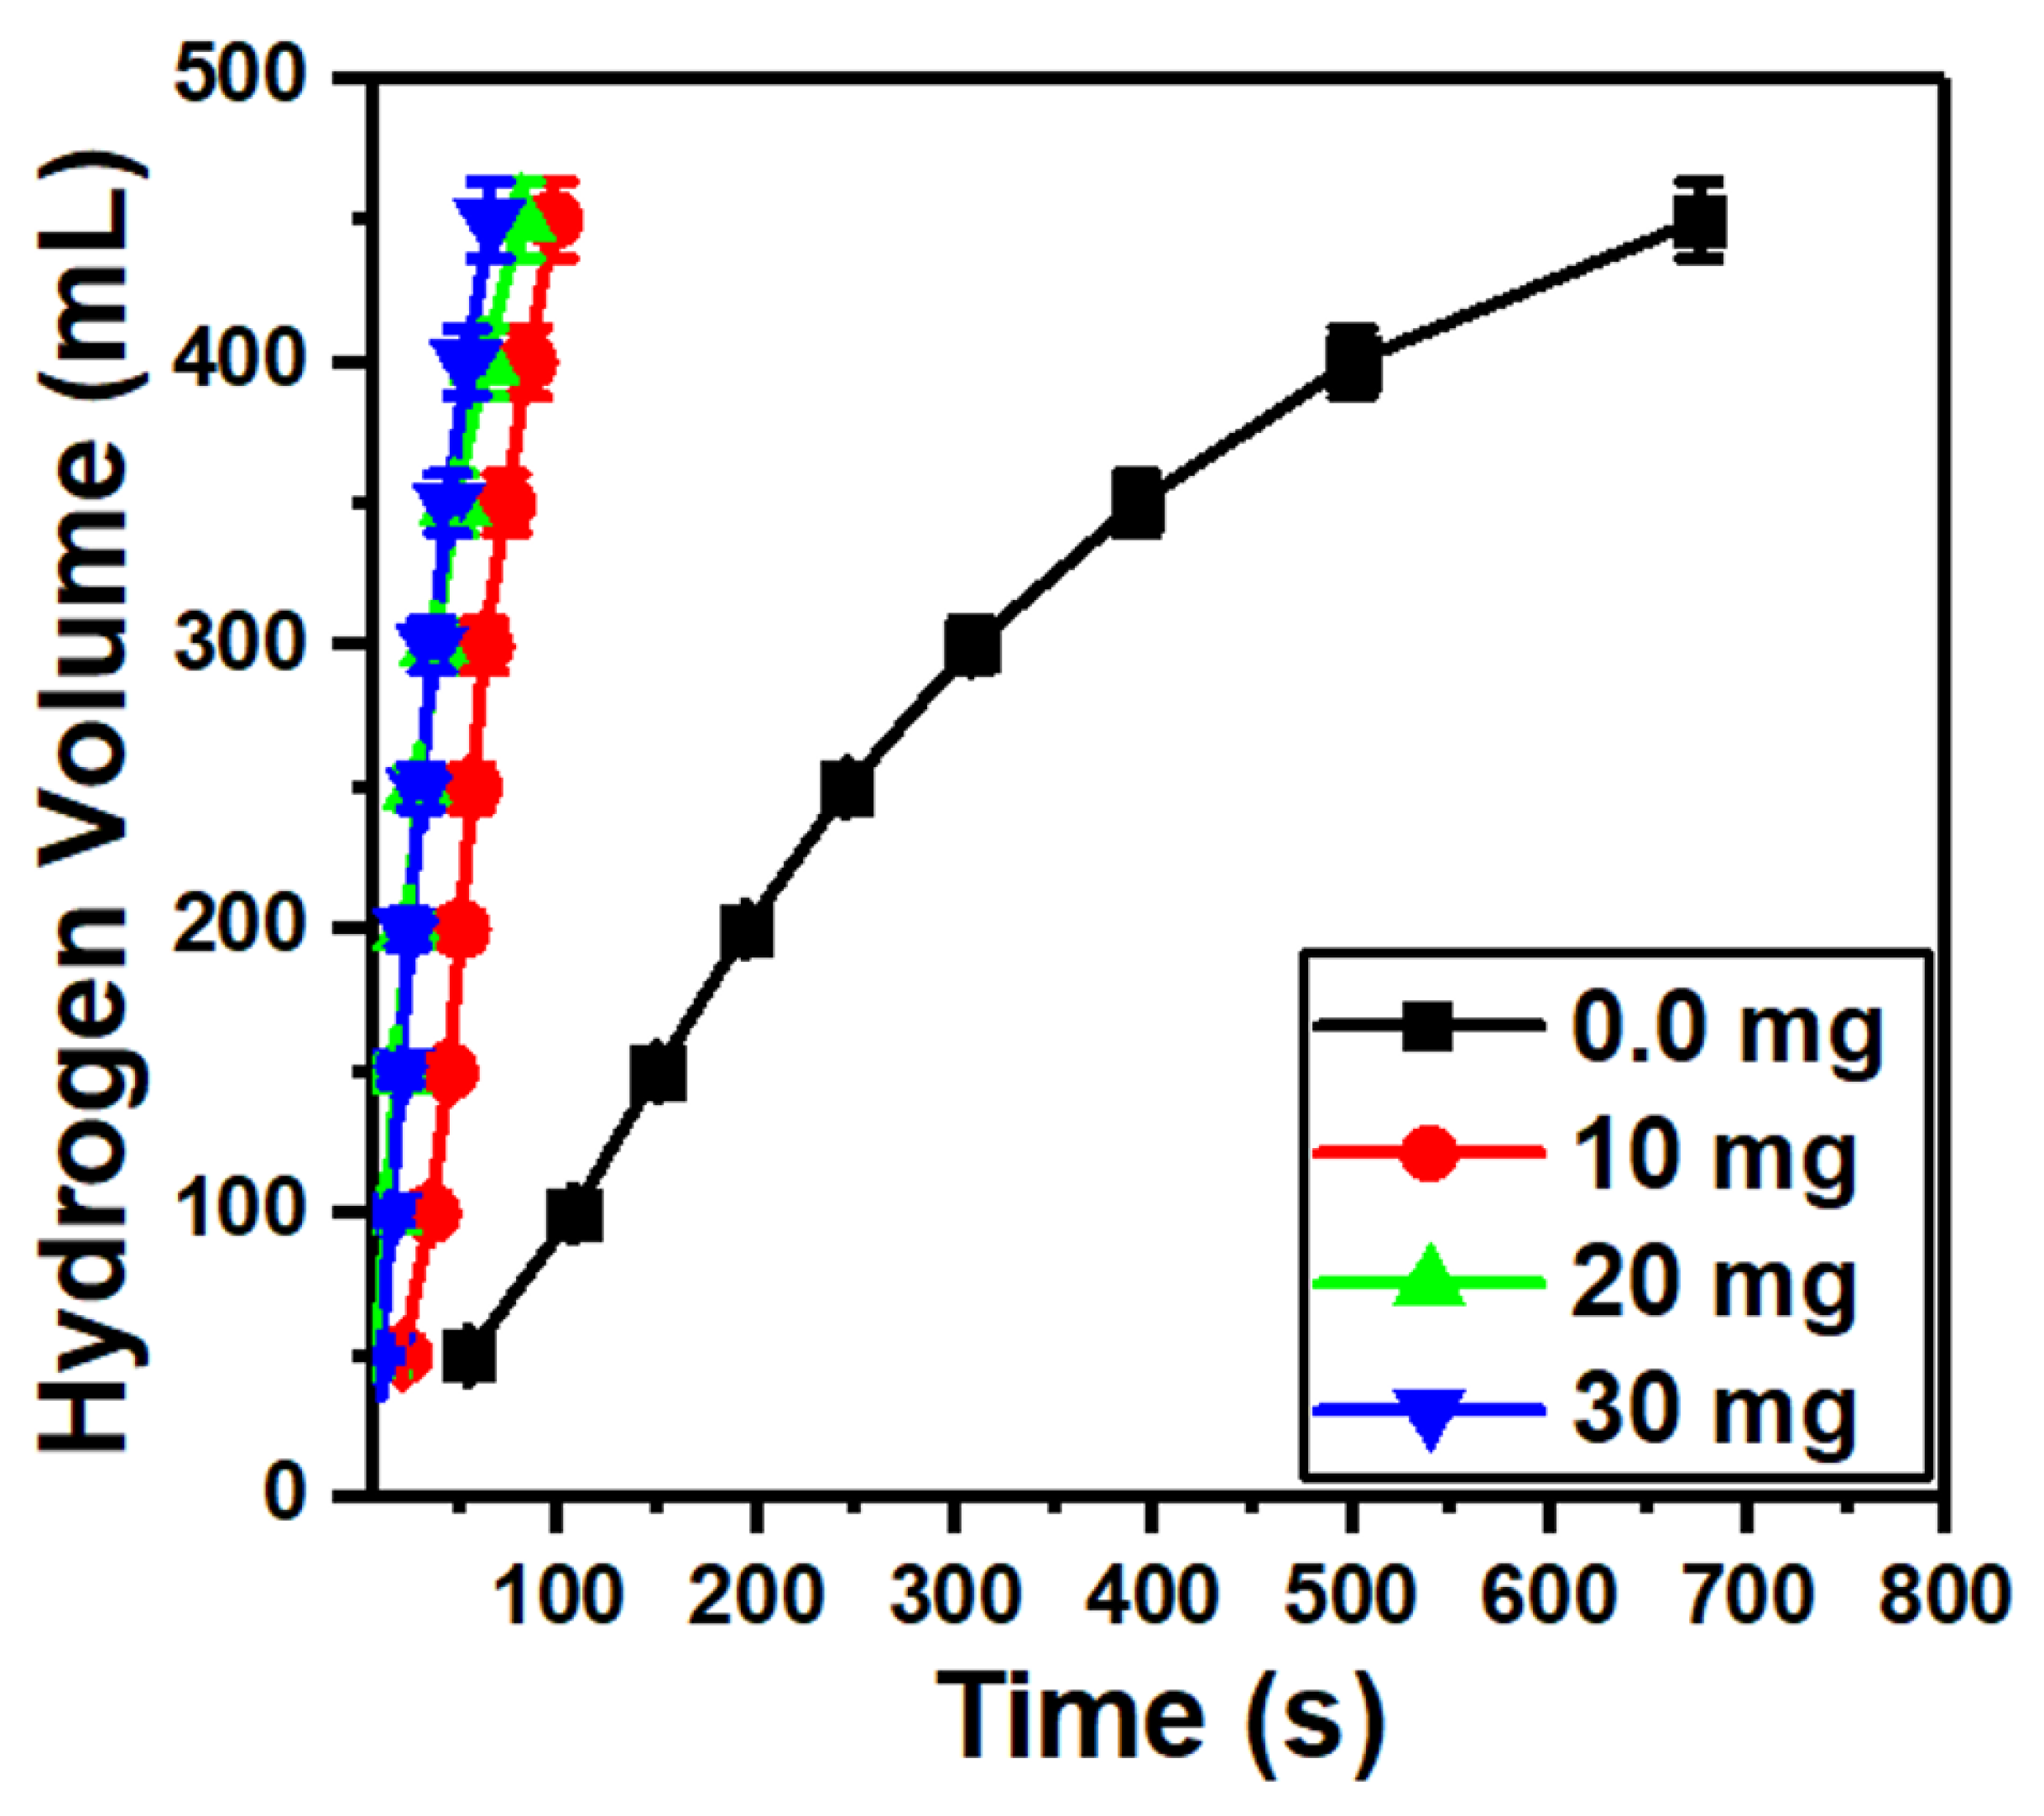
Figure 7 shows a fast hydrogen generation as the MoO3/10%S@g-C3N4 loading is increased from 0.0 to 30 mg. This may be due to the wide energy gap of the MoO3/10%S@g-C3N4 catalyst, which possesses a high separation of charge carriers [59]. Moreover, the amino group from S@g-C3N4 that is coated on the surface of MoO3 motivates the hydrogen production from NaBH4.
One of the most crucial factors that must be taken into account while developing engineering solutions for hydrogen energy applications, is hydrogen generating rate. The H2 generation rate (r) for the MoO3/%S@g-C3N4 catalyst is estimated from the following relation [60,61]:
r = V t · m c a t
where V denotes the H2 volume, mcat is the mass of the catalyst, and t is the time of reaction. The H2 generation rates that were obtained based on the data in Figure 7, nevertheless, have decreased. As the values of r were 28,767, 22,340, and 15,905 mL/g·min at 10, 20, and 30 mg of MoO3/10%S@g-C3N4 catalyst, respectively. A reduction in the catalytic activity of the methanolysis process is the end outcome, which is the blockage of the catalyst active sites as a result of the catalyst active sites becoming saturated [58].
Figure 8 shows the influence of nanocomposite catalysts on the rate of hydrogen generated. The nanocatalyst MoO3/10%S@g-C3N4 achieved a higher generation rate of 22,340 mL/g·min. The higher generation rate of composite comes due to the separation of charge carriers and positively charged areas on the surface of the catalyst.
The comparison of hydrogen evolution rate for different catalyst materials is recorded in Table 2. Moreover, this value of hydrogen evolution rate (22,340 mL/g·min) is higher than the rates achieved in the literature [58,61,62,63,64,65]. This remarkable development in the performance of the MoO3/S@g-C3N4 catalyst indicates its priority in the production of hydrogen from sodium borohydride.

4. Conclusions

The MoO3/g-C3N4 nanocomposites were functionalized for hydrogen production. Graphitic carbon nitride (g-C3N4)-based catalysis is prepared via thermal condensation of thiourea. The MoO3, g-C3N4, and MoO3/g-C3N4 nanocomposite catalysts were characterized by using XRD, FTIR, FESEM, STEM and spectrophotometer. When g-C3N4 and MoO3 were combined, the g-C3N4 was coated on the surface of MoO3 and turned to be positively charged. The lattice constant and the volume of MoO3/10-C3N4 was found to be the highest compared with MoO3, MoO3/20-C3N4, and MoO3/30C3N4. The nanocomposite sample MoO3/10%S@g-C3N4 showed a higher surface area and large pore volume. In addition, the combination of MoO3/10-C3N4 has a wide band gap energy of ~4.14 eV, whereas MoO3 has an energy band gap of 3.86 eV. The average nanocrystal size and microstrain for MoO3/10-C3N4 were found to be 23 nm and −0.042, respectively. The highest hydrogen production from NaBH4 hydrolysis ~22,340 mL/g·min was obtained from MoO3/10-C3N4 nanocomposites, while 18,421 mL/g·min was obtained from pure MoO3. Hydrogen production was increased when increasing the masses of MoO3/10-C3N4.

Author Contributions

M.A.: Experimental work and formal analysis; S.A.: Writing the original draft; K.A.: Experimental work and Investigation; T.A.: Writing the original draft; T.A.M.T.: Supervisions, reviewing and editing the original draft; A.H.A.: Writing, and editing the final draft, funding acquisition. All authors have read and agreed to the published version of the manuscript.

Funding

The authors extend their appreciation to the Deputyship for Research & Innovation, Ministry of Education in Saudi Arabia for funding this research work through the project number 223202.

Data Availability Statement

Data available on request from the corresponding author.

Acknowledgments

The authors are grateful to the central laboratory at Jouf University for the advance characterization techniques that were used in this study.

Conflicts of Interest

The authors confirm that, no conflict of interest.

References

  1. Chen, P.; Huang, W.; Li, K.; Feng, D.; Tong, Y. Copper Incorporated Molybdenum Tri-oxide Nanosheet Realizing High-Efficient Performance for Hydrogen Production. Catalysts 2022, 12, 895. [Google Scholar] [CrossRef]
  2. Ibrahim, I.D.; Sadiku, E.R.; Jamiru, T.; Hamam, Y.; Alayli, Y.; Eze, A.A. Prospects of nanostructured composite materials for energy harvesting and storage. J. King Saud Univ. Sci. 2020, 32, 758–764. [Google Scholar] [CrossRef]
  3. Mohamed, F.; Rabia, M.; Shaban, M. Synthesis and characterization of biogenic iron oxides of different nanomorphologies from pomegranate peels for efficient solar hydrogen production. J. Mater. Res. Technol. 2020, 9, 4255–4271. [Google Scholar] [CrossRef]
  4. Shaban, M.; Ali, S.; Rabia, M. Design and application of nanoporous graphene oxide film for CO2, H2, and C2H2 gases sensing. J. Mater. Res. Technol. 2019, 8, 4510–4520. [Google Scholar] [CrossRef]
  5. Elsayed, A.M.; Rabia, M.; Shaban, M.; Aly, A.H.; Ahmed, A.M. Preparation of Hex-agonal Nanoporous Al2O3/TiO2/TiN as a Novel Photodetector with High Efficiency. Sci. Rep. 2021, 11, 17572. [Google Scholar] [CrossRef] [PubMed]
  6. Buller, S.; Strunk, J. Nanostructure in energy conversion. J. Energy Chem. 2016, 25, 171–190. [Google Scholar] [CrossRef]
  7. Li, G.K.; Guo, J.; Zhang, Y.; Zavabeti, A.; Chen, K.; Guo, Y.; Hu, G.; Fan, X.; Li, G.K. Hydrogen Production from the Air. Nat. Commun. 2022, 13, 5046. [Google Scholar]
  8. Fujishima, A.; Honda, K. Electrochemical photolysis of water at a semiconductor electrode. Nature 1972, 238, 37–38. [Google Scholar] [CrossRef]
  9. Wen, J.; Li, X.; Liu, W.; Fang, Y.; Xie, J.; Xu, Y. Photocatalysis fundamentals and surface modification of TiO2 nanomaterials. Chin. J. Catal. 2015, 36, 2049–2070. [Google Scholar] [CrossRef]
  10. Shah, S.A.; Khan, I.; Yuan, A. MoS2 as a Co-Catalyst for Photocatalytic Hydrogen Production: A Mini Review. Molecules 2022, 27, 3289. [Google Scholar] [CrossRef]
  11. Luo, L.; Gong, Z.; Ma, J.; Wang, K.; Zhu, H.; Li, K.; Xiong, L.; Guo, X.; Tang, J. Ultrathin sulfur-doped holey carbon nitride nanosheets with superior photocatalytic hydrogen production from water. Appl. Catal. B Environ. 2021, 284, 119742. [Google Scholar] [CrossRef]
  12. Dai, C.; Liu, B. Conjugated polymers for visible-light-driven photocatalysis. Energy Environ. Sci. 2020, 13, 24–52. [Google Scholar] [CrossRef]
  13. Fang, J.; Fan, H.; Zhu, Z.; Kong, L.B.; Ma, L. “Dyed” graphitic carbon nitride with greatly extended visible-light-responsive range for hydrogen evolution. J. Catal. 2016, 339, 93–101. [Google Scholar] [CrossRef]
  14. Xiang, Q.; Yu, J.; Jaroniec, M. Synergetic effect of MoS2 and graphene as cocatalysts for enhanced photocatalytic H2 production activity of TiO2 nanoparticles. J. Am. Chem. Soc. 2012, 134, 6575–6578. [Google Scholar] [CrossRef]
  15. Su, H.; Lou, H.; Zhao, Z.; Zhou, L.; Pang, Y.; Xie, H.; Rao, C.; Yang, D.; Qiu, X. In-situ Mo doped ZnIn2S4 wrapped MoO3 S-scheme heterojunction via Mo-S bonds to enhance photocatalytic HER. Chem. Eng. J. 2022, 430, 132770. [Google Scholar] [CrossRef]
  16. Peng, H.; Zhou, K.; Jin, Y.; Zhang, Q.; Liu, J.; Wang, H. Hierarchical nanostructure with ultrafine MoO3 particles-decorated Co(OH)2 nanosheet array on Ag nanowires for promoted hydrogen evolution reaction. Chem. Eng. J. 2022, 429, 132477. [Google Scholar] [CrossRef]
  17. Lee, D.; Kim, Y.; Kim, H.W.; Choi, M.; Park, N.; Chang, H.; Kwon, Y.; Park, J.H.; Kim, H.J. In situ electrochemically synthesized Pt-MoO3−x nanostructure catalysts for efficient hydrogen evolution reaction. J. Catal. 2022, 381, 1–13. [Google Scholar] [CrossRef]
  18. Duraisamy, S.; Ganguly, A.; Sharma, P.K.; Benson, J.; Davis, J.; Papakonstantinou, P. One-step hydrothermal synthesis of phase-engineered MoS2/MoO3 electrocatalysts for hydrogen evolution reaction. ACS Appl. Nano Mater. 2021, 4, 2642–2656. [Google Scholar] [CrossRef]
  19. Chen, P.; Tong, Y.; Wu, C.; Xie, Y. Surface/Interfacial Engineering of Inorganic Low-Dimensional Electrode Materials for Electrocatalysis. Acc. Chem. Res. 2018, 51, 2857–2866. [Google Scholar] [CrossRef]
  20. Li, Y.; Yin, J.; An, L.; Lu, M.; Sun, K.; Zhao, Y.Q.; Gao, D.; Cheng, F.; Xi, P. FeS2/CoS2 interface nanosheets as efficient bifunctional electrocatalyst for overall water splitting. Small 2018, 14, 1801070. [Google Scholar] [CrossRef]
  21. Zhang, H.; Xi, B.; Gu, Y.; Chen, W.; Xiong, S. Interface engineering and heterometal doping Mo-NiS/Ni(OH)2 for overall water splitting. Nano Res. 2021, 14, 3466–3473. [Google Scholar] [CrossRef]
  22. Ding, X.; Xia, Y.; Li, Q.; Dong, S.; Jiao, X.; Chen, D. Interface engineering of Co(OH)2/Ag/FeP hierarchical superstructure as efficient and robust electrocatalyst for overall water splitting. ACS Appl. Mater. Interfaces 2019, 11, 7936–7945. [Google Scholar] [CrossRef]
  23. Zhang, Y.; Guo, H.; Li, X.; Du, J.; Ren, W.; Song, R. A 3D multi-interface structure of coral-like Fe-Mo-S/Ni3S2@NF using for high-efficiency and stable overall water splitting. Chem. Eng. J. 2021, 404, 126483. [Google Scholar] [CrossRef]
  24. Li, L.; Zhang, T.; Yan, J.; Cai, X.; Liu, S. P doped MoO3−x nanosheets as efficient and stable electrocatalysts for hydrogen evolution. Small 2017, 13, 1700441. [Google Scholar] [CrossRef]
  25. Ji, L.; Wang, J.; Teng, X.; Dong, H.; He, X.; Chen, Z. N, P-Doped Molybdenum Carbide Nanofibers for Efficient Hydrogen Production. ACS Appl. Mater. Interfaces 2018, 10, 14632–14640. [Google Scholar] [CrossRef]
  26. Yan, S.C.; Lv, S.B.; Li, Z.S.; Zou, Z.G. Organic–inorganic composite photocatalyst of gC3N4 and TaON with improved visible light photocatalytic activities. Dalton Trans. 2010, 39, 1488–1491. [Google Scholar] [CrossRef]
  27. Wang, Y.; Shi, R.; Lin, J.; Zhu, Y. Enhancement of photocurrent and photocatalytic activity of ZnO hybridized with graphite-like C3N4. Energy Environ. Sci. 2011, 4, 2922–2929. [Google Scholar] [CrossRef]
  28. Wang, Y.; Bai, X.; Pan, C.; He, J.; Zhu, Y. Enhancement of photocatalytic activity of Bi2WO6 hybridized with graphite-like C3N4. J. Mater. Chem. 2012, 22, 11568–11573. [Google Scholar] [CrossRef]
  29. Yan, S.C.; Li, Z.S.; Zou, Z.G. Photodegradation performance of g-C3N4 fabricated by directly heating melamine. Langmuir 2009, 25, 10397–10401. [Google Scholar] [CrossRef]
  30. Wang, X.; Maeda, K.; Chen, X.; Takanabe, K.; Domen, K.; Hou, Y.; Fu, X.; Antonietti, M. Polymer Semiconductors for Artificial Photosynthesis: Hydrogen Evolution by Mesoporous Graphitic Carbon Nitride with Visible Light. J. Am. Chem. Soc. 2009, 131, 1680–1681. [Google Scholar] [CrossRef]
  31. Chen, Y.; Lu, C.; Xu, L.; Ma, Y.; Hou, W.; Zhu, J.-J. Single-crystalline orthorhombic molybdenum oxide nanobelts: Synthesis and photocatalytic properties. Crystengcomm 2010, 12, 3740–3747. [Google Scholar] [CrossRef]
  32. Taha, T.A.; El-Molla, M.M. Green simple preparation of LiNiO2 nanopowder for lithium ion battery. J. Mater. Res. Technol. 2020, 9, 7955–7960. [Google Scholar] [CrossRef]
  33. Alrowaili, Z.A.; Taha, T.A.; El-Nasser, K.S.; Donya, H. Significant Enhanced Optical Parameters of PVA-Y2O3 Polymer Nanocomposite Films. J. Inorg. Organomet. Polym. Mater. 2021, 31, 3101–3110. [Google Scholar] [CrossRef]
  34. Mahmoud, M.H.; Taha, T.A. FTIR and Mössbauer spectroscopy investigations of Ag/FexAl2−xO3 nanocomposites. J. Electron. Mater. 2019, 48, 7396–7403. [Google Scholar] [CrossRef]
  35. Wang, X.; Maeda, K.; Thomas, A.; Takanabe, K.; Xin, G.; Carlsson, J.M.; Domen, K.; Antonietti, M. A metal-free polymeric photocatalyst for hydrogen production from water under visible light. Nat. Mater. 2009, 8, 76–80. [Google Scholar] [CrossRef]
  36. Rao, A.; Pundir, V.S.; Tiwari, A.; Padarthi, Y.; Rao, N.V.M.; Aich, S.; Roy, B. Investigating the effect of dopant type and concentration on TiO2 powder microstructure via rietveld analysis. J. Phys. Chem. Solids 2018, 113, 164–176. [Google Scholar] [CrossRef]
  37. Murugesan, S.; Thirumurugesan, R.; Mohandas, E.; Parameswaran, P. X-ray diffraction Rietveld analysis and Bond Valence analysis of nano titania containing oxygen vacancies synthesized via sol-gel route. Mater. Chem. Phys. 2019, 225, 320–330. [Google Scholar] [CrossRef]
  38. Verma, S.; Rani, S.; Kumar, S.; Khan, M.M. Rietveld refinement, micro-structural, optical and thermal parameters of zirconium titanate composites. Ceram. Int. 2018, 44, 1653–1661. [Google Scholar] [CrossRef]
  39. Wang, C.; Cheng, B.L.; Wang, S.Y.; Lu, H.B.; Zhou, Y.L.; Chen, Z.H.; Yang, G.Z. Effects of oxygen pressure on lattice parameter, orientation, surface morphology and deposition rate of (Ba0.02Sr0.98)TiO3 thin films grown on MgO substrate by pulsed laser deposition. Thin Solid Film. 2005, 485, 82–89. [Google Scholar] [CrossRef]
  40. Ajmal, Z.; Taha, T.A.; Amin, M.A.; Palamanit, A.; Nawawi, W.I.; Kalam, A.; Al-Sehemi, A.G.; Algarni, H.; Qadeer, A.; Ali, H.; et al. Embedding Aromatic Conjugated Monomer within Carbon Nitride for Efficient Photocatalytic Re-duction Reactions. J. Mol. Liq. 2022, 368, 120617. [Google Scholar] [CrossRef]
  41. Hayat, A.; Sohail, M.; Taha, T.A.; Mane, S.K.B.; Al-Sehemi, A.G.; Al-Ghamdi, A.A.; Nawawi, W.; Palamanit, A.; Amin, M.A.; Fallatah, A.M.; et al. Synergetic effect of bismuth vanadate over copolymerized carbon nitride composites for highly efficient photocatalytic H2 and O2 generation. J. Colloid Interface Sci. 2022, 627, 621–629. [Google Scholar] [CrossRef]
  42. Hayat, A.; Sohail, M.; Anwar, U.; Taha, T.A.; El-Nasser, K.S.; Alenad, A.M.; Al-Sehemi, A.G.; Alghamdi, N.A.; Al-Hartomy, O.A.; Amin, M.A.; et al. Enhanced photocatalytic overall water splitting from an assembly of donor-π-acceptor conjugated polymeric carbon nitride. J. Colloid Interface Sci. 2022, 624, 411–422. [Google Scholar] [CrossRef]
  43. Sinaim, H.; Ham, D.J.; Lee, J.S.; Phuruangrat, A.; Thongtem, S.; Thongtem, T. Free-polymer controlling morphology of α-MoO3 nanobelts by a facile hydrothermal synthesis, their electrochemistry for hydrogen evolution reactions and optical properties. J. Alloy. Compd. 2012, 516, 172–178. [Google Scholar] [CrossRef]
  44. Zeng, H.C. Chemical Etching of Molybdenum Trioxide: A New Tailor-Made Synthesis of MoO3 Catalysts. Inorg. Chem. 1998, 37, 1967–1973. [Google Scholar] [CrossRef]
  45. Ahmad, K.; Khan, M.Q.; Alsalme, A.; Kim, H. Sulfur-doped graphitic-carbon nitride (S@g-C3N4) as bi-functional catalysts for hydrazine sensing and hydrogen production applications. Synth. Met. 2022, 288, 117100. [Google Scholar] [CrossRef]
  46. Taha, T.A.; Azab, A.A.; Sebak, M.A. Glycerol-assisted sol-gel synthesis, optical, and magnetic properties of NiFe2O4 nanoparticles. J. Mol. Struct. 2018, 1181, 14–18. [Google Scholar] [CrossRef]
  47. Kaky, K.M.; Hassib, M.D.; Taki, M.M.; Baki, S.O. Optical properties of zinc bo-ro-tellurite alumina glasses. Mater. Today Proc. 2020, 29, 39–42. [Google Scholar] [CrossRef]
  48. Mergen, B.; Arda, E. Determination of Optical Band Gap Energies of CS/MWCNT Bio-nanocomposites by Tauc and ASF Methods. Synth. Met. 2020, 269, 116539. [Google Scholar] [CrossRef]
  49. Shi, Y.; Lian, J.; Hu, W.; Liu, Y.; He, G.; Jin, K.; Song, H.; Dai, K.; Fang, J. Study the relation between band gap value and lattice constant of MgTi2O4. J. Alloys Compd. 2019, 788, 891–896. [Google Scholar] [CrossRef]
  50. Xu, J.; Wang, W.; Sun, S.; Wang, L. Enhancing visible-light-induced photocatalytic activity by coupling with wide-band-gap semiconductor: A case study on Bi2WO6/TiO2. Appl. Catal. B Environ. 2012, 111, 126–132. [Google Scholar] [CrossRef]
  51. Liu, J. Origin of high photocatalytic efficiency in monolayer g-C3N4/CdS heterostructure: A hybrid DFT study. J. Phys. Chem. C 2015, 119, 28417–28423. [Google Scholar] [CrossRef]
  52. Zhen, Y.; Wang, J.; Fu, F.; Fu, W.; Liang, Y. The novel Z-scheme ternary-component Ag/AgI/α-MoO3 catalyst with excellent visible-light photocatalytic oxidative desulfurization performance for model fuel. Nanomaterials 2019, 9, 1054. [Google Scholar] [CrossRef] [PubMed] [Green Version]
  53. Wang, Y.; Huang, D.; Zhu, X.; Ma, Y.; Geng, H.; Wang, Y.; Yin, G.; He, D.; Yang, Z.; Hu, N. Surfactant-free synthesis of Cu2O hollow spheres and their wavelength-dependent visible photocatalytic activities using LED lamps as cold light sources. Nanoscale Res. Lett. 2014, 9, 624. [Google Scholar] [CrossRef] [PubMed] [Green Version]
  54. Akdim, O.; Demirci, U.B.; Miele, P. Deactivation and reactivation of cobalt in hydrolysis of sodium borohydride. Int. J. Hydrog. Energy 2011, 36, 13669–13675. [Google Scholar] [CrossRef]
  55. Xu, D.; Lai, X.; Guo, W.; Zhang, X.; Wang, C.; Dai, P. Efficient catalytic properties of SO42−/MxOy (M = Cu, Co, Fe) catalysts for hydrogen generation by methanolysis of sodium boro-hydride. Int. J. Hydrog. Energy 2018, 43, 6594–6602. [Google Scholar] [CrossRef]
  56. Saka, C. Highly active and durable hydrogen release in NaBH4 methanolysis reaction with sulphur and phosphorus-doped metal-free microalgal carbon nanoparticles. Appl. Catal. B Environ. 2021, 292, 120165. [Google Scholar] [CrossRef]
  57. Saka, C.; Kaya, M.; Bekiroğullari, M. Chlorella vulgaris microalgae strain modified with zinc chloride as a new support material for hydrogen production from NaBH4 methanolysis using CuB, NiB, and FeB metal catalysts. Int. J. Hydrog. Energy 2020, 45, 1959–1968. [Google Scholar] [CrossRef]
  58. Saka, C. Efficient and durable H2 production from NaBH4 methanolysis using N doped hybrid g-C3N4-SiO2 composites with ammonia as a nitrogen source. Fuel 2022, 324, 124594. [Google Scholar] [CrossRef]
  59. Ölmez, S.S.; Balbay, A.; Saka, C. Phosphorus doped carbon nanodots particles based on pomegranate peels for highly active dehydrogenation of sodium borohydride in methanol. Int. J. Hydrog. Energy 2022, 47, 31647–31655. [Google Scholar] [CrossRef]
  60. Saka, C. Phosphorus decorated g-C3N4-TiO2 particles as efficient metal-free catalysts for hydrogen release by NaBH4 methanolysis. Fuel 2022, 322, 124196. [Google Scholar] [CrossRef]
  61. Saka, C. g-C3N4 particles with boron and oxygen dopants/carbon vacancies for efficient dehydrogenation in sodium borohydride methanolysis. Int. J. Hydrog. Energy 2022, 47, 19016–19026. [Google Scholar] [CrossRef]
  62. Yan, K.; Li, Y.; Zhang, X.; Yang, X.; Zhang, N.; Zheng, J.; Chen, B.; Smith, K.J. Effect of preparation method on Ni2P/SiO2 catalytic activity for NaBH4 methanolysis and phenol hydrodeoxy-genation. Int. J. Hydrog. Energy 2015, 40, 16137–16146. [Google Scholar] [CrossRef]
  63. Wang, F.; Wang, Y.; Zhang, Y.; Luo, Y.; Zhu, H. Highly dispersed RuCo bimetallic nanoparticles supported on carbon black: Enhanced catalytic activity for hydrogen generation from NaBH4 methanolysis. J. Mater. Sci. 2018, 53, 6831–6841. [Google Scholar] [CrossRef]
  64. Wang, F.; Luo, Y.; Zhang, Y.; Wang, Y.; Zhu, H. Preparation of bush-like Ru/NiO-Ni foam catalyst and its performance in hydrogen production from sodium borohydride alcoholysis. Energy Fuels 2020, 34, 11365–11372. [Google Scholar] [CrossRef]
  65. Saka, C. Very efficient dehydrogenation of methanolysis reaction with nitrogen doped Chlorella Vulgaris microalgae carbon as metal-free catalysts. Int. J. Hydrog. Energy 2021, 46, 20961–20971. [Google Scholar] [CrossRef]
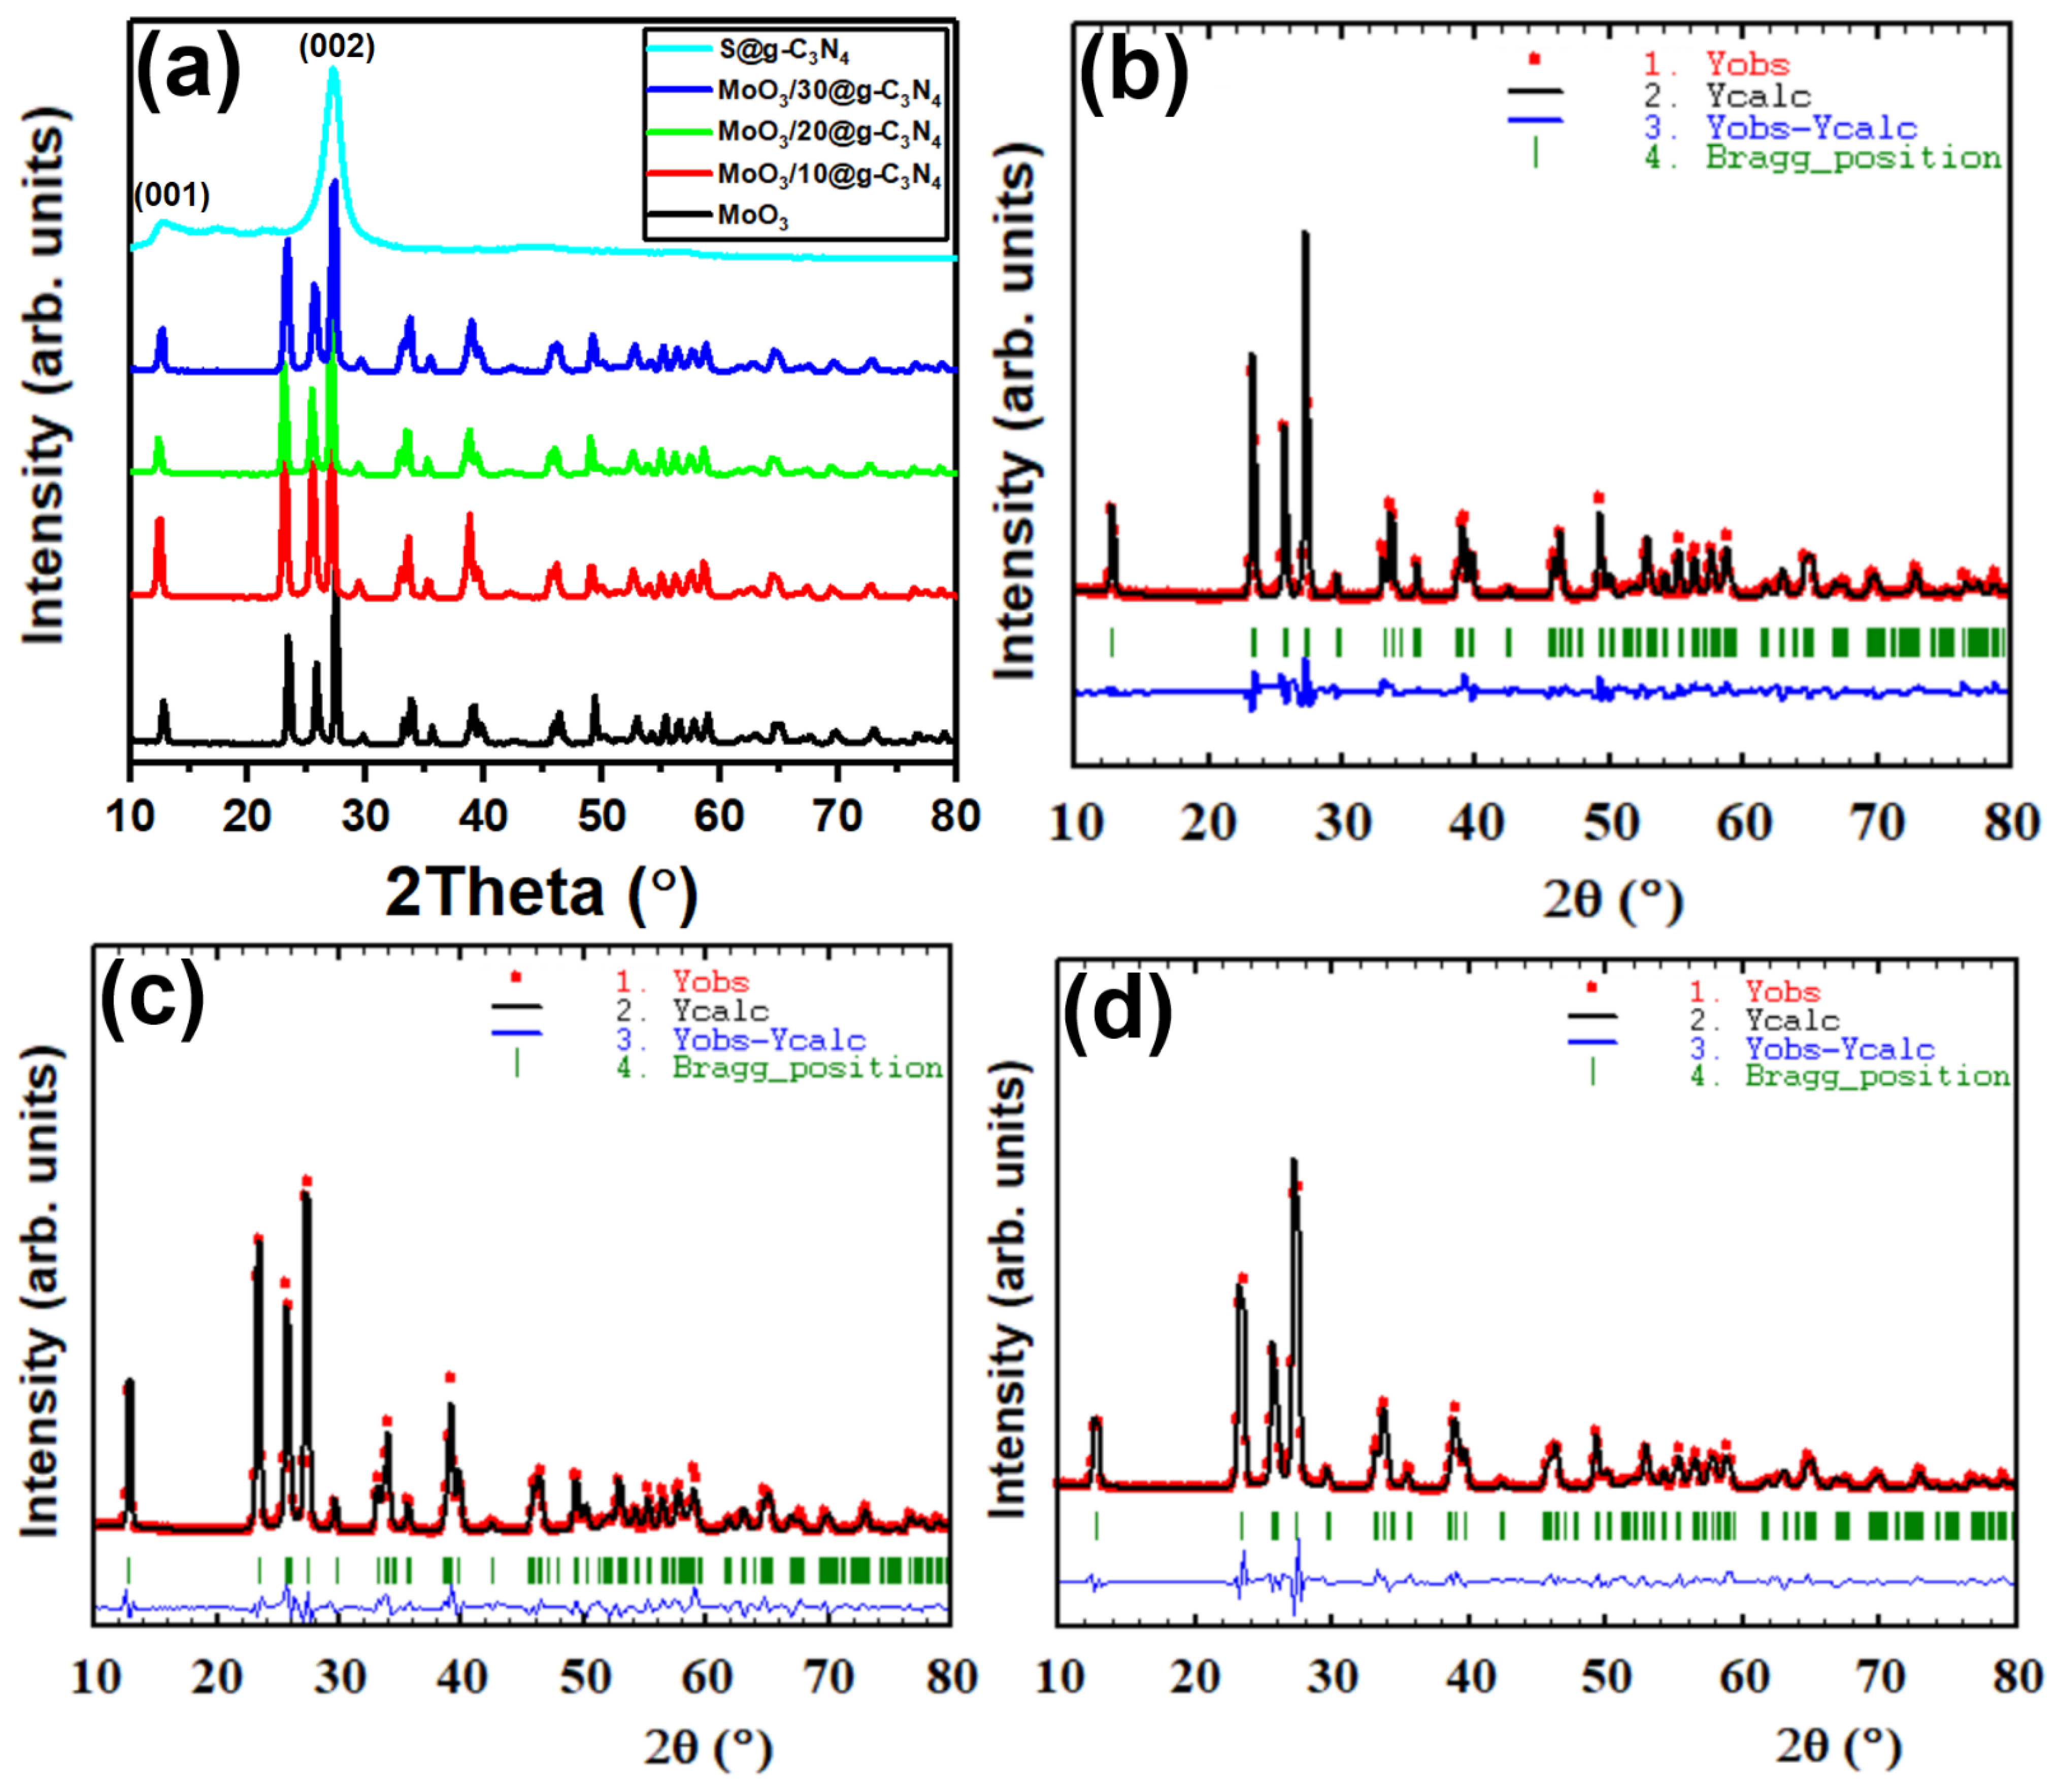
Figure 1. (a) XRD diffraction patterns of graphitic carbon nitride S@g-C3N4, MoO3, and MoO3/S@g-C3N4 nanocomposites with varying g-C3N4 concentrations. (bd) Rietveld refinement of XRD patterns of MoO3, MoO3/10%S@g-C3N4, and MoO3/30%S@g-C3N4, respectively.
Nanomaterials 13 00820 g001
Figure 2. FTIR spectra of MoO3, S@g-C3N4, and MoO3/S@g-C3N4 nanocomposites with different concentrations of S@g-C3N4.
Nanomaterials 13 00820 g002
Figure 3. Morphological images of (a) S@g-C3N4, (b) MoO3, (c) MoO3/10%S@g-C3N4, (d) MoO3/20%S@g-C3N4, (e) MoO3/30%S@g-C3N4 and (f) STEM image of MoO3/10%S@g-C3N4.
Nanomaterials 13 00820 g003
Figure 4. N2 adsorption−desorption plots of MoO3/10%S@g-C3N4 samples.
Nanomaterials 13 00820 g004
Figure 5. Plots of (a) optical absorption and (b) ASF graphs for nanostructures.
Nanomaterials 13 00820 g005
Figure 6. Hydrogen evolution from methanolysis of NaBH4 at different MoO3/S@g-C3N4 ratios.
Nanomaterials 13 00820 g006
Figure 7. Hydrogen generation from NaBH4 hydrolysis at different masses of MoO3/10S@g-C3N4.
Nanomaterials 13 00820 g007
Figure 8. Hydrogen evolution rates at different nanocomposites.
Nanomaterials 13 00820 g008
Table 1. The XRD parameters of MoO3 coated with different concentrations of S@g-C3N4.
SampleLattice Constant (Å)Volume (Å3)Average Nanocrystals Size (nm)Micro Strain
abc
MoO33.9613.863.69202.5300.00004
MoO3/10CN3.9613.923.69203.423−0.042
MoO3/20CN3.9513.843.69201.728−0.0037
MoO3/30CN3.9513.863.69202.0220−0.030
Table 2. Comparison of hydrogen evolution rate for different catalysts at 25 °C.
CatalystFormHydrogen Evolution Rate (mL/g·min)Ref.
Ni2PPowder3700[62]
Ru/CPowder6060[63]
g-C3N4-SiO2-NPowder11,400[53]
Ru5Co/CPowder9360[63]
B and O doped g-C3N4Powder11,600[61]
Ru/NiO-NiFoam6000[64]
g-C3N4-TiO2-PPowder14,750[55]
C-KOH-NPowder20,100[65]
MoO3/10S@g-C3N4Powder22,340This study
Disclaimer/Publisher’s Note: The statements, opinions and data contained in all publications are solely those of the individual author(s) and contributor(s) and not of MDPI and/or the editor(s). MDPI and/or the editor(s) disclaim responsibility for any injury to people or property resulting from any ideas, methods, instructions or products referred to in the content.