Article

Primary Amine Functionalized Carbon Dots for Dead and Alive Bacterial Imaging

1
Institute of Biomedical Engineering, College of Life Science, Basic Medical College, Qingdao University, Qingdao 266071, China
2
Department of Genetics and Cell Biology, Basic Medical College, Qingdao University, No. 308 Ningxia Road, Qingdao 266000, China
*
Author to whom correspondence should be addressed.
Nanomaterials 2023, 13(3), 437; https://doi.org/10.3390/nano13030437
Submission received: 24 December 2022 / Revised: 16 January 2023 / Accepted: 18 January 2023 / Published: 21 January 2023

Abstract

:
Small molecular dyes are commonly used for bacterial imaging, but they still meet a bottleneck of biological toxicity and fluorescence photobleaching. Carbon dots have shown high potential for bio-imaging due to their low cost and negligible toxicity and anti-photobleaching. However, there is still large space to enhance the quantum yield of the carbon quantum dots and to clarify their mechanisms of bacterial imaging. Using carbon dots for dyeing alive bacteria is difficult because of the thick density and complicated structure of bacterial cell walls. In this work, both dead or alive bacterial cell imaging can be achieved using the primary amine functionalized carbon dots based on their small size, excellent quantum yield and primary amine functional groups. Four types of carbon quantum dots were prepared and estimated for the bacterial imaging. It was found that the spermine as one of precursors can obviously enhance the quantum yield of carbon dots, which showed a high quantum yield of 66.46% and high fluorescence bleaching-resistance (70% can be maintained upon 3-h-irradiation). Furthermore, a mild modifying method was employed to bound ethylenediamine on the surface of the spermine–carbon dots, which is favorable for staining not only the dead bacterial cells but also the alive ones. Investigations of physical structure and chemical groups indicated the existence of primary amine groups on the surface of spermine–carbon quantum dots (which own a much higher quantum yield) which can stain alive bacterial cells visibly. The imaging mechanism was studied in detail, which provides a preliminary reference for exploring efficient and environment-friendly carbon dots for bacterial imaging.

1. Introduction

Bacteria, such as Escherichia coli (E. coli) and Staphylococcus aureus (S. aureus) [1,2,3,4], can threaten human health through occurring inflammation, histopathological destruction, etc. Accordingly, early recognition and diagnosis are important to inhibit bacterial infection in time. Among all monitoring methods, fluorescent imaging could give a fast and visual result for bacterial cells observation [5,6,7,8,9]. Small molecular dyes such as SYTO series or propidium iodide (PI) for bacterial imaging have been developed for commercial use [7,8,9,10,11]. However, aromatic structured small molecular dyes are usually toxic for both the human body and the environment and their fluorescent structure is easily destroyed or changed under fluorescent excitation light in a short period of time [10,12]. Therefore, environmentally friendly dyes that do not cause photobleaching still urgently need to be exploited. Because of the volume and structure difference between mammal cells and bacterial cells, staining bacterial cells is much harder than staining mammal cells, since bacteria are much smaller and bacterial cell walls are more compact and less permeable which requires a harsh standard for bacterial stain [13,14,15,16].
Carbon dots have been recently widely developed as promising fluorescent probes for biomedical imaging due to their advantages of low-cost, environmentally friendliness and photobleaching-resistance as well as their good biocompatibility and simple synthesis [17,18,19]. Until now, different types of carbon dots have been developed for potential bacterial imaging [13,20,21,22,23,24,25,26]. Precursors have been made of citric acid, small molecule organic amine, amino acids or bacteria themselves with one or two synthetic steps [22,23,25,26,27,28]. Some carbon dots can discriminate alive and dead bacterial cells [22,23], while some can alternatively stain gram-positive or gram-negative bacteria [29]. Generally, imaging mechanisms of some kinds of carbon dots for dead bacterial cells were explained as the small size of carbon dots. Since the negatively charged carbon dots have a electrostatic repulsion toward negatively charged cell walls of alive bacterial cells, the carbon dots cannot interact with alive ones [22,24,25]. Amidogen or amino-contained substances have been reported to be able to attach to bacterial surfaces whether located at carbon dots or antibiotics [30,31,32,33,34]. Accordingly, certain types of carbon dots were suggested to be able to mark alive bacteria due to the small size (which could go through the damage membrane [35]) or the protonated amino group on carbon quantum dots [13,21], but most work did not give a systematic study on the mechanism of carbon dots-based bacterial imaging. Moreover, despite the enhancement in the anti-bleaching property, the large space to enhance the quantum yield hindered the carbon dots reaching efficient bacterial imaging [36,37,38,39]. There are also other types of nanoparticles used as fluorescent probes for biomedical imaging such as metal-contained quantum dots, silicon dots or conjugated polymers. Metal-contained ones are usually applied for bacterial cell killing instead of for imaging and they are toxic to the environment [20]. Silicon dots need a higher synthesizing temperature than carbon dots [40,41]. Conjugated polymers do have strong light adsorption due to their large, conjugated planes, but the cost of monomer synthesis is high and the synthetic procedure is complicated [42,43].
Herein, we aim to clarify the mechanism of the surface chemical groups of amidogens on carbon dots for their staining behaviors in bacterial imaging. Citric acid and ethylenediamine were employed as precursors for preparing the carbon dots. Spermine, as an additional precursor, was discovered to be efficient in enhancing high quantum yield. Ethylenediamine were further modified on the surface of spermine-contained carbon dots using EDC/NHS (N-(3-dimethylaminopropyl)-N’-ethylcarbodiimide hydrochloride and N-hydroxysuccinimide) chemistry which is a mild modifying method under room temperature. The preparation of spermine-contained carbon dots and the fabrication of primary amine functionalized carbon dots are illustrated in Scheme 1. Quantum yield and functional group sizes were studied as the influencing factors for bacterial imaging. Investigations of the physical structures and chemical groups indicated the existence of primary amine groups on carbon quantum dots that are favorable for staining not only the dead bacterial cells but also the alive ones.

2. Materials and Methods

2.1. Chemicals and Reagent

Citric acid, ethylenediamine·H2O, spermine tetrahydrochloride, sodium chloride, N-(3-dimethylaminopropyl)-N’-ethylcarbodiimide hydrochloride (EDC), N-hydroxysuccinimide (NHS), 2-(N-Morpholino)ethanesulfonic acid monohydrate (MES), glycine, 2-[Tris(hydroxymethyl)methylamino]-1-ethanesulfonic acid (TES), sodium bicarbonate, sodium carbonate, sodium hydroxide, hydrogen chloride, disodium hydrogen phosphate, sodium dihydrogen phosphate, acetic acid, sodium acetate, sulfuric acid, quinine sulfate dihydrate, 3-(4,5-dimethyl-2-thiazolyl)-2,5-diphenyltetrazolium bromide (MTT) and dimethyl sulfoxide (DMSO) were purchased from Macklin Co., Ltd. In addition, 3% benzalkonium bromide was purchased from Shandong Lierkang medical technology Co., Ltd. Yeast extract and tryptone were purchased from OXOID Ltd. (Basingstoke Hampshire, United Kingdom) Escherichia coli (E. coli, ATCC 25922) and Staphylococcus aureus (S. aureus, ATCC 25923) were purchased from Beyotime Ltd. L929 cell lines were obtained from the Institute of Cell Biology, Chinese Academy of Sciences.

2.2. Apparatus

Transmission electron microscopy (TEM) and high-resolution TEM (HRTEM) were obtained using a JEOL JEM-2100 microscope (JEOL, Japan) at an acceleration voltage of 80 kV or 200 kV, respectively. X-ray diffraction (XRD) characterizations were obtained using a Bruker D8 Advance diffractometer with a copper Ka (k = 0.154056 nm) radiation source. X-ray photoelectronspectroscopy (XPS) measurements were obtained using a PHI5000 Versaprobe-II spectrometer (ULVAC-PHI, Japan) with a monochromatic Al Ka (1486.6 eV) source. The UV absorption spectra were obtained with a UV-6300 spectrophotometer (Mapada instruments Ltd., Shanghai, China). The photoluminescence spectra were obtained using an FS5 spectrophotometer (Edinburgh instruments Ltd., Livingston, UK). The fluorescence images were obtained with an upright fluorescence microscope (i203 type, Chongqing UOP, Chongqing, China) and an Eclipse Ni-U (Nikon Ltd., Tokyo, Japan) fluorescence microscope. Fourier-transform Infrared Spectrometer (FTIR, Thermo Fisher Scientific Ltd., Waltham, MA, USA) was employed to carried out IR spectra. Atomic force microscope (AFM, Dimension Icon, Bruker Co. Ltd., USA) was used to obtain AFM images. The particle size distribution and zeta potential were studied by dynamic light scattering (DLS) using Malvern Zetasizer (Malvern Instruments Ltd., Malverm, UK).

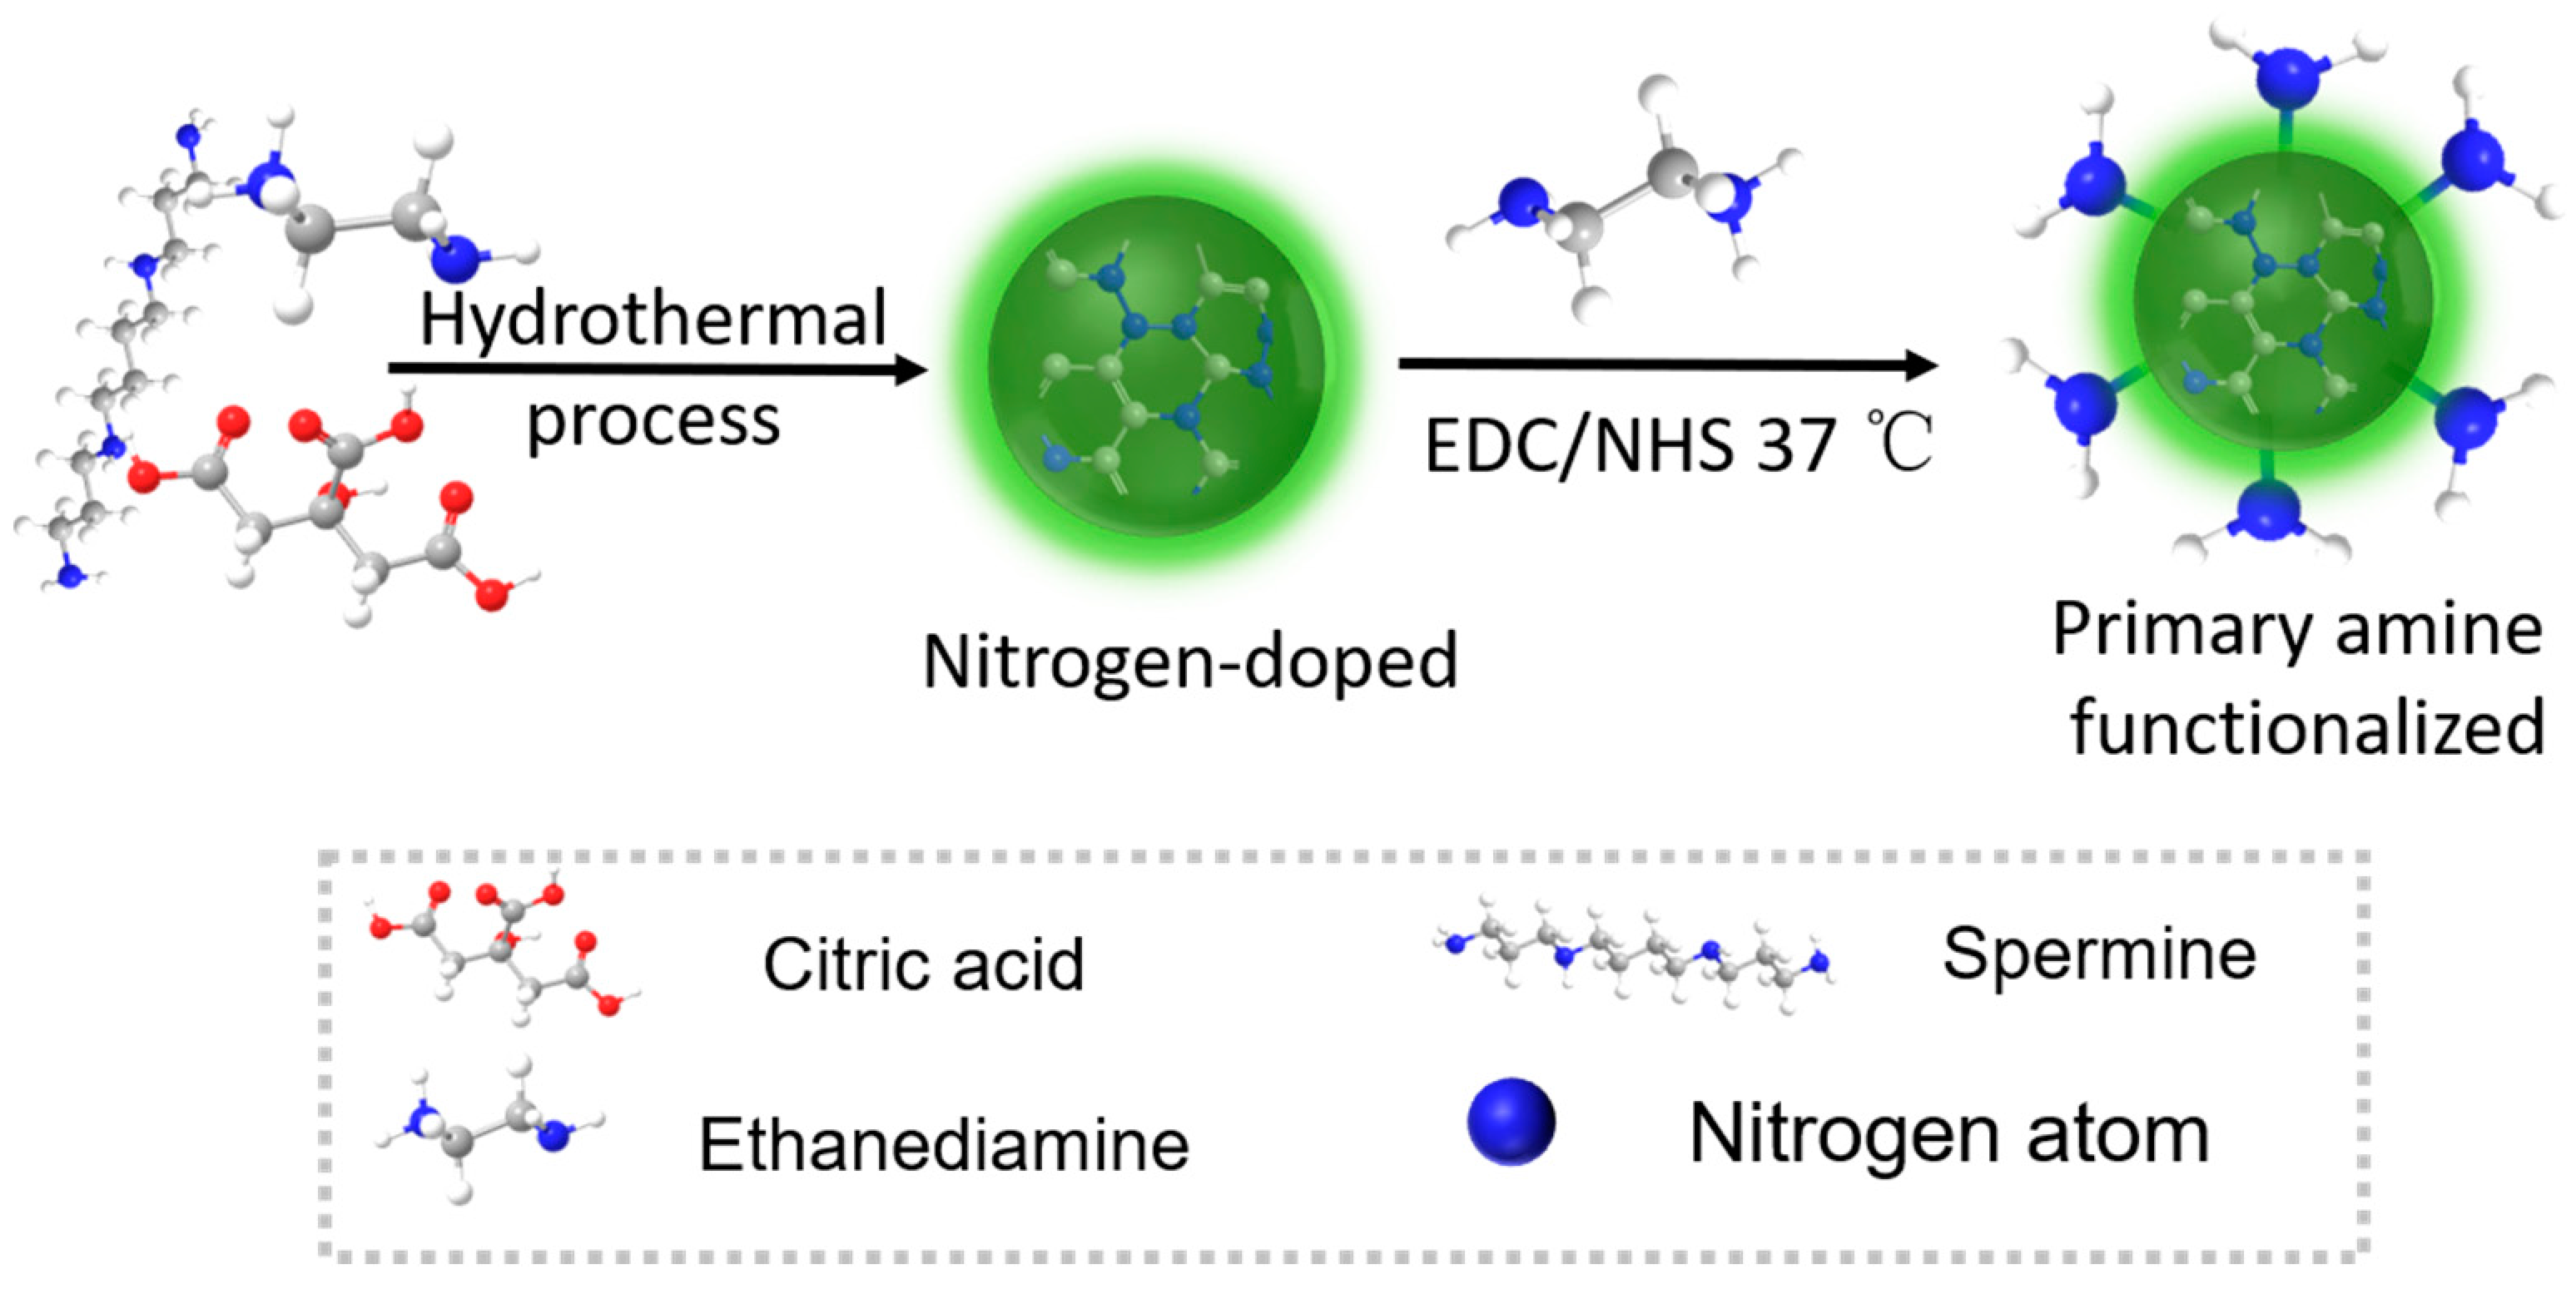
2.3. Preparation and Modification of the Carbon Dots

For the carbon dots, 0.96 g citric acid, 1250 μL ethylenediamine·H2O and 25 mL ultra-pure water were added into a 50 mL Teflon reactor. The reactor was kept at 180 °C for 6 h with a step of 6 °C/min. After cooling down, the mixture was filtered with 0.22 μm microporous membrane twice. The filtrate was dialyzed (1000 or 500 Da) for 24 h under room temperature. Then, the purified colloidal solution underwent a freeze-drying process to obtain the carbon dots (CD). The CD which synthesized using spermine (spCD) as one of percursors was fabricated by similar process mentioned above expect for adding spermine tetrahydrochloride in the hydrothermal step. Both CD and spCD were stored at room temperature and kept away from light and moisture.
An EDC/NHS chemistry was selected to complete the modification, which is a mild method for surface modification under room temperature [44]. Usually, EDC/NHS chemistry is employed for protein combination through carboxyl–amidogen bonding [44]. In this work. Carboxyl on the carbon dots was bonded to the primary amine group on the ethylenediamine (ethylenediamine have two primary amine group at both end of the compound). Briefly, 5~10 mg/mL CD or spCD, 8 mg EDC, 8 mg NHS were added into 6 mL 0.1 mol/L MES buffer (pH = 6.0) under 37 °C for 1 h. The amount of EDC and NHS were expected to be superfluous. Then, 1 mL ethylenediamine was added. Subsequently, pH value was adjusted to around 10.6 [44]. After incubation for 2 h under 37 °C, the solution was dialyzed to reach the modified CD (we named them NH2–CD) or the modified spCD (we named them NH2–spCD) suspension. Subsequently, the modified ones were obtained by freeze-drying the suspensions.

2.4. Quantum Yield (QY) Measurement

The QY of carbon dots were calculated and measured by the relative quantum yield. Typically, quinine sulfate dihydrate was diluted under 0.1 mol/L sulfuric acid solution (QY = 0.54 under 345 or 350 nm excitation wavelength). The carbon dots suspensions were diluted in different concentrations whose UV–Vis absorbance was not allowed to be higher than 0.1. The excitation wavelength of CD (including NH2–CD) and spCD (including NH2–spCD) were 345 nm and 348 nm, respectively. Equation of QY were defined as follows [45]:
Ф x = Ф S T G r a d x G r a d S T η x 2 η S T 2
where the x and ST refer to carbon dots and quinine sulfate dihydrate separately and Ф represent QY. Grad refers to the slope of the integrated fluorescent intensity dividing absorbance and η refers to solvent refractive index.

2.5. Bacterial Culture and Preparation for Imaging

E. coli and S. aureus were cultured with liquid medium, containing 0.5 g tryptone, 0.5 g sodium chloride and 0.25 g yeast extract per 50 mL sterile water. Then the bacteria was cultured under 150 rpm overnight to reach a O.D. value of around 0.5. For bacterial culture with carbon dots, alive bacteria were just centrifuged and rinsed with the medium and then carbon dots suspension were added and cultured for 30 min (S. aureus for 2 h). The preparing methods of dead cells were in two ways. One was killing bacteria with 3% benzalkonium bromide for 3 min, the other was killing with 60 °C water bath for 1 h [22,24]. Then the dead bacteria were co-cultured with the corresponding carbon dots for 30 min before the imaging characterization.

2.6. Stability Study of the Carbon Dots

The stability experiments were carried out by measuring the fluorescent intensity change under constant ultraviolet irradiation, in different concentrations of saline solution (9 different concentration gradients of sodium chloride ranging from 0 to 2.4 mol/L). Instant stability experiment was performed by collecting the fluorescence signal 13 times without interval time and the fluorescence signals of each kind of carbon dots sample were tested every 15 min. While long-term stability experiment was evaluated once per week. Excitation wavelength of 365 nm were employed throughout the whole experiment.

2.7. Cytotoxicity Test

MTT assay was selected to perform cytotoxicity of carbon dots. L929 cells were employed as model cells. Dulbecco’s modified Eagle’s medium (DMEM) was used as a cultural condition at 37 °C with 5% CO2 in an incubator. In brief, L929 cells were cultured and added 100 μL (contain around 8000 cells) into a 96-well plate for each hole. After being incubated for 24 h, 20 μL MTT solution were added for each hole, subsequently incubated for extra 4 h. The medium was removed and 150 μL DMSO was added for a 10 min shaking. The untreated ones were regarded as the control group. Finally, the absorbance of Formazan was read at 492 nm. The relative cell viabilities (%) after treatment with carbon dots at different concentrations were calculated [46]:
Relative   viability % = OD sample OD control × 100 %

3. Results and Discussion

3.1. Fluorescent Characterization of Carbon Dots

Biogenic amine is a kind of low-molecular weight organic amine, which can participate in regulating the content of nucleic acid or protein to influence cellular metabolism and membrane stabilization for many microbes [36,37,47,48]. In addition, spermine presents a cationic charge in physiological environments and contains primary and secondary amine which could be a good candidate for the synergistic combating of pathogenic bacteria and potential bacterial dyes [38,39,47,48]. Accordingly, spermine as a kind of biogenic amine was exploited as a precursor for the carbon dots preparation and modification herein.
Fluorescent properties including excitation–emission (ex–em) spectra, emission maps, fluorescence lifetime and quantum yields were firstly studied, respectively. As shown in Figure S1a, the maximum excitation and emission of CD were 346 nm and 445 nm, respectively, which were accorded with NH2–CD, as shown in Figure S1b. Similarly, as Figure 1a depicts, the maximum excitation and emission values of spCD were 348 nm and 445 nm, which were consistent with the ones of NH2–spCD (Figure S1c). It can be observed that the modifying process did not affect the peak positions of CD and spCD. All types of carbon dots have similar excitation/emission trends. When the excitation wavelength is lower than 400 nm, there are no exciting-dependent phenomenon except for the intensity changes, which also indicated that these carbon dots may have a relative uniform size distribution. In addition, all types of carbon dots have a wide and strong fluorescent emission ranging from 400 nm to 600 nm, which indicated its application possibility for biological imaging and the 1931 CIE chromaticity images were given out as shown in Figure 1c and Figure S1d–f. All carbon dots gave out a blue to green fluorescence, where the blue light is attributed to the carbon core and the green fluorescence should result from the nitrogen or oxygen contained auxochromic groups [49]. The calculation of QYs referring to CD, spCD, NH2–CD and NH2–spCD were 48.79%, 66.46%, 40.42% and 53.47%, respectively. Obviously, a dramatic QY enhancement (nearly 20%) was obtained after nitrogen doping using spermine, while it decreased slightly after modifying with ethylenediamine. In addition, the lifetime depicted at Figure 1d did not have significant difference among the four different carbon dots. Enhanced QY should occur due to the nitrogen doping, which has been confirmed in previous research [50,51]. Usually, the fluorescence partially depends on the carbon core that has a rigid aromatic structure, which is made up of the hybridization of sp2 and sp3 with a typical ratio. Moreover, the synergy between the carbon core and functional chemical groups turns out to improve the QY [52]. In addition, the stability of carbon dots [52] were investigated for sustained irradiation, a high concentration of ion strength and constant detection. Figure 1b shows fluorescent intensity changes for 3 h ultraviolet irradiation. All the relative intensities of the carbon dots were declined after irradiation to different extents. The CD left only 50% after irradiation while the spCD remained at 70%, which indicates that doping undertook a certain degree of resistance to photobleaching. As depicted in Figure S1h, even 2.4 mol/L NaCl could not lead to a declining trend in the relative intensity of the four carbon dots. Figure 1e shows the intensity changes of the carbon dots for a constant detection (15 times) contrast to those of SYTO9 and PI, which again confirmed the strong and stable fluorescence of the four types of carbon dots. As shown in Figure S1g, the fluorescent intensity of CD and spCD only declined to 80~90% after 8 weeks, verifying the reasonable stability of the four carbon dots. For the modified ones (NH2–CD and NH2–spCD), the fluorescent intensity has a slight increase starting from the sixth week, which indicates that the ethylenediamine may lose a part in the two types of carbon dots. By contrast, SYTO9 and PI showed worse stability under the same circumstance, where the peak of fluorescent intensity of SYTO9 could not be detected in the fifth week and the one with PI had a dramatically red shift after around one month and its intensity decreased with the ongoing time.

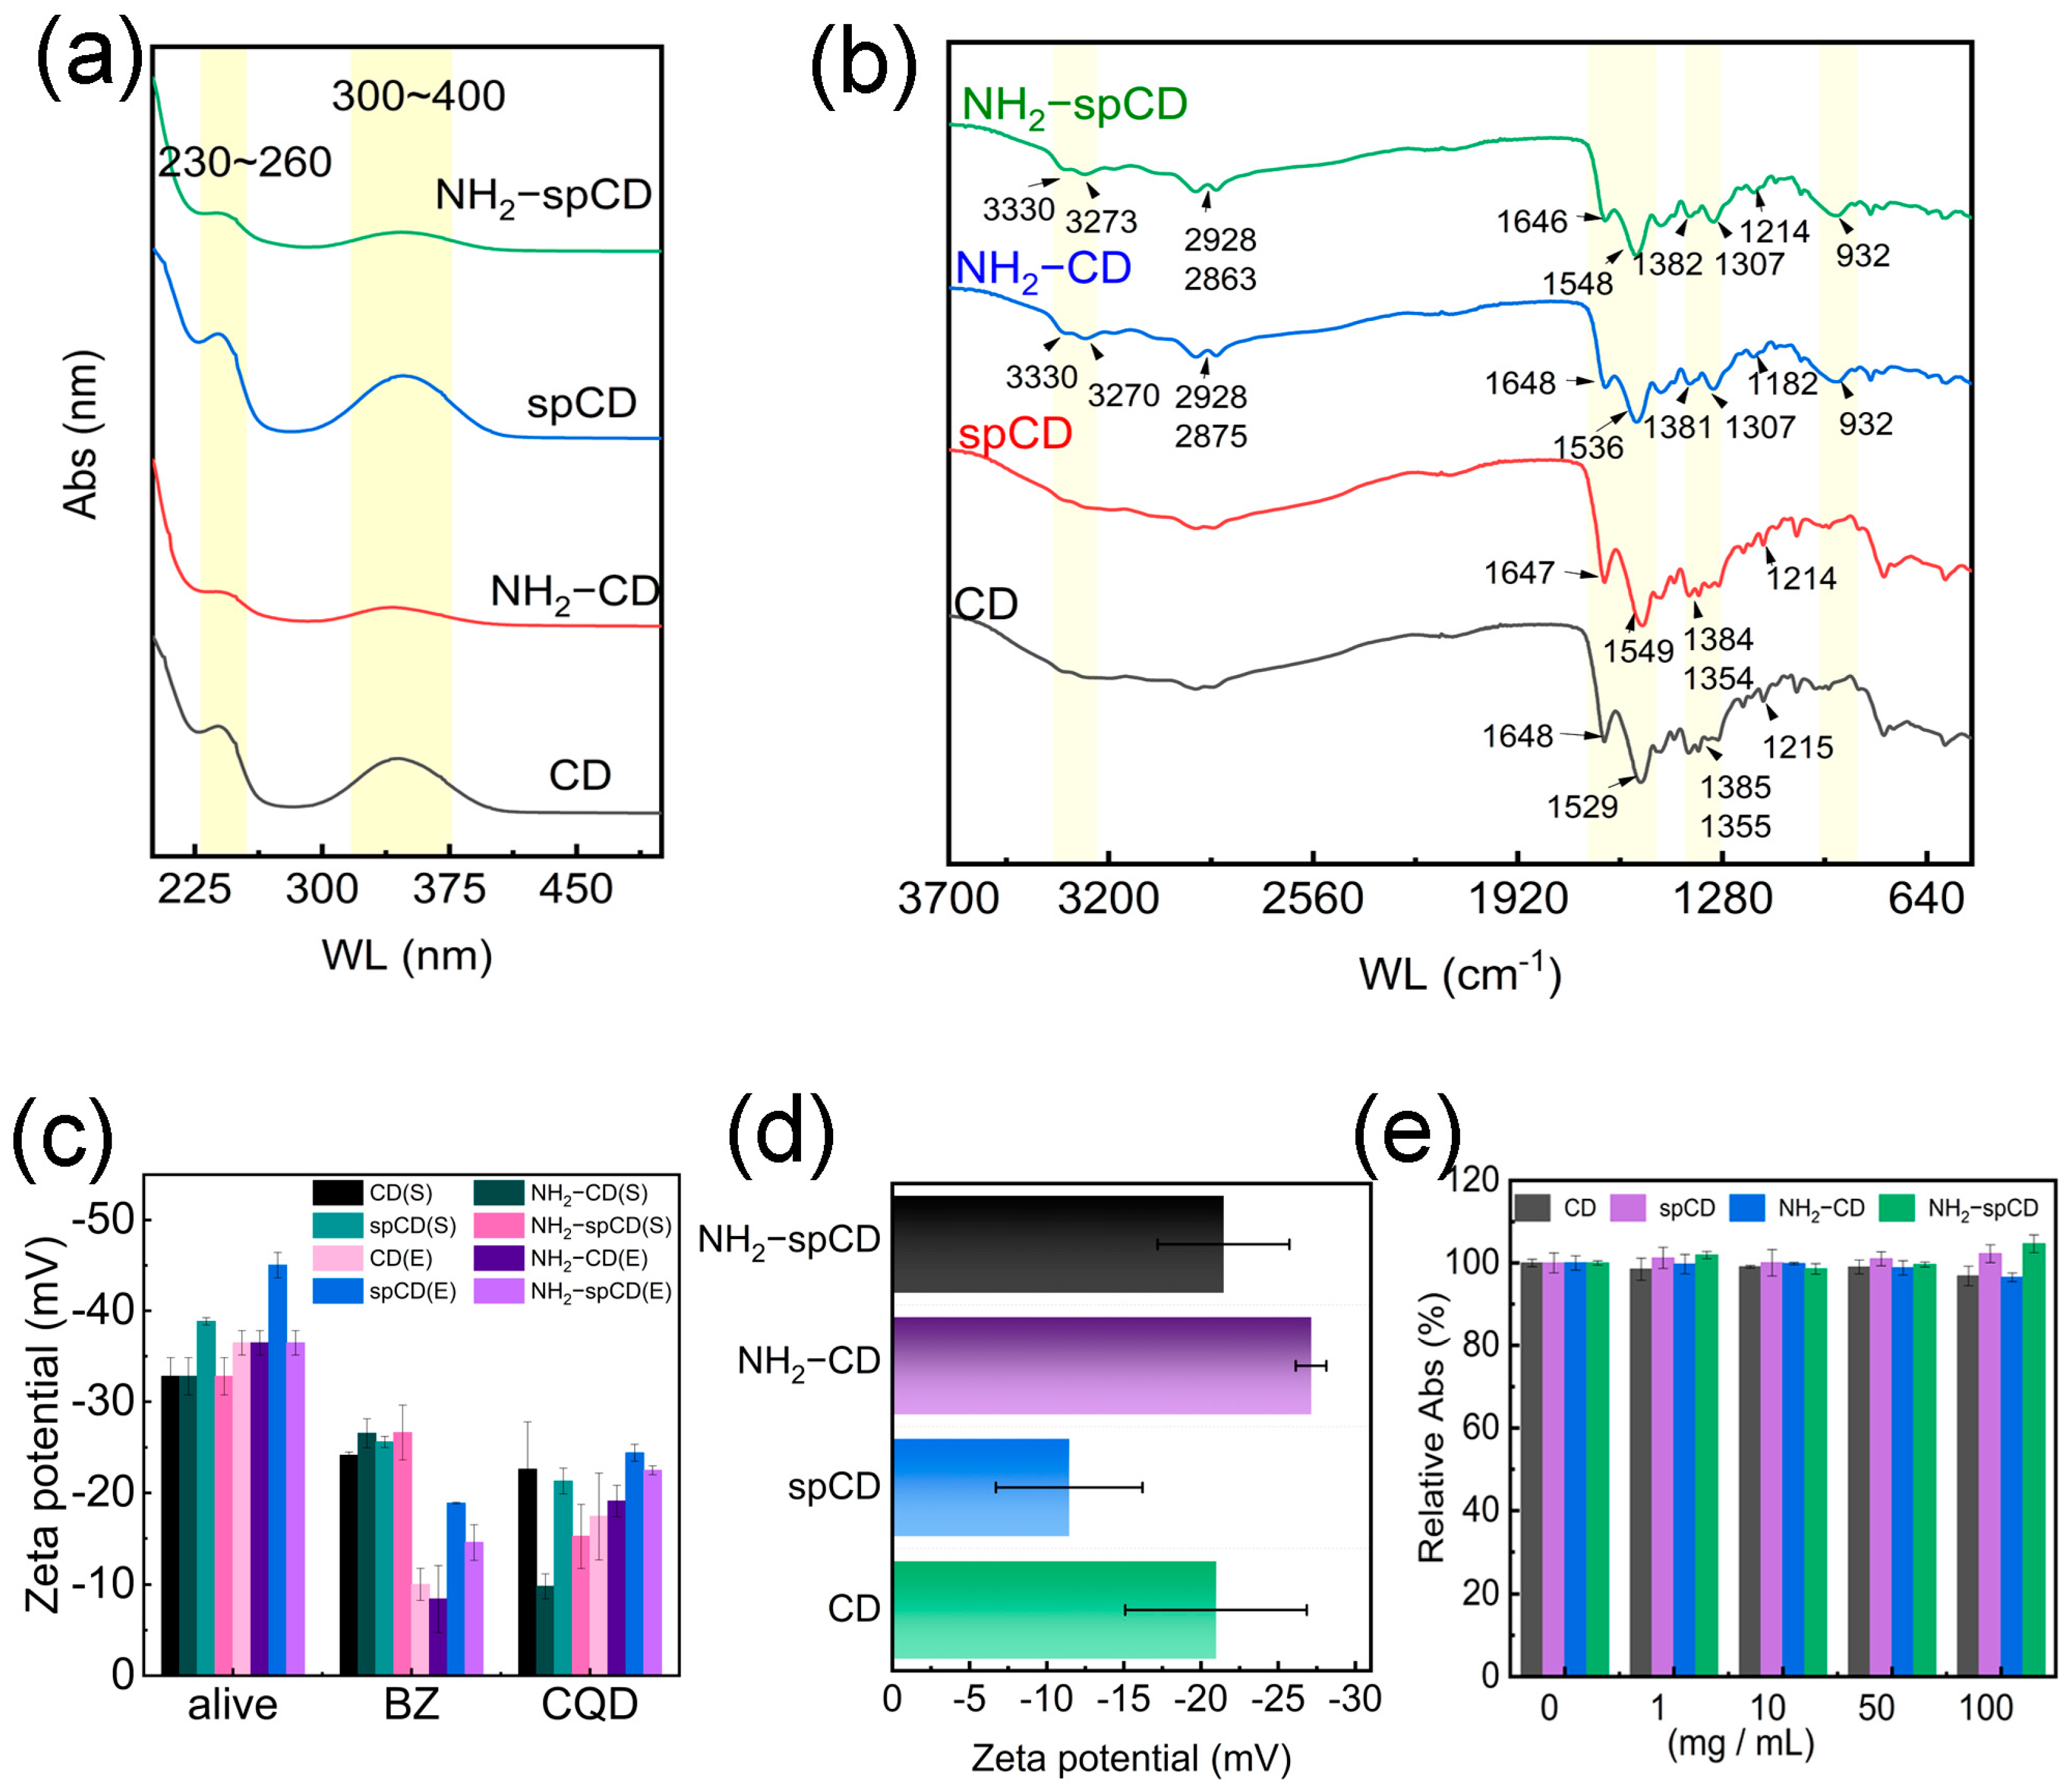
3.2. Physical Structural Analysis of Carbon Dots

Figure 2a shows the XRD characterization of carbon dots, which all showed a poor crystallinity of materials. Except for CD, spCD and the modified ones all have an obvious peak at the lattice plane of (004) located at 2θ = 32.291. As Figure 2c,d shows, HRTEM characterization exhibited the lattice spacing of around 0.294 nm and 0.298 nm, which is consistent with the JCPDS standard card (No. 46-0870, nitrogen oxide graphite). It confirmed the doping of nitrogen into the core structural between carbon chemical bonds. An average diameter of 2.01 nm and 1.38 nm for CD and spCD can be obtained, respectively. NH2–CD and NH2–spCD showed the average diameters around 2 nm (Figure S2). Obviously, the size of the modified carbon dots was not increased extremely after the EDC/NHS reaction. AFM images of the four carbon dots are also given out in Figure 2e and Figure S3, which indicates the uniformity of the size and the thickness of 1.01~2.99 nm. The TEM and AFM characterizations confirms the successful formation of the carbon dots, respectively. Diameters and relevant QYs from other works are exhibited in Figure 2b, confirming the smaller sizes and higher quantum yield compared with the previous works [13,15,16,22,26,27,28,40,41,53,54,55,56,57,58,59,60,61,62,63].

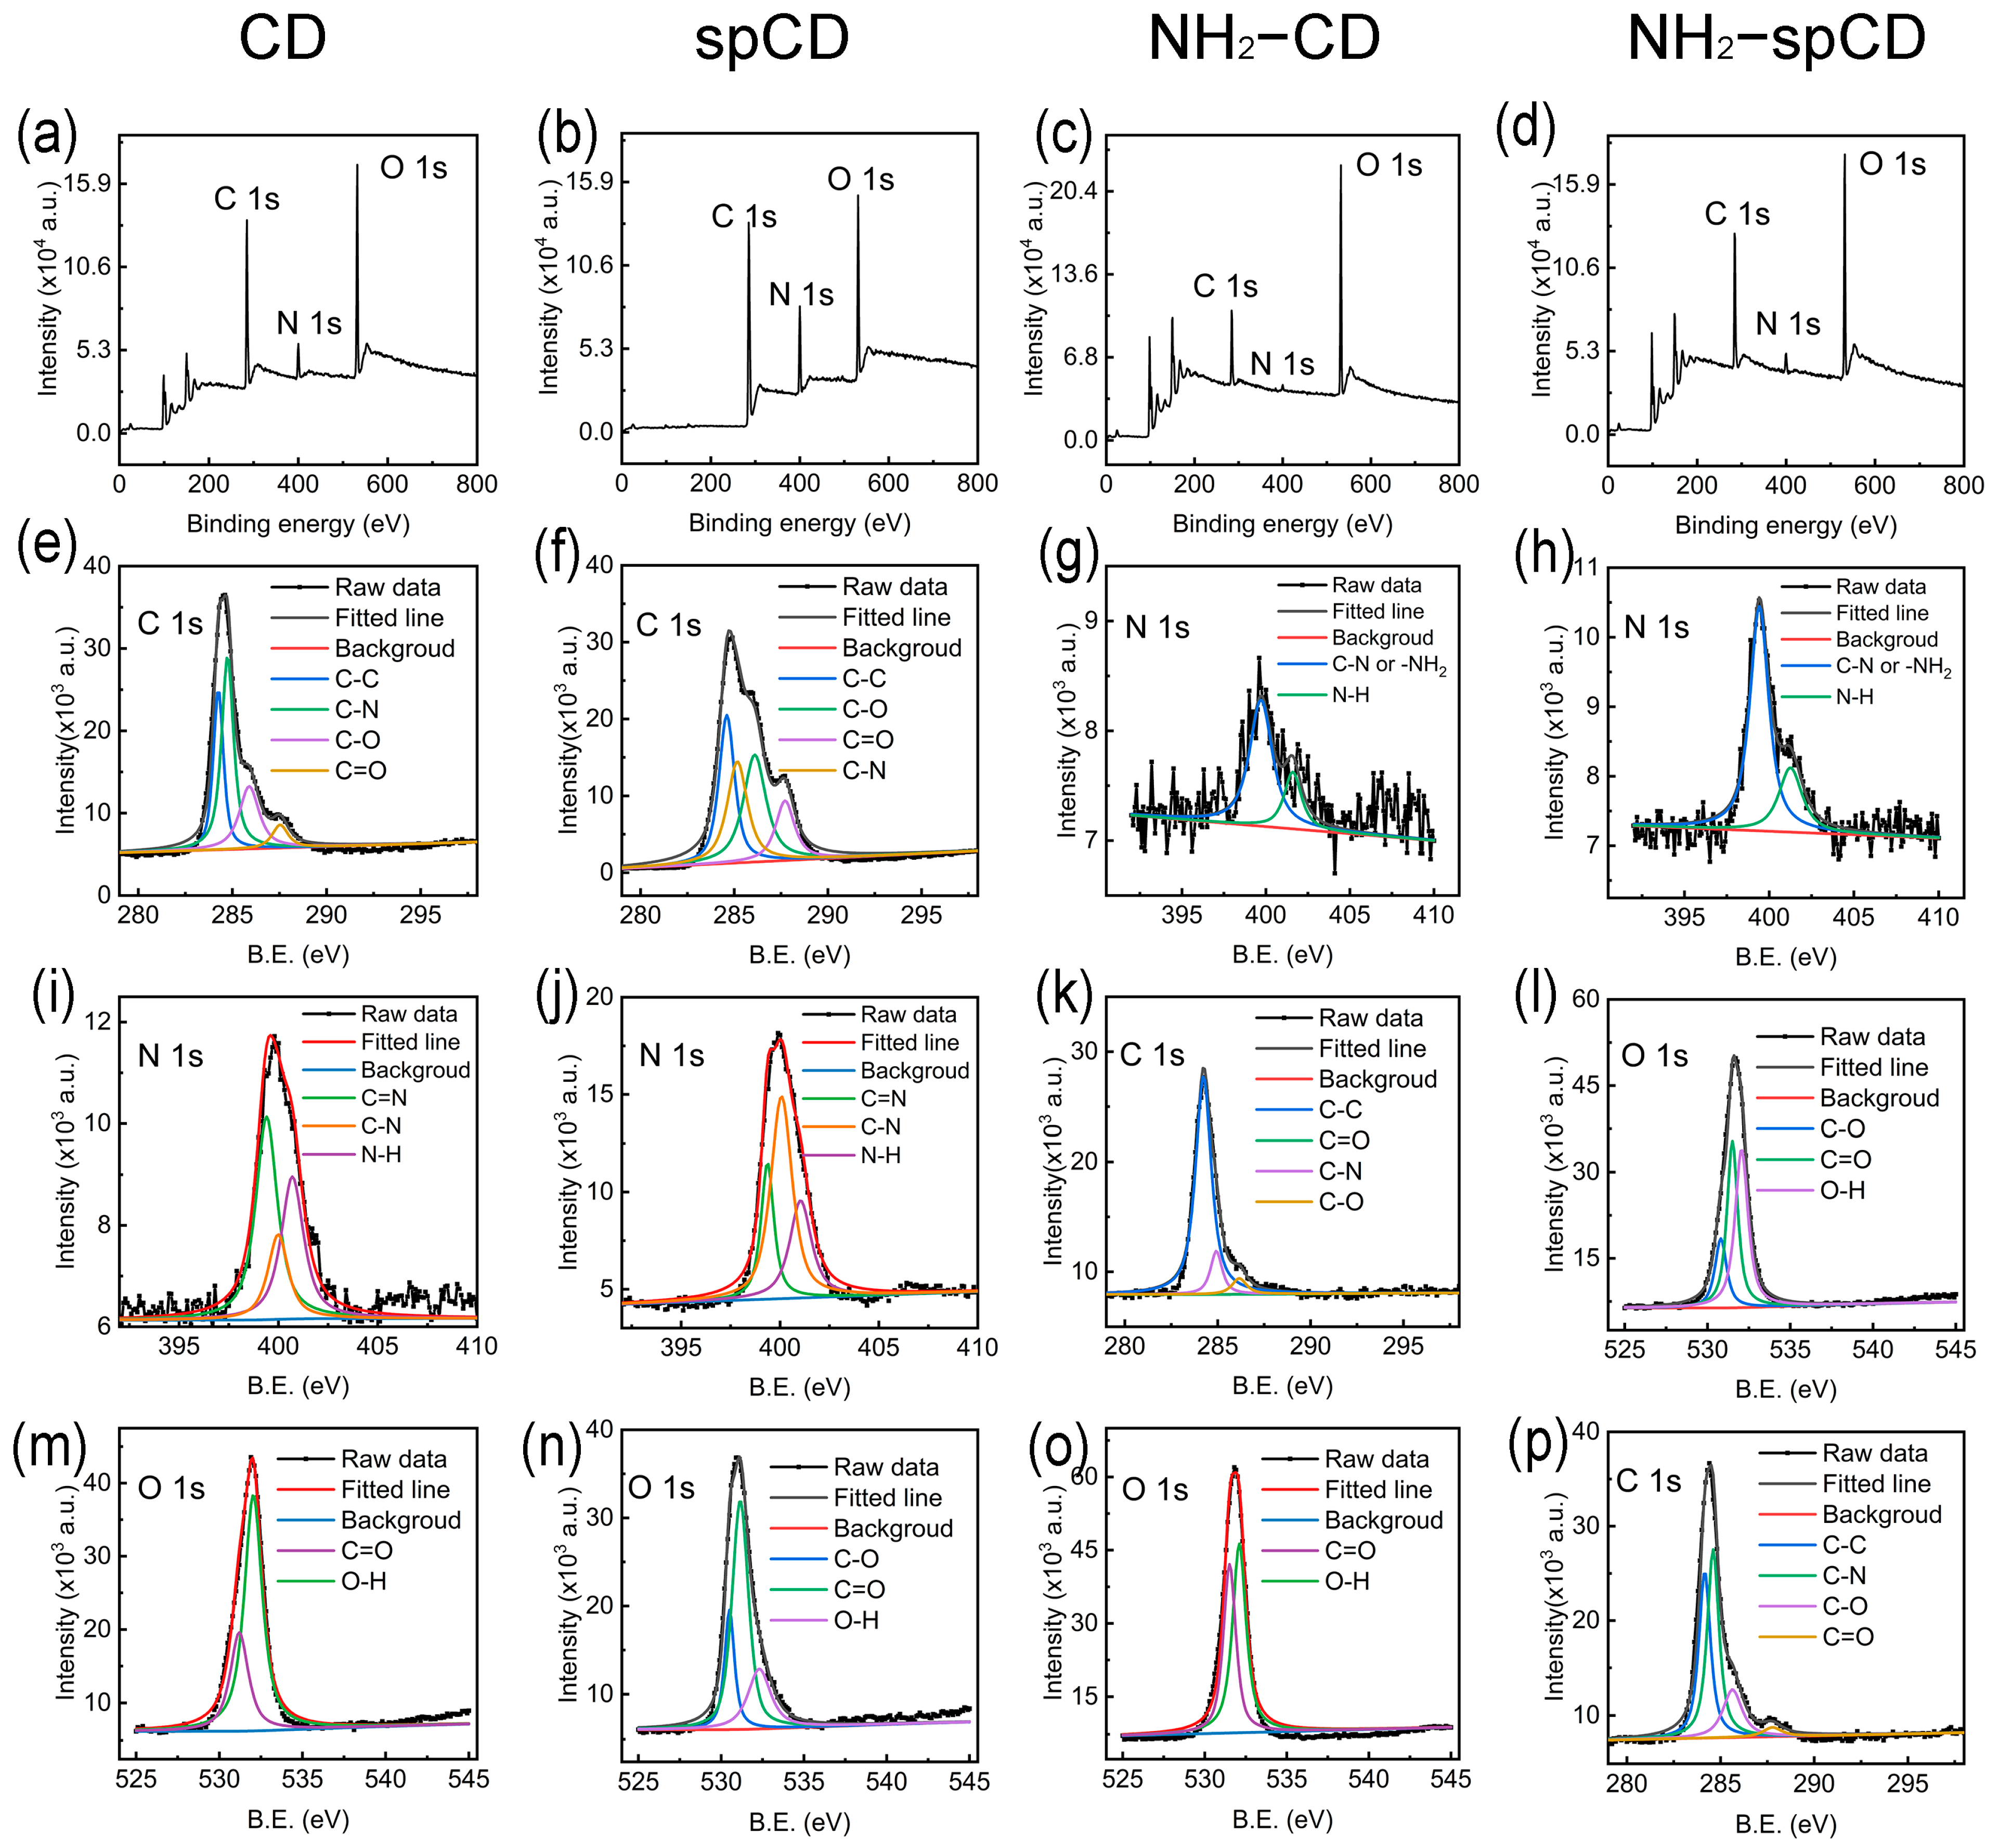
3.3. Chemical Structural Analysis of Carbon Dots

UV–Vis spectra, FTIR and XPS characterizations were employed to analyze the chemical structure of carbon dots. As shown in Figure 3a, four carbon dots have a similar UV–Vis peak distribution. Therein, the peak located at 230~260 nm represents a π→π* transition which means the existence of chromophore such as sp2 hybridization, while the peak located at 300~400 nm represents an n→π* transition which means the existence of auxochrome including C–N, C–O or C=O. Neither the addition of spermine nor the EDC/NHS modification of ethylenediamine had largely changed the UV–Vis spectra. FTIR and X PS were further carried out to identify the surface chemical groups and elemental compositions. As depicted in Figure 3b, all types of carbon dots own a carboxyl characteristic wide peak at 3500~2500 cm−1 and all have alkane stretching vibration peaks (e.g., 2928 and 2863 cm−1 for NH2–spCD). The distribution of the peaks was identical between CD and spCD as well as between NH2–CD and NH2–spCD. Comparing with CD and spCD, the double peaks appeared at 3370 and 3273 cm−1 for NH2–CD and NH2–spCD, which may represent the amino stretching vibration. The peak at 1648 cm−1 may be the amide I band or C=O stretching vibration, while a secondary amide II band may located at 1548~1529 cm−1 [37]. For NH2–CD and NH2–spCD, 1382 and 1308 cm−1 may represent a C–N stretching vibration for aromatic primary ammonia and aromatic secondary ammonia. For CD and spCD, 1384, 1354, 1321 and 1219 cm−1 also represent aromatic ammonia spCD [34]. Peaks at 1214, 1182 or 1215 cm−1 may represent a C–O stretching vibration for the four types of carbon dots [64]. Peaks at 1648, 1548~1529, 1382 and 1308 cm−1 also suggest the formation of an aromatic ammonia structure, which is consistent with the UV–Vis results indicating the existence of sp2 hybridization. Usually, when aromatic structures are formed, most peaks may have a red shift. For example, a C=O stretching vibration should be located at around 1735 cm−1. However, in this case, a C=O stretching vibration was located at around 1648 cm−1 which matched the characteristic peak of amide. Differing from the red shift condition, peaks of an N–H stretching vibration would have a blue shift if the aromatic structure appeared. As a result, the double peaks at 3370 and 3273 cm−1 are most likely the primary amine characteristic peak [65]. Based on these characterizations, the peak at 932 cm−1 may be the N–H out-of-plane bending vibration that CD and spCD did not have, which further suggests the existence of amino on the NH2–spCD and NH2–CD [34,64].
Figure 4 shows the full-scan and high-resolution of XPS spectra for CD and spCD, respectively. In Figure 4a, the three peaks located at 284.8 eV (62.34%), 399.84 eV (9.39%) and 531.93 eV (28.27%) correspond to C 1s, N 1s and O 1s, respectively, for CD. Similarly, the three peaks located at 284.8 eV (65.18%), 399.93 eV (15.99%) and 531.99 eV (18.82%) correspond to C 1s, N 1s and O 1s, respectively, for spCD (Figure 4b). Upon the spermine being applied, the content of nitrogen increased while the content of oxygen decreased, which suggests the spermine structure had combined with the citric acid and ethylenediamine while the high-resolution XPS of both CD and spCD presented similar chemical circumstances for each element. For instance, as Figure 4f depicts, the C 1s spectrum of spCD (Figure 4f) shows C–C (284.46 eV), C–N (285.2 eV), C–O (285.95 eV) and C=O (287.57 eV) [45,66]. The N 1s spectrum of spCD (Figure 4j) shows C=N (399.36 eV), C–N (400.07 eV) and N–H (401.04 eV) [65,66]. The O 1s spectrum of spCD (Figure 4n) shows C–O (530.50 eV), C=O (531.13 eV) and O–H (532.30 eV) [37]. The QY enhancement upon the spermine addition should be due to the enhanced nitrogen content and rich pyridine nitrogen in the as obtained spCD, since pyridine nitrogen can increase defect states to create defect emission on the base of intrinsic emission when excited [67]. Meanwhile, in the full-scan and high resolution XPS spectra of NH2–CD (Figure 4c,g,k,o) located at 284.8 eV, 399.79 eV and 531.82 eV, and XPS sepctra of NH2–spCD (Figure 4d,h,l,p) peaks located at 284.8 eV, 399.41 eV and 5531.67 eV correspond to C 1s, N 1s and O 1s, respectively [24,45,65,66,68]. The results indicated that NH2–CD and NH2–spCD have similar chemical structures according to the high-resolution XPS spectra. However, one point should be noticed that peaks of 399.70 eV (C–N or −NH2) and 401.60 eV (N–H) may mean the existence of amino in N 1s spectra for NH2–CD, and 399.73 eV (C–N or −NH2) and 402.18 eV (N–H) for NH2–spCD [24,37]. On the contrary, CD and spCD did not have the identical peaks. Herein, FTIR spectra analysis has already suggested that the modified (ethanediamine using EDC/NHS chemistry) ones have amino groups while the non-modified ones did not. Under high temperature and pressure hydrothermal conditions, the amino groups are very easy to interact with carboxyl ones, which can form acylamino so that the primary amine group is hardly left [69]. Combined with the XPS spectra, the successful modification of amino groups into CD and spCD to form NH2–CD and NH2–spCD, respectively, could be confirmed.

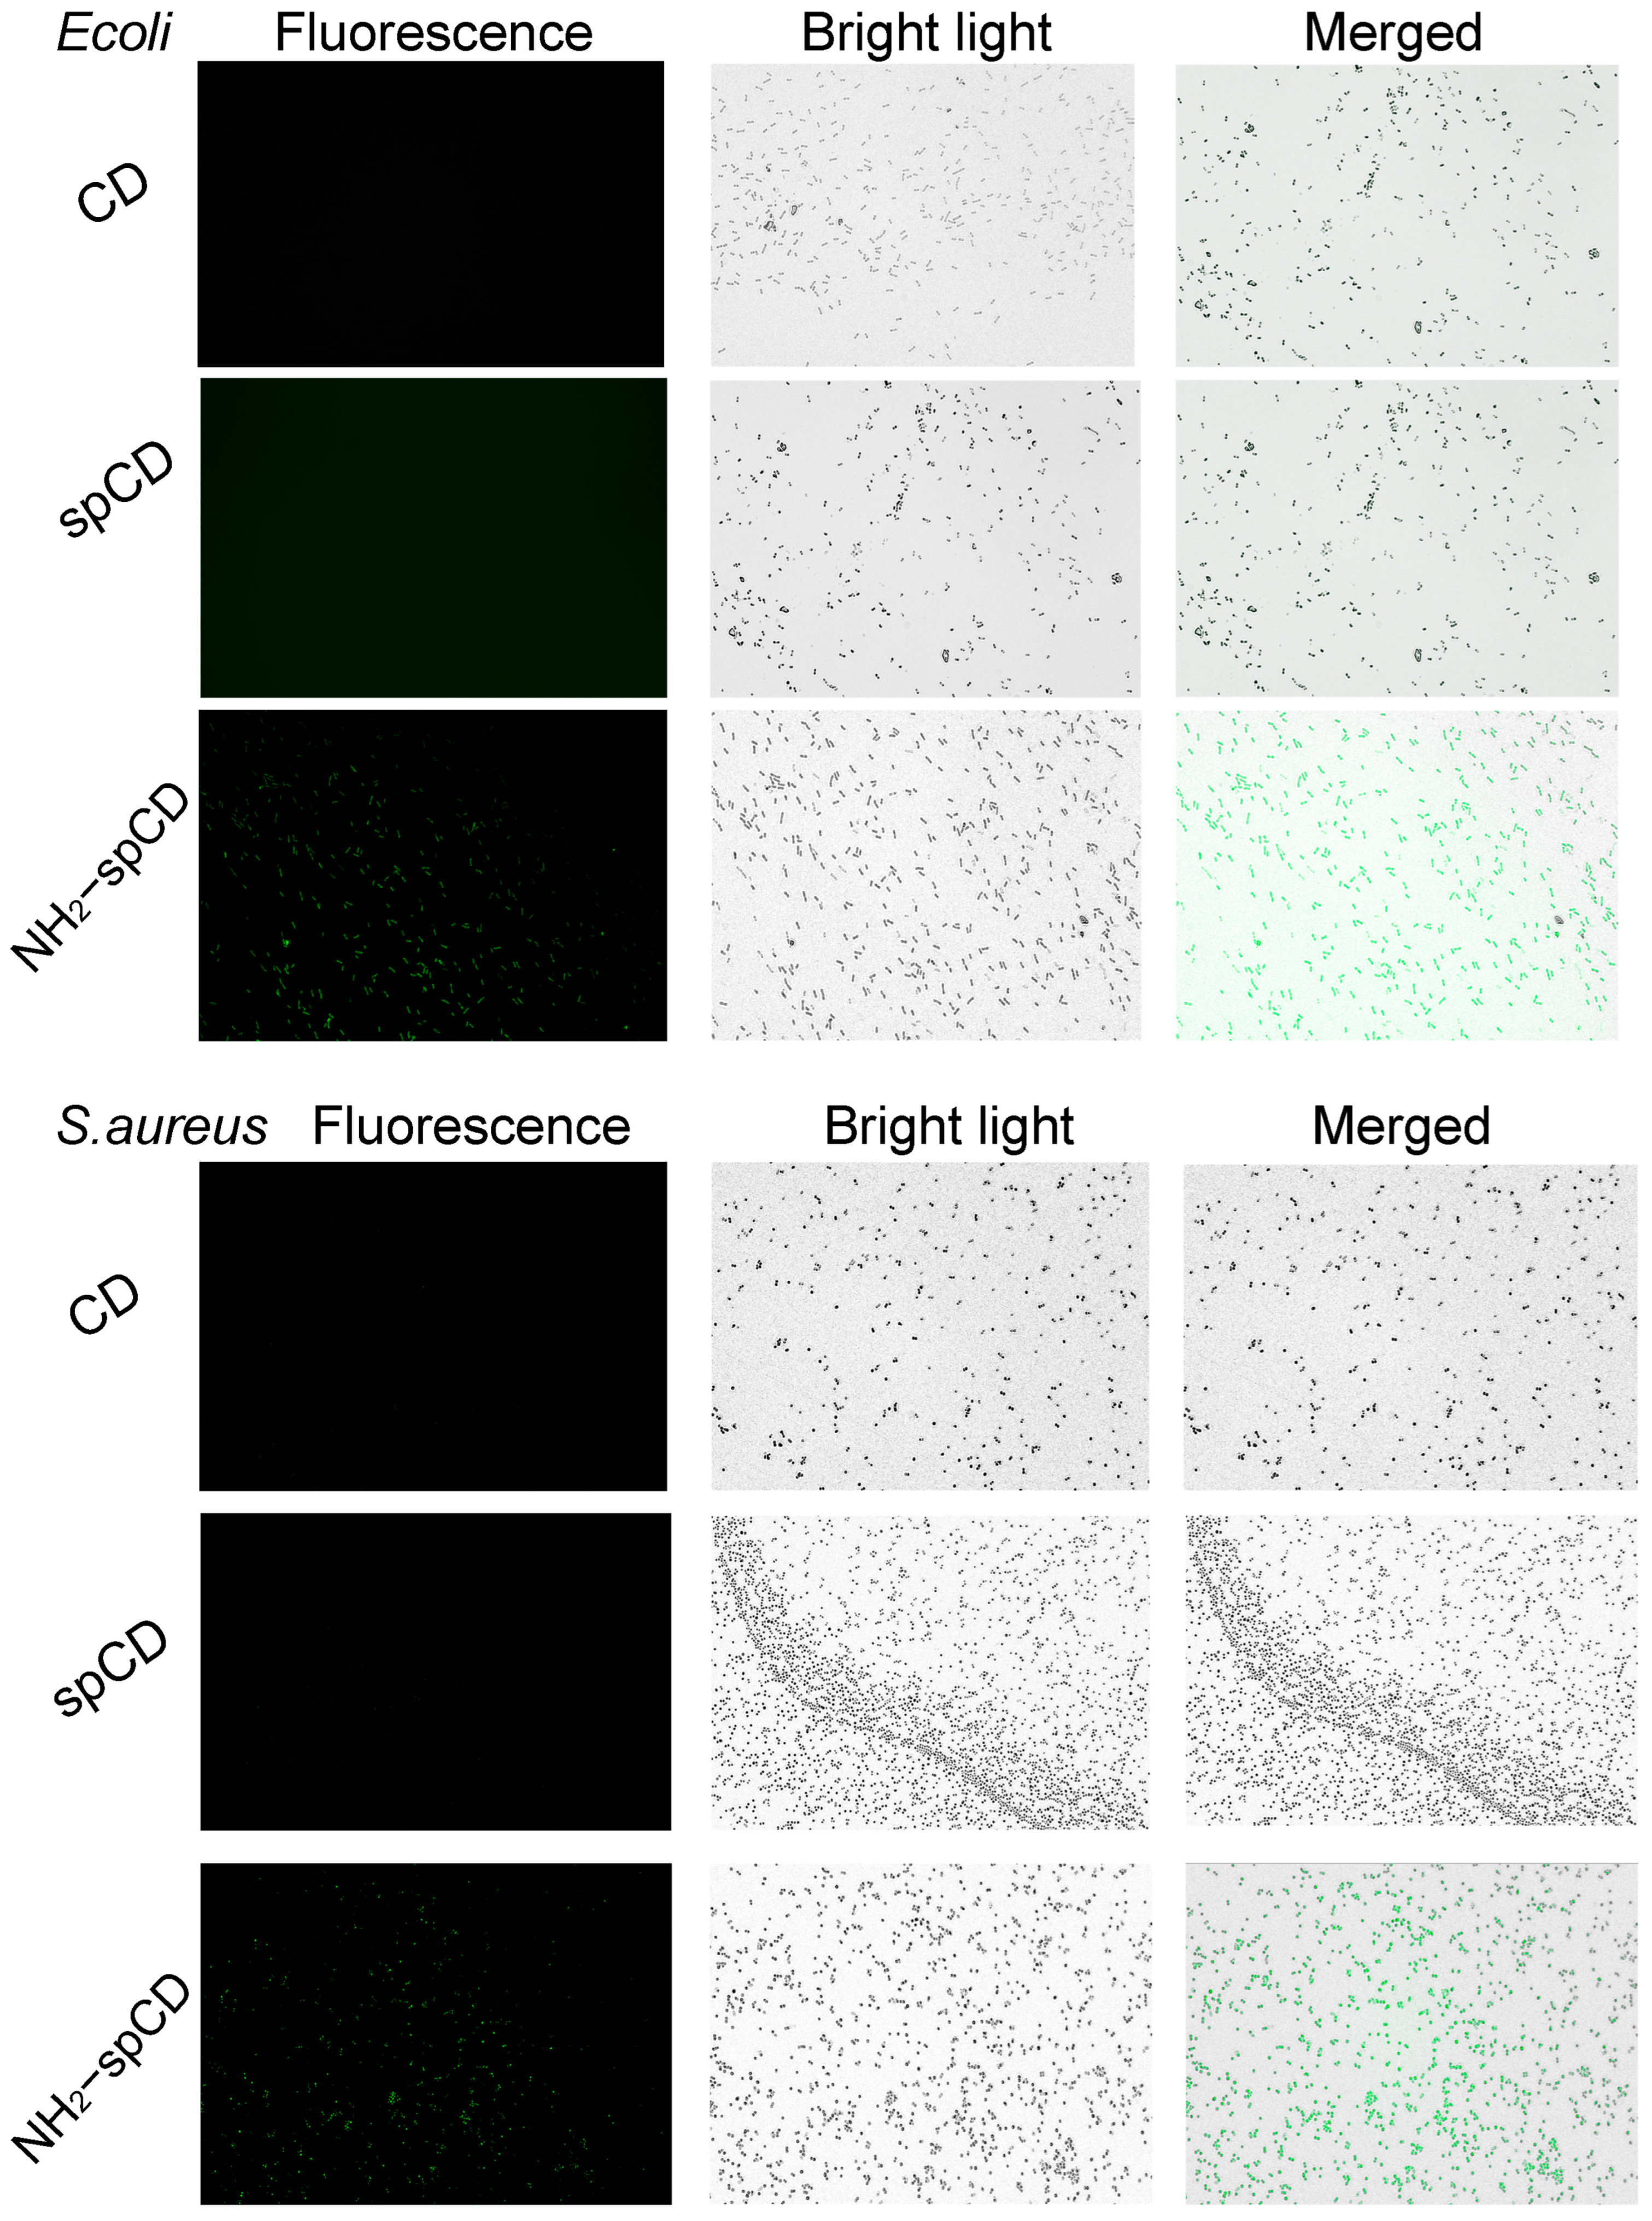
3.4. Bacterial Imaging by Carbon Dots

3.4.1. Imaging for Dead Bacteria

As suggested, a smaller size of 5 nm would be good at penetrating bacterial cells at the same cultural time [13,14,15,16,60] and other functional groups should also be determining factors. As a cationic surfactant, benzalkonium bromide (BZ) was generally used as a bactericide for surface sterilization through the electrostatic interaction [22,37]. As Figures S4 and S5 show, all types of carbon dots could stain bacterial cells without a difference regardless of gram types, which may be due to the electronic attraction between the negatively charged carbon dots and the bacterial and positively charged benzalkonium bromide on the dead bacteria [14,41,62]. Considering the negative charge of the four types of carbon dots (Figure 3d), electrostatic adsorption would not be the main reason for their staining ability. The negative charge of the four carbon dots can be confirmed by characterizing the zeta potentials (Figure 3c). We also studied the the zeta potential change of the bacteria after being cultured with benzalkonium bromide and subsequently being cultured with the carbon dots. As shown in Figure 3c, the surface charges of the bacteria moved toward the positive trend, which then turned to a negative change upon further incubation with carbon dots. The results indicated that four carbon dots can combine with the residual groups of benzalkonium bromide on a bacterial surface on the BZ-treated bacteria, which can thus be used for the imaging of dead bacterial cells (Figures S4 and S5).
Since bacterial death was not always under drastic circumstances, for example, killing by bactericides, the 60 °C one-hour water bath treatment as a mild method to obtain dead bacteria was employed, which would not significantly damage the bacteria membrane like benzalkonium bromide [24]. According to the theory mentioned in the first paragraph of Section 3.4.1, a size under 5 nm is an essential condition for nanomaterials to enter the bacteria. However, the imaging behaviors were different among the four types of carbon dots. As Figure 5 shows, spCD could more dramatically dye the dead cells than CD, and NH2–spCD could achieve more efficient dying compared with NH2–CD (Figure S6). The possible reasons are summarized as follows: One is the QY difference between spermine-integrated ones (CD and NH2–CD for 48.79% and 40.42%, respectively) and non-spermine-integrated ones (spCD and NH2–spCD for 66.46% and 53.47%, respectively), accordingly, higher QY would be favorable for fluorescent imaging. The other is that the surface functional groups on the carbon dots could also influence the imaging efficiency. As shown in Figure 4, the high-content of the C–O peak was observed in the spermine-integrated ones (spCD and NH2–spCD, Figure 4n,p) compared with the non-spermine-integrated ones (CD and NH2–CD, Figure 4m,o), whilst the former presented the C–O peak at high-resolution XPS which the latter did not show. Considering all types of CQDs have carboxyl groups, there might be more carboxyl on the surface of the spermine-integrated ones to influence the affinity toward bacteria [20,54]. In addition, the four types of carbon dots do not differ much in size. As a result, small size would not be the only important factor to influence bacterial imaging. The staining results of NH2–CD and NH2–spCD are also carried out in Figure S6, which reveals a better staining performance of NH2–spCD than NH2–CD. This may also be due to the smaller size and higher QY of NH2–spCD than NH2–CD.

3.4.2. Live Bacterial Imaging

Compared with the staining of dead bacterial cells, live ones are more difficult to dye because of the dense bacterial cell walls and the charge barrier deriving from chemical groups on their cell walls [14,15,16]. Many kinds of antibacterial medicines or antibiotics have amino or acylamino groups that could be chosen to use on the surface of bacteria or could enter the inside of bacteria such as β-Lactam or sulfonamide [30,31]. As a result, precursors containing amido were considered for synthesizing carbon dots including ethylenediamine and spermine. Though acylamino and secondary amino were represented after a one-step hydrothermal method, both CD and spCD failed to stain alive bacterial cells as Figure 6 depicts. Since previous research has indicated that the primary amine group has an affinity towards the bacterial surface [26,32,34], ethylenediamine was then applied to modify the carbon dots on their surface to obtain NH2–CD and NH2–spCD (with primary amine groups). As expected, both E.coli and S.aureus were stained successfully by NH2–spCD (Figure 6). However, the result of NH2–CD was not satisfied for both E.coli and S.aureus imaging (Figure S7), which should be due to the shallow fluorescent comparing with NH2–spCD. The characterization of carbon dots in Figure 3a has proved our concept: the peak location and strength of CD and spCD were nearly identical as well as NH2–CD and NH2–spCD, which may be because they have the same precursors for synthesis. However, the modified groups (NH2–CD and NH2–spCD) presented primary amine while the non-modified groups (CD and spCD) did not. XPS further confirmed the more primary amine groups on the surface of the spermine-integrated ones (NH2–CD and NH2–spCD). In Figure 6, primary amino functionalized NH2–spCD successfully stained the alive bacteria, which indicates that the primary amine groups on the surface of carbon dots is a significant factor for staining alive bacteria in addition to the factor of high QY. Table 1 shows a summary of the four types of CDs in aspects of imaging and other properties which may suggest that spermine could enhance the QY value and primary amine may promote the behavior of alive cell staining. Though the zeta potentials are not beneficial for bacterial imaging, the extremely small size of CDs may make CDs go through the cells towards the damaged cell walls [35].

3.4.3. MTT Assay

An MTT assay was carried out for CD, spCD, NH2–CD and NH2–spCD. Concentrations of carbon dots were designed at 1, 10, 50, 100 μg/mL and 0 μg/mL as a control group. After the staining process, the relative absorbances were calculated. As described in Figure 3e, all types of carbon dots have no effect on L929 cell viability even under a concentration of 100 μg/mL, which suggests a great biocompatible property.

4. Conclusions

Four types of carbon dots were synthesized for imaging dead or alive bacterial cells. The imaging of dead cells was firstly investigated by four types of carbon dots. Dead bacterial cells treated with 3% benzalkonium bromide can be stained by all types of carbon dots, while the one treated with a 60 °C water bath for 1 h can be stained by only spermine–carbon dots (spCD and NH2–spCD). Spermine can enhance QY through nitrogen doping that causes a fluorescent enhancement for imaging, while the small size, with an average diameter of 1.38 nm, makes it possible for spCD to penetrate dead bacteria cell walls. In addition, more carboxyl groups may help spCD be close with cell walls because of the amidogen–carboxyl interaction between bacterial cell walls and the surface of spCD. For the next step, carbon dots were employed to stain alive bacteria. Only NH2–spCD gave out a reasonable result, which may be attributed to the modification of primary amine groups. Notably, primary amine groups were not found on the surface of CD and spCD. Therefore, this work provides a special angle onsuperficial groups of carbon dots for bacterial fluorescent staining. However, there are still several insufficient points. Because of the similar excitation–emission peak value and wide emission range, these carbon dots could not recognize dead or alive bacterial cells compared with some other studies [22,23,35]. The fluorescent intensity for imaging alive cells was not as strong as the imaging of dead ones, since NH2–spCD possesses a negative charge. Considering the high QY value, the primary amine groups may not the only reason for sticking to bacterial cells. Furthermore, the tissue imaging of bacterial cells would be realized if the carbon dots could realize two-photon fluorescence owning a near infrared region adsorption [70,71]. Other factors, such as the interactions of other chemical groups between carbon dots and bacteria and the effect of hydration particle size, should be discussed more specifically in order to better demonstrate the mechanism for bacterial imaging using carbon dots. Efforts in staining intensity and specificity need to be improved to create a live/dead kit to replace the expensive commercial dyes.

Supplementary Materials

The following supporting information can be downloaded at: https://www.mdpi.com/article/10.3390/nano13030437/s1, Figure S1: (a) FL emission map and ex-em spectrum of CDs, (b) NH2–CDs and (c) NH2–spCDs; (d) CIE 1931 chromaticity chart of CDs, (e) NH2–CDs and (f) NH2–spCDs at excitation of 300~450 nm (step = 5 nm); (h) Relative intensity changes of CDs, spCDs, NH2–CDs, NH2–spCDs and two dyes (SYTO9 and PI) for a long-term placement; (g) Relative fluorescent intensity of CDs, spCDs, NH2–CDs, and NH2–spCDs under different concentration of NaCl solutions; Figure S2: TEM of (a) NH2–CDs and (b) NH2–spCDs; size distribution of (c) NH2–CDs and (d) NH2–spCDs; Figure S3: AFM of (a) CDs, (b) spCDs, (c) NH2–CDs (left: 2D images; middle: 3D images corresponding to the 2D images; right: measurements of height on the left images); Figure S4: Imaging of E.coli by CD, spCD, NH2–CD, and NH2–spCD (bacterial was treated with 3% benzalkonium bromide); Figure S5: Imaging of S.aureus by CDs, spCDs, NH2–CDs, and NH2–spCDs (bacterial was treated with 3% benzalkonium bromide); Figure S6: Imaging of dead E.coli and S.aureus by NH2–CDs and NH2–spCDs (bacterial was treated with 60 ℃ water bath for 1 hour); Figure S7: Imaging of alive E.coli and S.aureus by NH2–CDs.

Author Contributions

Conceptualization, Y.X. and Y.L.; methodology, Y.L. and D.Z.; software, L.Y. and Y.S.; validation, Y.X., Y.L. and D.Z.; formal analysis, Y.L. and L.Y.; investigation, Y.L.; resources, Y.X.; data curation, Y.L. and D.Z.; writing—original draft preparation, Y.L. and Y.X.; writing—review and editing, Y.X. and Y.L.; visualization, L.Y. and Y.S.; supervision, Y.X.; project administration, Y.X.; funding acquisition, Y.X. All authors have read and agreed to the published version of the manuscript.

Funding

This work was supported by [Outstanding Youth Innovation Team of Universities in Shandong Province] (2019KJA027).

Data Availability Statement

The original data supporting reported results can be obtained through the e-mail ([email protected]) for asking.

Acknowledgments

Thanks for the instrument supporting by instrument sharing platform of Qingdao University.

Conflicts of Interest

The authors declare no conflict of interest.

References

  1. Costa, D.; Johani, K.; Melo, D.; Lopes, L.; Lima, L.L.; Tipple, A.; Hu, H.; Vickery, K. Biofilm contamination of high-touched surfaces in intensive care units: Epidemiology and potential impacts. Lett. Appl. Microbiol. 2019, 68, 269–276. [Google Scholar] [CrossRef] [PubMed] [Green Version]
  2. Qu, M.; Deng, Y.; Zhang, X.; Liu, G.; Huang, Y.; Lin, C.; Li, J.; Yan, H.; Li, X.; Jia, L.; et al. Etiology of acute diarrhea due to enteropathogenic bacteria in Beijing, China. J. Infect. 2012, 65, 214–222. [Google Scholar] [CrossRef] [PubMed]
  3. Grass, J.E.; Gould, L.H.; Mahon, B.E. Epidemiology of foodborne disease outbreaks caused by clostridium perfringens, United States, 1998–2010. Foodborne Pathog. Dis. 2013, 10, 131–136. [Google Scholar] [CrossRef] [PubMed] [Green Version]
  4. Suleyman, G.; Alangaden, G.; Bardossy, A.C. The role of environmental contamination in the transmission of nosocomial pathogens and healthcare-associated infections. Curr. Infect. Dis. Rep. 2018, 20, 12. [Google Scholar] [CrossRef] [PubMed]
  5. He, X.; Xiong, L.-H.; Zhao, Z.; Wang, Z.; Luo, L.; Lam, J.W.Y.; Kwok, R.T.K.; Tang, B.Z. AIE-based theranostic systems for detection and killing of pathogens. Theranostics 2019, 9, 3223–3248. [Google Scholar] [CrossRef]
  6. Hickey, M.E.; He, L. SERS imaging analyses of bacteria cells among plant tissues. Talanta 2021, 225, 122008. [Google Scholar] [CrossRef]
  7. Lin, V.S.; Chen, W.; Xian, M.; Chang, C.J. Chemical probes for molecular imaging and detection of hydrogen sulfide and reactive sulfur species in biological systems. Chem. Soc. Rev. 2015, 44, 4596–4618. [Google Scholar] [CrossRef] [Green Version]
  8. Parker, M.F.L.; Flavell, R.R.; Luu, J.M.; Rosenberg, O.S.; Ohliger, M.A.; Wilson, D.M. Small molecule sensors targeting the bacterial cell wall. ACS Infect. Dis. 2020, 6, 1587–1598. [Google Scholar] [CrossRef]
  9. Vojnovic, I.; Winkelmeier, J.; Endesfelder, U. Visualizing the inner life of microbes: Practices of multi-color single-molecule localization microscopy in microbiology. Biochem. Soc. Trans. 2019, 47, 1041–1065. [Google Scholar] [CrossRef]
  10. Deng, Y.; Wang, L.; Chen, Y.; Long, Y. Optimization of staining with SYTO 9/propidium iodide: Interplay, kinetics and impact on Brevibacillus brevis. Biotechniques 2020, 69, 88–98. [Google Scholar] [CrossRef]
  11. Marshall, A.P.; Shirley, J.D.; Carlson, E.E. Carlson Enzyme-targeted fluorescent small-molecule probes for bacterial imaging. Curr. Opin. Chem. Biol. 2020, 57, 155–165. [Google Scholar] [CrossRef] [PubMed]
  12. Huang, Y.; Chen, W.; Chung, J.; Yin, J.; Yoon, J. Recent progress in fluorescent probes for bacteria. Chem. Soc. Rev. 2021, 50, 7725–7744. [Google Scholar] [CrossRef] [PubMed]
  13. Pathak, A.; Pv, S.; Stanley, J.; Babu, T.G.S. Multicolor emitting N/S-doped carbon dots as a fluorescent probe for imaging pathogenic bacteria and human buccal epithelial cells. Microchim. Acta 2019, 186, 157. [Google Scholar] [CrossRef] [PubMed]
  14. Sun, B.; Wu, F.; Zhang, Q.; Chu, X.; Wang, Z.; Huang, X.; Li, J.; Yao, C.; Zhou, N.; Shen, J. Insight into the effect of particle size distribution differences on the antibacterial activity of carbon dots. J. Colloid Interface Sci. 2021, 584, 505–519. [Google Scholar] [CrossRef]
  15. Yang, J.; Zhang, X.; Ma, Y.-H.; Gao, G.; Chen, X.; Jia, H.-R.; Li, Y.-H.; Chen, Z.; Wu, F.-G. Carbon dot-based platform for simultaneous bacterial distinguishment and antibacterial applications. ACS Appl. Mater. Interfaces 2016, 8, 32170–32181. [Google Scholar] [CrossRef]
  16. Zhao, D.; Liu, X.; Zhang, R.; Huang, X.; Xiao, X. Facile one-pot synthesis of multifunctional protamine sulfate-derived carbon dots for antibacterial applications and fluorescence imaging of bacteria. N. J. Chem. 2021, 45, 1010–1019. [Google Scholar] [CrossRef]
  17. Sun, Y.; Zhang, M.; Bhandari, B.; Yang, C. Recent development of carbon quantum dots: Biological toxicity, antibacterial properties and application in foods. Food Rev. Int. 2020, 38, 1513–1532. [Google Scholar] [CrossRef]
  18. AValizadeh, A.; Mikaeili, H.; Samiei, M.; Farkhani, S.M.; Zarghami, N.; Kouhi, M.; Akbarzadeh, A.; Davaran, S. Quantum dots: Synthesis, bioapplications, and toxicity. Nanoscale Res. Lett. 2012, 7, 480. [Google Scholar] [CrossRef] [Green Version]
  19. Zheng, X.T.; Ananthanarayanan, A.; Luo, K.Q.; Chen, P. Glowing graphene quantum dots and carbon dots: Properties, syntheses, and biological applications. Small 2015, 11, 1620–1636. [Google Scholar] [CrossRef]
  20. Dong, H.; Sarkes, D.A.; Stratis-Cullum, D.N.; Hurley, M.M. Direct conjugation of fluorescent quantum dots with E. coli via surface-displayed histidine-containing peptides. Colloids Surf. B-Biointerfaces 2021, 203, 259–265. [Google Scholar] [CrossRef]
  21. Dong, Z.; Cui, H.; Wang, Y.; Wang, C.; Li, Y.; Wang, C. Biocompatible AIE material from natural resources: Chitosan and its multifunctional applications. Carbohydr. Polym. 2020, 227, 115338. [Google Scholar] [CrossRef] [PubMed]
  22. Hua, X.-W.; Bao, Y.-W.; Wang, H.-Y.; Chen, Z.; Wu, F.-G. Bacteria-derived fluorescent carbon dots for microbial live/dead differentiation. Nanoscale 2017, 9, 2150–2161. [Google Scholar] [CrossRef] [PubMed]
  23. Kumar, N.; Wiraja, C.; Palanisamy, K.; Marsili, E.; Xu, C. Heat shock mediated labelling of Pseudomonas aeruginosa with quantum dots. Colloids Surf. B-Biointerfaces 2016, 142, 259–265. [Google Scholar] [CrossRef] [PubMed]
  24. Lu, F.; Song, Y.; Huang, H.; Liu, Y.; Fu, Y.; Huang, J.; Li, H.; Qu, H.; Kang, Z. Fluorescent carbon dots with tunable negative charges for bio-imaging in bacterial viability assessment. Carbon 2017, 120, 95–102. [Google Scholar] [CrossRef]
  25. Song, Y.; Li, H.; Lu, F.; Wang, H.; Zhang, M.; Yang, J.; Huang, J.; Huang, H.; Liu, Y.; Kang, Z. Fluorescent carbon dots with highly negative charges as a sensitive probe for real-time monitoring of bacterial viability. J. Mater. Chem. B 2017, 5, 6008–6015. [Google Scholar] [CrossRef]
  26. Yan, C.; Wang, C.; Hou, T.; Guan, P.; Qiao, Y.; Guo, L.; Teng, Y.; Hu, X.; Wu, H. Lasting tracking and rapid discrimination of live gram-positive bacteria by peptidoglycan-targeting carbon quantum dots. ACS Appl. Mater. Interfaces 2021, 13, 1277–1287. [Google Scholar] [CrossRef]
  27. Lin, F.; Li, C.; Dong, L.; Fu, D.; Chen, Z. Imaging biofilm-encased microorganisms using carbon dots derived from L.plantarum. Nanoscale 2017, 9, 9056–9064. [Google Scholar] [CrossRef]
  28. Zhao, X.; Tang, Q.; Zhu, S.; Bu, W.; Yang, M.; Liu, X.; Meng, Y.; Yu, W.; Sun, H.; Yang, B. Controllable acidophilic dual-emission fluorescent carbonized polymer dots for selective imaging of bacteria. Nanoscale 2019, 11, 9526–9532. [Google Scholar] [CrossRef]
  29. Fu, C.-C.; Wu, C.-Y.; Chien, C.-C.; Hsu, T.-H.; Ou, S.-F.; Chen, S.-T.; Wu, C.-H.; Hsieh, C.-T.; Juang, R.-S.; Hsueh, Y.-H. Polyethylene glycol(6000)/carbon nanodots as fluorescent bioimaging agents. Nanomaterials 2020, 10, 677. [Google Scholar] [CrossRef] [Green Version]
  30. Apaydın, S.; Török, M. Sulfonamide derivatives as multi-target agents for complex diseases. Bioorg. Med. Chem. Lett. 2019, 29, 2042–2050. [Google Scholar] [CrossRef]
  31. Lima, L.M.; da Silva, B.N.M.; Barbosa, G.; Barreiro, E.J. Beta-lactam antibiotics: An overview from a medicinal chemistry perspective. Eur. J. Med. Chem. 2020, 208, 112829. [Google Scholar] [CrossRef] [PubMed]
  32. Marković, Z.M.; Jovanović, S.P.; Mašković, P.Z.; Danko, M.; Mičušík, M.; Pavlović, V.B.; Milivojević, D.D.; Kleinová, A.; Špitalský, Z.; Marković, B.M.T. Photo-induced antibacterial activity of four graphene based nanomaterials on a wide range of bacteria. RSC Adv. 2018, 8, 31337–31347. [Google Scholar] [CrossRef] [PubMed] [Green Version]
  33. Roh, S.G.; Robby, A.I.; Phuong, P.T.M.; In, I.; Park, S.Y. Photoluminescence-tunable fluorescent carbon dots-deposited silver nanoparticle for detection and killing of bacteria. Mater. Sci. Eng. C-Mater. Biol. Appl. 2019, 97, 613–623. [Google Scholar] [CrossRef] [PubMed]
  34. ravlou, N.A.; Giannakoudakis, D.A.; Algarra, M.; Labella, A.M.; Rodríguez-Castellón, E.; Bandosz, T.J. S- and N-doped carbon quantum dots: Surface chemistry dependent antibacterial activity. Carbon 2018, 135, 104–111. [Google Scholar] [CrossRef]
  35. Yu, X.-W.; Liu, X.; Jiang, Y.-W.; Li, Y.-H.; Gao, G.; Zhu, Y.-X.; Lin, F.; Wu, F.-G. Rose bengal-derived ultrabright sulfur-doped carbon dots for fast discrimination between live and dead cells. Anal. Chem. 2022, 94, 4243–4251. [Google Scholar] [CrossRef] [PubMed]
  36. Gagic, M.; Kociova, S.; Smerkova, K.; Michalkova, H.; Setka, M.; Svec, P.; Pribyl, J.; Masilko, J.; Balkova, R.; Heger, Z.; et al. One-pot synthesis of natural amine-modified biocompatible carbon quantum dots with antibacterial activity. J. Colloid Interface Sci. 2020, 580, 30–48. [Google Scholar] [CrossRef]
  37. Jian, H.-J.; Wu, R.-S.; Lin, T.-Y.; Li, Y.-J.; Lin, H.-J.; Harroun, S.G.; Lai, J.-Y.; Huang, C.-C. Super-cationic carbon quantum dots synthesized from spermidine as an eye drop formulation for topical treatment of bacterial keratitis. ACS Nano 2017, 11, 6703–6716. [Google Scholar] [CrossRef]
  38. HJian, H.-J.; Yu, J.; Li, Y.-J.; Unnikrishnan, B.; Huang, Y.-F.; Luo, L.-J.; Ma, D.H.-K.; Harroun, S.G.; Chang, H.-T.; Lin, H.-J.; et al. Highly adhesive carbon quantum dots from biogenic amines for prevention of biofilm formation. Chem. Eng. J. 2020, 386, 123913. [Google Scholar] [CrossRef]
  39. Kwon, D.-H.; Lu, C.-D. Polyamine effects on antibiotic susceptibility in bacteria. Antimicrob. Agents Chemother. 2007, 51, 2070–2077. [Google Scholar] [CrossRef] [Green Version]
  40. Chen, X.; Zhang, X.; Lin, F.; Guo, Y.; Wu, F. One-step synthesis of epoxy group-terminated organosilica nanodots: A versatile nanoplatform for imaging and eliminating multidrug-resistant bacteria and their biofilms. Small 2019, 15, 1901647. [Google Scholar] [CrossRef]
  41. Yang, J.; Gao, G.; Zhang, X.; Ma, Y.-H.; Chen, X.; Wu, F.-G. One-step synthesis of carbon dots with bacterial contact-enhanced fluorescence emission: Fast Gram-type identification and selective Gram-positive bacterial inactivation. Carbon 2019, 146, 827–839. [Google Scholar] [CrossRef]
  42. Li, D.; Sun, P.-P.; Li, J.-G.; Yan, S.-S.; Wang, D.; Tang, B.T. Recent advances of polymers with aggregation-induced emission characteristics in phototheranostics. Acta Polym. Sin. 2022, 53, 856–872. [Google Scholar] [CrossRef]
  43. Zhang, Y.; Li, D.; Tan, J.; Chang, Z.; Liu, X.; Ma, W.; Xu, Y. Near-infrared regulated nanozymatic/photothermal/photodynamic triple-therapy for combating multidrug-resistant bacterial infections via oxygen-vacancy molybdenum trioxide nanodots. Small 2021, 17, e2005739. [Google Scholar] [CrossRef] [PubMed]
  44. Mandani, S.; Rezaei, B.; Ensafi, A.A.; Sabzalian, M.R. Development of a new simple spectroscopic determination coupled acid-motivated delivery system based on fluorescence turn-off MSNs@MPA-ZnS QDs for infection. Microporous Mesoporous Mater. 2021, 317, 110971. [Google Scholar] [CrossRef]
  45. Niu, F.; Xu, Y.; Liu, J.; Song, Z.; Liu, M.; Liu, J. Controllable electrochemical/electroanalytical approach to generate nitrogen-doped carbon quantum dots from varied amino acids: Pinpointing the utmost quantum yield and the versatile photoluminescent and electrochemiluminescent applications. Electrochim. Acta 2017, 236, 239–251. [Google Scholar] [CrossRef]
  46. Li, P.; Liu, S.; Zhang, G.; Yang, X.; Cao, W.; Gong, X.-D.; Xing, X. Design of pH-responsive dissociable nanosystem based on carbon dots with enhanced anti-biofilm property and excellent biocompatibility. ACS Appl. Bio Mater. 2020, 3, 1105–1115. [Google Scholar] [CrossRef]
  47. Hirsch, J.G. The antimycobacterial activity of various amines related to spermine in chemical structure. J. Exp. Med. 1953, 97, 323–325. [Google Scholar] [CrossRef] [PubMed] [Green Version]
  48. Lotha, R.; Shamprasad, B.R.; Sundaramoorthy, N.S.; Nagarajan, S.; Sivasubramanian, A. Biogenic phytochemicals (cassinopin and isoquercetin) capped copper nanoparticles (ISQ/CAS@CuNPs) inhibits MRSA biofilms. Microb. Pathog. 2019, 132, 178–187. [Google Scholar] [CrossRef]
  49. DShan, D.; Hsieh, J.-T.; Bai, X.; Yang, J. Citrate-based fluorescent biomaterials. Adv. Healthc. Mater. 2018, 7, 1800532. [Google Scholar] [CrossRef]
  50. Liu, Y.; Jiang, L.; Li, B.; Fan, X.; Wang, W.; Liu, P.; Xu, S.; Luo, X. Nitrogen doped carbon dots: Mechanism investigation and their application for label free CA125 analysis. J. Mater. Chem. B 2019, 7, 3053–3058. [Google Scholar] [CrossRef]
  51. Xu, Q.; Li, B.; Ye, Y.; Cai, W.; Li, W.; Yang, C.; Chen, Y.; Xu, M.; Li, N.; Zheng, X.; et al. Synthesis, mechanical investigation, and application of nitrogen and phosphorus co-doped carbon dots with a high photoluminescent quantum yield. Nano Res. 2018, 11, 3691–3701. [Google Scholar] [CrossRef]
  52. Zhu, S.; Song, Y.; Zhao, X.; Shao, J.; Zhang, J.; Yang, B. The photoluminescence mechanism in carbon dots (graphene quantum dots, carbon nanodots, and polymer dots): Current state and future perspective. Nano Res. 2015, 8, 355–381. [Google Scholar] [CrossRef]
  53. Baig, M.M.F.; Chen, Y.-C. Bright carbon dots as fluorescence sensing agents for bacteria and curcumin. J. Colloid Interface Sci. 2017, 501, 341–349. [Google Scholar] [CrossRef] [PubMed]
  54. Das, P.; Bose, M.; Ganguly, S.; Mondal, S.; Das, A.K.; Banerjee, S.; Das, N.C. Green approach to photoluminescent carbon dots for imaging of gram-negative bacteria Escherichia coli. Nanotechnology 2017, 28, 195501. [Google Scholar] [CrossRef] [PubMed]
  55. Mehta, V.N.; Jha, S.; Basu, H.; Singhal, R.K.; Kailasa, S.K. One-step hydrothermal approach to fabricate carbon dots from apple juice for imaging of mycobacterium and fungal cells. Sens. Actuators B Chem. 2015, 213, 434–443. [Google Scholar] [CrossRef]
  56. Kuo, W.-S.; Chen, H.-H.; Chen, S.-Y.; Chang, C.-Y.; Chen, P.-C.; Hou, Y.-I.; Shao, Y.-T.; Kao, H.-F.; Hsu, C.-L.L.; Chen, Y.-C.; et al. Graphene quantum dots with nitrogen-doped content dependence for highly efficient dual-modality photodynamic antimicrobial therapy and bioimaging. Biomaterials 2017, 120, 185–194. [Google Scholar] [CrossRef]
  57. Lin, F.; Li, C.; Chen, Z. Bacteria-derived carbon dots inhibit biofilm formation of Escherichia coli without affecting cell growth. Front. Microbiol. 2018, 9, 259. [Google Scholar] [CrossRef]
  58. Luo, Y.; Liu, F.; Song, J.; Luo, Q.; Yang, Y.; Mei, C.; Xu, M.; Liao, B. Function-oriented graphene quantum dots probe for single cell in situ sorting of active microorganisms in environmental samples. Front. Microbiol. 2021, 12, 659111. [Google Scholar] [CrossRef]
  59. Kuo, W.-S.; Yeh, T.-S.; Chang, C.-Y.; Liu, J.-C.; Chen, C.-H.; So, E.C.; Wu, P.-C. Amino-functionalized nitrogen-doped graphene quantum dots for efficient enhancement of two-photon-excitation photodynamic therapy: Functionalized nitrogen as a bactericidal and contrast agent. Int. J. Nanomed. 2020, 15, 6961–6973. [Google Scholar] [CrossRef]
  60. Sun, L.; Zhang, H.; Wang, Y.; Xiong, Z.; Zhao, X.; Xia, Y. Chitosan-derived N-doped carbon dots for fluorescent determination of nitrite and bacteria imaging. Spectrochim. Acta A 2021, 251, 119468. [Google Scholar] [CrossRef]
  61. Gao, Z.; Yang, D.; Wan, Y.; Yang, Y. One-step synthesis of carbon dots for selective bacterial inactivation and bacterial differentiation. Anal. Bioanal. Chem. 2020, 412, 871–880. [Google Scholar] [CrossRef] [PubMed]
  62. Ran, H.-H.; Cheng, X.; Bao, Y.-W.; Hua, X.-W.; Gao, G.; Zhang, X.; Jiang, Y.-W.; Zhu, Y.-X.; Wu, F.-G. Multifunctional quaternized carbon dots with enhanced biofilm penetration and eradication efficiencies. J. Mater. Chem. B 2019, 7, 5104–5114. [Google Scholar] [CrossRef] [PubMed]
  63. Zhao, D.; Zhang, R.; Liu, X.; Huang, X.; Xiao, X.; Yuan, L. One-step synthesis of blue-green luminescent carbon dots by a low-temperature rapid method and their high-performance antibacterial effect and bacterial imaging. Nanotechnology 2021, 32, 155101. [Google Scholar] [CrossRef] [PubMed]
  64. Mei, L.; Gao, X.; Shi, Y.; Cheng, C.; Shi, Z.; Jiao, M.; Cao, F.; Xu, Z.; Li, X.-M.; Zhang, J. Augmented graphene quantum dot-light irradiation therapy for bacteria-infected wounds. ACS Appl. Mater. Interfaces 2020, 12, 40153–40162. [Google Scholar] [CrossRef] [PubMed]
  65. Li, P.; Han, F.; Cao, W.; Zhang, G.; Li, J.; Zhou, J.; Gong, X.; Turnbull, G.; Shu, W.; Xia, L.; et al. Carbon quantum dots derived from lysine and arginine simultaneously scavenge bacteria and promote tissue repair. Appl. Mater. Today 2020, 19, 100601. [Google Scholar] [CrossRef]
  66. Wang, C.; Hu, T.; Wen, Z.; Zhou, J.; Wang, X.; Wu, Q.; Wang, C. Concentration-dependent color tunability of nitrogen-doped carbon dots and their application for iron(III) detection and multicolor bioimaging. J. Colloid Interface Sci. 2018, 521, 33–41. [Google Scholar] [CrossRef]
  67. Jiang, D.; Zhao, H.; Yang, Y.; Zhu, Y.; Chen, X.; Sun, J.; Yu, K.; Fan, H.; Zhang, X. Investigation of luminescent mechanism: N-rich carbon dots as luminescence centers in fluorescent hydroxyapatite prepared using a typical hydrothermal process. J. Mater. Chem. B 2017, 5, 3749–3757. [Google Scholar] [CrossRef]
  68. Jijie, R.; Barras, A.; Bouckaert, J.; Dumitrascu, N.; Szunerits, S.; Boukherroub, R. Enhanced antibacterial activity of carbon dots functionalized with ampicillin combined with visible light triggered photodynamic effects. Colloids Surf. B-Biointerfaces 2018, 170, 347–354. [Google Scholar] [CrossRef]
  69. Tejwan, N.; Saini, A.K.; Sharma, A.; Singh, T.A.; Kumar, N.; Das, J. Metal-doped and hybrid carbon dots: A comprehensive review on their synthesis and biomedical applications. J. Control. Release 2021, 330, 132–150. [Google Scholar] [CrossRef]
  70. Rodríguez, C.; Chen, A.; Rivera, J.A.; Mohr, M.A.; Liang, Y.; Natan, R.G.; Sun, W.; Milkie, D.E.; Bifano, T.G.; Chen, X.; et al. An adaptive optics module for deep tissue multiphoton imaging in vivo. Nat. Methods 2021, 18, 1259–1264. [Google Scholar] [CrossRef]
  71. Tran, T.; Grandvalet, C.; Winckler, P.; Verdier, F.; Martin, A.; Alexandre, H.; Tourdot-Maréchal, R. Shedding Light on the Formation and Structure of Kombucha Biofilm Using Two-Photon Fluorescence Microscopy. Front. Microbiol. 2021, 12, 725379. [Google Scholar] [CrossRef] [PubMed]
Scheme 1. Preparation of nitrogen-doped carbon dots and fabrication of primary amine functionalized carbon dots.
Nanomaterials 13 00437 sch001
Figure 1. (a) Fluorescent emission map and ex–em spectrum of spCD, (b) Relative fluorescent intensity of CD, spCD, NH2–CD and NH2–spCD in a constant ultraviolet irradiation of 365 nm for 3 h, (c) CIE 1931 chromaticity chart of spCD at excitation of 300~450 nm (step = 5 nm), (d) Fluorescent lifetime of CD, spCD, NH2–CD and NH2–spCD, (e) Relative intensity changes of CD, spCD, NH2–CD, NH2–spCD and two dyes for a constant detection.
Nanomaterials 13 00437 g001
Figure 2. (a) XRD spectra of CD, spCD, NH2–CD, NH2–spCD and the PDF standard card, (b) Diameters and QY values for other works and this work [13,15,16,22,26,27,28,40,41,53,54,55,56,57,58,59,60,61,62,63] (c) TEM and HRTEM of CD and (d) spCD, (e) AFM of NH2–spCDs (left: planar graph of NH2–spCDs; The picture was a 5 × 5 μm section of the sample while the color bar at the right represents the height value among the section. middle: particle height marked at the left graph in red circle, right: 3D image corresponding to the left graph).
Nanomaterials 13 00437 g002
Figure 3. (a) UV–Vis spectra and (b) FTIR spectra of CD, spCD, NH2–CD and NH2–spCD, (c) Changes of zeta potentials after cultured with 3% BZ (BZ represent bacteria that cultured by benzalkonium bromide and QD represent bacterial cultured by corresponding carbon dots after cultured in benzalkonium bromide), (d) Zeta potentials of spCD, NH2–CD and NH2–spCD, (e) MTT results for CD, spCD, NH2–CD and NH2–spCD culturing with L929 cells. Unite of concentration was mg/mL.
Nanomaterials 13 00437 g003
Figure 4. XPS spectra of (a) CD, (b) spCD, (c) NH2–CD and (d) NH2–spCD; High-resolution XPS spectra of C1s for (e) CD, (f) spCD, (g) NH2–CD and (h) NH2–spCD; High-resolution XPS spectra of N 1s for (i) CD, (j) spCD, (k) NH2–CD and (l) NH2–spCD; High-resolution XPS spectra of O 1s for (m) CD, (n) spCD, (o) NH2–CD and (p) NH2–spCD.
Nanomaterials 13 00437 g004
Figure 5. Imaging of E.coli and S.aureus by CDs and spCDs (bacterial was treated with 60 °C water bath for 1 h).
Nanomaterials 13 00437 g005
Figure 6. Imaging of alive E.coli and S.aureus by CD, spCD and NH2–spCD.
Nanomaterials 13 00437 g006
Table 1. A summary for the four types of CDs.
TypesDead 1Dead 2AliveQY/%Average Size/nmAverage Zeta Potential/mVFunctional Groups/Percursors
CD—— 3——48.97%2.01−21.0
spCD——66.46%1.38−11.5Spermine
NH2–CD————40.42%1.99−27.1Primary amine
NH2–spCD53.47%2.36−21.5Spermine/
primary amine
1 Treated with 3% benzalkonium bromide. 2 Treated with 60 °C water bath for 1 h. 3 —— means weak our no signals.
Disclaimer/Publisher’s Note: The statements, opinions and data contained in all publications are solely those of the individual author(s) and contributor(s) and not of MDPI and/or the editor(s). MDPI and/or the editor(s) disclaim responsibility for any injury to people or property resulting from any ideas, methods, instructions or products referred to in the content.

