Article

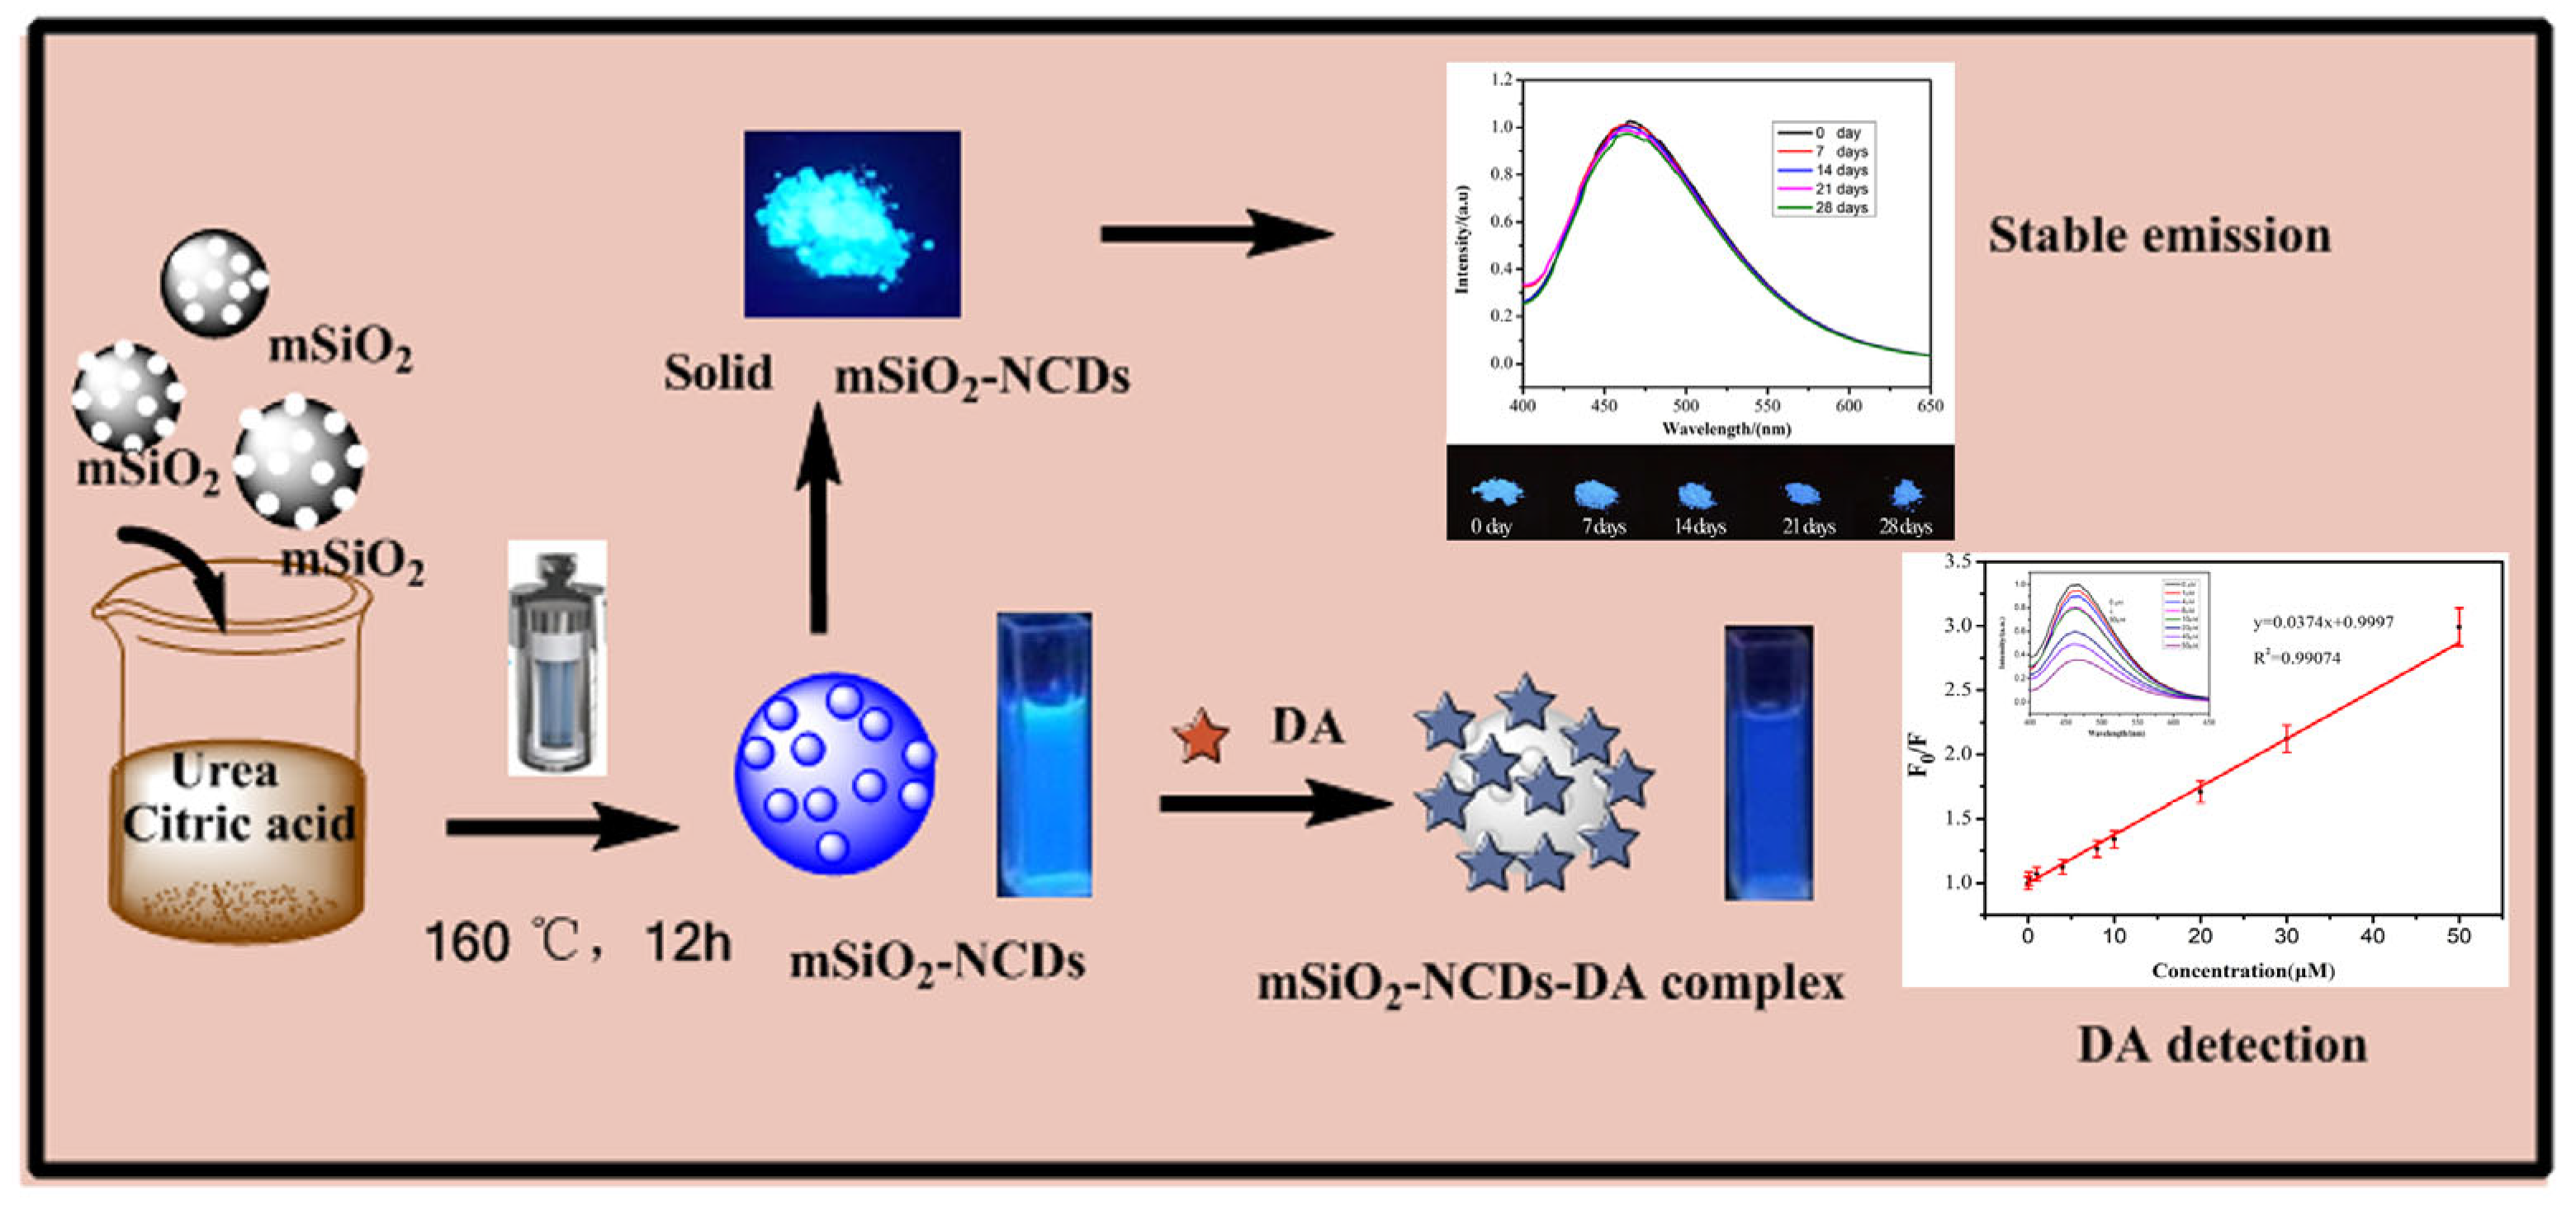
One-Pot Hydrothermal Synthesis of mSiO2-N-CDs with High Solid-State Photoluminescence as a Fluorescent Probe for Detecting Dopamine

1
Jiangxi Key Laboratory of Organic Chemistry, Jiangxi Science and Technology Normal University, Nanchang 330013, China
2
College of Life Science, Jiangxi Normal University, Nanchang 330031, China
*
Authors to whom correspondence should be addressed.
Nanomaterials 2023, 13(23), 2989; https://doi.org/10.3390/nano13232989
Submission received: 25 October 2023 / Revised: 16 November 2023 / Accepted: 16 November 2023 / Published: 21 November 2023

Abstract

:
An effective fluorescent probe (mSiO2-N-CDs) was prepared by embedding N-CDs into mesoporous silica via a simple one-pot hydrothermal reaction and applied to the detection of dopamine (DA). Mesoporous silica not only provided a skeleton to prevent the aggregation of N-CDs but also a medium for the centrifugal collection of N-CDs, avoiding the need for dialysis and freeze-drying. The formation process, phase composition, morphology, and luminescence properties of the composite were studied in detail. The synthesized mSiO2-N-CDs possessed spherical morphology, a smooth surface, and a diameter of approximately 150 nm. The fluorescence results indicated that mSiO2-N-CDs emitted intense blue color fluorescence at 465 nm under the optimal excitation of 370 nm. Because the mesoporous silica effectively inhibited the self-quenching caused by the aggregation of N-CDs, the quantum yield of solid mSiO2-N-CDs powder reached 32.5%. Furthermore, the emission intensity of the solid mSiO2-N-CDs remained constant for 28 days. The good sensitivity and selectivity of mSiO2-N-CDs for DA enabled the establishment of a rapid, simple, and sensitive DA detection method. The linear range was 0–50 µM and the limit of detection was calculated to be 107 nM. This method was used for the determination of DA in urine, with recovery rates ranging between 98% and 100.8%. In addition, the sensing mechanism was characterized by fluorescence lifetime decay and UV–VIS spectral analysis.

1. Introduction

As a key neurotransmitter in the human hypothalamus and pituitary gland, dopamine (DA) plays a vital role in regulating the nervous system, cardiovascular system, kidney, hormone secretion system, etc. DA imbalances can lead to psychiatric disorders (such as Parkinson’s disease, epilepsy, depression, anxiety disorders, [1,2,3,4] etc.). Therefore, it is very important to detect DA and its precursors (such as tyrosine and phenylalanine) accurately and sensitively for the diagnosis of nervous system diseases.
Technologies for the rapid and accurate detection of DA and its precursors are becoming increasingly important in the medical field. To date, various analytical methods for detecting DA and its precursors—such as high-performance liquid chromatography (HPLC) analysis [5,6], electrochemical sensors [7,8,9,10,11,12,13,14,15,16] and fluorescence sensors [17]—have been developed. Although HPLC is accurate, efficient, and sensitive, the need for expensive instruments and specialized operators has limited its application in the field of rapid DA detection. In recent years, electrochemical technologies have gained widespread interest because of their good sensitivity and low cost. However, the selectivity of electrochemical sensors is easily interfered with by other biological molecules, which limits their application in DA detection. For example, DA, ascorbic acid, and uric acid usually coexist in body fluids and the oxidation peak potential of the three substances is similar, making it difficult to use electrochemical methods to determine three substances [18,19]. Due to the significant advantages of fluorescence analysis, such as high sensitivity, strong selectivity, and ease of use, studies in recent years of the detection of DA using fluorescence methods have received increasing attention and many kinds of fluorescent sensors have been applied to the determination of DA [20,21,22,23,24,25,26,27]. For example, Zhou et al. [21] synthesized gold–silver nanoclusters for the detection of DA. Xu et al. [22] constructed a sensing platform for the detection of DA based on thiol-modified monolayer MoS2 nanosheets. Ling et al. [24] proposed a fluorescent probe based on water-soluble Tb3+-doped NaGdF4 nanomaterials for the dual-signal detection of DA.
As a new class of fluorescent nanomaterial, carbon dots (CDs) have gained great interest because of their good optical properties, excellent biocompatibility, low toxicity, easy surface modifiability, and excellent water solubility. Because DA can significantly quench the fluorescence of CDs, some studies have used them to perform qualitative and quantitative analysis and detection of DA [27,28]. Recently, there has been increasing research attention on fluorescent DA-sensing platforms based on CDs [27,28,29]. For example, Wang et al. [27] constructed a DA sensor using CDs doped with sulfur and nitrogen (S-N-CDs). Zhuo et al. [28] fabricated Fe-doped CDs for dopamine-sensing applications.
Despite these efforts, however, several key challenges for CD-based fluorescence sensors remain. At present, CD preparation processes are still relatively complex, requiring tedious operations such as dialysis and freeze-drying [30]; thus, large-scale synthesis of CDs is challenging [31]. Additionally, agglomeration of CDs in concentrated solutions or pure CD solids often leads to a decrease in luminescence, which is defined as aggregation-caused quenching (ACQ) and is another major factor limiting their application [32,33]. Some studies have shown that dispersing CDs in porous matrices (such as zeolite [34], carbonaceous porous materials [35,36], porous metal compounds [37,38], metal–organic frameworks [39,40], and mesoporous silica [41,42]) is an effective way to overcome these shortcomings. Among them, mesoporous silica has a porous structure and its pore size range can be controlled (2 to 50 nm), making it compatible with various sizes of CDs. In addition, it possesses good biocompatibility, high chemical stability, and easy surface functionalization. In recent years, research into the preparation and application of mesoporous silica CDs composite materials has aroused widespread interest among researchers [43,44,45,46]. For example, Liu et al. [43] established a fluorescence detection platform for Cr(VI) detection in water by anchoring mesoporous silica nanospheres with B-doped CDs. Chang et al. [44] obtained a fluorescent composite material (N-CD-SBA-15) with good solid-state fluorescence and excellent stability through simple ultrasonic treatment of a mixture of N-CDs and SBA-15. Wu et al. [46] developed a fluorescent sensor based on mesoporous silica-coated N-CDs for sensitive detection of picric acid. However, to our knowledge, there are currently no reports of embedding CDs into mesoporous silica to construct a fluorescent probe for the detection of DA.
This work aimed to construct a fluorescent probe taking mesoporous silica (mSiO2) as the skeleton and N-CDs as the fluorescent component and to explore its application in the detection of DA. Citric acid (CA) and urea (UR) were used as carbon and nitrogen sources, respectively. N-CDs were generated in situ in the pore channels of mesoporous silica by a one-pot hydrothermal process. The preparation process was facile and low-cost, suitable for large-scale synthesis. Based on the prepared mSiO2-N-CDs with stable and high solid-state photoluminescence and being highly sensitive to DA, a fast, simple and sensitive DA detection method was established (with detection limit of 107 nM, linear range of 0–50 µM).

2. Materials and Methods

2.1. Chemicals and Instruments

The chemical reagents and apparatus are described in detail in the Supplementary Materials.

2.2. Preparation of Mesoporous Silica Spheres (mSiO2)

The preparation of silica was slightly modified according to previous reports [43,47]. Triethanolamine (30 mg) was mixed with water (15 mL) under stirring at 80 °C. Subsequently, cetyltrimethylammonium bromide (CTAB, 190 mg) and sodium salicylate (NaSal, 84 mg) were added to the solution. After stirring for 1 h, tetraethyl orthosilicate (TEOS, 2 mL) was injected drop by drop into the above solution. After continuous stirring for 2 h, the reaction solution was separated by centrifugation for 20 min (10,000 rpm) to yield a white precipitate. Eventually, the resulting precipitate was ultrasonically dispersed in an HCl/CH3OH solution (1:10 v/v, 100 mL), and the organic template was removed by continuous reflux at 80 °C for 6 h. The template removal process was repeated once. The mixture was centrifuged (10,000 rpm) for 20 min and the precipitate was cleansed repeatedly with deionized water and ethanol, then dried at 60 °C in an oven. The obtained mSiO2 was characterized before further use.

2.3. Preparation of mSiO2-N-CDs

Citric acid (CA, 2.1 g) and urea (UR, 1.8 g) were added to deionized water (50 mL) and the mixture was stirred until a transparent solution formed. Then, the obtained mSiO2 (358 mg) was ultrasonically dispersed in this solution and the mixture was transferred to a hydrothermal reactor and kept at 160 °C in an oven for 12 h. After cooling, the mixture was centrifuged (10,000 rpm) for 20 min and the precipitate was cleansed repeatedly with deionized water and ethanol. It was then placed in a vacuum drying chamber for 24 h at 40 °C to generate mSiO2-N-CDs. The obtained product was stored at 4 °C for further applications.

2.4. Preparation of N-CDs

N-CDs were prepared by the one-pot hydrothermal method: CA (2.1 g) and UR (1.8 g) were added to deionized water (50 mL), then transferred into a 100 mL autoclave and maintained at 160 °C for 12 h. After cooling down, the mixture was separated by centrifugation (10,000 rpm, 10 min). The supernatant was collected and purified through a dialysis process (10,000 MWCO, 48 h), then further freeze dried to obtain solid N-CDs.

2.5. DA Detection Method

The detection of DA was analyzed in phosphate buffer (PBS, pH = 7.4). The emission spectra of the mixture containing mSiO2-N-CDs (0.25 mg/mL) and various concentrations of DA (0–50 µM) were tested under the optimal excitation of 370 nm. All samples were tested in triplicate.
To investigate the selectivity of mSiO2-N-CDs for DA detection, fluorescence intensity tests were conducted with the addition of interfering ions such as Ca2+, Zn2+, Na+, K+, Mg2+, and interfering biomolecules such as CA, UA, cysteine, glucose, galactose, fructose, epinephrine, and norepinephrine. The above interfering agents and DA in the same concentration (50 µM) were added to the mSiO2-N-CDs solution separately, and their emission intensities were compared with that of the solution without interfering substances. All experiments were performed in triplicate.

2.6. Real Sample Detection

In order to verify the feasibility of this method, the urine of healthy volunteers was used as the analysis sample and standard addition experiments were conducted. The urine was centrifuged at 10,000 rpm for 10 min to remove the sediments, and the supernatant was diluted 10-fold with phosphate buffer solution (PBS, pH = 7.4). The urine samples were spiked with DA (0.5, 1, 5, 40 µM), and DA concentration was determined by the proposed method. All experiments were conducted in triplicate.

3. Results and Discussions

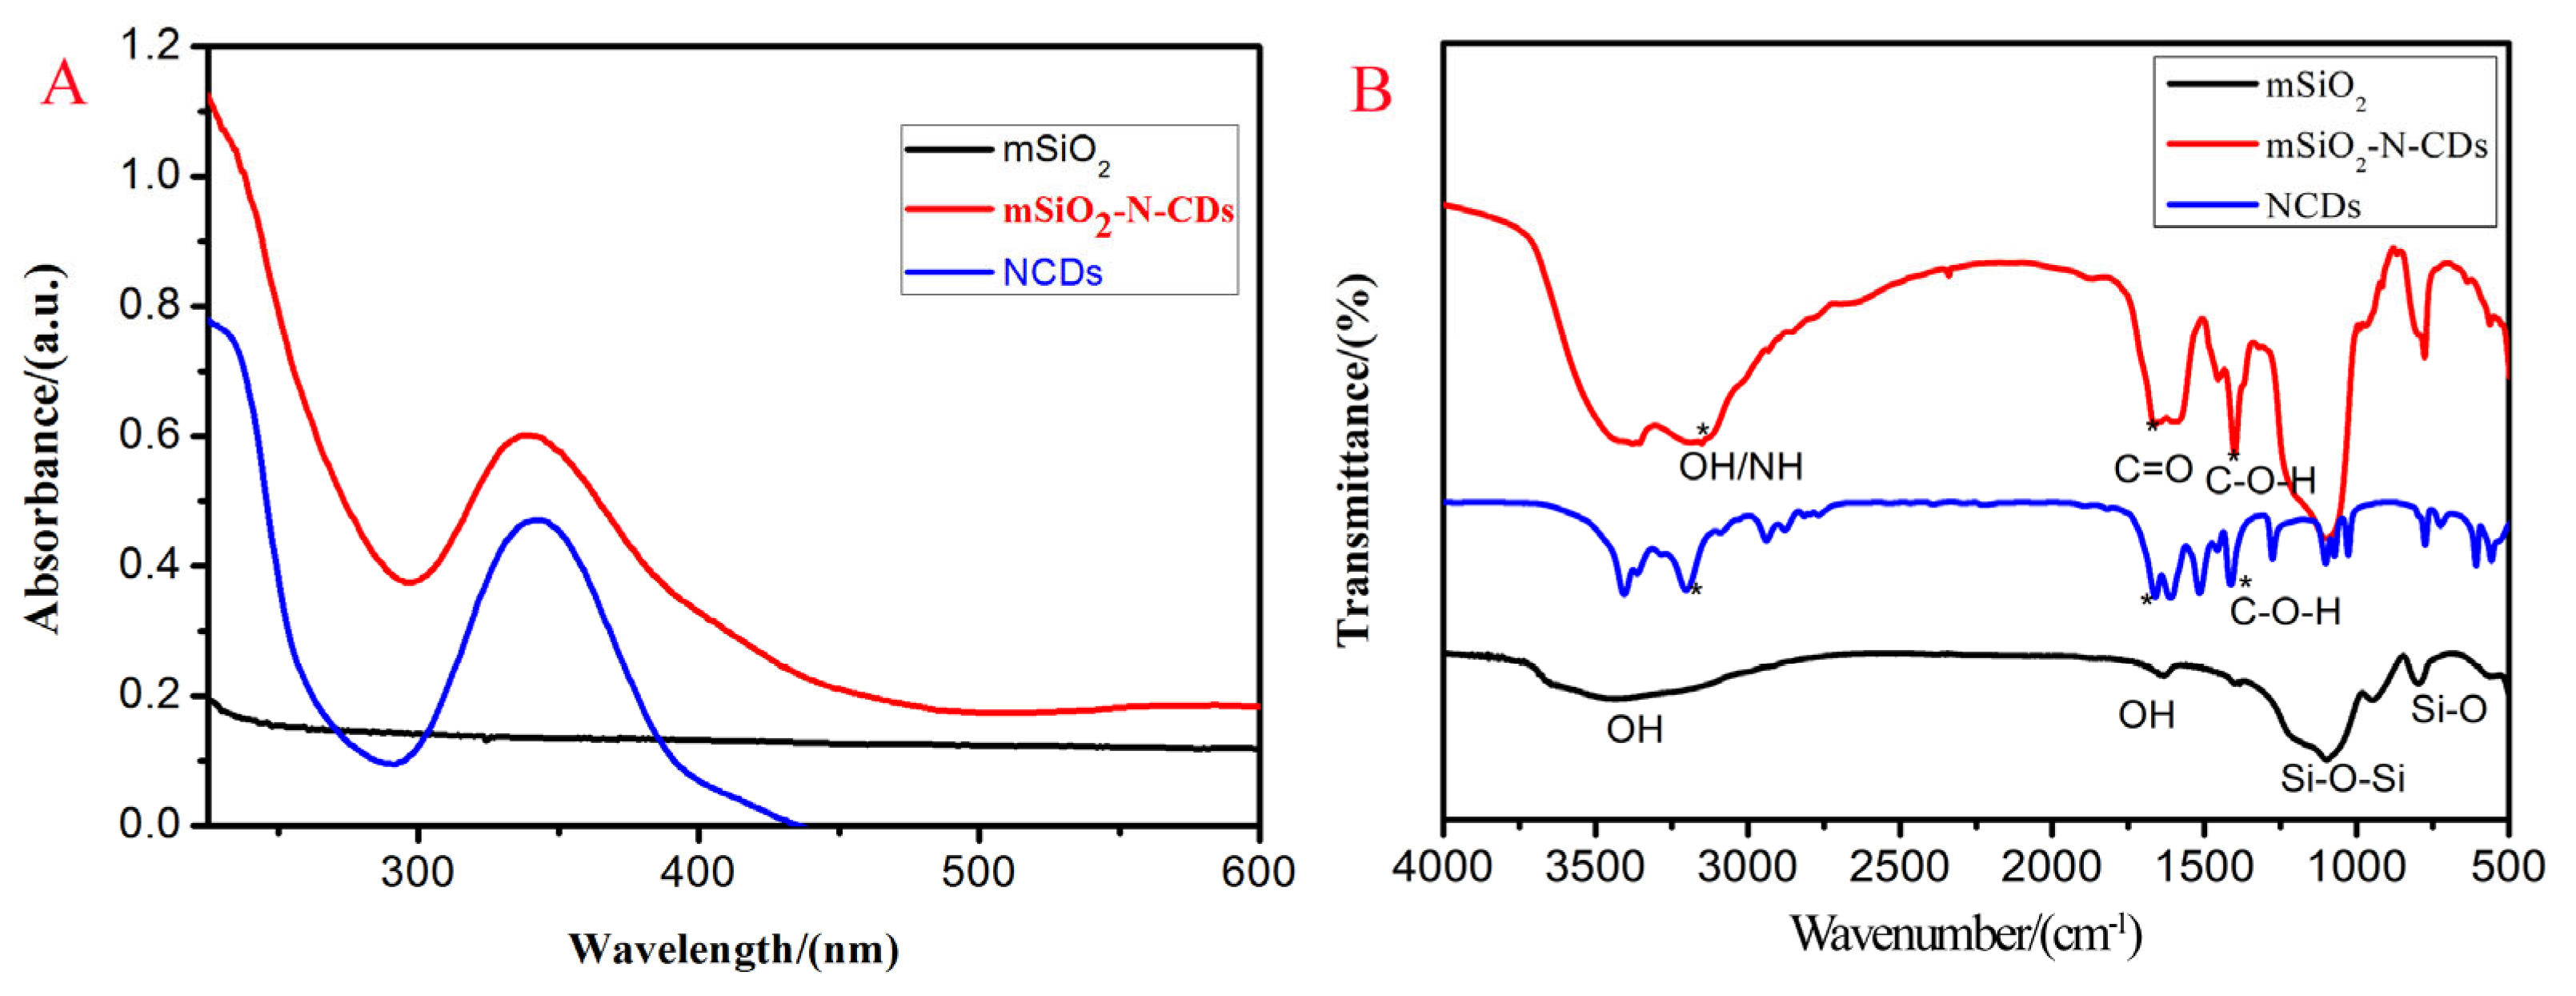
3.1. Formation Process, Morphology and Composition of mSiO2-N-CDs

A novel fluorescent probe for DA detection (mSiO2-N-CDs) was designed and synthesized using mesoporous SiO2 as the framework and N-CDs as the fluorescent unit (Scheme 1). First, silica spheres were prepared using TEOS as the silica source, with CTAB and NaSal as the porous templates. After the templates were removed by HCl/CH3OH reflux, mesoporous silica spheres were obtained. After hydrothermal treatment at 160 °C for 12 h, UR and CA were carbonized together and N-CDs formed in the mesoporous silica pores.
Figure 1 presents the TEM view of the N-CDs (Figure 1A,B), mSiO2-N-CDs (Figure 1C), and X-ray photoelectron spectroscopy (XPS) of mSiO2-N-CDs (Figure 1D). Figure 1A,B indicates that N-CDs are composed of a large number of black spherical dots with a diameter of approximately 2–4 nm. From Figure 1C, it can be seen that the obtained mSiO2-N-CDs possess a regular spherical appearance with a diameter of approximately 150 nm and good dispersion. By comparing the light and dark area of the mSiO2-N-CDs, it could be determined that the nanospheres are not solid structures and contain many stripe-like channels, which are suitable for embedding N-CDs. As shown in the red circles, some dark spots appeared in the pore channels, with very similar morphology to that of the spherical N-CDs. The successful embedding of N-CDs in mSiO2’s pore channels is further confirmed by X-ray photoelectron spectroscopy (XPS), ultraviolet absorption spectroscopy, FTIR spectroscopy, and fluorescence spectroscopy.
The XPS spectrum is presented in Figure 1D. It contains four peaks at 104.3, 154.7, 282.5, 399.8, and 531.7 eV, corresponding to Si 2p, Si 1s, C1s, N1s, and O1s, respectively. This indicates that the probe is composed of C, N, O, and Si, further proving the successful embedding of N-CDs in mSiO2. The high-resolution XPS peaks of C1s, N1s and O1s are all presented in Figure S2A–C. The C1s’ spectrum is divided into three peaks at C–C/C=C (281.8 eV), C–N/C–O (283.4 eV), and C=N/C=O (288.3 eV), as shown in Figure S2A. From Figure S2B, it can be seen that the N1s are separated into C-N-C (398.67 eV), O=C-N (399.29 eV), and N-H (401.67 eV). The presence of O=C (530.48 eV) and C-O-C/C-OH (532.62 eV) can be confirmed by Figure S2C.
Figure 2A shows the UV–VIS spectra of the obtained samples, including mSiO2 (black curve), NCDs (blue curve), and mSiO2-N-CDs (red curve). There is no obvious absorption peak in the black curve, while the absorption peak at 350 nm that appear in the blue curve can be attributed to the π→π* transition of the N-CDs [48]. In the red curve, the absorption peaks are consistent with pure N-CDs, thus further confirming that N-CDs were embedded successfully in the channels of the mesoporous silica. Figure 2B shows the FTIR spectra of the prepared samples. In the black curve (mSiO2), the absorption band near 3420 cm−1 is determined as the tensile vibration of -OH, the peak at 1625 cm−1 is caused by the bending vibration of H-O-H, the two strong peaks at 1080 and 796 cm−1 are due to the asymmetric and symmetric stretching of Si-O-Si, respectively, and the peak at 965 cm−1 corresponds to the symmetric stretch of Si-OH. Thus, the black curve is consistent with pure mesoporous silica [41]. The blue curve represents N-CDs, and in the red curve (mSiO2-N-CDs), as well as the characteristic peaks of mesoporous silica, an absorption band corresponding to -NH2 appears near 3210 cm−1, a strong characteristic peak of C=O shows around 1679 cm−1, and the deformation vibration peak of -OH in -COOH shows at 1386 cm−1. These results indicate that N-CDs with abundant amino and carboxyl groups were successfully embedded in the mesoporous silica.

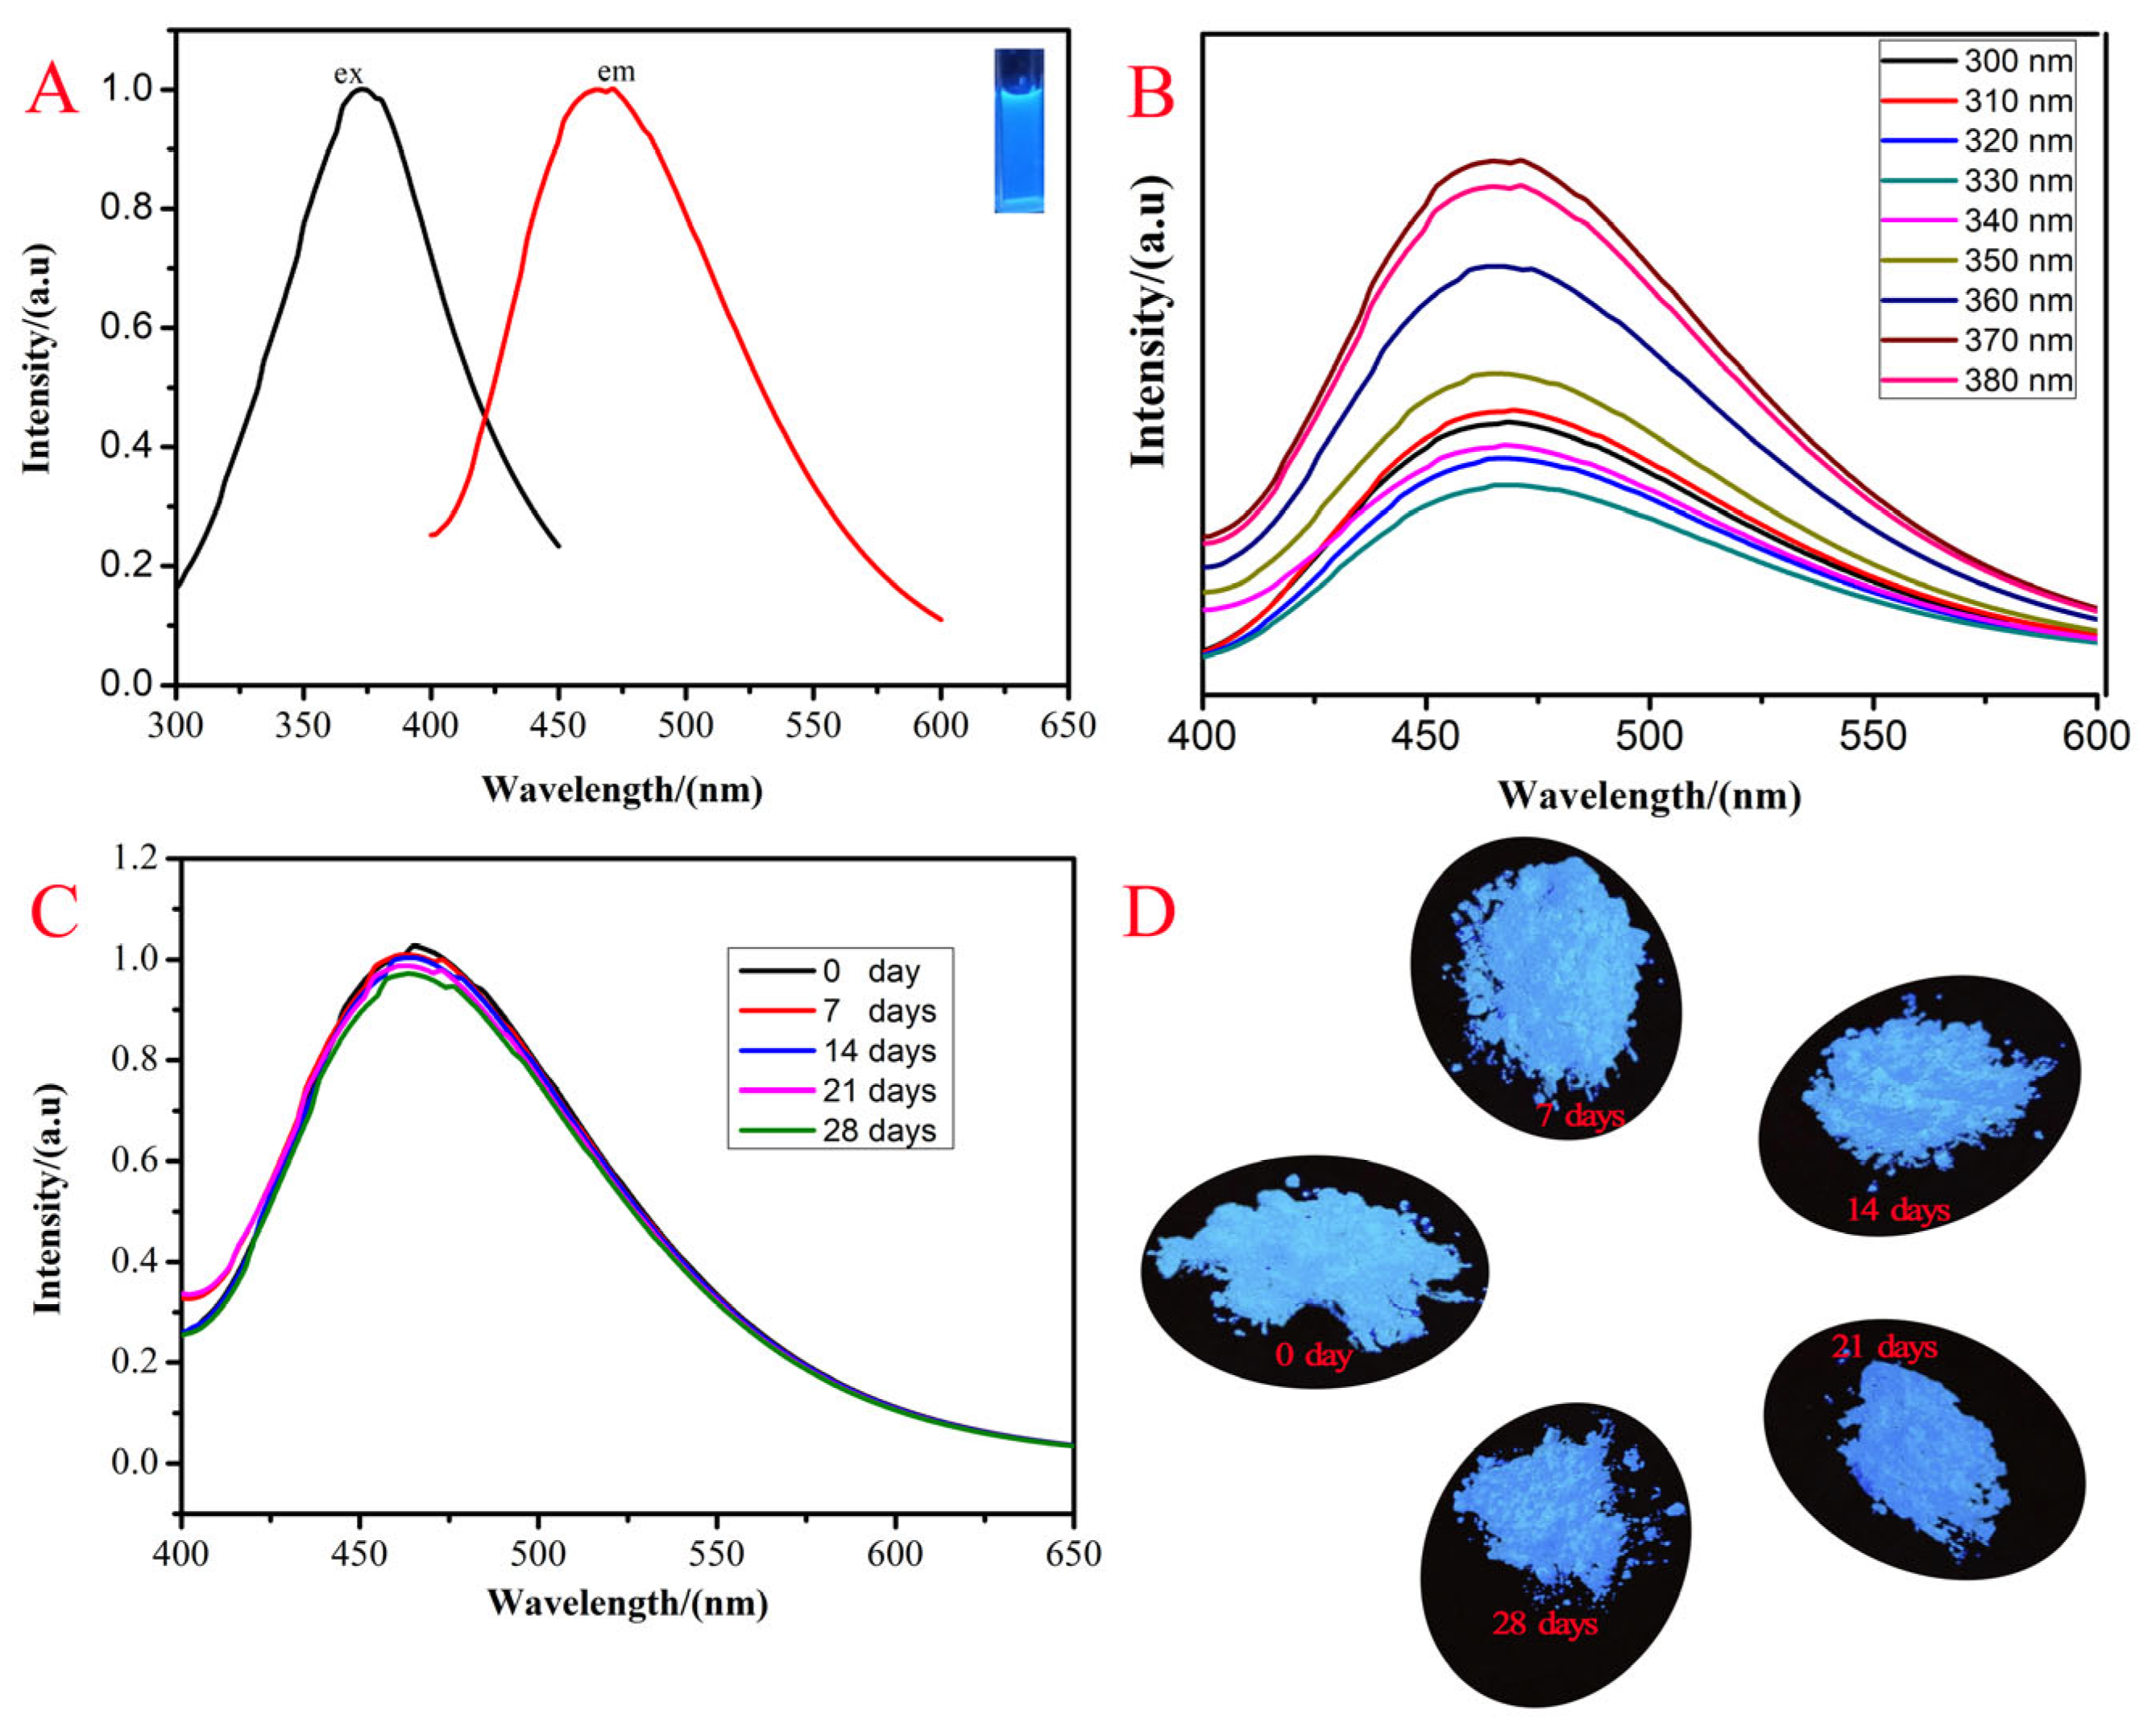
3.2. Photoluminescent Properties of mSiO2-N-CDs

The photoluminescent (PL) performance of the obtained mSiO2-N-CDs dispersed in water (0.25 mg·mL−1) were characterized in detail, as shown in Figure 3A,B. The PL spectra show the typical excitation and emission peaks of N-CDs, consisting of a wide excitation peak and a broad emission peak. The best excitation peak is near 370 nm and the highest emission peak is around 465 nm. As can be seen from Figure 3B, the emission peak did not move with the change of the excitation wavelength (300–380 nm); however, the emission intensity varied with the excitation wavelength and the optimal excitation wavelength is 370 nm. Unlike many previous reports on CDs [48,49], mSiO2-N-CDs exhibited a stable emission peak showing no shift with the adjustment of excitation wavelength, indicating that the size and surface of the prepared mSiO2 particles are uniform.
As shown in Figure 3C,D, the solid mSiO2-N-CDs produce bright blue fluorescence with a quantum yield (QY) of 32.5% under 365 nm UV irradiation. For further investigation of the fluorescence stability of mSiO2-N-CDs, the effect of storage time on the emission intensity was studied. From Figure 3C, it can be seen that the emission intensity of solid mSiO2-N-CDs remained almost constant for 28 days (the relative standard deviation was 1.07%). The comparative photos and emission spectra of solid N-CDs and mSiO2-N-CDs are presented in Figure S1: mSiO2-N-CDs powder emitted strong blue fluorescence under a 365 nm ultraviolet lamp (inset photograph) and solid N-CDs showed much lower fluorescence than that of mSiO2-N-CDs due to the ACQ. The stability emission may have been due to the interaction of the amino (-NH2) and carboxyl (-COOH) groups on the surface of the N-CDs with the hydroxyl (-OH) groups of the silica pore channels. This interaction effectively avoided ACQ of the N-CDs. Thus, the prepared mSiO2-N-CDs possessed stable emission intensity and would be suitable for practical applications.

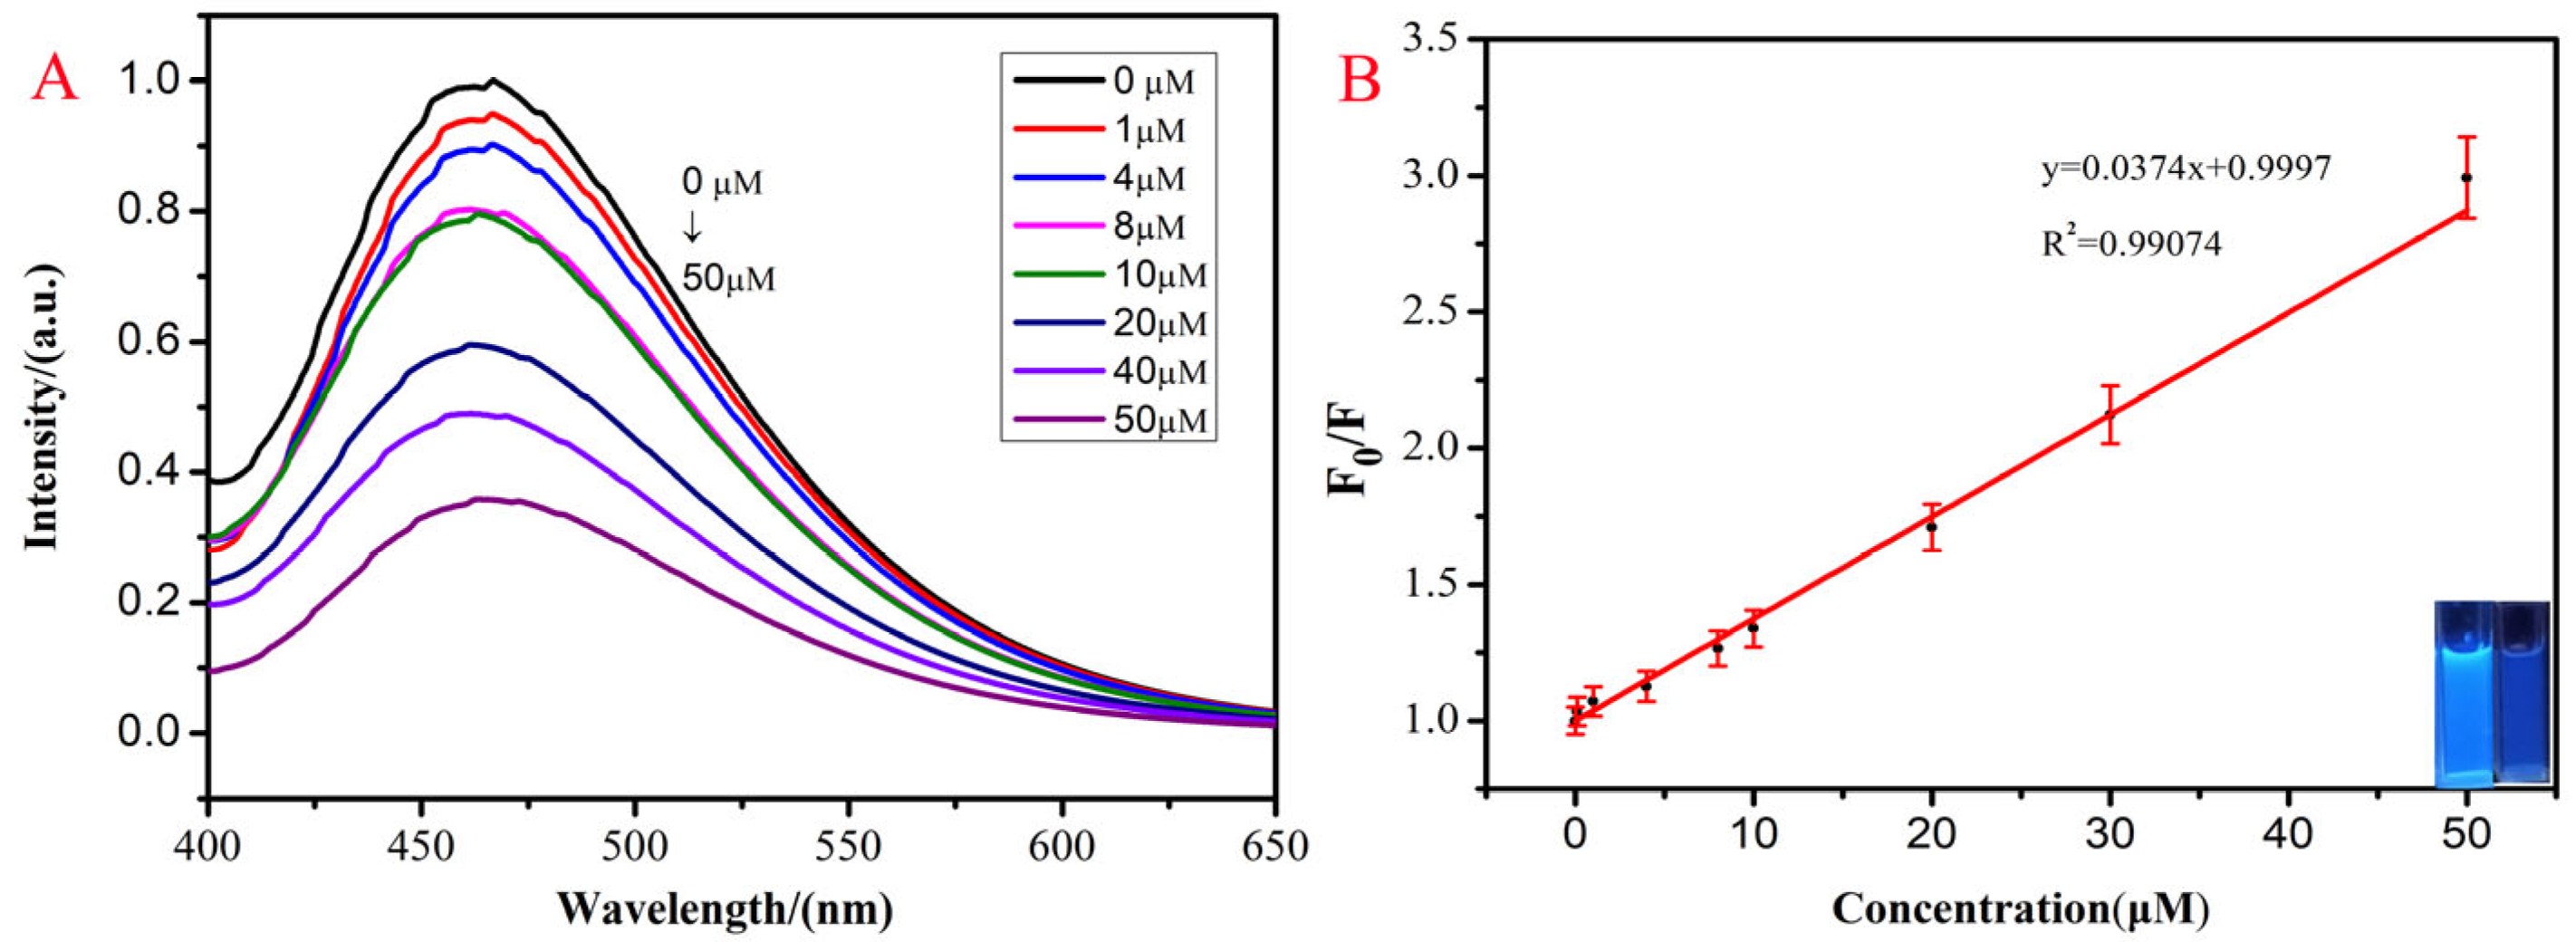
3.3. DA Detection Performance

The high selectivity of mSiO2-N-CDs for the detection of DA was demonstrated by fluorescence intensity tests. Various potentially interfering molecules (including CA, UA, cysteine, glucose, galactose, fructose, epinephrine, and norepinephrine) and ions (Ca2+, Zn2+, Na+, K+, and Mg2+) were introduced into the mSiO2-N-CDs solution (0.25 mg·mL−1). The fluorescence intensity of these solutions was then compared with the fluorescence intensity of equivalent solutions with DA added. Here, the concentrations of DA and the interfering analytes were both 50 μM. The results are shown in Figure 4A: Except for epinephrine, norepinephrine, and DA, the fluorescence intensity of mSiO2-N-CDs solution did not change significantly. The structures of epinephrine and norepinephrine are similar to that of DA, which resulted in fluorescence quenching. Nevertheless, the fluorescence quenching effect was weaker than that of DA. Additionally, the concentration of epinephrine (<300 pg·mL−1) and norepinephrine (<400 pg·mL−1) in blood serum is much lower than that of DA [49,50]. Therefore, these data indicate the specificity and selectivity of the mSiO2-N-CDs nanoprobe for DA detection.
After verifying the high selectivity and specificity of the probe for DA detection, the experimental conditions, including environmental pH value and reaction time, were optimized. Figure 4B shows the change in the emission intensity of mSiO2-N-CDs with DA (DA concentration 50 μM) at different pH values (pH 4–9). The results showed that the fluorescence quenching rate was optimal at pH 7.4.
Consequently, pH 7.4 and room temperature were chosen as the conditions for the detection of DA and the effect of reaction duration on the detection performance was explored. Figure 4C shows that the emission intensity of the original mSiO2-N-CDs solution was relatively high, then decreased significantly within 5 min after the addition of DA. This meant that the interaction between mSiO2-N-CDs and DA was relatively fast. Furthermore, the emission intensity remained stable when the incubation time was extended to 120 min. In subsequent experiments, a reaction time of 5 min was selected. Therefore, a rapid and simple method for detecting DA was established.
Under the optimal conditions, the performance of the mSiO2-N-CDs probe for DA analysis was determined by adding DA of different concentrations. The corresponding fluorescence spectrum is shown in Figure 5A. As the DA concentration increased, the blue fluorescence of the solution gradually weakened. From Figure 5B, a good linear relationship between F/F0 and the concentration of DA was obtained: F/F0 = 0.03743c + 0.99974 (R2 = 0.99074, with detection limit of 107 nM and linear range of 0–50 µM). The detection limit was calculated based on the equation of D = 3σ/K, in which σ is the standard deviation and K is the slope of the calibration line. The inset in Figure 5B shows photographs of the mSiO2-N-CDs solution with (50 μM) and without DA under a 365 nm ultraviolet lamp. Moreover, the repeatability of DA detection by this probe was studied. The mSiO2-N-CDs solutions (0.25 mg/mL) were prepared three times to measure a DA solution of 10 µM, and the relative standard deviation (RSD) was 1.55%, indicating that the probe had good repeatability. Table 1 lists the detection range and detection limit of several DA detection sensors, and it can be seen that the obtained mSiO2-N-CDs had considerable sensitivity compared with the previously reported sensors.

3.4. Real Sample Detection

The urine DA content of healthy volunteers was detected by adding standard DA, as shown in Table 2. The experimental detection results indicate that the recovery rates of different samples range from 98.0% to 100.8%. The relative standard deviation (RSD) was between 0.71% and 2.0%. These satisfactory results show that this method could be feasible for the analysis of actual samples.

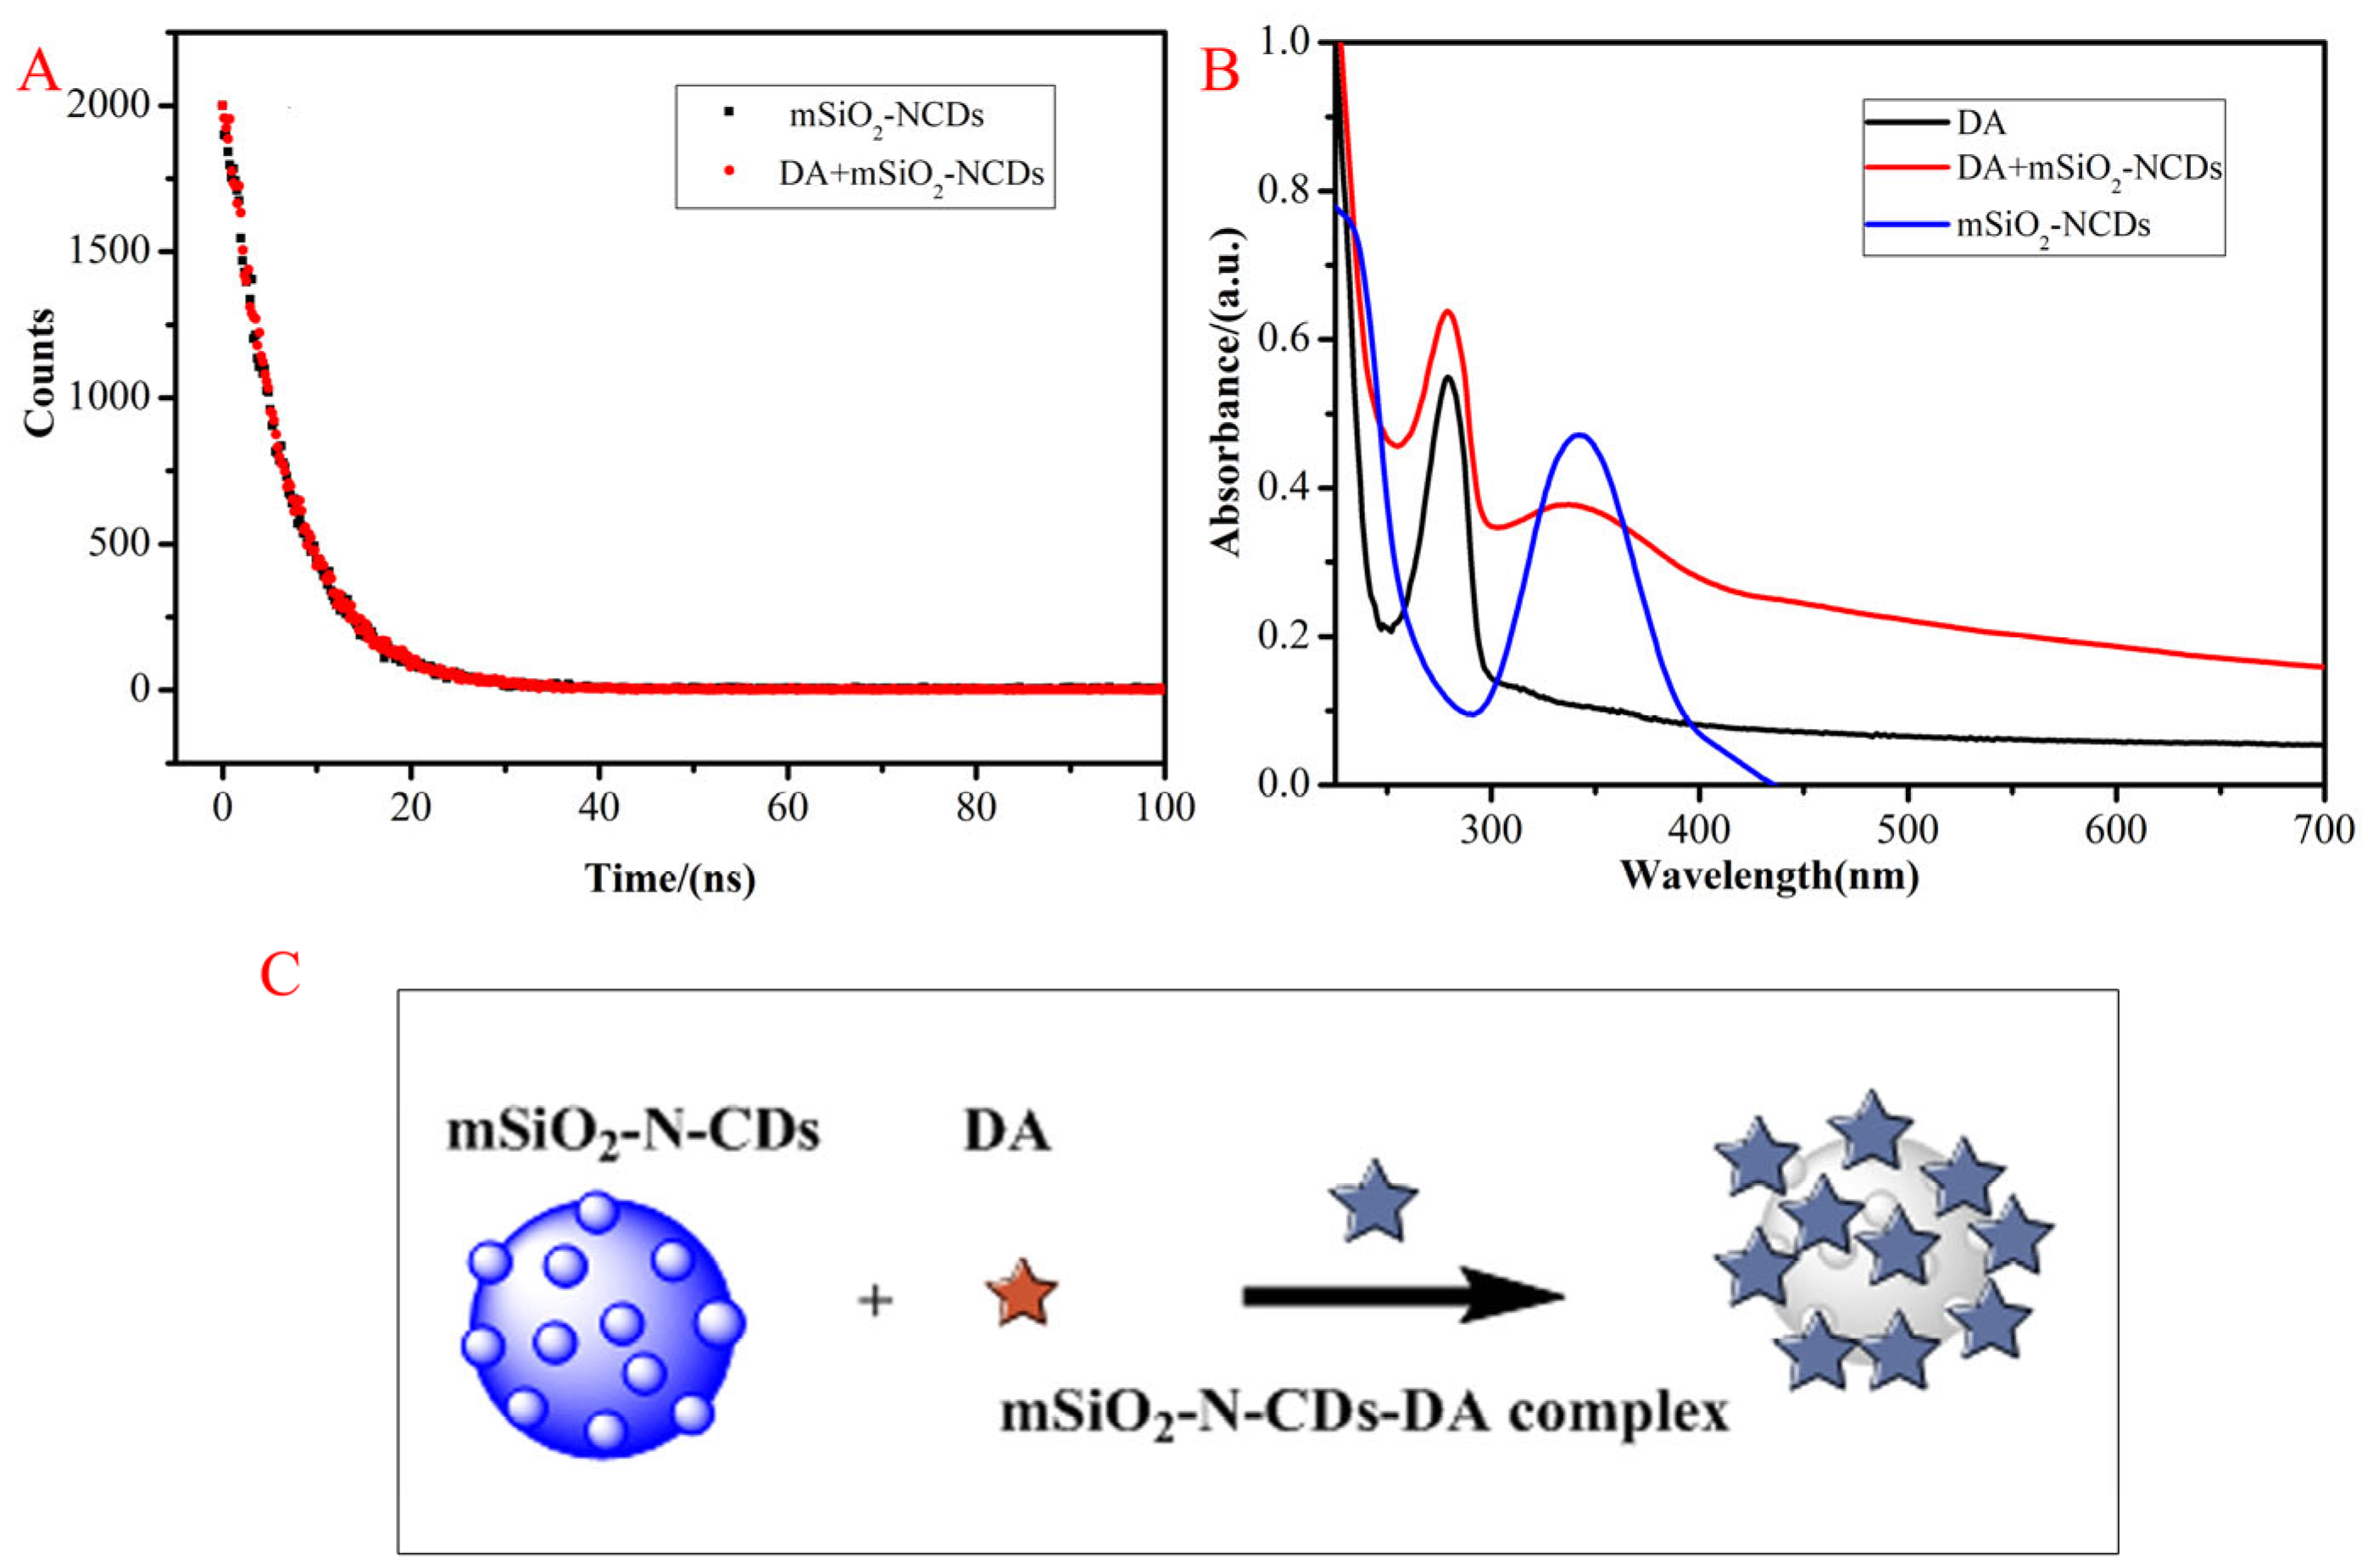
3.5. Possible Mechanism

Usually, the fluorescence quenching process includes two types: dynamic quenching and static quenching [53]. The possible quenching mechanism of mSiO2-N-CDs on DA was analyzed using fluorescence lifetime decay analysis and UV–VIS spectra. Fluorescence lifetime decay analysis was performed on mSiO2-N-CDs with and without DA. As shown in Figure 6A, the average lifetime of the mSiO2-N-CDs sensor (τ0) was 6.43 ns. After the addition of DA (10 μM), the lifetime (τ1) was 6.45 ns; that is, the ratio value of τ01 was about equal to 1. According to previous reports [54,55], if τ01 = 1, static quenching occurs. This indicates that the fluorescence quenching mechanism may be static quenching.
The quenching rate constant Kq can be calculated through the Stern–Volmer equation (F0/F = 1 + KSV[Q] = 1 + Kqτ0[Q]). Here, F0 represents the emission intensity at 465 nm without DA, F represents the emission intensity with the addition of DA, KSV is the Stern–Volmer quenching constant, τ0 is the lifespan without DA, and [Q] is the concentration of DA. From the calculation, it was concluded that the value of kq was 3.8 × 10¹² M−1·s−1, much greater than 2.0 × 10¹⁰ M−1·s−1. This result further implied the existence of static quenching [55].
Figure 6B presents the UV–VIS spectra of mSiO2-N-CDs, DA, and mSiO2-N-CDs with DA. The absorption peak of mSiO2-N-CDs, appearing around 350 nm, was assigned to the n-π* electron transition of the C=O and C-N groups of the CDs [48]. The typical absorption of π-orbitals in aromatic rings resulted in a sharp peak at 280 nm for DA [48]. When DA was added into the mSiO2-N-CDs solution, the absorption band around 350 nm was significantly weaker and a new wide absorption band (450–600 nm) was generated, implying the formation of a new complex (mSiO2-N-CDs-DA) between mSiO2-N-CDs and DA [56,57]. This might be attributed to the forces between mSiO2-N-CDs and DA, such as the hydrogen bonding and the π-π conjugation between them, due to the abundant amino (-NH2) and carboxyl (-COOH) groups on the surface of mSiO2-N-CDs, and the amino (-NH2) and hydroxyl (-OH) groups on the DA molecule. This result supports the static quenching mechanism (as depicted in Figure 6C) we proposed.

4. Conclusions

An mSiO2-N-CDs fluorescence probe was successfully prepared for DA detection via a one-pot hydrothermal reaction using CA as the carbon source, UR as the nitrogen source and mSiO2 as the skeleton. N-CDs were generated in situ in the pore channels of mesoporous silica. Due to the immobilization of the N-CDs by the mesoporous silica pores, the self-quenching caused by the aggregation of N-CDs was effectively avoided. Furthermore, solid-state mSiO2-N-CDs exhibited stable PL with a high quantum yield (32.5%).
Based on the high selectivity and sensitivity of mSiO2-N-CDs for DA, a rapid, simple, and sensitive DA detection method was established, with a detection limit of 107 nM and a linear range of 0–50 µM. This probe was applied in the determination of the DA content in actual urine samples, with the spiked recovery ranging from 98.0% to 100.8% and the RSD from 0.71% to 2.0%. Due to the simple and convenient preparation process of the mSiO2-N-CDs, their good fluorescence stability, and their high sensitivity and selectivity for DA, the developed fluorescent probe has potential applications in determining the DA content in real biological samples.

Supplementary Materials

The following supporting information can be downloaded at: https://www.mdpi.com/article/10.3390/nano13232989/s1, Figure S1: comparative PL of solid N-CDs and solid mSiO2-N-CDs, Figure S2: (A) C1s spectrum of mSiO2-N-CDs (B) N1s spectrum of mSiO2-N-CDs (C) O1s spectrum of mSiO2-N-CDs.

Author Contributions

Conceptualization, Y.W. and F.K.; methodology, X.G. and R.Y.; software, X.X.; investigation, X.G., X.X. and X.C.; writing—original draft preparation, X.G.; writing—review and editing, Y.W. and F.K.; supervision, Y.W.; funding acquisition, Q.X. All authors have read and agreed to the published version of the manuscript.

Funding

National Natural Science Foundation of China (22261019). Education Department of Jiangxi Province (GJJ211125; GJJ2201329).

Data Availability Statement

The data presented in this study are available on request from the corresponding author.

Conflicts of Interest

The authors declare no conflict of interest.

References

  1. Chakravarthy, V.S.; Balasubramani, P.P.; Mandali, A.; Jahanshahi, M.; Moustafa, A.A. The many facets of dopamine: Toward an integrative theory of the re of dopamine in managing the body’s energy resource. Physiol. Behav. 2018, 195, 128–141. [Google Scholar] [CrossRef]
  2. Tang, C.Y.; Zou, Z.; Liang, T.T.; Yuan, C.S.; Gao, J.C.; Tang, K.L.; Li, C.M. Methylene blue intercalated aptamer to amplify signals toward sensitively electrochemical detection of dopamine released from living Parkinson’s disease model cells. Sens. Actuators Rep. 2022, 4, 100080. [Google Scholar] [CrossRef]
  3. Berezhnov, A.V.; Fedotova, E.I.; Sergeev, A.I.; Teplov, I.Y.; Abramov, A.Y. Dopamine controls neuronal spontaneous calcium oscillations via astrocytic signal. Cell Calcium 2021, 94, 102359. [Google Scholar] [CrossRef] [PubMed]
  4. Lua, G.; Yu, G.H.; Kong, X.; Chen, Y.X.; Yin, D.X.; Lu, W.X.; Liu, Q.Y. Porphyrin/MoS2 film for ultrasensitive dopamine detection. Inorg. Chem. Commun. 2019, 110, 107591–107595. [Google Scholar] [CrossRef]
  5. Syslova, K.; Rambousek, L.; Kuzma, M.; Najmanova, V.; Bubenikova-Valesova, V.; Slamberova, R.; Kacer, P. Monitoring of dopamine and its metabolites in brain microdialysates: Method combining freeze-drying with liquid chromatography-tandem mass spectrometry. J. Chromatogr. A 2011, 1218, 3382–3391. [Google Scholar] [CrossRef] [PubMed]
  6. Hows, M.E.P.; Lacroix, L.; Heidbreder, C.; Organ, A.J.; Shah, A.J. High-performance liquid chromatography/tandem mass spectrometric assay for the simultaneous measurement of dopamine, norepinephrine, 5-hydroxytryptamine and cocaine in biological samples. J. Neurosci. Methods 2004, 138, 123–132. [Google Scholar] [CrossRef] [PubMed]
  7. Immanuel, S.; Aparna, T.K.; Sivasubramanian, R. A facile preparation of Au-SiO2 nanocomposite for simultaneous electrochemical detection of dopamine and uric acid. Surf. Interfaces 2018, 14, 82–91. [Google Scholar] [CrossRef]
  8. Hannah, S.; Al-Hatmi, M.; Gray, L.; Corrigan, D.K. Low-cost, thin-film, mass-manufacturable carbon electrodes for detection of the neurotransmitter dopamine. Bioelectrochemistry 2020, 133, 107480. [Google Scholar] [CrossRef]
  9. Stewart, A.J.; Hendry, J.; Dennany, L. Whole Blood Electrochemiluminescent Detection of Dopamine. Anal. Chem. 2015, 87, 11847–11853. [Google Scholar] [CrossRef] [PubMed]
  10. Kokulnathan, T.; Wang, T.J.; Kumar, E.A.; Duraisamy, N.; Lee, A.T. An electrochemical platform based on yttrium oxide/boron nitride nanocomposite for the detection of dopamine. Sens. Actuators B Chem. 2021, 349, 130787. [Google Scholar] [CrossRef]
  11. Liu, B.T.; Cai, X.Q.; Luo, Y.H.; Zhu, K.; Zhang, Y.Z.; Hu, T.T.; Sang, T.T.; Zhang, C.Y.; Zhang, D.E. Facile synthesis of nickel@carbon nanorod composite for simultaneously electrochemical detection of dopamine and uric acid. Microchem. J. 2021, 171, 106823. [Google Scholar] [CrossRef]
  12. Devi, N.R.; Kumar, T.H.V.; Sundramoorthy, A.K. Electrochemically Exfoliated Carbon Quantum Dots Modified Electrodes for Detection of Dopamine Neurotransmitter. J. Electrochem. Soc. 2018, 165, G3112–G3119. [Google Scholar] [CrossRef]
  13. Hun, X.; Wang, S.Y.; Zhao, J.K.; Luo, X.L. A Photoelectrochemical Sensor for Ultrasensitive Dopamine Detection Based on Single-Layer Nano MoS2 Modified Gold Electrode. Sens. Actuators B Chem. 2017, 249, 83–89. [Google Scholar] [CrossRef]
  14. Ferlazzo, A.; Espro, C.; Iannazzo, D.; Neri, G. Determination of Phenylalanine by a Novel Enzymatic PHD/SPE Biosensor. IEEE Trans. Instrum. Meas. 2023, 72, 9508308. [Google Scholar] [CrossRef]
  15. Xu, Z.Y.; Qiao, X.J.; Tao, R.Z.; Li, Y.X.; Zhao, S.J.; Cai, Y.C.; Luo, X.L. A wearable sensor based on multifunctional conductive hydrogel for simultaneous accurate pH and tyrosine monitoring in sweat. Biosens. Bioelectron. 2023, 234, 115360. [Google Scholar] [CrossRef] [PubMed]
  16. Ferlazzo, A.; Espro, C.; Iannazzo, D.; Neri, G. Yttria-zirconia electrochemical sensor for the detection of tyrosine. Mater. Today Chem. 2023, 35, 106036. [Google Scholar] [CrossRef]
  17. Tao, Y.; Lin, Y.H.; Ren, J.S.; Qu, X.G. A dual fluorometric and colorimetric sensor for dopamine based on BSA-stabilized Au nanoclusters. Biosens. Bioelectron. 2013, 42, 41–46. [Google Scholar] [CrossRef] [PubMed]
  18. Fabre, B.; Hauquier, F. Boronic Acid-Functionalized Oxide-Free Silicon Surfaces for the Electrochemical Sensing of Dopamine. Langmuir 2017, 33, 8693–8699. [Google Scholar] [CrossRef] [PubMed]
  19. Jiang, K.; Wang, Y.; Thakur, G.; Kotsuchibashi, Y.; Naicker, S.; Narain, R.; Thundat, T. Rapid and Highly Sensitive Detection of Dopamine using Conjugated Oxaborole based Polymer and Glycopolymer Systems. ACS Appl. Mater. Interfaces 2017, 9, 15225–15231. [Google Scholar] [CrossRef]
  20. Wei, X.; Zhang, Z.D.; Wang, Z.H. A simple dopamine detection method based on fluorescence analysis and dopamine polymerization. Microchem. J. 2019, 145, 55–58. [Google Scholar] [CrossRef]
  21. Zhou, T.; Su, Z.; Tu, Y.F.; Yan, J.L. Determination of dopamine based on its enhancement of gold-silver nanocluster fluorescence. Spectrochim. Acta Part A Mol. Biomol. Spectrosc. 2021, 252, 119519. [Google Scholar] [CrossRef]
  22. Xu, B.B.; Su, Y.Y.; Li, L.; Liu, R.; Lv, Y. Thiol-Functionalized Single-layered MoS2 Nanosheet as a Photoluminescence Sensing Platform via Charge Transfer for Dopamine Detection. Sens. Actuators B Chem. 2017, 246, 380–388. [Google Scholar] [CrossRef]
  23. Sun, J.; Feng, A.L.; Wu, X.; Che, X.W.; Zhou, W.Z. Enhanced Tb(III) fluorescence on gelatin-coated silver nanoparticles in dopamine detection. Talanta 2021, 231, 122334. [Google Scholar] [CrossRef] [PubMed]
  24. Ling, X.C.; Shi, R.K.; Zhang, J.; Liu, D.M.; Weng, M.R.; Zhang, C.W.; Lu, M.; Xie, X.J.; Huang, L.; Huang, W. Dual-Signal Luminescent Detection of Dopamine by a Single Type of Lanthanide Doped Nanoparticles. ACS Sens. 2018, 3, 1683–1689. [Google Scholar] [CrossRef] [PubMed]
  25. Das, R.; Paul, K.K.; Giri, P.K. Highly sensitive and selective label-free detection of dopamine in human serum based on nitrogen-doped graphene quantum dots decorated on Au nanoparticles: Mechanistic insights through microscopic and spectroscopic studies. Appl. Surf. Sci. 2019, 490, 318–330. [Google Scholar] [CrossRef]
  26. Liu, S.Y.; Shi, F.P.; Zhao, X.J.; Chen, L.; Su, X.G. 3-Aminophenyl boronic acid-functionalized CuInS2 quantum dots as a near-infrared fluorescence probe for the determination of dopamine. Biosens. Bioelectron. 2013, 47, 379–384. [Google Scholar] [CrossRef] [PubMed]
  27. Wang, C.J.; Shi, H.X.; Yang, M.; Yao, Z.R.; Zhang, B.; Liu, E.Z.; Hu, X.Y.; Xue, W.M.; Fan, J. Biocompatible sulfur nitrogen co-doped carbon quantum dots for highly sensitive and selective detection of dopamine. Colloids Surf. B Biointerfaces 2021, 205, 111874. [Google Scholar] [CrossRef] [PubMed]
  28. Zhuo, S.J.; Guan, Y.Y.; Li, H.; Fang, J.; Zhang, P.; Du, J.Y.; Zhu, C.Q. Facile fabrication of fluorescent fe-doped carbon quantum dots for dopamine sensing and bioimaging application. Analyst 2018, 144, 656–662. [Google Scholar] [CrossRef]
  29. Zhao, C.X.; Jiao, Y.; Hua, J.H.; Yang, J.; Yang, Y.L. Hydrothermal Synthesis of Nitrogen-Doped Carbon Quantum Dots as Fluorescent Probes for the Detection of Dopamine. J. Fluoresc. 2018, 28, 269–276. [Google Scholar] [CrossRef] [PubMed]
  30. Zhou, Y.Q.; Mintz, K.J.; Sharma, S.K.; Leblanc, R.M. Carbon Dots: Diverse Preparation. Application and Perspective in Surface Chemistry. Langmuir 2019, 35, 9115–9132. [Google Scholar] [CrossRef]
  31. Chen, L.T.; Wang, C.F.; Liu, C.; Chen, S. Facile Access to Fabricate Carbon Dots and Perspective of Large -Scale Applications. Small 2023, 19, 2206671. [Google Scholar] [CrossRef]
  32. Chen, Y.H.; Zheng, M.T.; Xiao, Y.; Dong, H.W.; Zhang, H.R.; Zhuang, J.; Hu, H.; Lei, B.F.; Liu, Y.L. A self-quenching-resistant carbon-dot powder with tunable solid-state fluorescence and construction of dual-fluorescence morphologies for white light-emission. Adv. Mater. 2016, 28, 312–318. [Google Scholar] [CrossRef]
  33. Zheng, Y.N.; Zheng, J.X.; Wang, J.L.; Yang, Y.Z.; Lu, T.P.; Liu, X.G. Preparation of Stable Solid-State Carbon Quantum Dots with Multi-Peak Emission. Nanomaterials 2020, 10, 303. [Google Scholar] [CrossRef]
  34. Wang, B.; Mu, Y.; Zhang, H.; Shi, H.; Chen, G.; Yu, Y.; Yang, Z.; Li, J.; Yu, J. Red Room-Temperature Phosphorescence of CDs@Zeolite Composites Triggered by Heteroatoms in Zeolite Frameworks. ACS Cent. Sci. 2019, 5, 349–356. [Google Scholar] [CrossRef] [PubMed]
  35. Liang, K.; Wang, L.; Xu, Y.; Fang, Y.; Fang, Y.; Xia, W.; Liu, Y.N. Carbon dots self-decorated heteroatom-doped porous carbon with superior electrocatalytic activity for oxygen reduction. Electrochim. Acta 2020, 335, 135666. [Google Scholar] [CrossRef]
  36. Sun, S.; Liang, S. Recent advances in functional mesoporous graphitic carbon nitride (mpg-C3N4) polymers. Nanoscale 2017, 9, 10544–10578. [Google Scholar] [CrossRef] [PubMed]
  37. He, Y.; He, J.; Wang, L.; Yu, Z.; Zhang, H.; Liu, Y.; Lei, B. Synthesis of double carbon dots co-doped mesoporous Al2O3 for ratiometric fluorescent determination of oxygen. Sens. Actuators B Chem. 2017, 251, 918–926. [Google Scholar] [CrossRef]
  38. He, Y.; He, J.; Yu, Z.; Zhang, H.; Liu, Y.; Hu, G.; Zheng, M.; Dong, H.; Zhuang, J.; Lei, B. Double carbon dot assembled mesoporous aluminas: Solid-state dual-emission photoluminescence and multifunctional applications. J. Mater. Chem. C 2018, 6, 2495–2501. [Google Scholar] [CrossRef]
  39. Qin, S.J.; Yan, B. Dual-emissive ratiometric fluorescent probe based on Eu3+/Cdots@MOF hybrids for the biomarker diaminotoluene sensing. Sens. Actuators B Chem. 2018, 272, 510–517. [Google Scholar] [CrossRef]
  40. Wang, A.; Hou, Y.L.; Kang, F.; Lyu, F.; Xiong, Y.; Chen, W.C.; Lee, C.S.; Xu, Z.; Rogach, A.L.; Lu, J.; et al. Rare earth-free composites of carbon dots/metal–organic frameworks as white light emitting phosphors. J. Mater. Chem. C 2019, 7, 2207–2211. [Google Scholar] [CrossRef]
  41. Dong, Y.; Ma, J.; Liu, C.; Bao, Y. Ordered mesoporous silica encapsulated carbon quantum dots and its application in Fe3+ detection. Ceram. Int. 2020, 46, 11115–11123. [Google Scholar] [CrossRef]
  42. Wang, L.; Zhang, H.R.; Zhou, X.H.; Liu, Y.L.; Lei, B.F. Preparation, characterization and oxygen sensing properties of luminescent carbon dots assembled mesoporous silica microspheres. J. Colloid Interface Sci. 2016, 478, 256–262. [Google Scholar] [CrossRef] [PubMed]
  43. Liu, M.L.; Li, T.T.; Zhang, C.; Zheng, Y.; Wu, C.Q.; Zhang, J.; Zhang, K.; Zhang, Z.P. Fluorescent carbon dots embedded in mesoporous silica nanospheres: A simple platform for Cr(VI) detection in environmental water. J. Hazard. Mater. 2021, 415, 125699. [Google Scholar] [CrossRef] [PubMed]
  44. Chang, Q.; Yang, S.; Xue, C.; Li, N.; Wang, Y.; Li, Y.; Wang, H.; Yang, J.; Hu, S. Nitrogen-doped carbon dots encapsulated in the mesoporous channels of SBA-15 with solid-state fluorescence and excellent stability. Nanoscale 2019, 11, 7247–7255. [Google Scholar] [CrossRef] [PubMed]
  45. Wang, M.; Ren, X.; Zhu, L.; Xia, Y.; Qiu, J. Preparation of mesoporous silica/carbon quantum dots composite and its application in selective and sensitive Hg2+ detection. Micropor. Mesopor. Mater. 2019, 284, 378–384. [Google Scholar] [CrossRef]
  46. Wu, H.B.; Liu, Y.; Wei, S.; Yang, P.; Xing, H.L. Facile preparation of mesoporous silica coated nitrogen doped carbon dots for sensitive detection of picric acid. RSC Adv. 2022, 12, 33696–33705. [Google Scholar] [CrossRef] [PubMed]
  47. Yang, Y.; Bernardi, S.; Song, H.; Zhang, J.; Yu, M.H.; Reid, J.C.; Strounina, E.; Searles, D.J.; Yu, C.Z. Anion Assisted Synthesis of Large Pore Hollow Dendritic Mesoporous Organosilica Nanoparticles: Understanding the Composition Gradient. Chem. Mater. 2016, 28, 704–707. [Google Scholar] [CrossRef]
  48. Kumar, A.; Asu, S.; Mukherjee, P.; Singh, P.; Kumari, A.; Sahu, S.K. Single-step Synthesis of N-doped Carbon Dots and Applied for Dopamine Sensing, In vitro Multicolor Cellular Imaging as well as Fluorescent Ink. J. Photochem. Photobiol. A 2021, 406, 113019. [Google Scholar] [CrossRef]
  49. Kumar, A.; Kumari, A.; Mukherjee, P.; Saikia, T.; Pal, K.; Sahu, S.K. A design of fluorescence-based sensor for the detection of dopamine via FRET as well as live cell imaging. Microchem. J. 2020, 159, 105590. [Google Scholar] [CrossRef]
  50. Zhang, X.; Chen, X.; Kai, S.; Wang, H.Y.; Yang, J.; Wu, F.G.; Chen, Z. Highly sensitive and selective detection of dopamine using one-pot synthesized highly photoluminescent silicon nanoparticles. Anal. Chem. 2015, 87, 3360–3365. [Google Scholar] [CrossRef] [PubMed]
  51. Yu, M.; Lu, Y.; Tan, Z.J. Fluorescence growth of self-polymerized fluorescence polydopamine for ratiometric visual detection of DA. Talanta 2017, 168, 16–22. [Google Scholar] [CrossRef] [PubMed]
  52. Zhao, J.J.; Zhao, L.M.; Lan, C.Q.; Zhao, S.L. Graphene quantum dots as effective probes for label-free fluorescence detection of dopamine. Sens. Actuators B Chem. 2016, 223, 246–251. [Google Scholar] [CrossRef]
  53. Liu, Y.; Li, W.; Wu, P.; Ma, C.; Wu, X.; Xu, M.; Luo, S.; Xu, Z.; Liu, S. Hydrothermal synthesis of nitrogen and boron co-doped carbon quantum dots for application in acetone and dopamine sensors and multicolor cellular imaging. Sens. Actuators B Chem. 2019, 281, 34–43. [Google Scholar] [CrossRef]
  54. Naik, V.; Zantye, P.; Gunjal, D.; Gore, A.; Anbhule, P.; Kowshik, M.; Bhosale, S.V.; Kolekar, G. Nitrogen-Doped Carbon Dots via Hydrothermal Synthesis: Naked Eye Fluorescent Sensor for Dopamine and Used for Multicolor Cell Imaging. ACS Appl. Bio Mater. 2019, 2, 2069–2077. [Google Scholar] [CrossRef] [PubMed]
  55. Cao, X.; Shao, C.Y.; Zhang, C.; Liang, M.N.; Wang, Y.X.; Cheng, J.; Lu, S. Yeast powder derived carbon quantum dots for dopamine detection and living cell imaging. Anal. Methods 2022, 14, 1342–1350. [Google Scholar] [CrossRef] [PubMed]
  56. Wang, Y.F.; Li, L.; Jiang, M. One-pot synthesis of boron and nitrogen co-doped silicon-carbon dots for fluorescence enhancement and on-site colorimetric detection of dopamine with high selectivity. Appl. Surf. Sci. 2022, 573, 151457. [Google Scholar] [CrossRef]
  57. Wei, S.S.; Liu, B.Q.; Shi, X.Y.; Cui, S.F.; Zhang, H.Y.; Lu, P.J.; Guo, H.; Wang, B.; Sun, G.Y.; Jiang, C.H. Gadolinium (III) doped carbon dots as dual-mode sensor for the recognition of dopamine hydrochloride and glutamate enantiomers with logic gate operation. Talanta 2023, 252, 123865. [Google Scholar] [CrossRef]
Scheme 1. Synthesis diagram of mSiO2-N-CDs and their application in DA detection.
Nanomaterials 13 02989 sch001
Figure 1. (A,B) TEM images of NCDs; (C) TEM images of mSiO2-N-CDs; (D) XPS spectrum of mSiO2-N-CDs.
Nanomaterials 13 02989 g001
Figure 2. (A) UV–VIS spectra of the obtained samples; (B) FTIR spectra of the obtained samples.
Nanomaterials 13 02989 g002
Figure 3. (A) The PL spectra of mSiO2-N-CDs (inset: photographs of mSiO2-N-CDs dispersed in water); (B) the emission spectra of mSiO2-N-CDs under different excitation; (C) the emission spectra of the solid mSiO2-N-CDs over time, up to 28 days; (D) photographs of the corresponding mSiO2-N-CDs powder over time, up to 28 days under 365 nm UV irradiation.
Nanomaterials 13 02989 g003
Figure 4. (A) Selectivity of mSiO2-N-CDs towards various interfering analytes (50 μM); (B) the fluorescence quenching efficiency of DA on mSiO2-N-CDs at different pH values; (C) the effect of culture time on the fluorescence quenching.
Nanomaterials 13 02989 g004
Figure 5. (A) Fluorescence emission spectra of mSiO2-N-CDs probe in PBS buffer solution (pH = 7.4) with different amounts of DA under 370 nm excitation; (B) linear relationship between fluorescence intensity ratio (F0/F) and concentration of DA under 370 nm excitation (Inset: the photographs of mSiO2-N-CDs solution with DA (50 μM) and without DA under 365 nm ultraviolet lamp).
Nanomaterials 13 02989 g005
Figure 6. (A) Representative lifetime decay profiles of mSiO2-N-CDs in the absence (black line) and presence (blue line) of DA; (B) UV-visible absorption spectra of mSiO2-N-CDs, DA, and mSiO2-N-CDs with DA; (C) the possible quenching mechanism diagram.
Nanomaterials 13 02989 g006
Table 1. Comparison of fluorescence sensors for detection of DA.
MethodProbeLiner Range (μM)LOD (μM)Reference
FL/quenchingAu@N-GQD0.0–80.00.52[25]
FL/quenchingF-CuInS20.5–40.00.2[26]
FL/quenchingS,N-CQD0–50 0.082[27]
FL/quenchingFe-CQDs0.01–50 0.005[28]
FL/quenchingN-CQDs0.01–2000.05[29]
FL/quenchingr-QDs@SiO210.0–800.12[51]
FL/quenchingGQDs0.25–500.09[52]
FL/quenchingmSiO2-N-CDs0–500.107This work
Table 2. Detection of DA in human urine sample.
SampleAdded (µM)Found (µM)Recovery/%RSD%, n = 3
10.50.4998.00.71
210.9999.01.80
355.04100.82.0
44040.30100.82.0
Disclaimer/Publisher’s Note: The statements, opinions and data contained in all publications are solely those of the individual author(s) and contributor(s) and not of MDPI and/or the editor(s). MDPI and/or the editor(s) disclaim responsibility for any injury to people or property resulting from any ideas, methods, instructions or products referred to in the content.

