Article

Detection of Dimethyl Methyl Phosphonate by Silica Molecularly Imprinted Materials

1
Department of Microelectronics, Xi’an Jiaotong University, Xi’an 710049, China
2
School of Physics, Xi’an Jiaotong University, Xi’an 710049, China
*
Author to whom correspondence should be addressed.
Nanomaterials 2023, 13(21), 2871; https://doi.org/10.3390/nano13212871
Submission received: 22 September 2023 / Revised: 21 October 2023 / Accepted: 24 October 2023 / Published: 30 October 2023

Abstract

:
In recent years, the increasing severity of chemical warfare agent threats to public safety has led to a growing demand for gas sensors capable of detecting these compounds. However, gas sensors used for the detection of chemical warfare agents must overcome limitations in sensitivity, selectivity, and reaction speed. This paper presents a sensitive material and a surface acoustic gas sensor for detecting dimethyl methyl phosphonate. The results demonstrate that the sensor exhibits good selectivity and could detect 80 ppb of dimethyl methyl phosphonate within 1 min. As an integral component of the sensor, the microstructure and adsorption mechanism of silica molecular imprinting material were studied in detail. The results show that the template molecule could significantly affect the pore volume, specific surface area, and hydroxyl density of mesoporous materials. These properties further affect the performance of the sensor. This study provides a valuable case study for the design of sensitive materials.

1. Introduction

Sarin is a volatile organic compound containing phosphorus and oxygen that can be used as a chemical weapon [1]. Sarin interacts with cholinesterase immediately after entering the body, rendering it incapable of hydrolyzing acetylcholine. This leads to the accumulation of acetylcholine, which in turn can lead to neurological problems and, in severe cases, death. Because sarin is easy to hide, it is often used as a terrorist weapon and poses a threat to public safety. Sarin sensors can effectively detect sarin and, therefore, become the most important means of early warning. Therefore, there is an urgent need to develop sarin sensors with fast response, high sensitivity, and good stability for early warning. It should be noted that usually in research, low-toxicity dimethyl methyl phosphonate (DMMP) is used as a simulant of sarin in consideration of the safety and health of researchers.
Sarin detection methods include chromatography [2], mass spectrometry [3], infrared spectrometry [4], ion mobility spectrometry [5,6], electrochemical sensors, metal oxide sensors [7], and surface acoustic wave (SAW) gas sensors. The SAW gas sensors show potential application prospects due to their advantages of high sensitivity, small size, and low cost. A SAW gas sensor consists of a piezoelectric substrate patterned with two interdigital transducers and a gas-sensitive film coated on the SAW propagation path. The absorption of target gas in the sensitive film will modulate SAW velocity and correspondingly change the phase or amplitude of the sensor output signal. According to this principle, the sensitivity and selectivity of the SAW gas sensor are mainly determined by the properties of the sensitive film. The sensitive materials available include hydrogen-bonded acidic compounds [8,9,10,11], polyepichlorohydrin, ethyl cellulose [12,13], metal oxide powders, and metal–organic framework (MOF) compounds [14]. These materials have excellent properties but are less designable than molecularly imprinted materials.
As a recent and rapidly evolving technology, molecular imprinting technology (MIT) has the benefits of a flexible approach and strong adsorption selectivity [15,16]. MIT uses DMMP molecules as templates to synthesize microporous materials with specific geometries. This porous material can efficiently and selectively adsorb DMMP molecules, making it an ideal sensitive material for SAW sensors. For sensitive materials used in SAW gas sensors, in order to improve sensitivity, low-density materials are usually preferred as sensitive films, such as carbon materials, alumina, and silica. Due to the advantages of silica in cost and preparation technology, it is suitable for preparing molecularly imprinted materials.
This study presents a mesoporous SiO2 molecularly imprinted polymer (MIP), which utilizes DMMP as the template for synthesis. The corresponding sensor has remarkable selectivity and sensitivity and achieves rapid detection of 80 ppb DMMP within 1 min. The sensitivity of the sensor is attributed to its high specific surface area and hydroxyl density. Moreover, the pore property and hydroxyl density of the sensitive material can be easily modulated by the content of the template DMMP. The large pore volume facilitates efficient diffusion of DMMP into the interior of the material, resulting in a fast response. These findings provide a compelling case for developing and designing materials with high sensitivity.

2. Materials and Methods

2.1. SAW Device Manufacturing

A SAW delay line structure with 200 nm thick aluminum interdigital transducers (IDTs) was fabricated on a 128° YX LiNbO3 wafer using a standard ultraviolet photolithography process. The delay line length between the IDTs was 2.56 mm. The designed SAW device operation frequency was 152 MHz, and the SAW velocity on the LiNbO3 wafer was 3890 m/s; thus, the corresponding wavelength λ was 25.6 μm. The apertures of the two IDTs were 100 λ, and their lengths were 130 λ and 40 λ, respectively. The prepared device was attached to a package base and coated with organic silicon rubber on the edge to reduce interference from reflected waves. Finally, the IDTs are connected to the pins of the base via wire bonding.

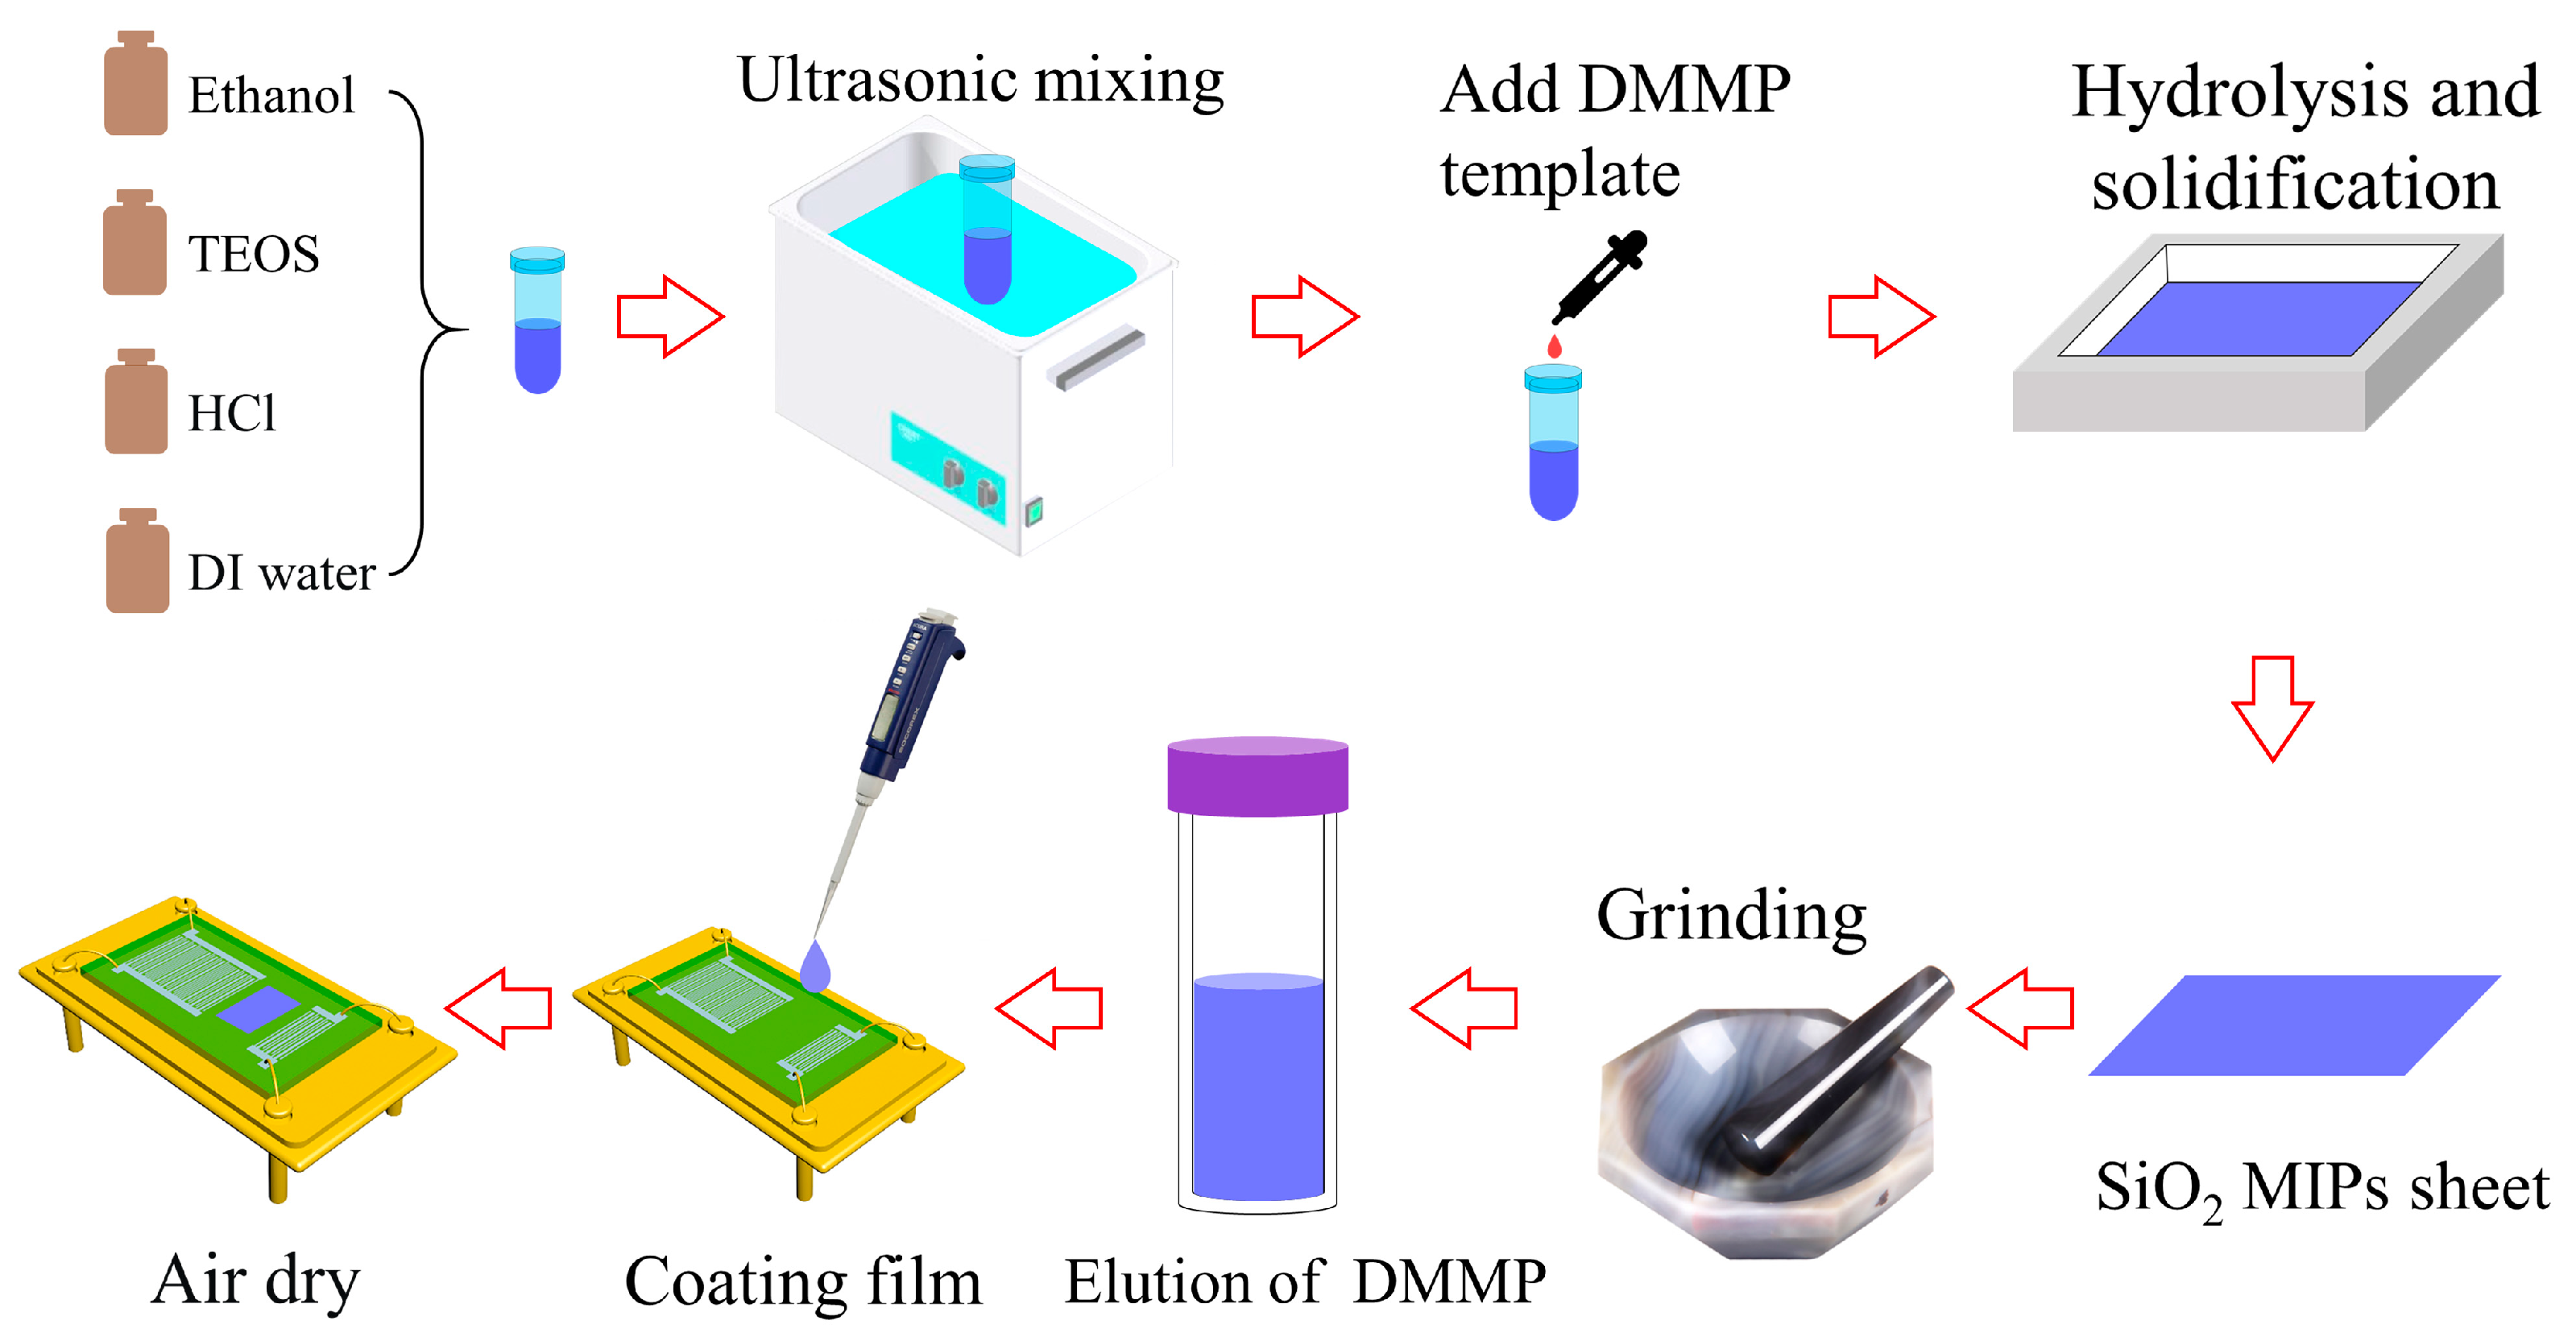
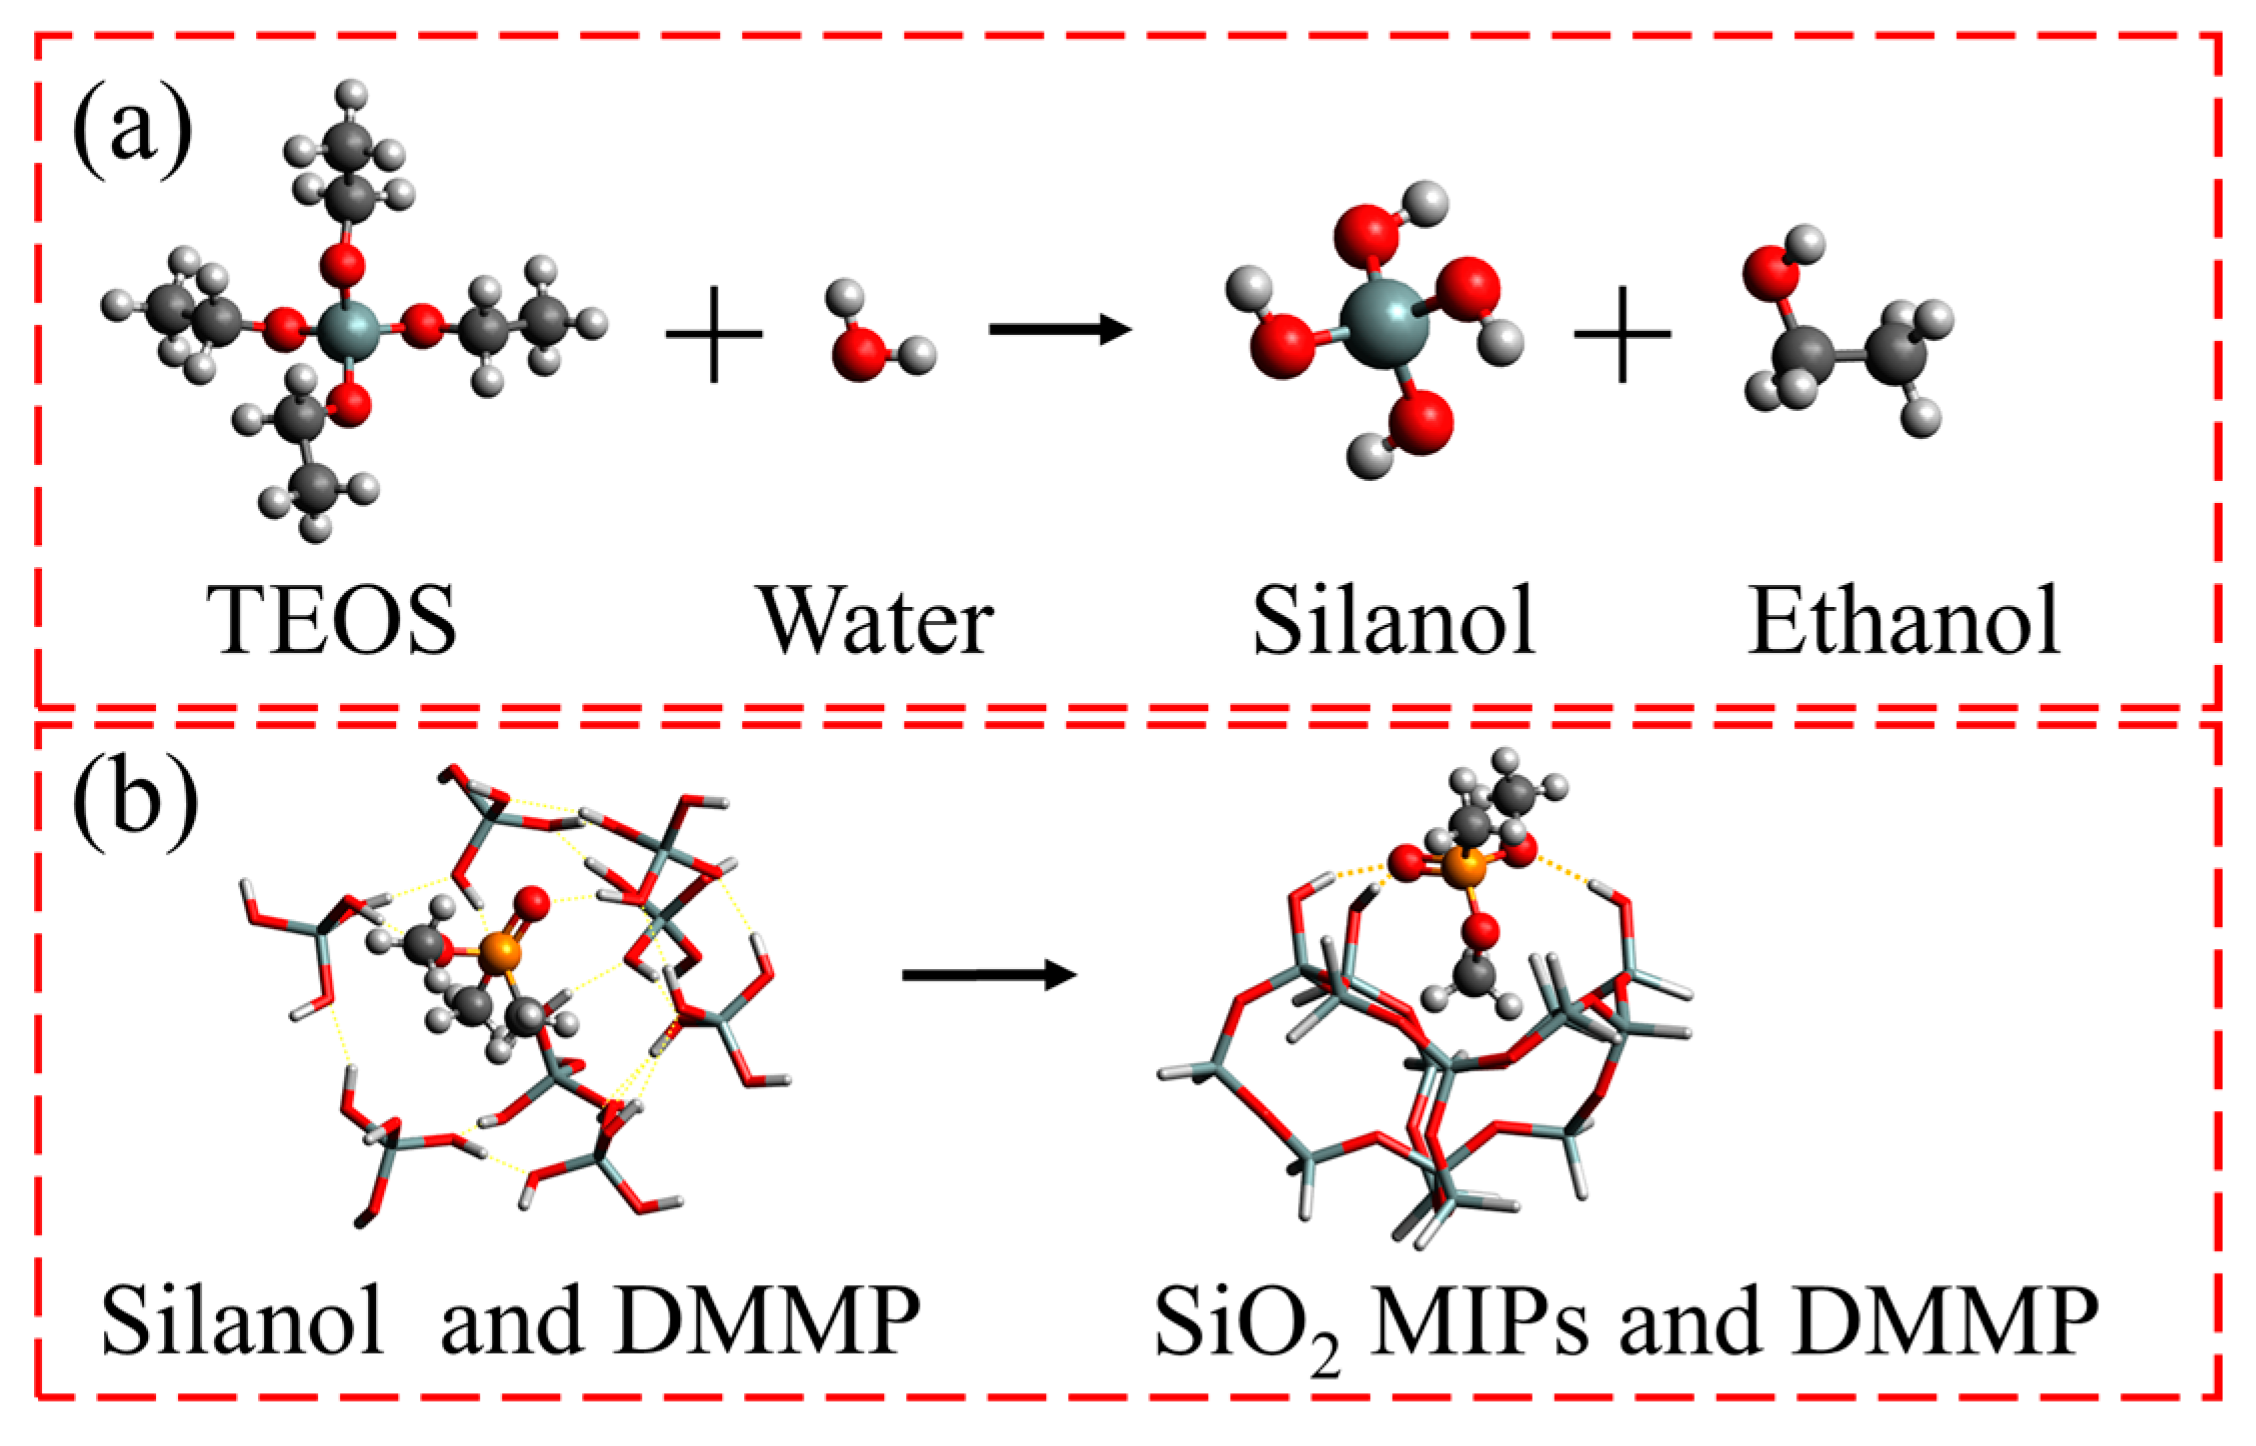
2.2. Synthesis of SiO2 MIPs

The reagents utilized in this work are listed below. Analytical reagent DMMP and ethanol were procured from Aladdin, while Macklin provided acetone, tetraethyl orthosilicate (TEOS), and hydrochloric acid (36%). Prior to preparation, a 0.1 mol/L dilute hydrochloric acid was produced by distilled water and hydrochloric acid. In order to study the effect of template DMMP on the performance of sensitive materials and gas sensors, 5 samples were arranged here for testing. Table 1 outlines the recipe for sensitive materials.
The S4 sample exhibited exceptional performance; thus, it was chosen as a representative example to demonstrate the detailed preparation process. A polyethylene plastic tube was used to combine 1260 μL of TEOS, 655 μL of ethanol, 205 μL of distilled water, and 5.62 μL of diluted hydrochloric acid (0.1 mol/L). After an hour of ultrasonic blending, 75 μL of DMMP was added, and the mixture was swirled for 5 min. The mixture was poured onto a square Teflon dish and covered with aluminum foil to minimize DMMP evaporation. After approximately 72 h, SiO2 MIP sheets were obtained by this process. These sheets were then ground into approximately 1 µm powder by placing them in an agate mortar along with 1 mL of ethanol. During the grinding process, a small sample was collected to measure the size of the powder using a light microscope. Grinding ceased when particles close to 1 µm in size were observed in the powder sample. To remove any remaining DMMP from the SiO2 powder, it was transferred into a polypropylene centrifuge tube and soaked in 30 mL of ethanol for five minutes before being separated through centrifugation. This step was repeated three times to obtain an ethanol-dispersed SiO2 MIP suspension with a concentration of approximately 11.2 mg/mL. The gas sensor was fabricated by dropping 2 μL suspension onto the SAW device using a pipette gun, followed by subsequent drying. The overall preparation procedure is illustrated in Figure 1.

2.3. Material Characterization

The scanning electron microscope (SEM) was a Regulus 8100 (Hitachi, Hitachinaka, Japan), and the X-ray photoelectron spectrometer (XPS) was a Thermo ESCALAB 250xi (Thermo, Waltham, MA, USA). The atomic force microscope (AFM) image is obtained by Bruker Dimension Icon (Bruker, Billerica, MA, USA), and the X-ray diffraction (XRD) diagram was obtained by Bruker D8 advance (Bruker, Billerica, MA, USA). The Raman spectra were obtained by RENISHAW 2000 (RENISHAW, Singapore), and the infrared absorption spectra were obtained by Shimadzu UV-3600 UV-VIS-NIR (Shimadzu, Kyoto, Japan). The surface areas of SiO2 MIPs were measured by Micromeritics ASAP2020 (Micromeritics, Norcross, GA, USA), and the solid nuclear magnetic resonance (NMR) spectrum was obtained from BRUKER AVANCE III HD 400M (Bruker, Billerica, MA, USA). The thickness of the sensitive film was measured using the KLA Tencor D-100 profiler (KLA Corporation, Milpitas, CA, USA). The network analyzer is ADVANTEST R3765CG (Advantest, Tokyo, Japan).
The samples before and after the elution of DMMP were studied, and the suffixes D and ND were used to represent the two samples. For example, S1 D represents the S1 sample containing the template molecule DMMP inside the material, and S1 ND represents the S1 sample after the template DMMP has been removed.

2.4. Sensor Test

A test system was used to evaluate the performance of the SAW gas sensor. The sensors were positioned in a 27 L chamber and connected to a computer-controlled network analyzer for measuring transmission properties. The liquid DMMP was injected into a small heater using a micro syringe, which is an evaporator to generate DMMP gas. Details of the test system are shown in Figure S1 of Supporting Information. After the adsorption of DMMP by sensitive materials, the increased mass of sensitive materials results in a change in the S21 curve of the SAW sensor. The maximum value Pt (t representing time) is extracted from the S21 curve as the output signal of the SAW sensor. As shown in Figure 2a, P30 represents the maximum value of the S21 curve of the SAW sensor at 30 s. These output signals constitute the dynamic response curve of the sensor, as shown in Figure 2b.

2.5. Material Calculation

Here, the adsorption mechanism of SiO2 MIPs was investigated using first-principles calculations. The program was ORCA 5.0.3, functional r2SCAN-3c for geometric optimization, ωB97M-V functional and def2-TZVP basis set with dispersion function for binding energy calculation [17], Multiwfn [18] for electrostatic potential (ESP) [19,20,21] and independent gradient model based on Hirshfeld partition (IGMH) [22]. The ESP of silanol and DMMP was calculated to identify potential active sites. The negative and positive potentials of ESP are shown in red and blue, respectively. Then, the strength and type of the intermolecular force are analyzed and shown by the IGMH. Strong attractive interaction (hydrogen bond) is shown in blue, weak attractive interaction (van der Waals force) is shown in green, and repulsive interaction is shown in red. According to the molar ratio between TEOS and DMMP of S4 in the recipe, a molecular cage containing 8 Si atoms is constructed to approximately replace the amorphous SiO2 MIPs, which is used to calculate the binding energy between the material and DMMP.

3. Results

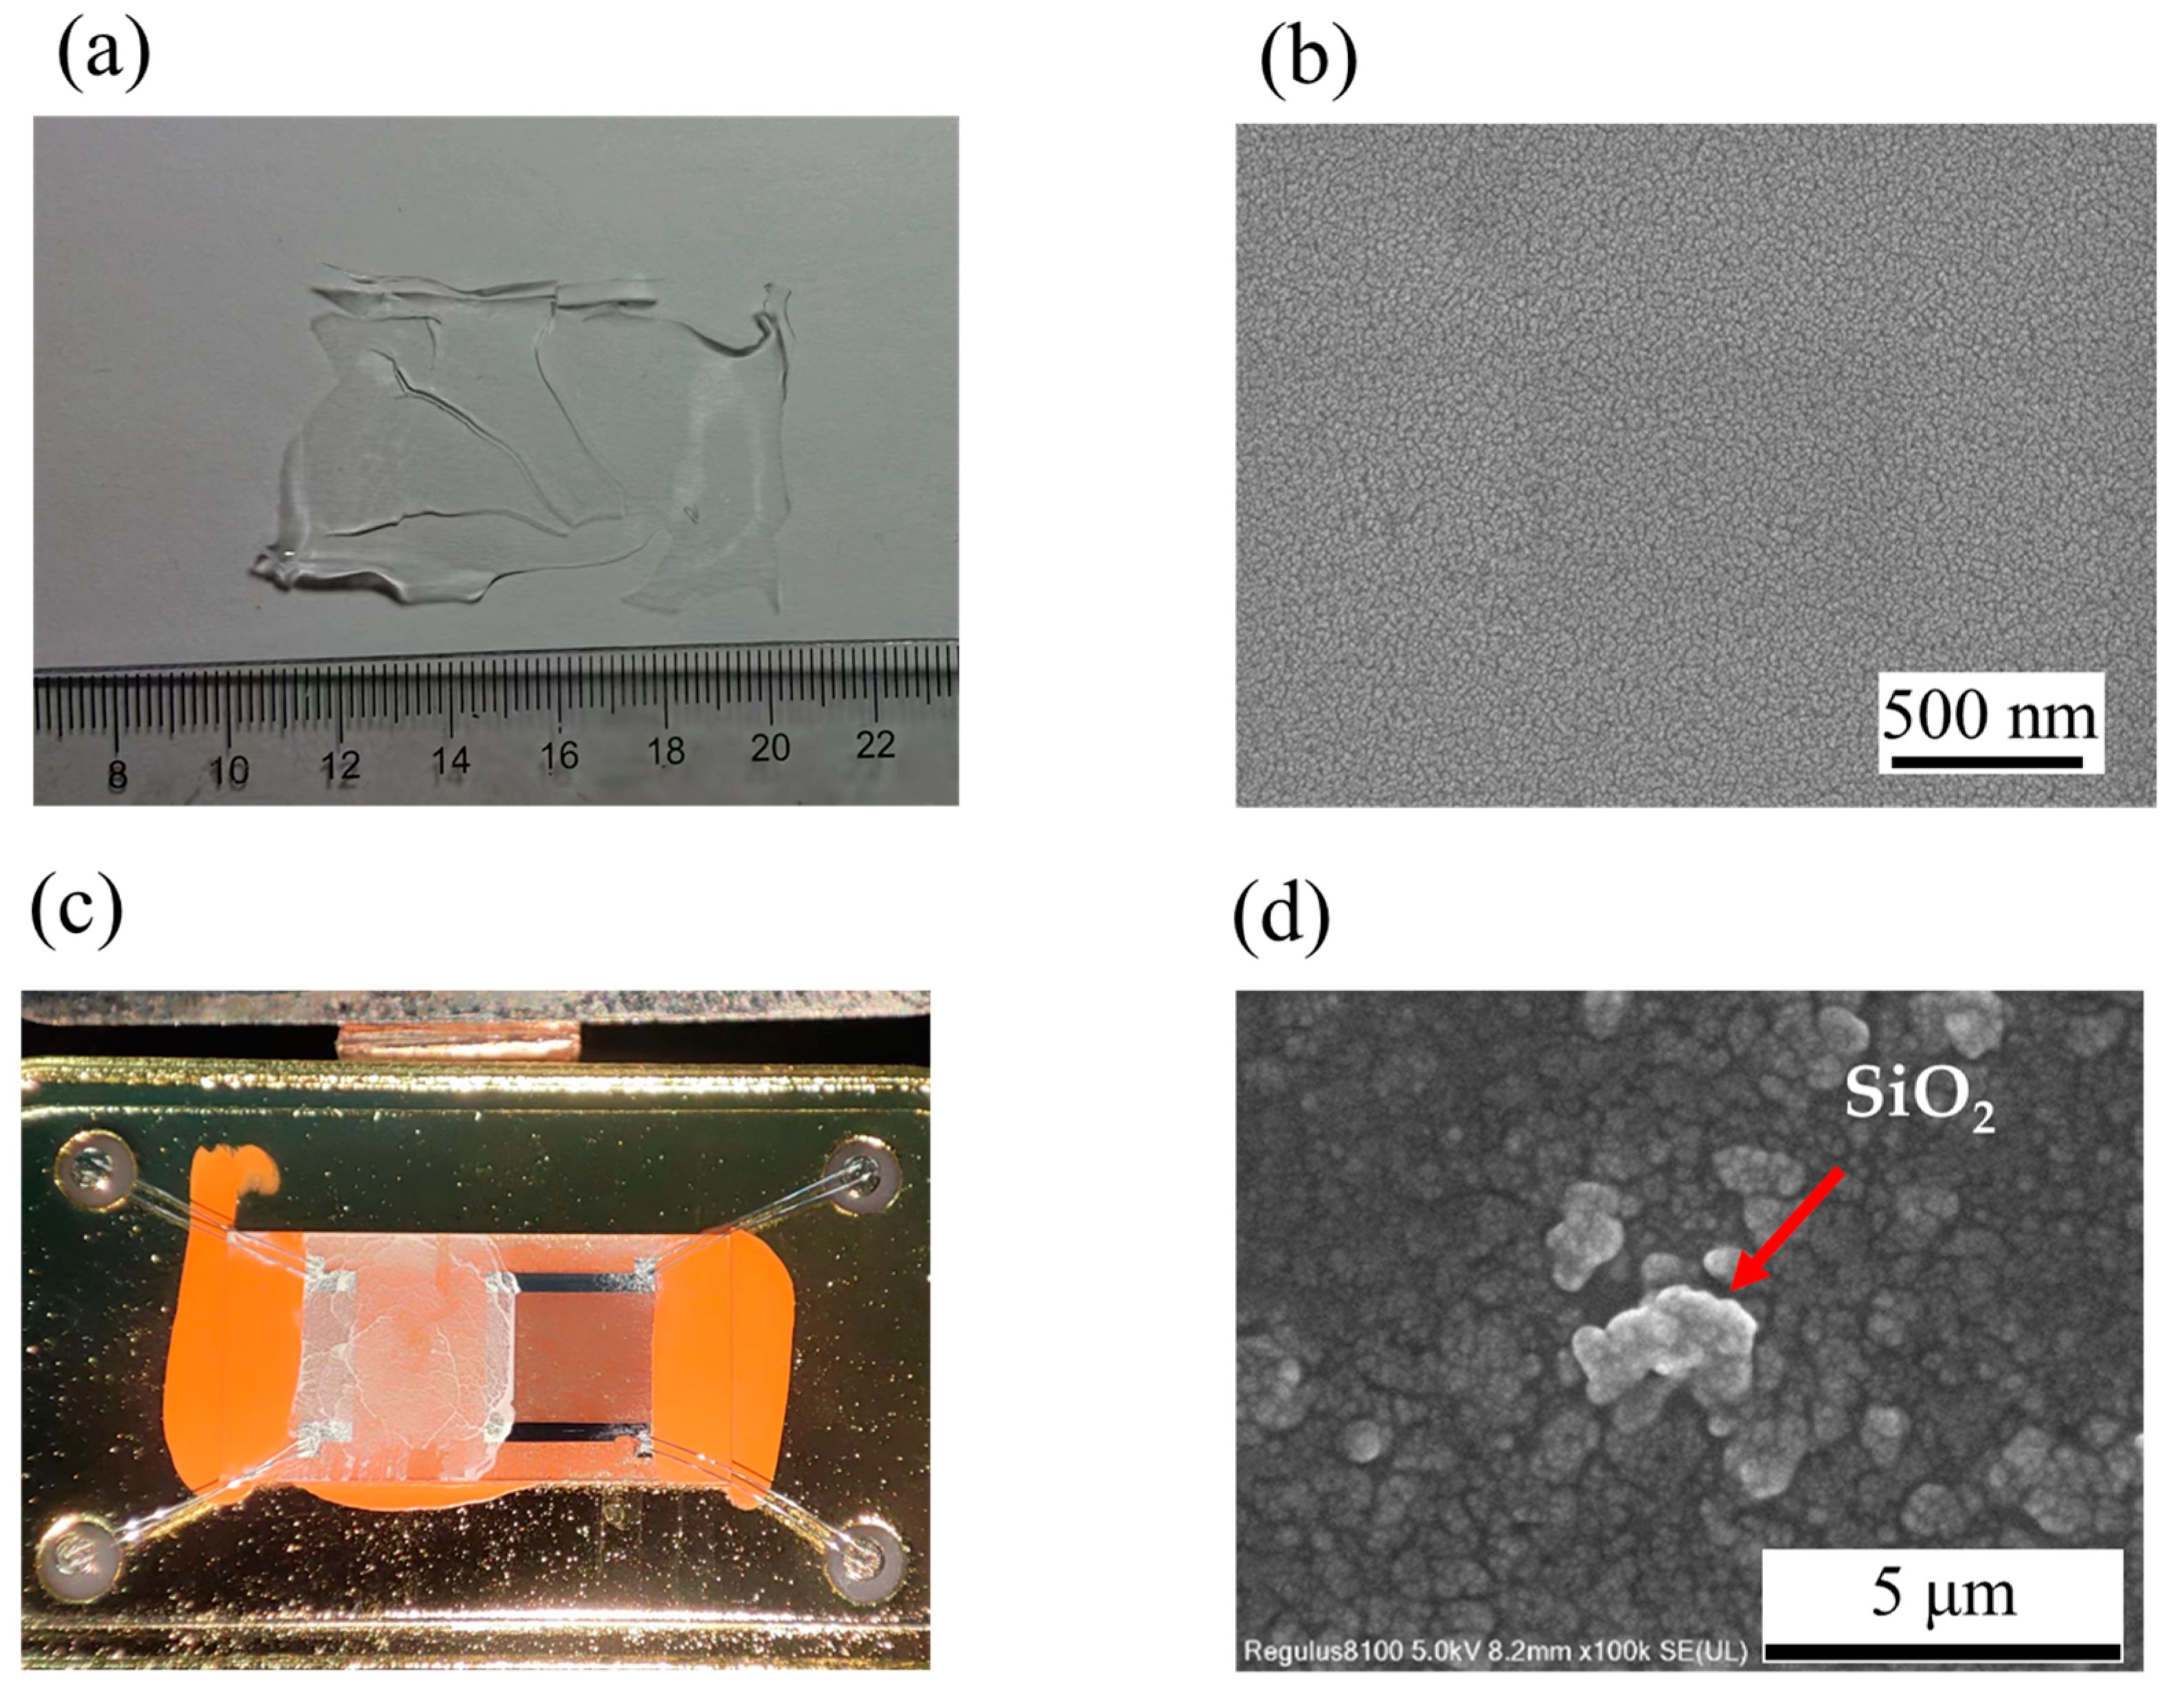
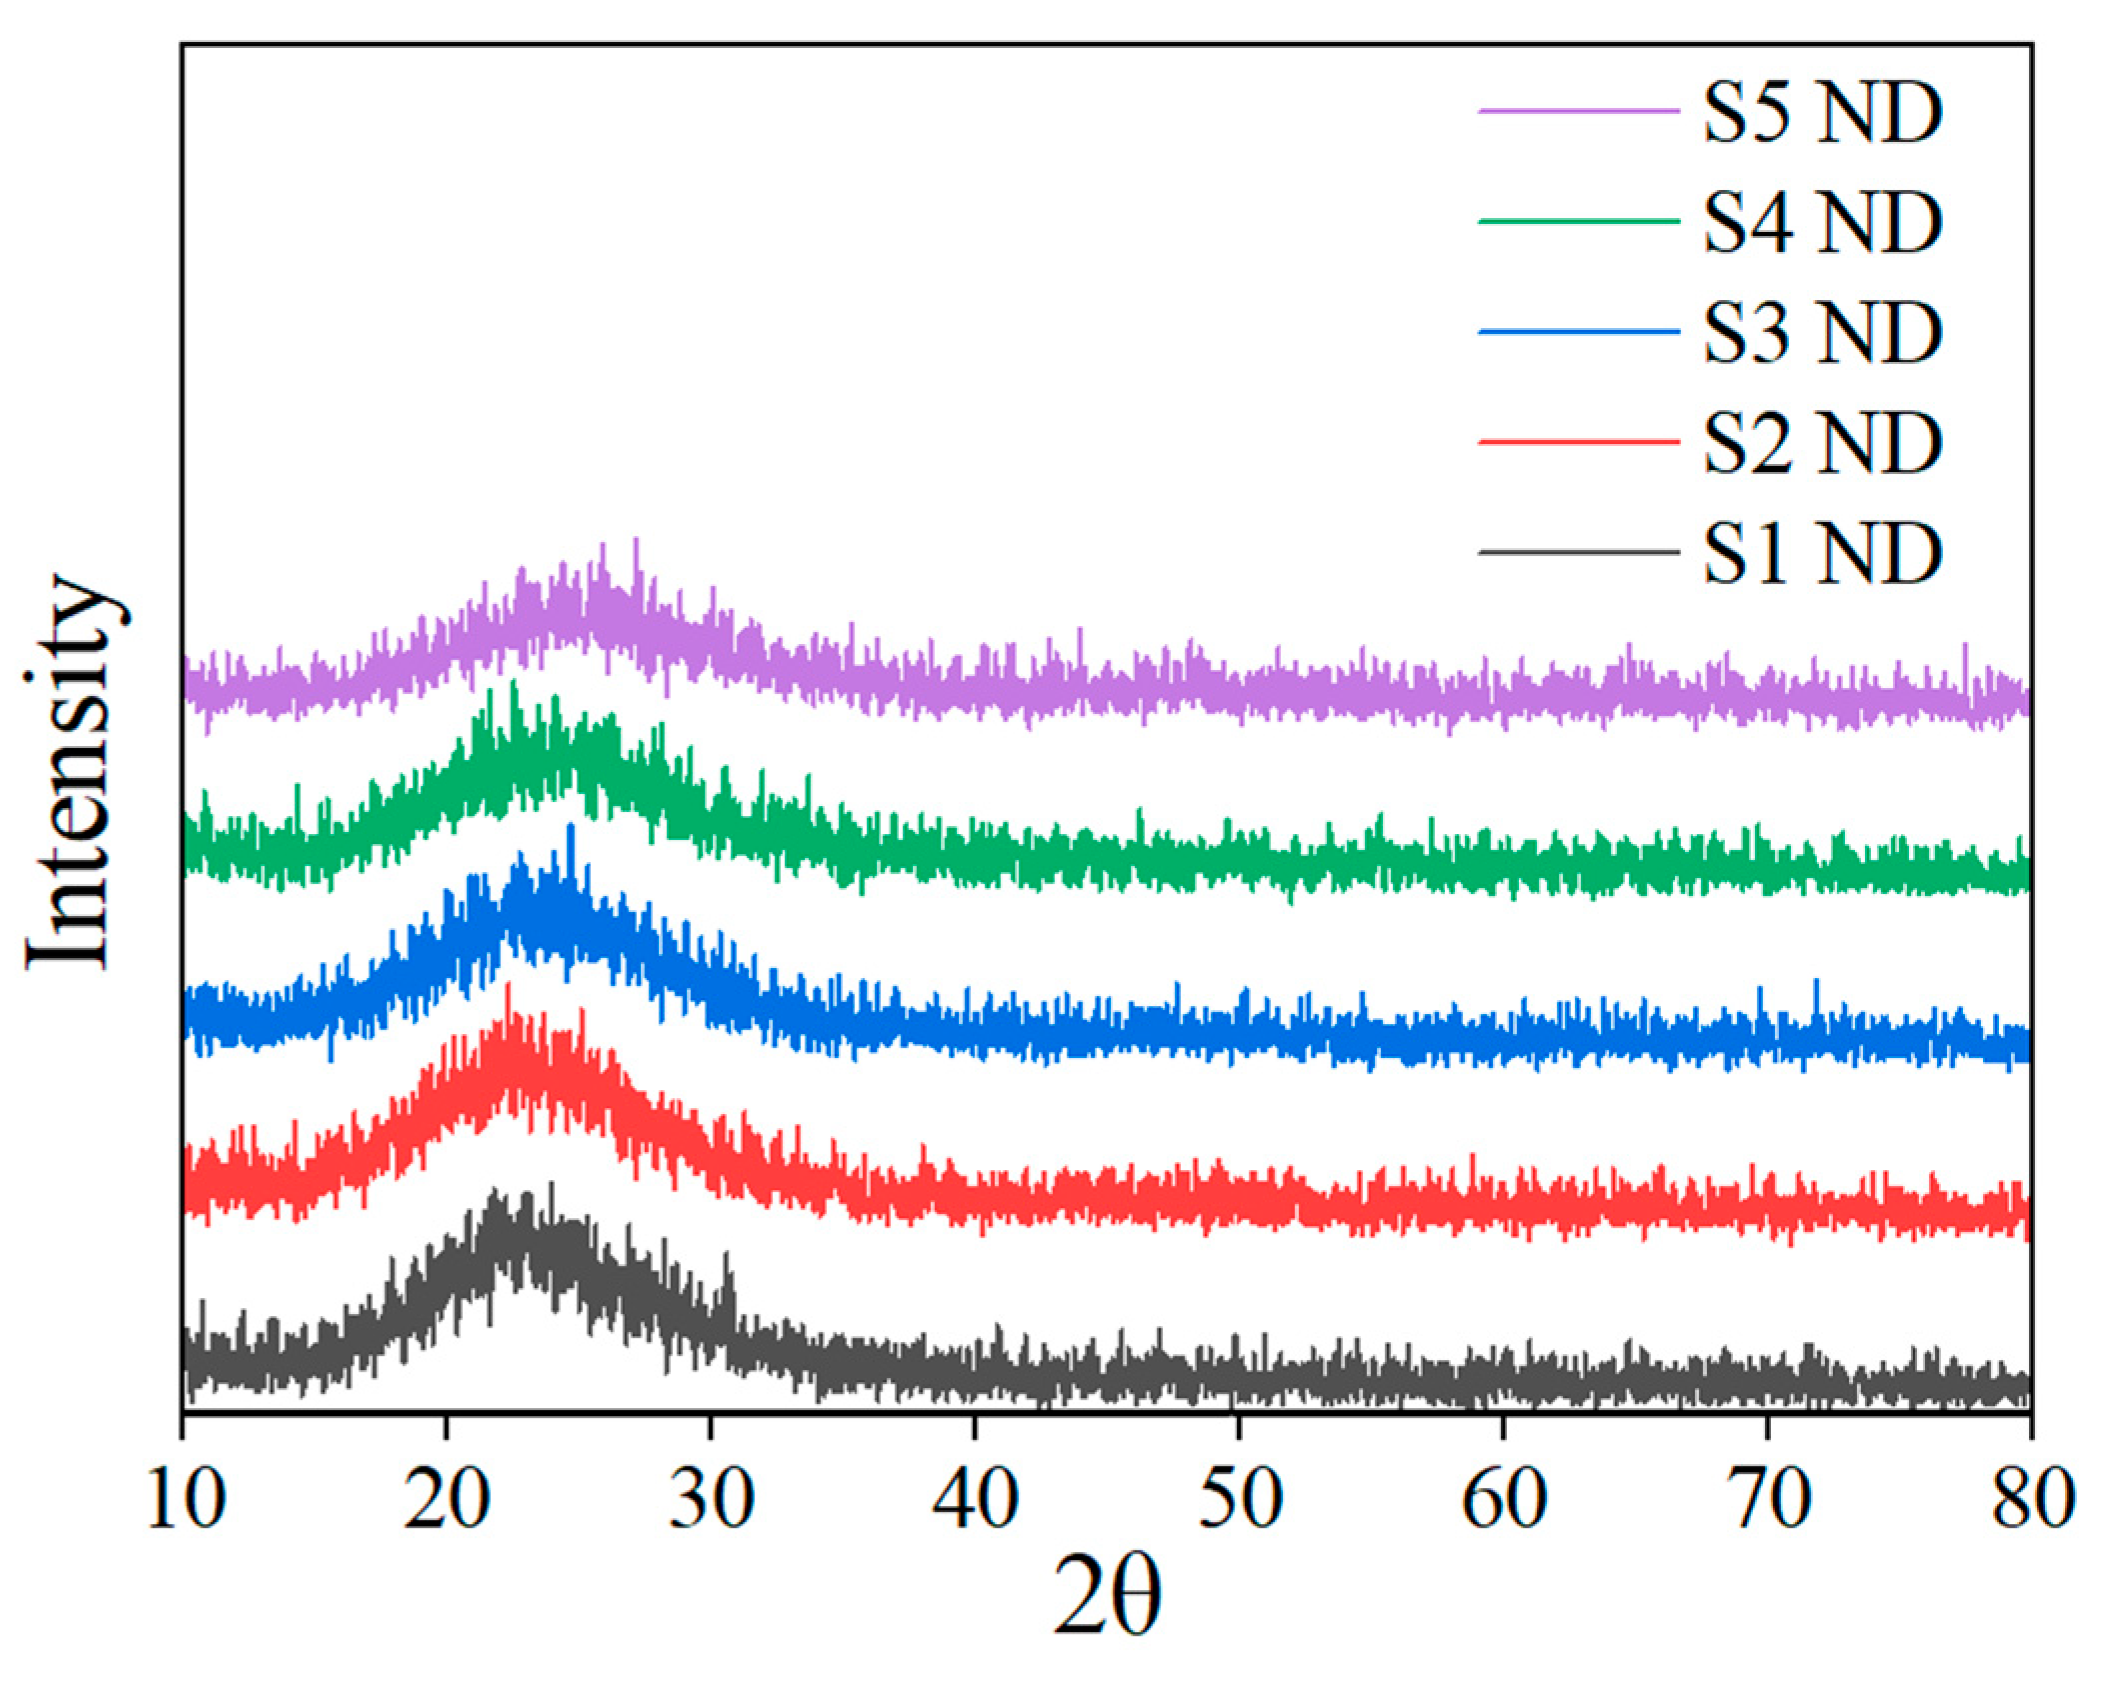
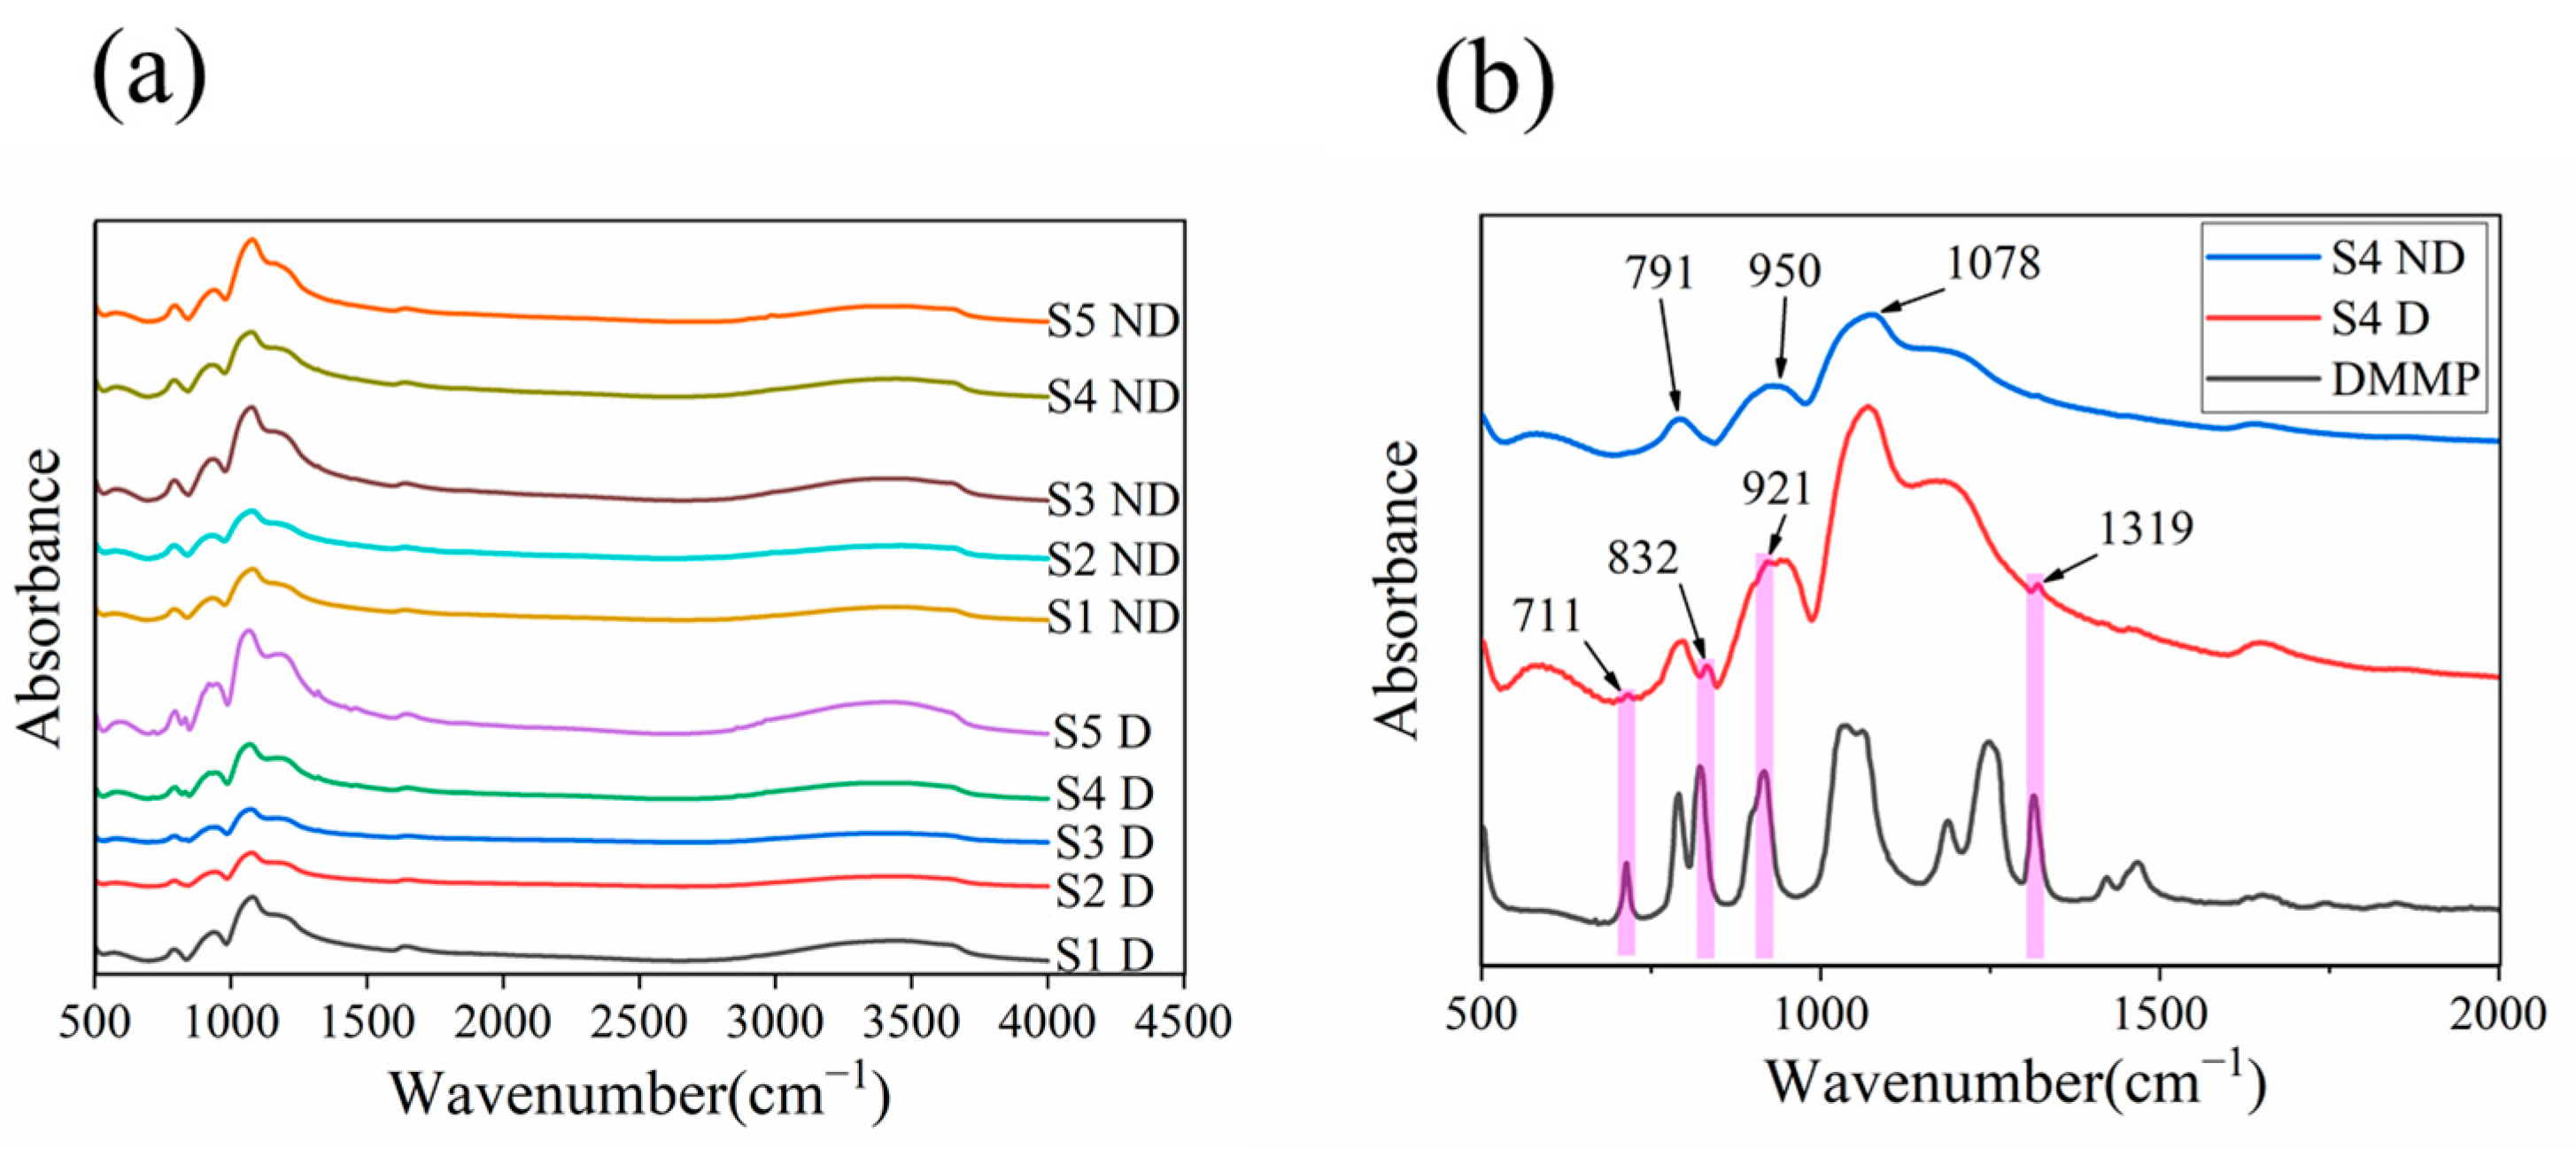
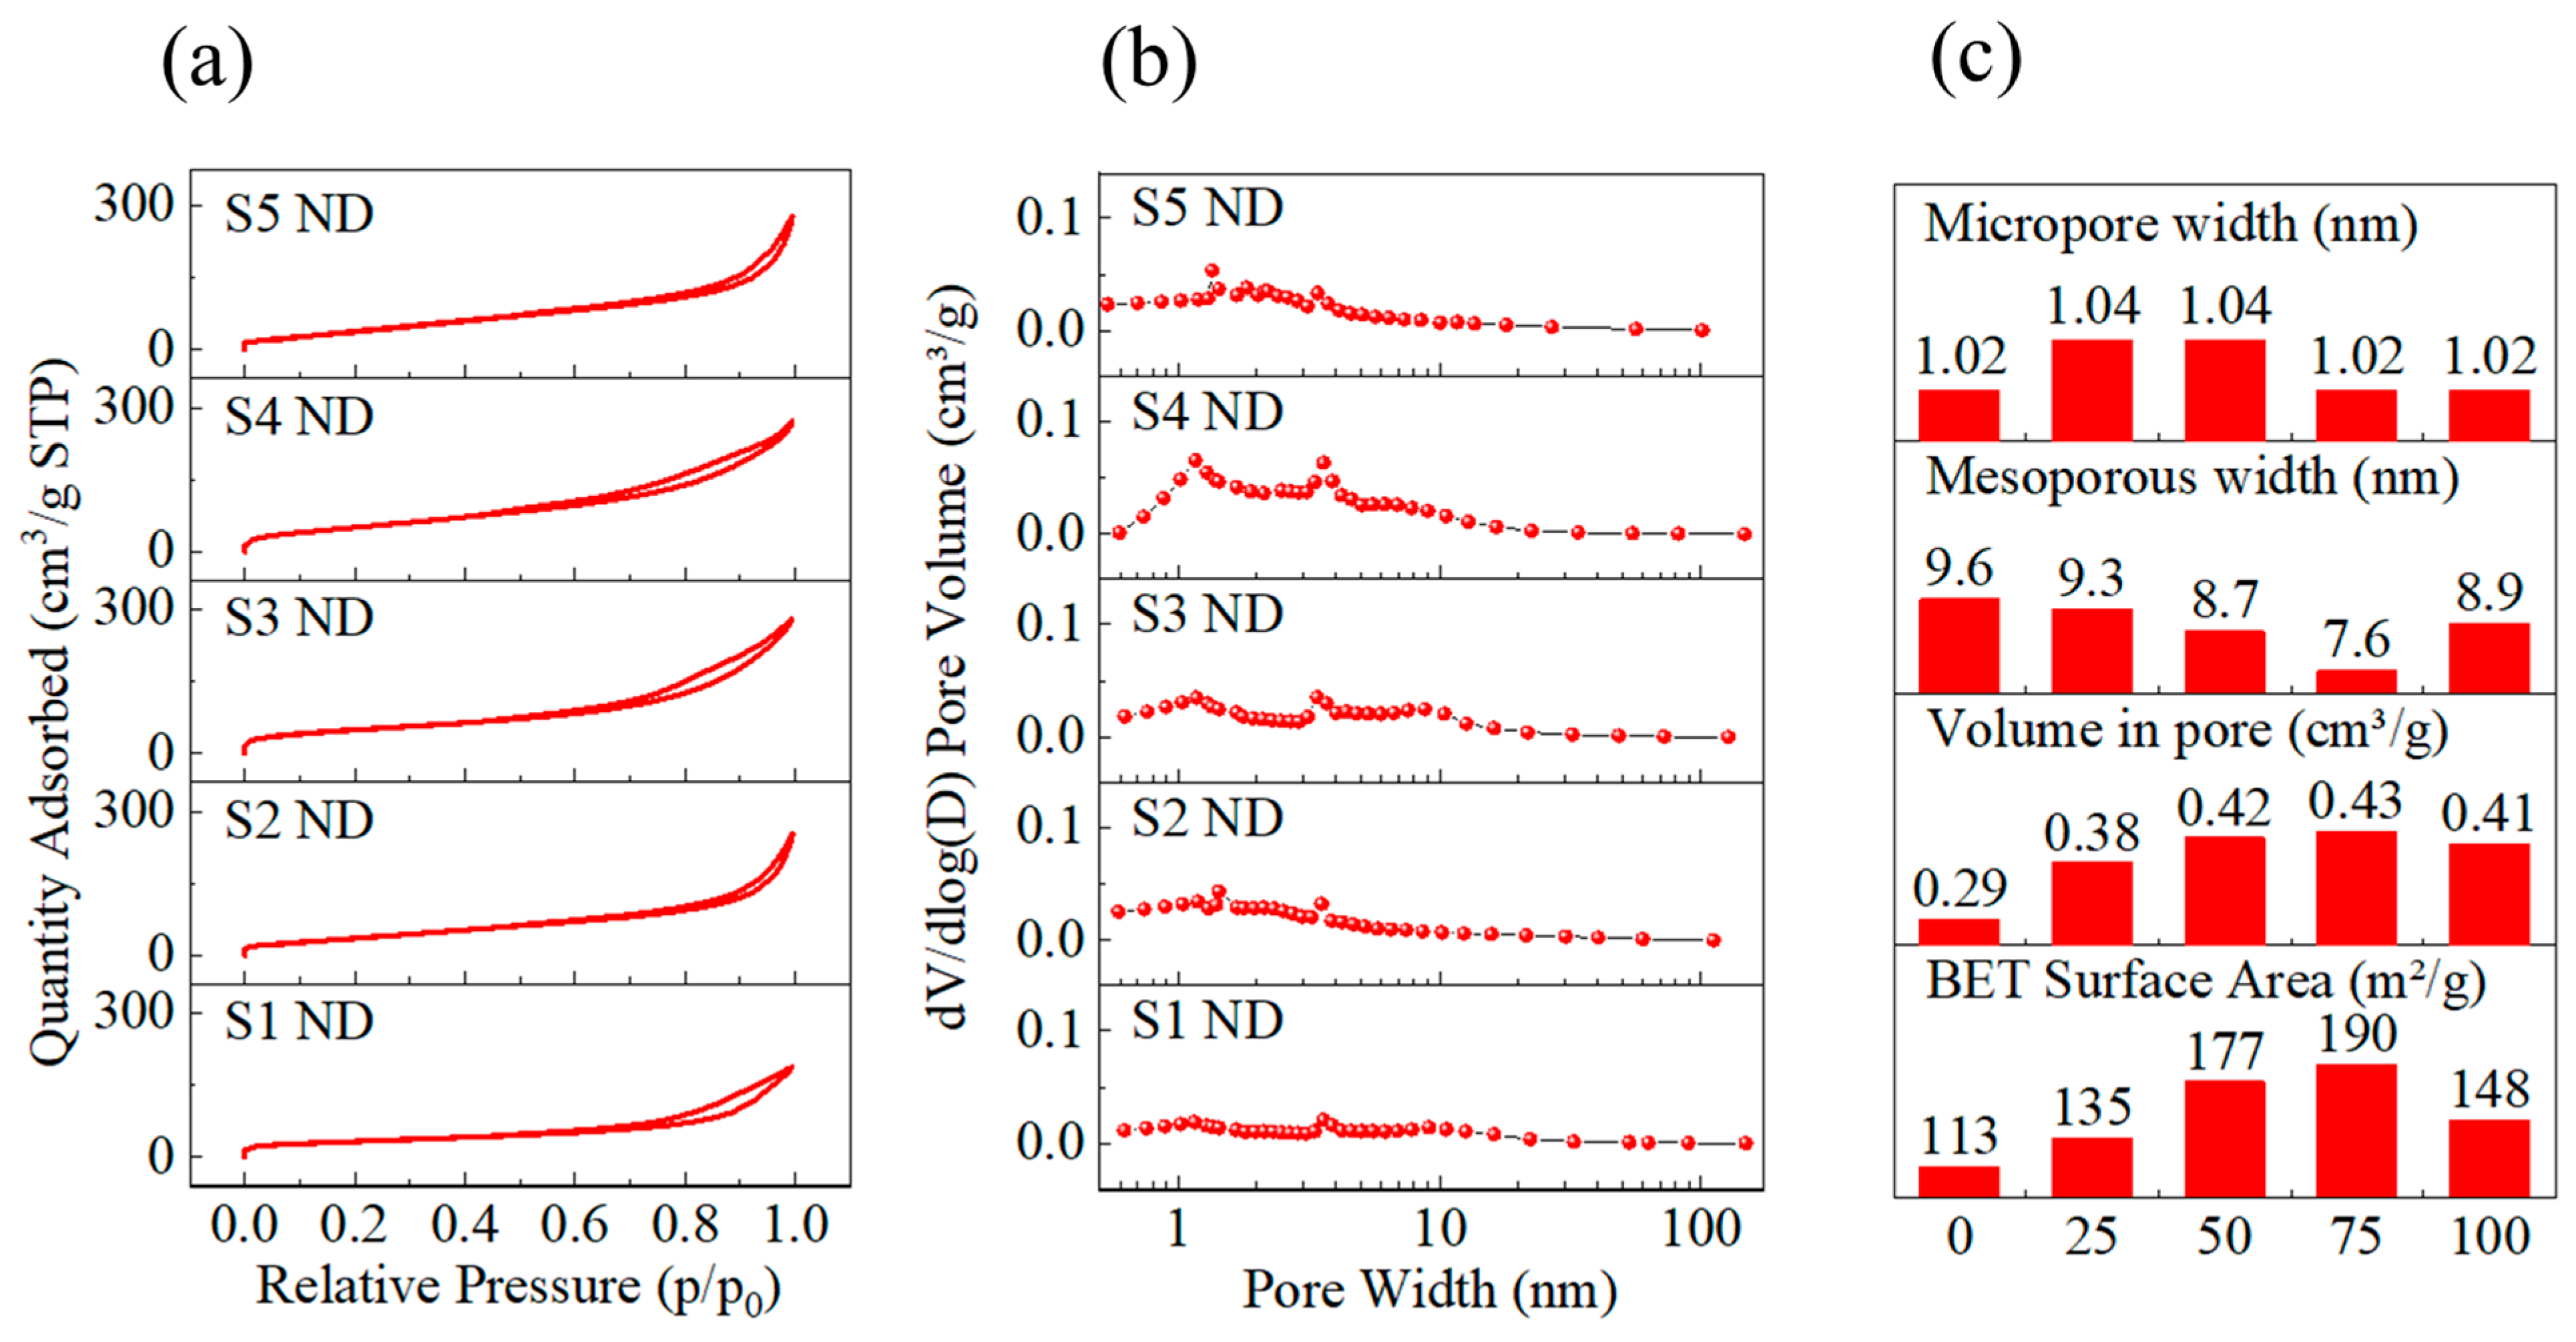
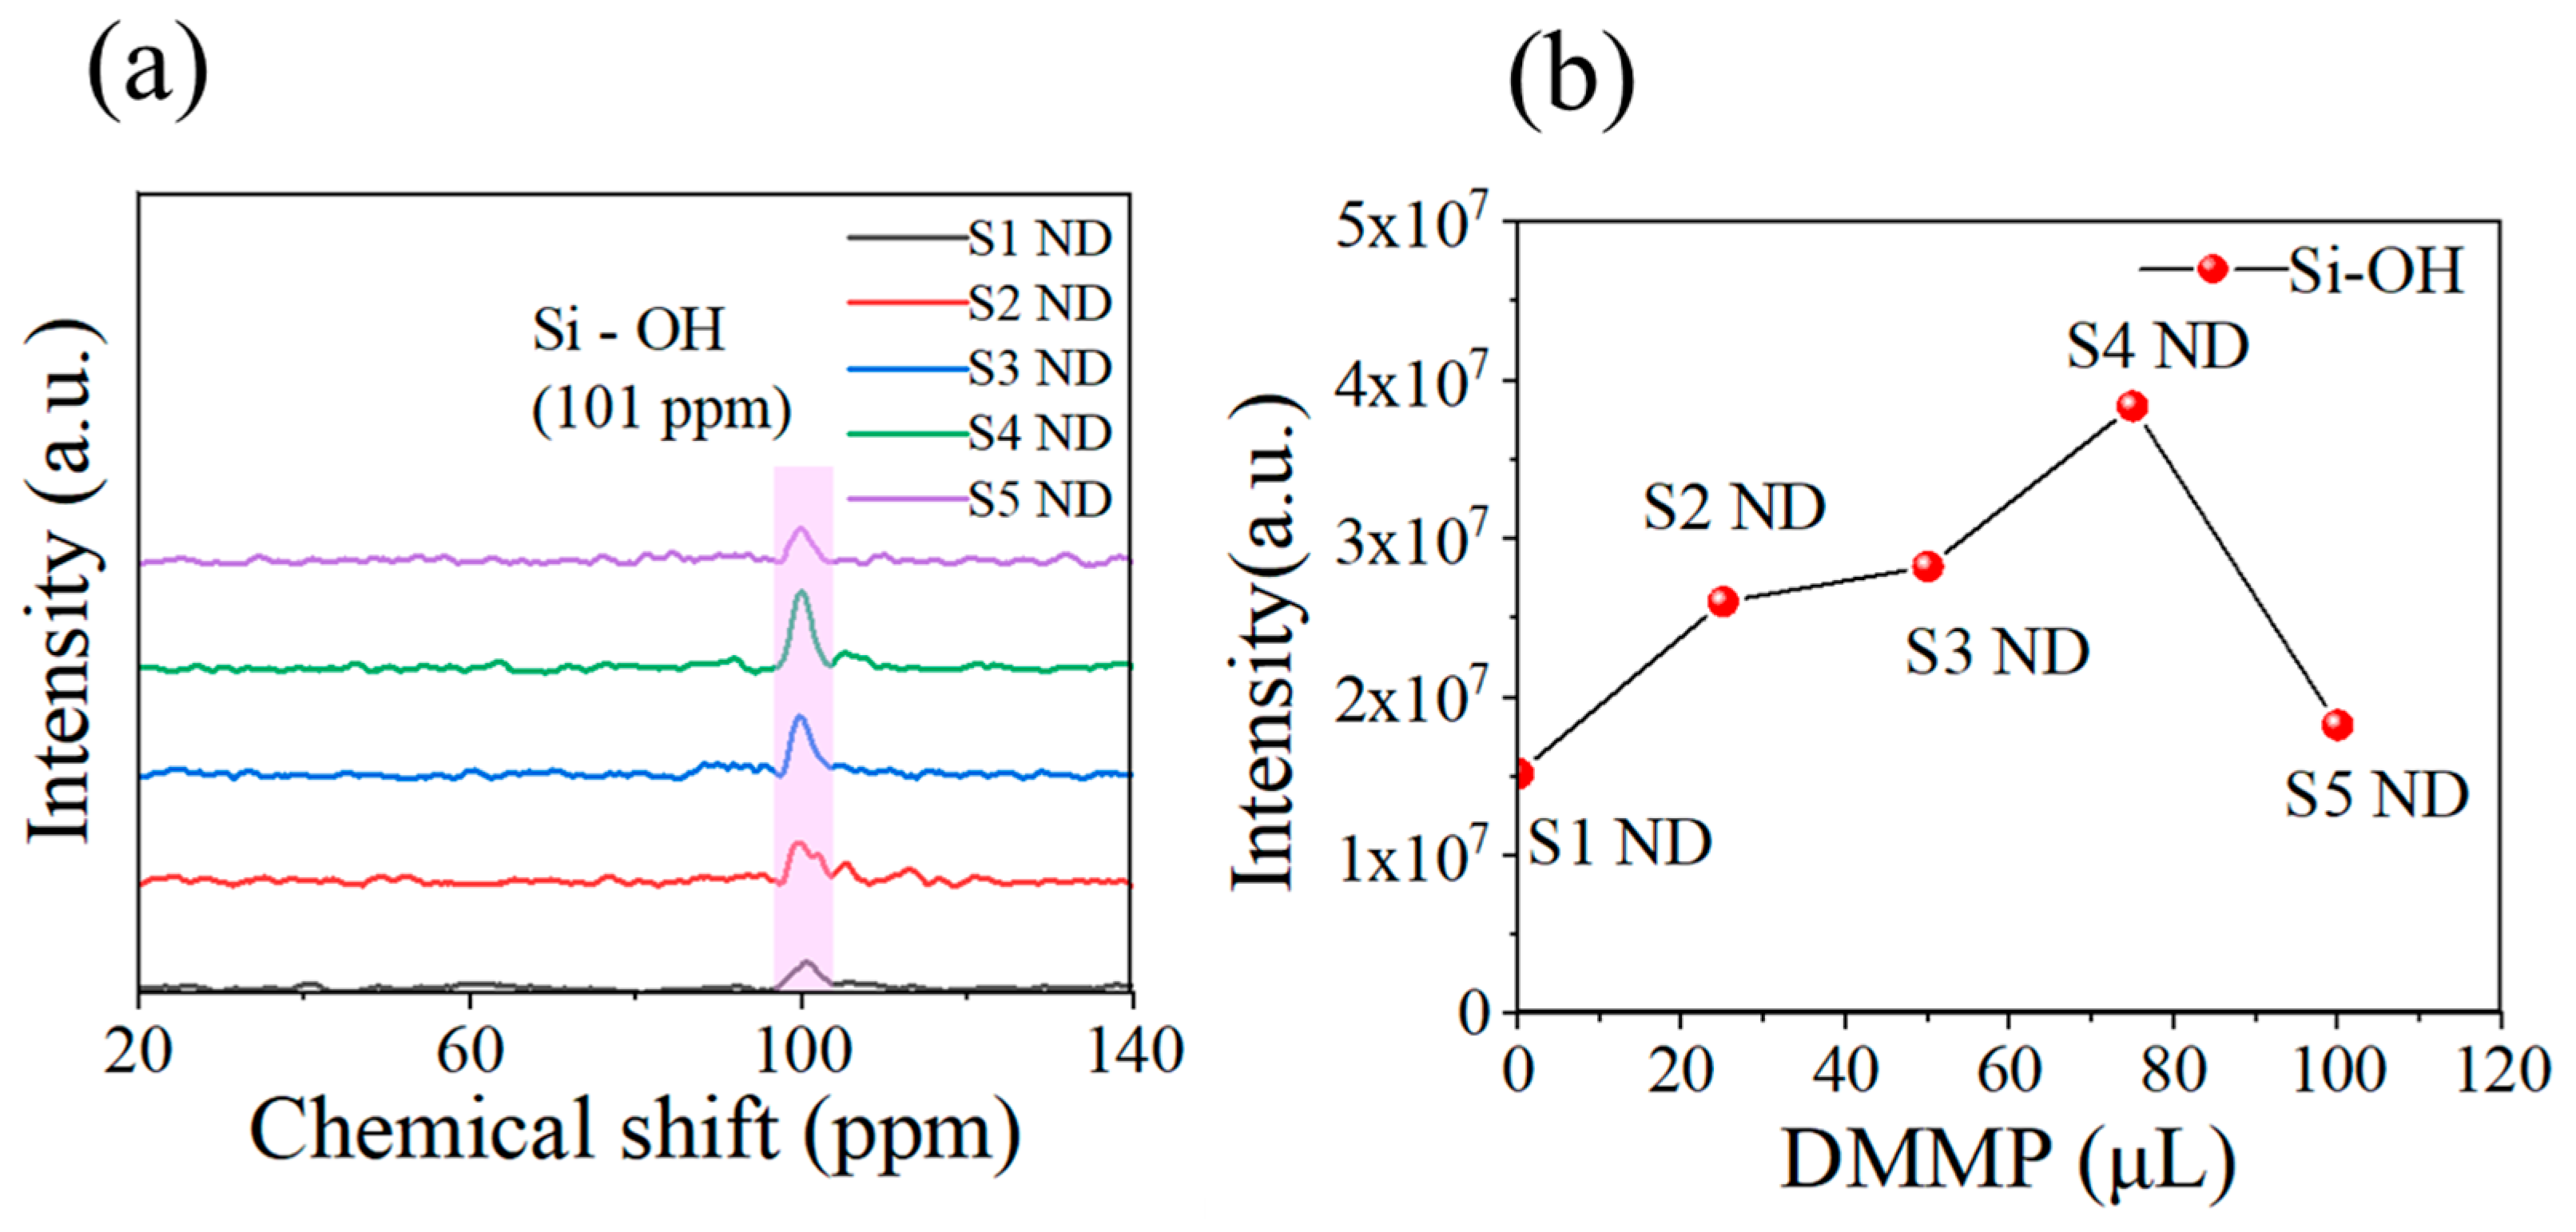
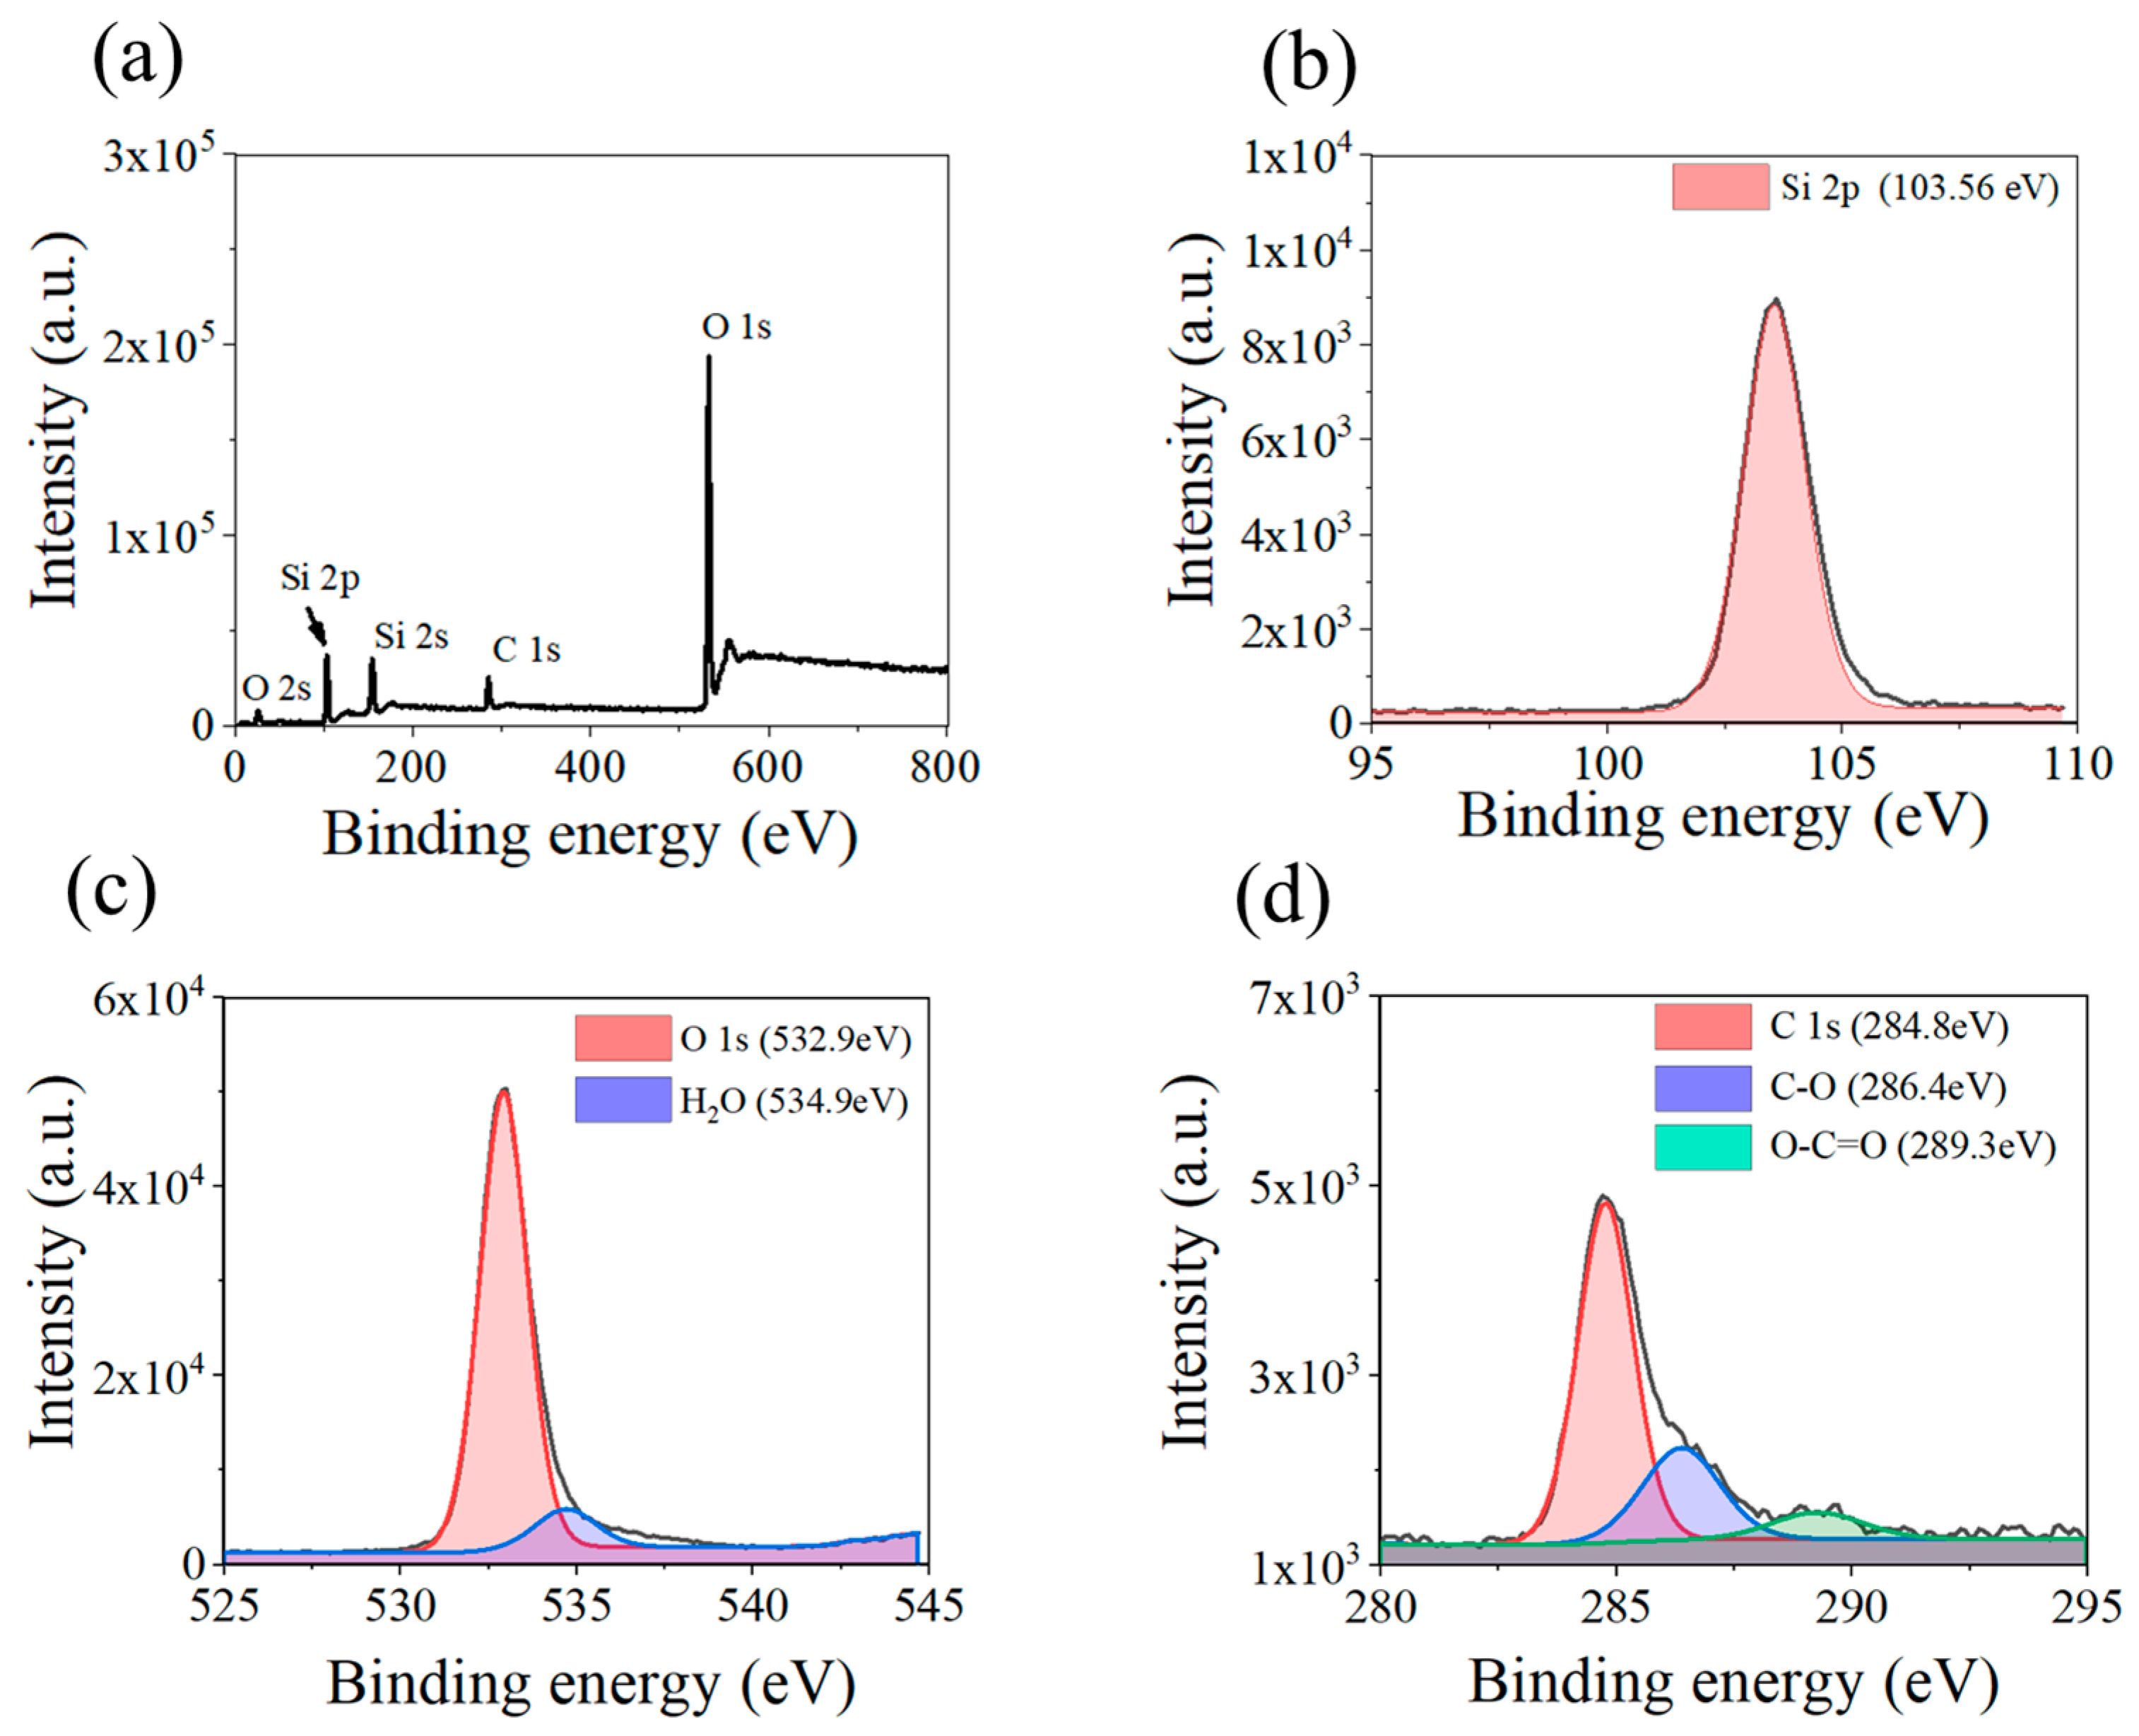
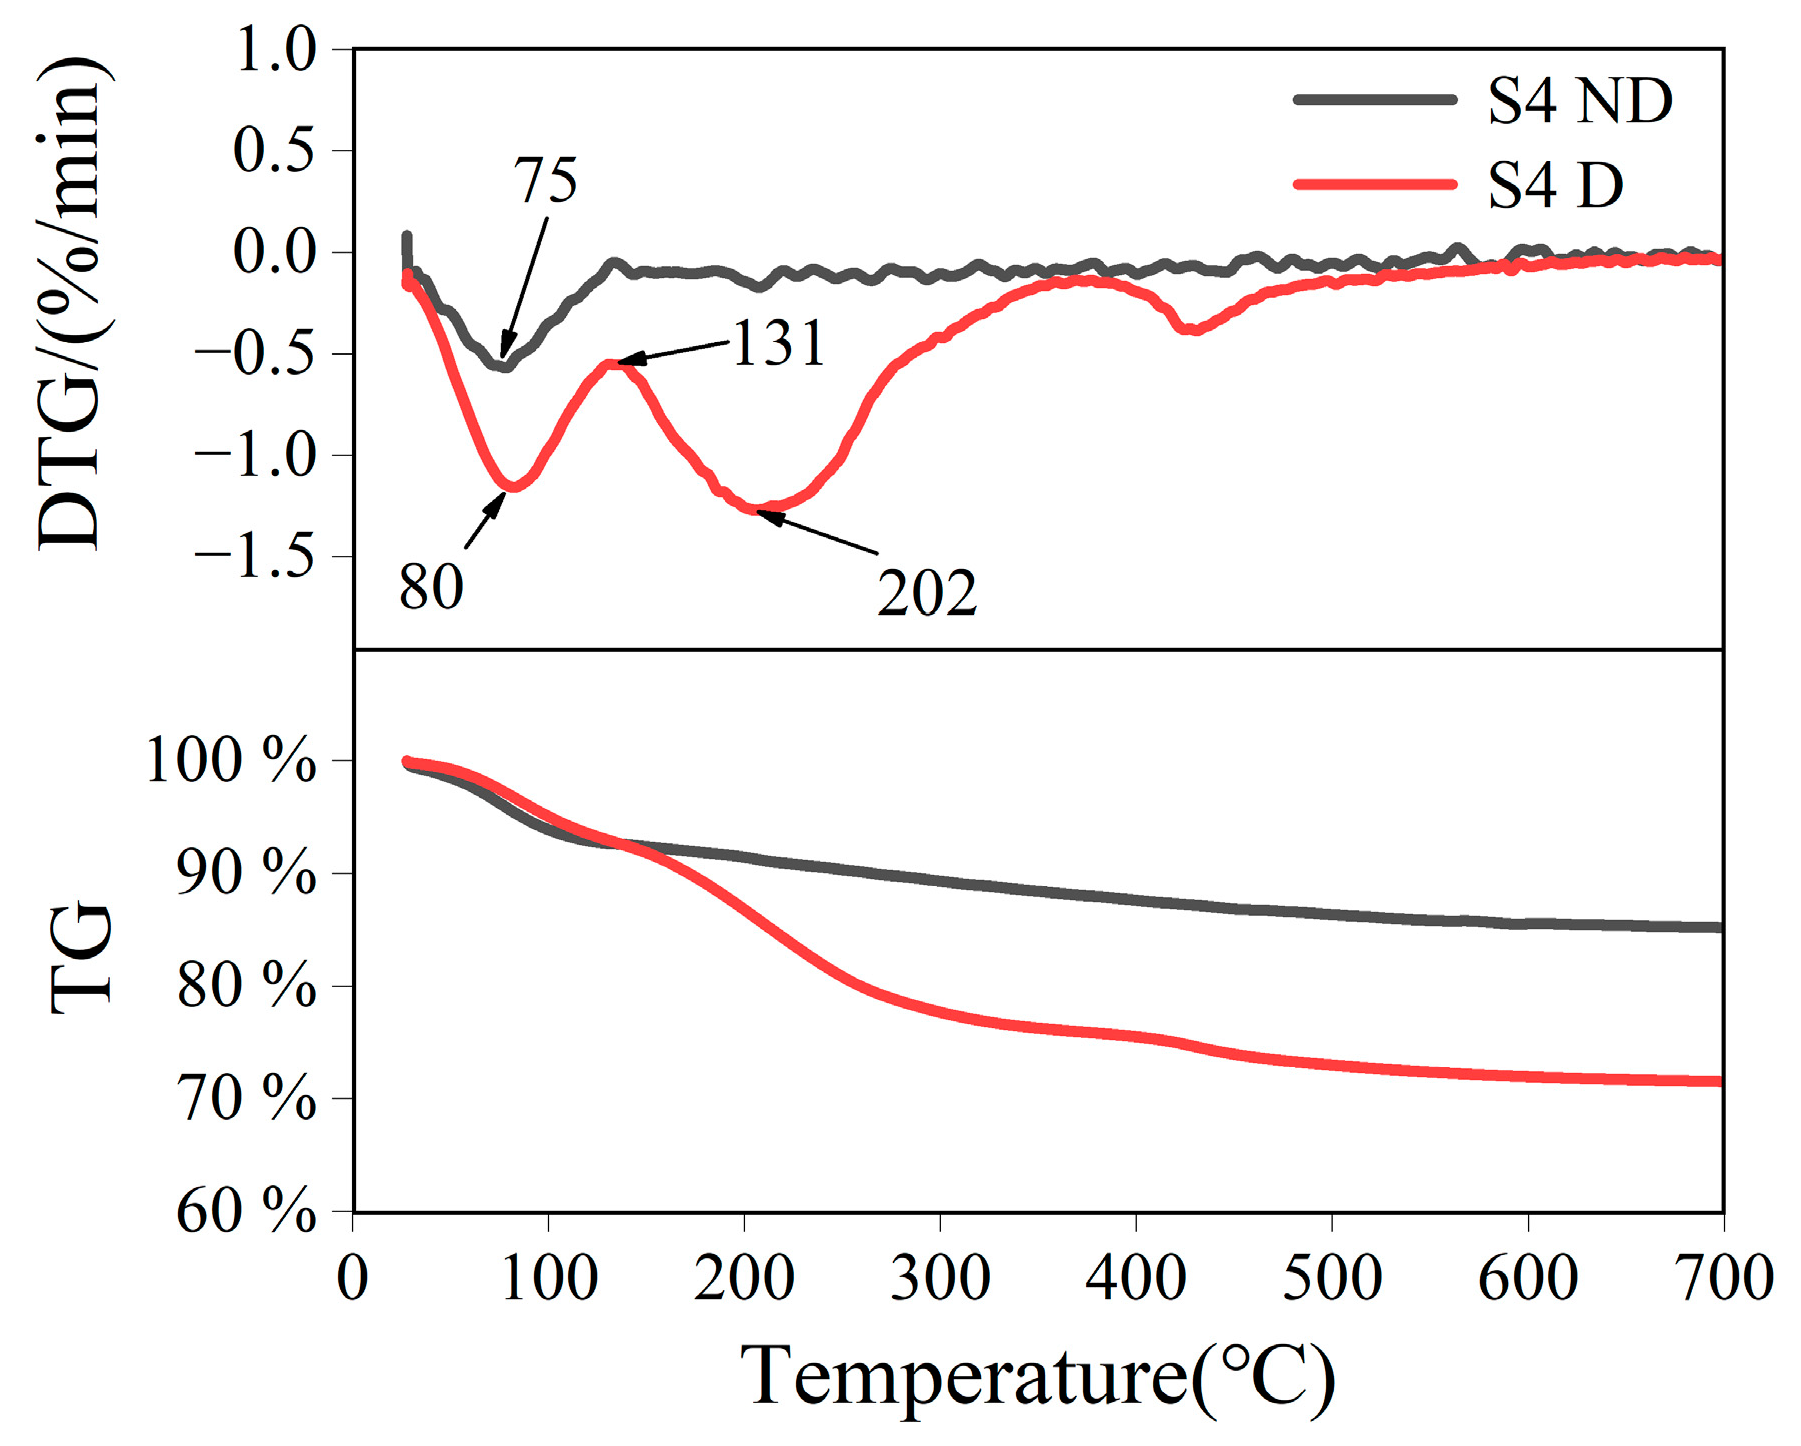
3.1. Characterization Results

The prepared lamellar SiO2 MIPs are shown in Figure 3a, while the SEM image of the SiO2 sheet is presented in Figure 3b. It can be confirmed that the prepared SiO2 MIPs are materials containing micropores, and the rough interface presented on the surface of the material can be observed by AFM, as shown in Figure S2. The optical image of SiO2 MIPs coated on the SAW gas sensor is shown in Figure 3c. The SEM images in Figure 3d indicate that the particle sizes of SiO2 MIPs range from 1 to 3 μm. The average thickness of the sensitive film was 0.8 μm with a standard deviation of 0.55 μm. Additional details are provided in Figure S3 in the Supporting Information.
XRD was employed to investigate the crystal structure of SiO2 powders prepared with five formulations. No significant diffraction peaks appear in the XRD results, indicating that the prepared SiO2 powder is amorphous [23], as shown in Figure 4. It should be noted that for material calculations, there is a significant difference between the models of amorphous SiO2 and crystalline SiO2. For crystalline SiO2, the supercell model can be used for calculation. For amorphous SiO2 materials, a specific model needs to be established. In the follow-up study, an amorphous model of SiO2 was established.
The infrared absorption spectra of SiO2 powders are presented in Figure 5a. Notably, distinct absorption peaks attributed to DMMP can be observed in S4 D and S5 D. In Figure 5b, the fine absorption spectra of S4 ND, S4 D, and liquid DMMP are depicted. The presence of characteristic peaks at 791 cm−1, 950 cm−1, and 1078 cm−1 in S4 ND indicates the SiO2 material. Specifically, the peak at 950 cm−1 corresponds to the Si–OH functional group present in abundance within the prepared SiO2 material [24,25]. On the other hand, the peaks observed at 711 cm−1, 832 cm−1, 921 cm−1, and 1319 cm−1 in S4 D correspond to specific characteristic peaks associated with DMMP. The successful immobilization of DMMP during the preparation of SiO2 MIPs is demonstrated by the infrared absorption spectra. In order to confirm the fixation of template molecules in SiO2, besides infrared absorption spectra, Raman spectra and the method of replacing template molecules were used to study this process. The results of these experiments are summarized in the Supporting Information. SiO2 MIPs were prepared using Rhodamine 6G (R6G) as a template, and the material was placed in water, and the red color gradually faded. This strongly proves that the SiO2 MIP is a porous material, and R6G could be diffused from the inside of the material. Figure S4 shows this process. Figure S5 shows the Raman spectrum results of SiO2 MIPs. Figure S6 shows the fine infrared spectra of 5 samples without elution of DMMP.
To investigate the pore and surface hydroxyl properties of SiO2, the specific surface area, pore width, and surface hydroxyl groups of SiO2 were examined using BET analysis and solid-state NMR. The absorption-desorption isotherm of the SiO2 MIPs is presented in Figure 6a, while all 5 samples showed IVa-type isotherms, which confirmed the existence of a large number of mesoporous in the material. Figure 6b illustrates the distribution of pore width in SiO2 MIPs. With the increase in DMMP content in the recipe, the pore volume within 10 nm increased significantly. However, when 100 µL DMMP was added, the pore volume decreased. The pore properties are summarized in Figure 6c. The specific surface area of the SiO2 MIPs increased with increasing DMMP in the recipe, from 113 m2/g (S1 ND, DMMP 0 µL) to 190 m2/g (S4 ND, DMMP 75 µL) and then decreased to 148 m2/g (S5 ND, DMMP 100 µL). The pore volume of SiO2 MIPs increases from 0.29 cm3/g (S1) to 0.43 cm3/g (S4 ND) and then drops to 0.41 cm3/g (S5 ND) with an increase in DMMP. The average mesoporous width of the material changed from 9.6 nm (S1 ND) to 7.6 nm (S4 ND) and subsequently increased to 8.9 nm (S5 ND), showing that the quantity of mesoporous pores grew as DMMP increased. The five samples had micropore widths of 1.02 nm to 1.04 nm. The addition of DMMP had no effect on the micropore width of the sample but significantly increased the mesopore volume and specific surface area of the material.
The solid-state 29Si NMR spectra of five samples are depicted in Figure 7a. In the NMR spectrum, a peak appears at 101 ppm, which confirms the presence of the Si–OH structure [26]. Each sample used for testing solid-state NMR has a mass of 40 mg. The higher the number of hydroxyl groups in the sample, the higher the corresponding peak intensity. The relationship between peak intensity and DMMP content in the recipe is shown in Figure 7b. With the increase in DMMP, the number of hydroxyl groups in SiO2 first increased and then decreased, reaching a maximum value of 75 µL.
The elemental composition of the S4 ND samples was examined using XPS, as shown in Figure 8. These findings indicate that the major components of the SiO2 samples are silicon, oxygen, and trace amounts of carbon. The high-resolution O spectrum showed that SiO2 adsorbed a certain amount of water. In Figure 8d, XPS shows that carbon exists mainly as C–O and O–C=O [27]. In both functional groups, the O atom is negatively charged and easily interacts with the hydroxyl group in SiO2. It can be considered that the carbon is derived from the organic residue in the preparation process.
The thermogravimetric (TG) curves of SiO2 MIPs are presented in Figure 9. For the S4 D sample, the decreasing mass from room temperature to 131 °C can be attributed to the evaporation of adsorbed water. With the further increase in temperature, obvious mass loss occurs at 202 °C. This is attributed to the volatilization of DMMP inside the material. The mass loss at 400 °C may be related to the high boiling compound adsorbed by the material. In contrast, no significant mass loss due to DMMP volatilization was observed in S4 ND samples. When the temperature is raised from room temperature to 131 °C, the mass loss of the S4 ND sample is 8%, which can be attributed to the evaporation of adsorbed water inside the material. As the temperature increases, the hydroxyl interaction on SiO2 is converted into water, resulting in a gradual decline in the total mass from 92% to 85%.

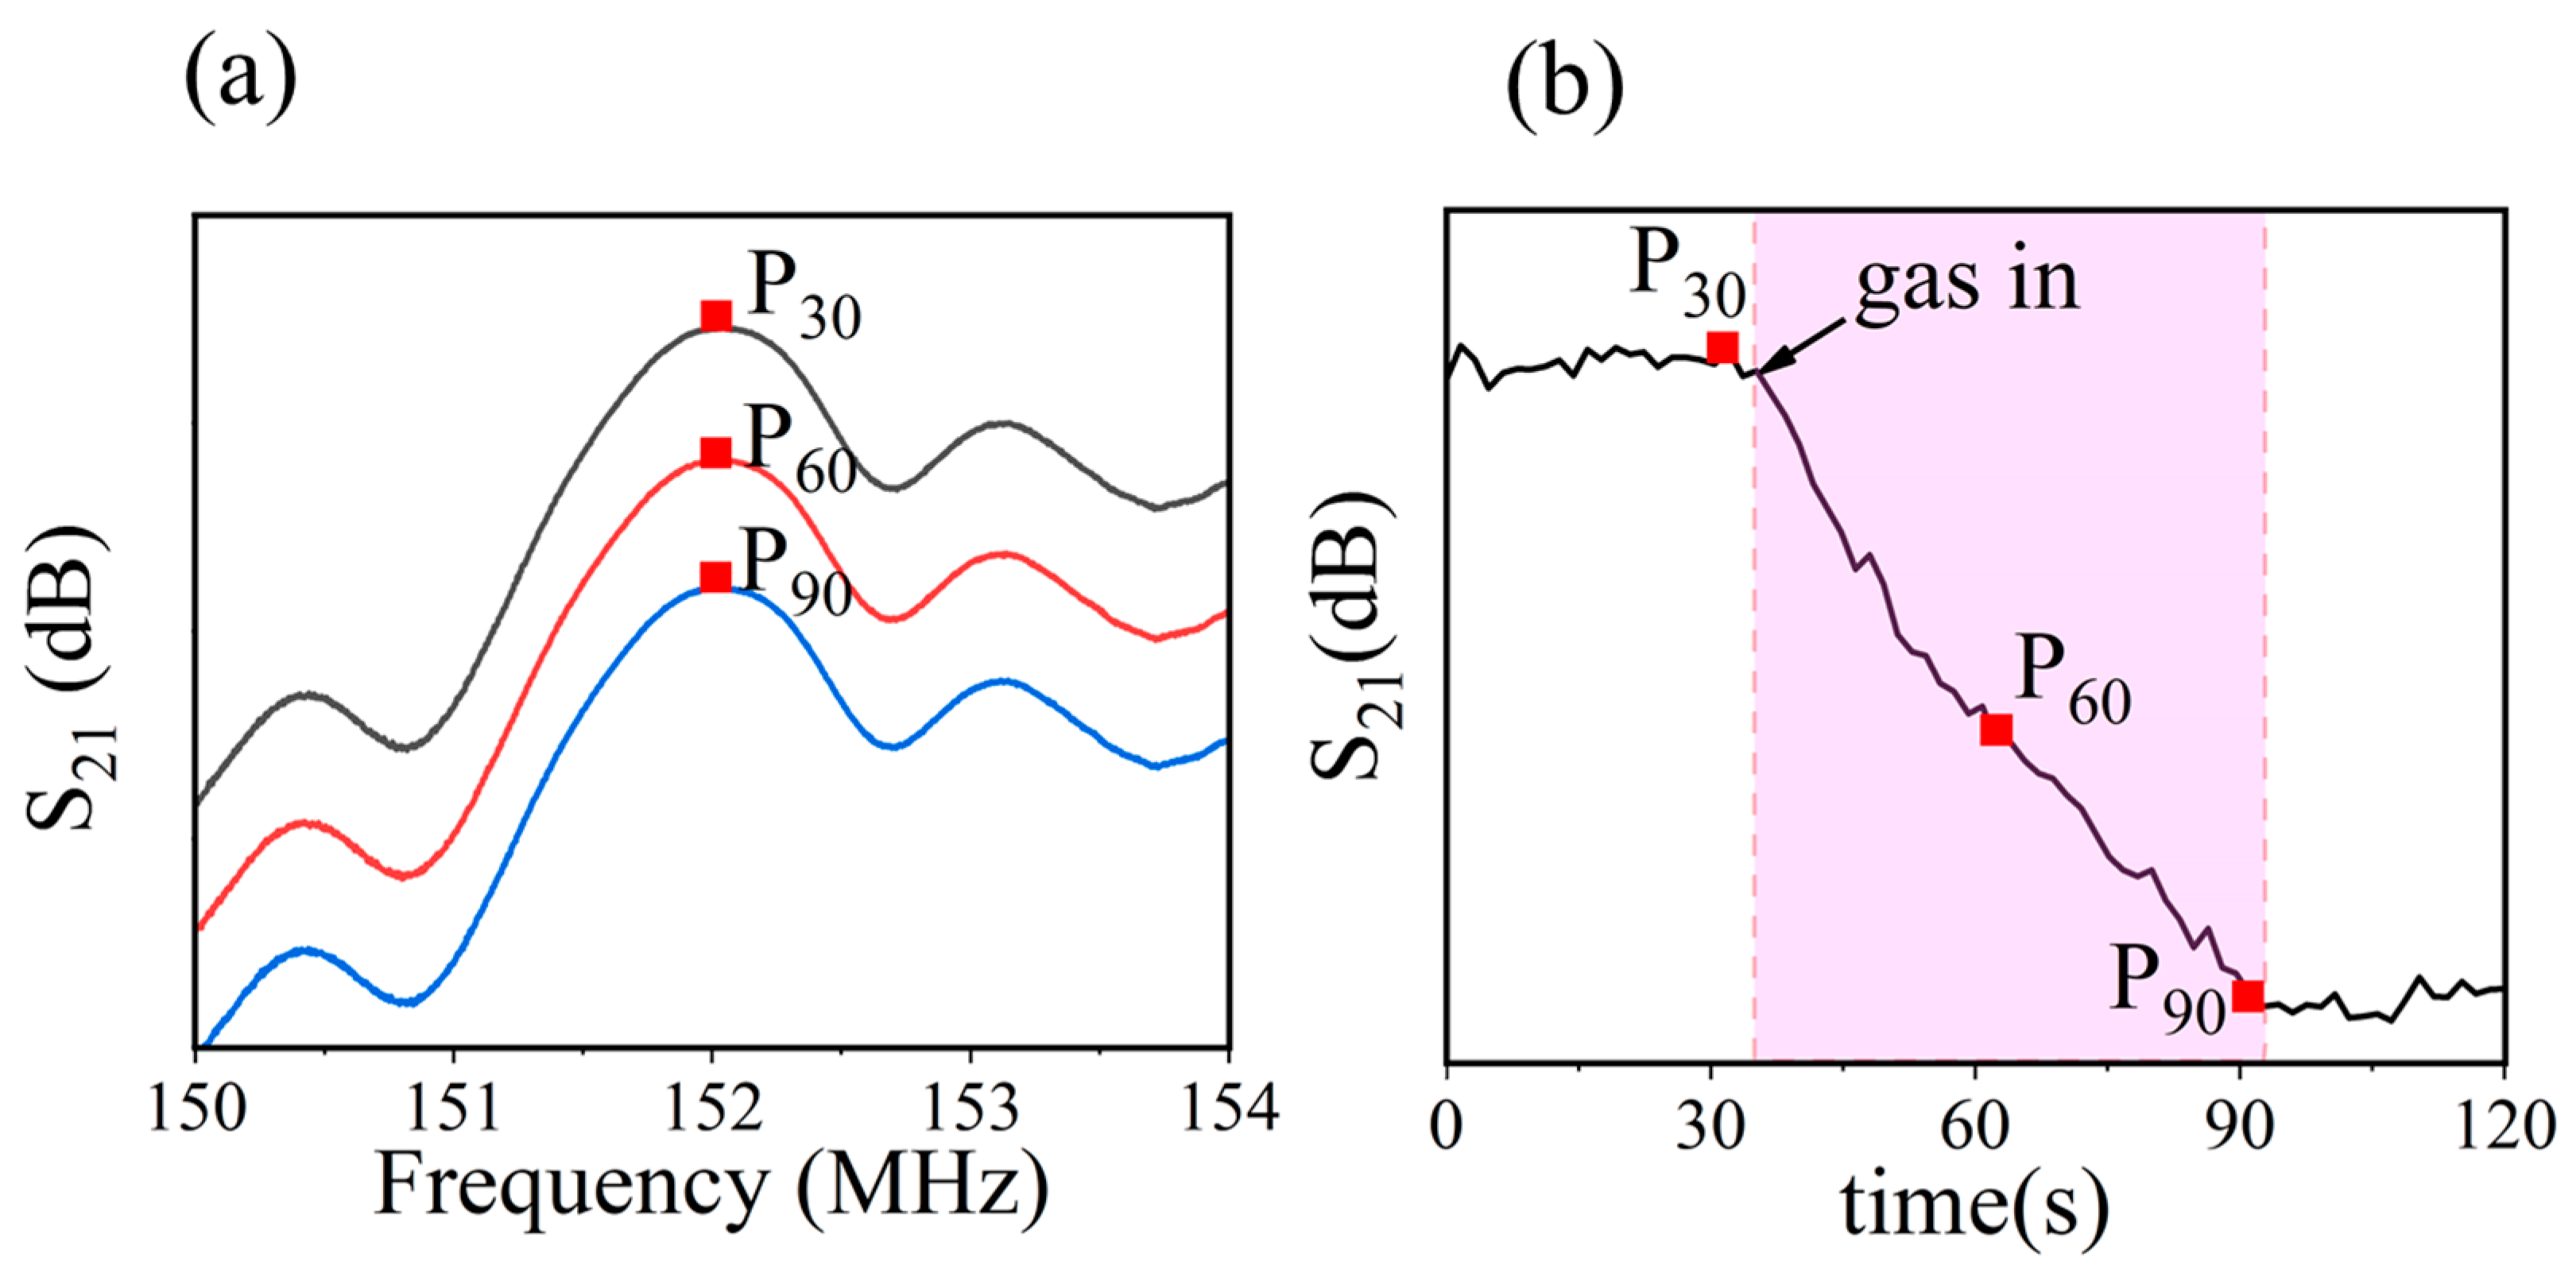
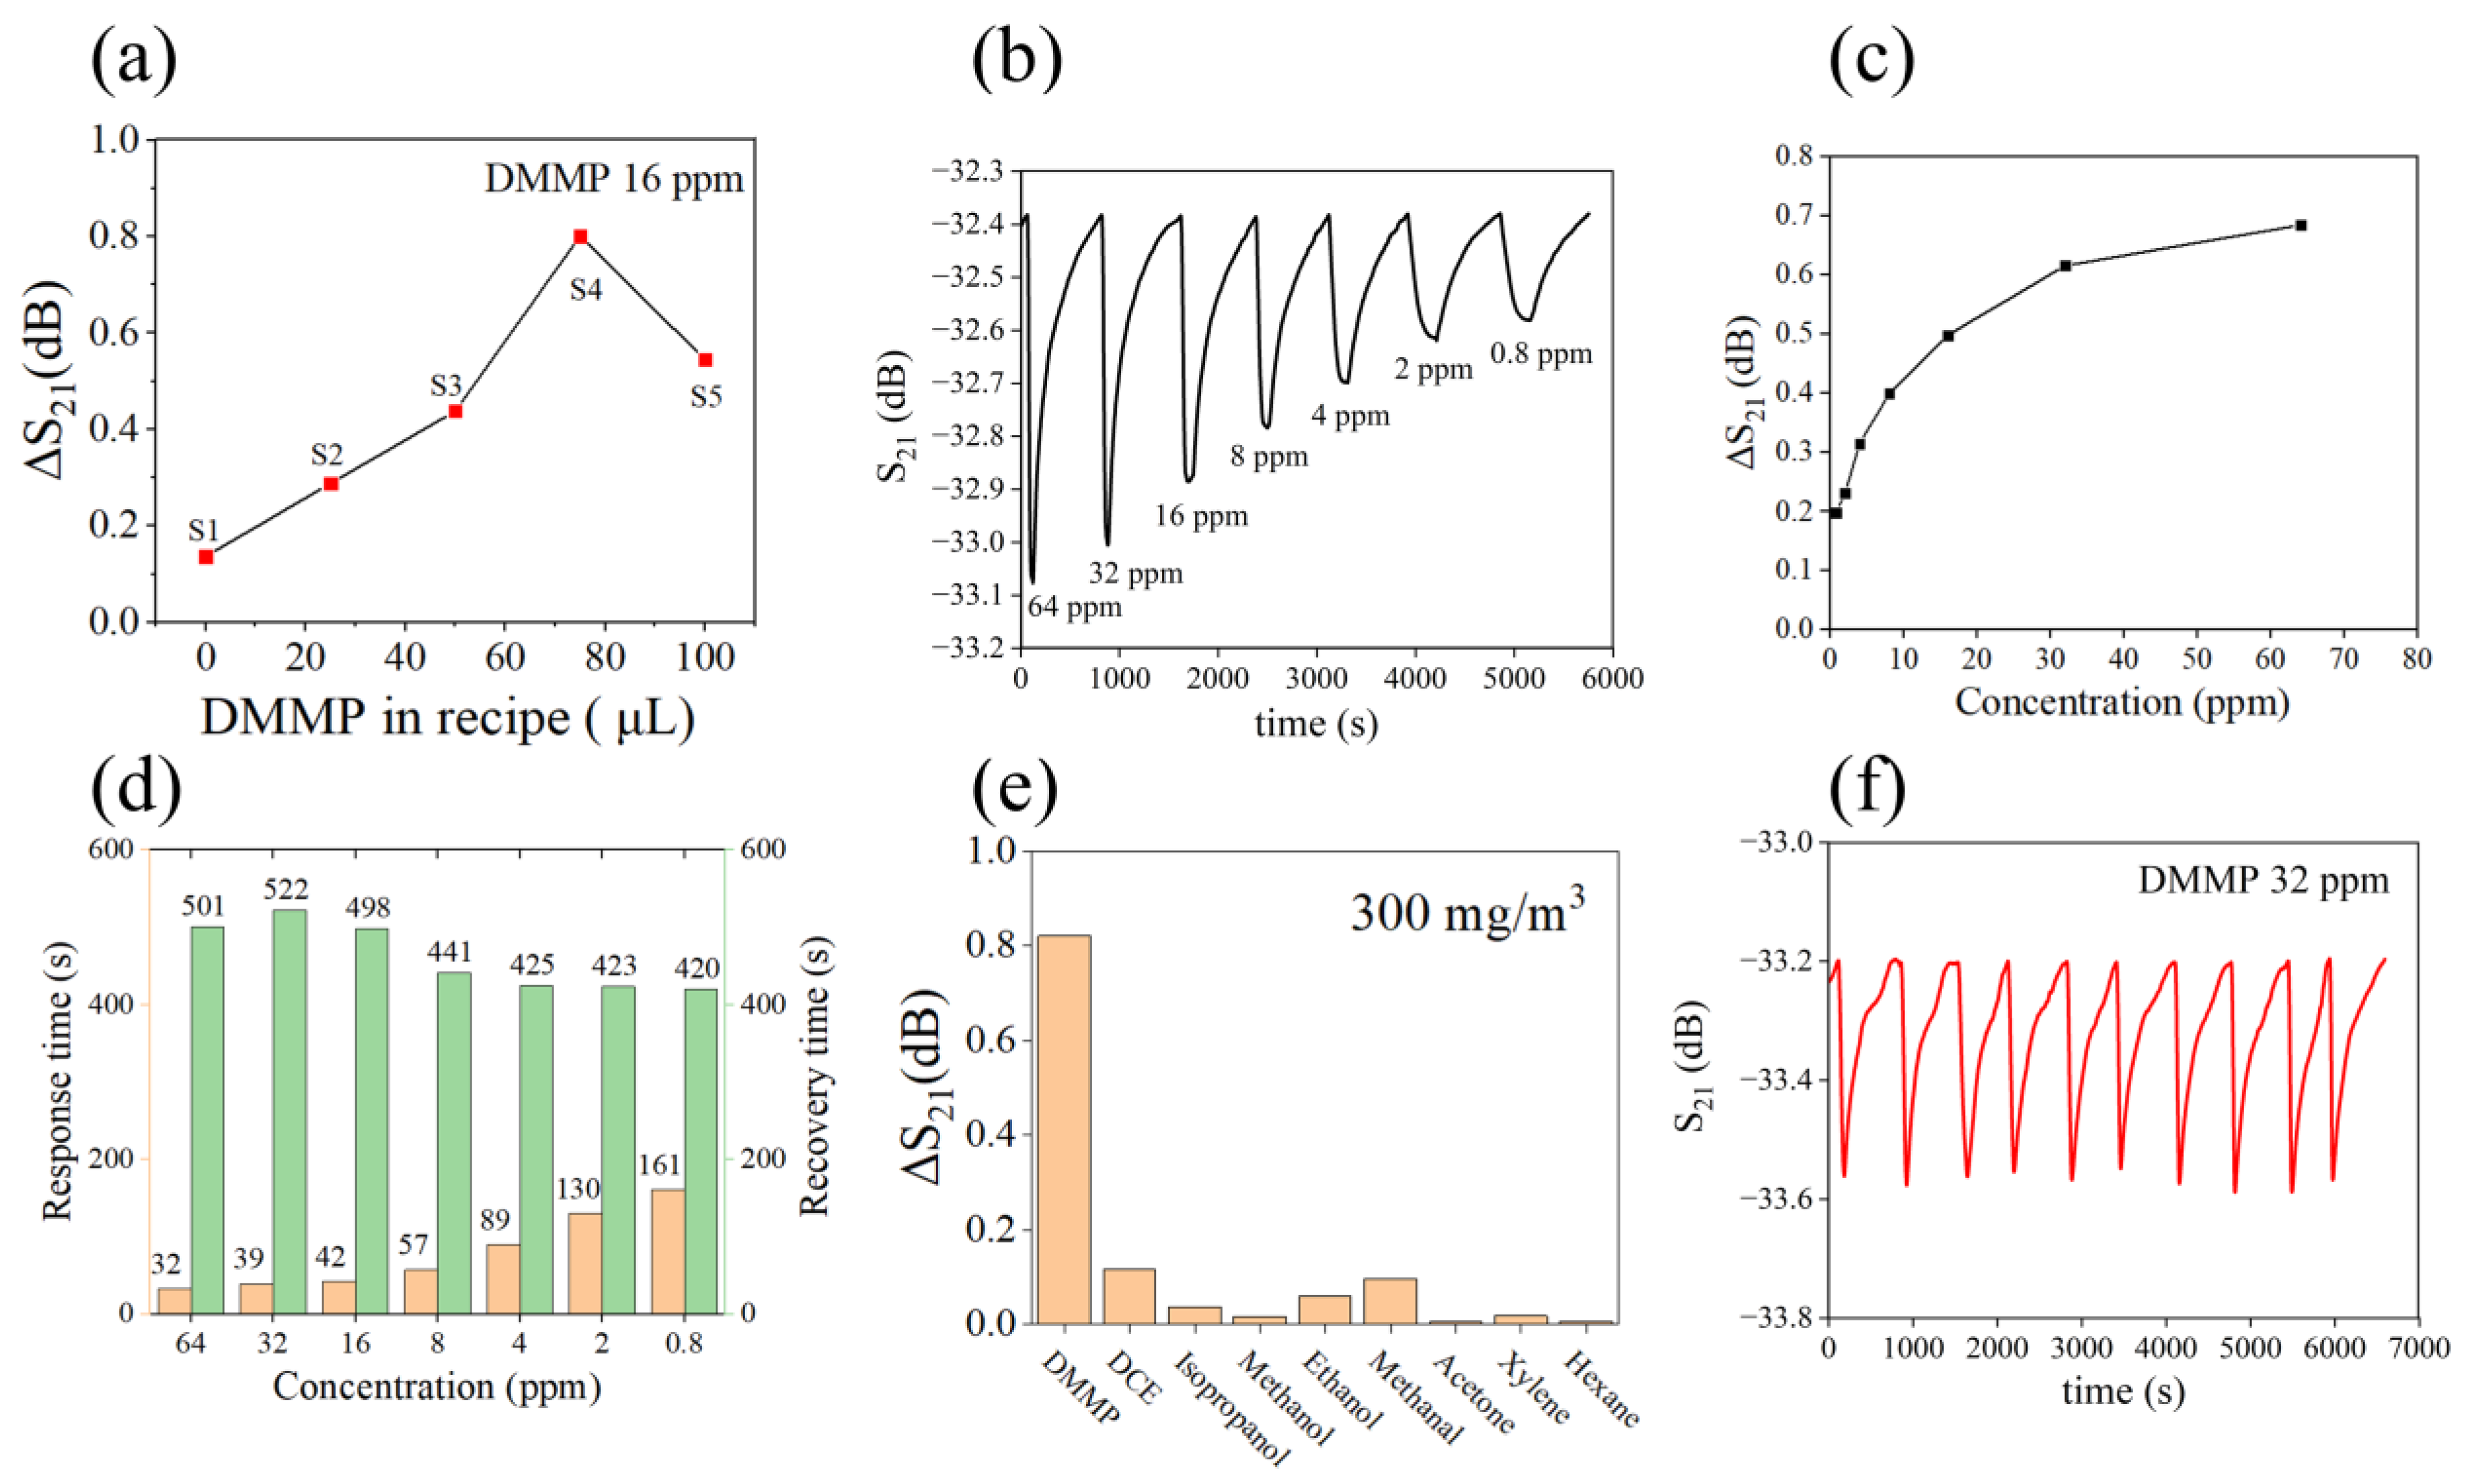
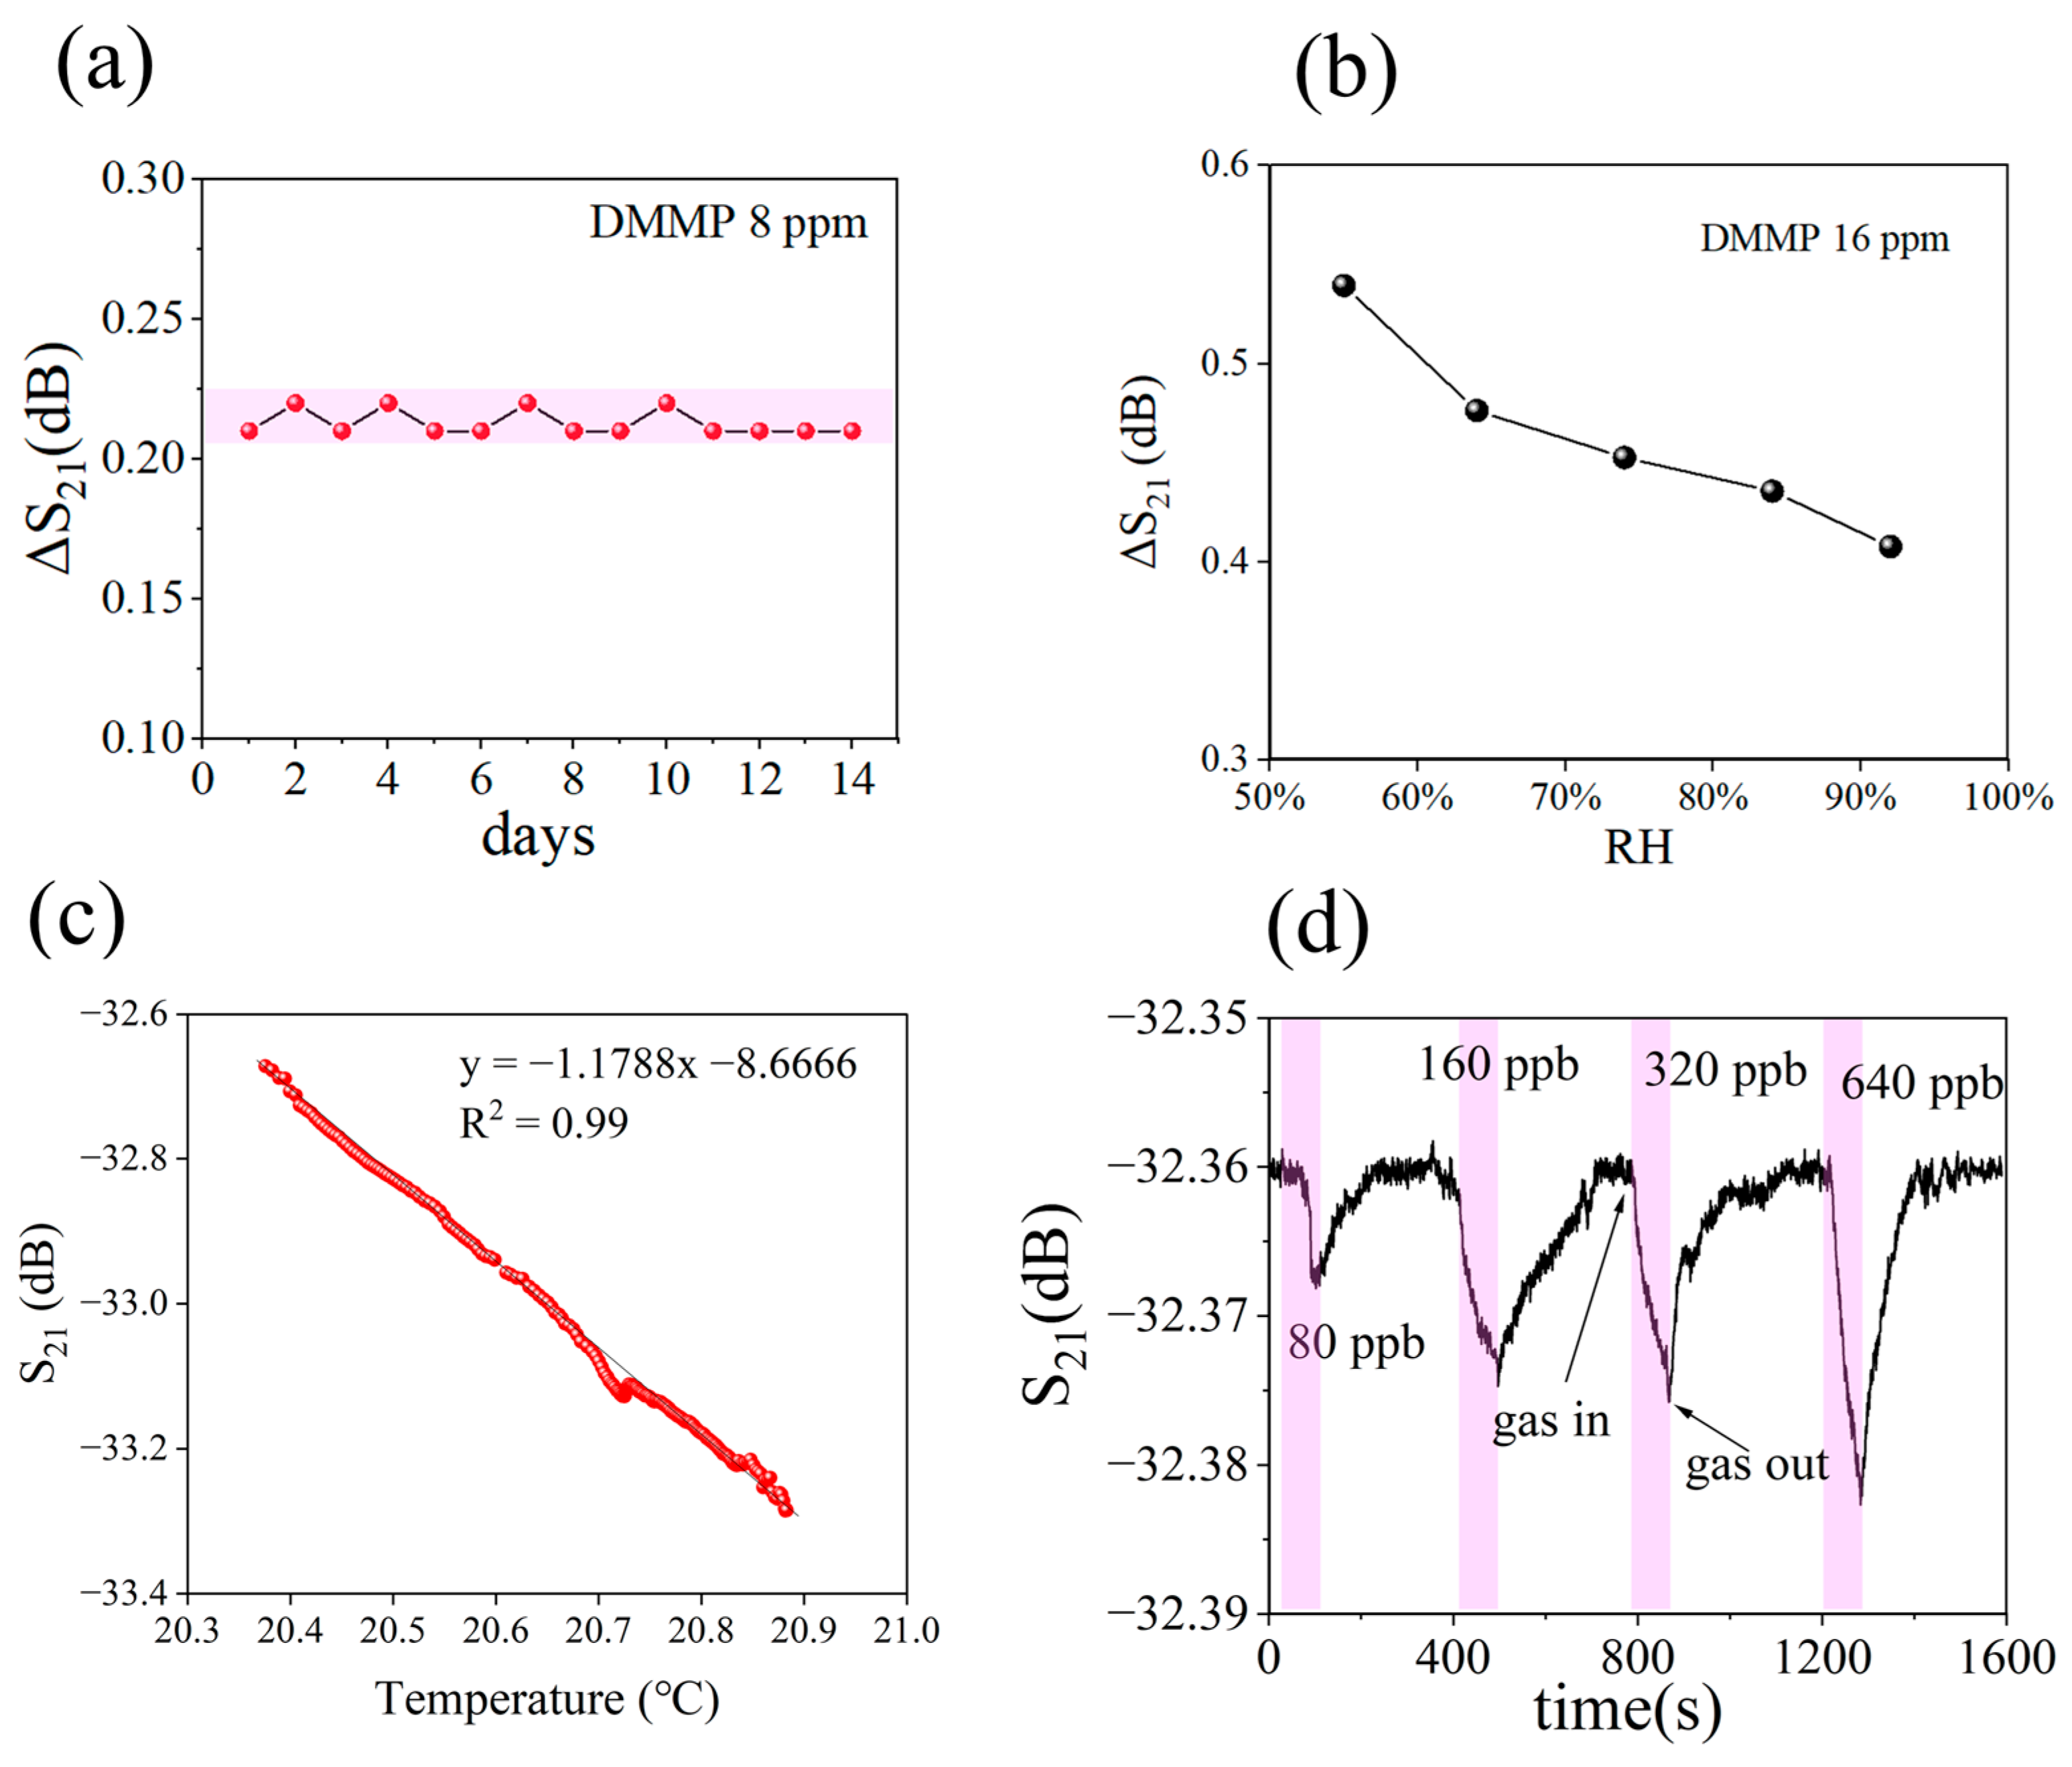
3.2. Performance of Gas Sensor

The sensor was tested following exposure to DMMP vapor, and the test time was 3 min. The response, ΔS21, was calculated as the difference between S21 at 180 s and S21 at the beginning of the test. Initially, sensor response tests were performed on five samples, and it was determined that the S4 formulation exhibited the highest sensitivity. Figure 10a presents the test results, while detailed information can be found in Figure S7 in the Supporting Information. The subsequent sensors tested were all coated with S4 ND as a sensitive material. Figure 10b illustrates the sensor response under various concentrations of DMMP. The correlation between DMMP concentration and sensor response is depicted in Figure 10c. Additionally, Figure 10d presents the response time and recovery time of the sensor for different concentrations of DMMP. These findings indicate a reduction in response time with increasing DMMP. Specifically, a concentration of 0.8 ppm DMMP resulted in a response time of 161 s. Furthermore, Figure 10e demonstrates selectivity testing on nine gases at a concentration of 300 mg/m3, while detailed information can be found in Figure S8. SiO2 MIPs exhibited selective adsorption towards DMMP. Figure 10f shows repeated testing of the sensor over 10 cycles at a concentration of 32 ppm DMMP. The aging performance of the sensor at 8 ppm DMMP is shown in Figure 11a. The SiO2 MIPs demonstrate excellent robust performance over 14 days. Figure 11b shows the sensor response to 16 ppm DMMP at various relative humidity (RH). The responsiveness of the sensor decreases with increasing humidity. The response curves of the sensor at different humidity are shown in Figure S9. Figure 11c shows how temperature affects the sensor baseline in clean air. The results show that the sensor baseline has a linear relationship with temperature, and the fitted curve R2 value is 0.99. This indicates that temperature compensation can be used to solve sensor baseline drift. Figure 11d shows the response curve of the sensor to ultra-low concentrations of DMMP. The test time was 1 min, and the sensor was able to detect a minimum concentration of 80 ppb DMMP.
A comparison of our study with previous studies is shown in Table 2. It can be seen that our sensor performs well in terms of response speed and detection limit.

4. Discussion

Sensor responsiveness, pore volume, specific surface area, and intensity of 101 ppm peak acquired by NMR were summarized in relation to DMMP content in the recipe, revealing a consistent pattern as shown in Figure 12. With the increase in DMMP content, the responsiveness of the sensor, the specific surface area and pore volume of the material, and the surface hydroxyl density of the material all increased first and then decreased. This shows that DMMP as a template can modulate the formation of mesoporous and the number of hydroxyl groups in the material.
Under the catalysis of hydrochloric acid, TEOS and water are hydrolyzed to produce silanol and ethanol [34,35]. These chemical processes are shown in Figure 13a. In the silanol–DMMP mixture, some silanols can form hydrogen bonds with DMMP, which is attributed to the electrostatic interaction between the hydroxyl group in the silanol and the oxygen in DMMP. The hydroxyl groups between silanols then undergo a gradual polycondensation process to generate SiO2. However, since a portion of the hydroxyl group has formed a hydrogen bond with the oxygen of the DMMP, this portion of the hydroxyl group is maintained and does not participate in the polycondensation. These residual hydroxyl groups form active sites in SiO2 MIPs and aid in the identification and trapping of DMMP. The volume of pores and the number of hydroxyl groups in SiO2 increases with DMMP. However, too much DMMP causes too many hydroxyl groups to form hydrogen bonds, reducing the number of hydroxyl groups involved in polycondensation reactions and, as a result, inhibiting the synthesis of SiO2. These chemical processes are shown in Figure 13b. To identify the two molecules, DMMP is represented by a ball-and-stick model, whereas silanol is represented by a stick model.
The interaction between DMMP and silanol was further confirmed by first-principles calculation. Si–H represents the hydrogen of the hydroxyl group in silanol, and Si–O– represents its oxygen. In DMMP, DOx stands for the O atom at position x, and Dmethyl is the methyl group. The ESP of silanol is depicted in Figure 14a, where Si–H exhibits a positive potential, and Si–O– exhibits a negative potential. The ESP of DMMP is shown in Figure 14b, with Dmethyl exhibiting a positive potential and DO1 and DO2 exhibiting negative potentials. It can be deduced that Si–H tends to attract DOx, while Si–O– tends to attract Dmethyl. The IGMH of DMMP and silanol are depicted in Figure 14c,d. In Figure 14c, the hydroxyl group forms a hydrogen bond with the oxygen atom of DMMP (shown in blue), while the remaining interactions are attributed to van der Waals forces (shown in green). The binding energies of the Si–H bonds with DO1 and DO2 are −52.23 kJ/mol and −34.96 kJ/mol, respectively. It is difficult to form strong bonds between DO3 and Si–H, as is the case between Si–O– and Dmethyl. Detailed calculation results are in Table S2 of Supporting Information.
Several physical effects, including mass loading effects, viscoelastic effects, and acoustoelectric effects, are believed to be responsible for the variation of the sensitivity parameters of the SAW gas sensor. Since SiO2 MIPs are granular insulating materials, mass loading effects are the main mechanism. That is, with the adsorption of gas molecules, the mass of the sensitive film increases, changing the S21 of the SAW sensor. The adsorption mechanism was verified by calculation.
Calculations have demonstrated that DMMP can form stable structures with up to three silanol groups and retain them after polymerization; that is, two hydroxyl groups formed a stable hydrogen bond with DO1, whereas one hydroxyl group formed a stable hydrogen bond with DO2, as illustrated in Figure 14g. These three hydroxyl groups in the micropores of SiO2 record the geometry of the DMMP. The distance between DO1 and DO2 in DMMP is 0.261 nm, as shown in Figure 14e. The spacing between the three Si–H is 0.24 nm, 0.515 nm, and 0.629 nm, as shown in Figure 14f, which allows SiO2 MIPs to identify and capture DMMP. Other molecules are difficult to capture by SiO2 MIPs due to the geometric mismatch. The three hydroxyl groups form hydrogen bonds with DO1 and DO2 of the DMMP, with a total binding energy Eads of −150.19 kJ/mol. Detailed calculation results are shown in Table S3 of Supporting Information. This binding energy is roughly equal to the sum of the binding energies of three Si–H with DO1 and DO2. This result supports the adsorption mechanism of SiO2 MIPs to a certain extent.

5. Conclusions

In conclusion, a highly sensitive SAW gas sensor and a sensitive film preparation method for DMMP detection are developed in this work. Amorphous mesoporous SiO2 MIP materials were prepared by TEOS hydrolysis polymerization using DMMP as a template. The content of the DMMP template significantly affects the specific surface area, pore volume, and the number of hydroxyl groups on the surface of the material. With SiO2 MIPs as the sensitive material of the SAW gas sensor, the detection of 80 ppb DMMP was realized. The first principles calculation revealed the interaction and binding energy between the SiO2 MIPs and DMMP and confirmed two important active sites in the DMMP molecule, which are the two O atoms of DMMP. Through systematic experiments and theoretical analysis, the developed SAW gas sensor has a broad application prospect in the detection of sarin.

Supplementary Materials

The following supporting information can be downloaded at https://www.mdpi.com/article/10.3390/nano13212871/s1, Figure S1. (a) The overall appearance of the test system. (b) The SAW sensor and fixture. (c) A fan and a heater on top of chamber. Figure S2. (a) The lamellar SiO2 MIPs material. (b) Morphology and defects of lamellar SiO2 surface. (c) High resolution image of lamellar SiO2. (d) AFM image of SiO2. Figure S3. (a) SiO2 MIPs dispersed by ethanol. (b) A sensor with SiO2 MIPs. (c) and (d) SEM image of SiO2 powder. (e,f) The thickness of the sensitive film along the red line. Figure S4. (a) SiO2 MIPs prepared using R6G as template. (b) The R6G in SiO2 MIPs diffuses from the material to the water. (c,d) The red color of SiO2 MIPs faded gradually. Figure S5. Raman spectra of SiO2 materials. Figure S6. Infrared absorption spectra of SiO2 MIPs. Figure S7. (a) Response curves of the sensors corresponding to the five formulations. (b) The relationship between concentration and response. Figure S8. The dynamic response curve of the sensor to different gases. Figure S9. Response curve of the sensor to DMMP at different humidity. Table S1. Mass concentration (300 mg/m3) corresponding volume concentration (ppm). Table S2. Binding energy between silanol and DMMP at different sites. Table S3. Binding energy of SiO2 and DMMP. Refs. [36,37,38] are cited in the Supplementary Materials.

Author Contributions

Investigation, X.W. (Xuming Wang); Software compilation, X.W. (Xuming Wang) and Q.W.; Device design and manufacturing, Q.W. and W.L.; Resources, C.H.; Data curation, X.W. (Xuming Wang) and Y.Y.; Writing—review and editing, X.W. (Xuming Wang) and X.L.; Visualization, C.H.; Supervision, X.L., W.L. and X.W. (Xiaoli Wang); Project administration, X.L. and X.W. (Xiaoli Wang). All authors have read and agreed to the published version of the manuscript.

Funding

This work was supported in part by the National Natural Science Foundation of China under Grant (Nos. 51625504 and 61671368), the National Defense Project (2022-JCJQ-JJ-1099), and the Fundamental Research Funds for the Central Universities (No. xzy022021047).

Data Availability Statement

The data supporting the findings of this study are available from the corresponding author upon reasonable request.

Conflicts of Interest

The authors declare that they have no competing financial interest or personal relationships that could influence the work reported in this study.

References

  1. Colović, M.B.; Krstić, D.Z.; Lazarević-Pašti, T.D.; Bondžić, A.M.; Vasić, V.M. Acetylcholinesterase inhibitors: Phar-macology and toxicology. Curr. Neuropharmacol. 2013, 11, 315–335. [Google Scholar] [CrossRef]
  2. Li, Y.; Du, X.S.; Wang, Y.; Tai, H.L.; Qiu, D.; Lin, Q.H.; Jiang, Y.D. MEMS-based gas chromatography column for the analysis of chemical warfare agent(CWA) simulates. Appl. Mech. Mater. 2014, 475–476, 1294–1298. [Google Scholar] [CrossRef]
  3. Terzic, O.; Swahn, I.; Cretu, G.; Palit, M.; Mallard, G. Gas chromatography-full scan mass spectrometry determina-tion of traces of chemical warfare agents and their impurities in air samples by inlet based thermal desorption of sorbent tubes. J. Chromatogr. A 2012, 1225, 182–192. [Google Scholar] [CrossRef]
  4. Phillips, C.M.; Tan, H.W. FTIR Gas Analysis with Improved Sensitivity and Selectivity for CWA and TIC Detection. In Chemical, Biological, Radiological, Nuclear, and Explosives (CBRNE) Sensing XI; SPIE: Bellingham, WA, USA, 2010; Volume 7665. [Google Scholar] [CrossRef]
  5. Armenta, S.; Alcala, M.; Blanco, M. A review of recent, unconventional applications of ion mobility spectrometry (IMS). Anal. Chim. Acta 2011, 703, 114–123. [Google Scholar] [CrossRef] [PubMed]
  6. Puton, J.; Namiesnik, J. Ion mobility spectrometry: Current status and application for chemical warfare agents detection. Trac-Trends Anal. Chem. 2016, 85, 10–20. [Google Scholar] [CrossRef]
  7. Patil, L.A.; Deo, V.V.; Shinde, M.D.; Bari, A.R.; Patil, D.M.; Kaushik, M.P. Improved 2-CEES sensing performance of spray pyrolized Ru-CdSnO3 nanostructured thin films. Sens. Actuators B Chem. 2014, 191, 130–136. [Google Scholar] [CrossRef]
  8. Kong, L.T.; Wang, J.; Fu, X.C.; Zhong, Y.; Meng, F.L.; Luo, T.; Liu, J.H. p-Hexafluoroisopropanol phenyl covalently functionalized single-walled carbon nanotubes for detection of nerve agents. Carbon 2010, 48, 1262–1270. [Google Scholar] [CrossRef]
  9. Long, Y.; Wang, Y.; Du, X.S.; Cheng, L.H.; Wu, P.L.; Jiang, Y.D. The Different Sensitive Behaviors of a Hydrogen-Bond Acidic Polymer-Coated SAW Sensor for Chemical Warfare Agents and Their Simulants. Sensors 2015, 15, 18302–18314. [Google Scholar] [CrossRef]
  10. Grate, J.W. Hydrogen-Bond Acidic Polymers for Chemical Vapor Sensing. Chem. Rev. 2008, 108, 726–745. [Google Scholar] [CrossRef] [PubMed]
  11. Grate, J.W. Acoustic wave microsensor arrays for vapor sensing. Chem. Rev. 2000, 100, 2627–2647. [Google Scholar] [CrossRef] [PubMed]
  12. Ballantine, D.S.; Rose, S.L.; Grate, J.W.; Wohltjen, H. Correlation of surface acoustic wave device coating responses with solubility properties and chemical structure using pattern recognition. Anal. Chem. 1986, 58, 3058–3066. [Google Scholar] [CrossRef]
  13. Grate, J.W.; Rose-Pehrsson, S.L.; Venezky, D.L.; Klusty, M.; Wohltjen, H. Smart sensor system for trace organophos-phorus and organosulfur vapor detection employing a temperature-controlled array of surface acoustic wave sen-sors, automated sample preconcentration, and pattern recognition. Anal. Chem. 1993, 65, 1868–1881. [Google Scholar] [CrossRef]
  14. Devkota, J.; Greve, D.W.; Hong, T.; Kim, K.J.; Ohodnicki, P.R. An 860 MHz Wireless Surface Acoustic Wave Sensor with a Metal-Organic Framework Sensing Layer for CO2 and CH4. IEEE Sens. J. 2020, 20, 9740–9747. [Google Scholar] [CrossRef]
  15. BelBruno, J.J. Molecularly Imprinted Polymers. Chem. Rev. 2019, 119, 94–119. [Google Scholar] [CrossRef] [PubMed]
  16. Holthoff, E.; Li, L.; Hiller, T.; Turner, K. A molecularly imprinted polymer (MIP)-coated microbeam MEMS sensor for chemical detection. In Chemical, Biological, Radiological, Nuclear, and Explosives (CBRNE) Sensing XVI; SPIE: Bellingham, WA, USA, 2015; Volume 9455. [Google Scholar] [CrossRef]
  17. Goerigk, L.; Hansen, A.; Bauer, C.; Ehrlich, S.; Najibi, A.; Grimme, S. A look at the density functional theory zoo with the advanced GMTKN55 database for general main group thermochemistry, kinetics and noncovalent interactions. Phys. Chem. Chem. Phys. 2017, 19, 32184–32215. [Google Scholar] [CrossRef]
  18. Lu, T.; Chen, F.W. Multiwfn: A multifunctional wavefunction analyzer. J. Comput. Chem. 2012, 33, 580–592. [Google Scholar] [CrossRef]
  19. Lu, T.; Manzetti, S. Wavefunction and reactivity study of benzo[a]pyrene diol epoxide and its enantiomeric forms. Struct. Chem. 2014, 25, 1521–1533. [Google Scholar] [CrossRef]
  20. Manzetti, S.; Lu, T. The geometry and electronic structure of Aristolochic acid: Possible implications for a frozen resonance. J. Phys. Org. Chem. 2013, 26, 473–483. [Google Scholar] [CrossRef]
  21. Zhang, J.; Lu, T. Efficient evaluation of electrostatic potential with computerized optimized code. Phys. Chem. Chem. Phys. 2021, 23, 20323–20328. [Google Scholar] [CrossRef]
  22. Lu, T.; Chen, Q.X. Independent gradient model based on Hirshfeld partition: A new method for visual study of in-teractions in chemical systems. J. Comput. Chem. 2022, 43, 539–555. [Google Scholar] [CrossRef]
  23. Sun, J.F.; Xu, Z.Q.; Li, W.F.; Shen, X.D. Effect of Nano-SiO2 on the Early Hydration of Alite-Sulphoaluminate Cement. Nanomaterials 2017, 7, 102. [Google Scholar] [CrossRef] [PubMed]
  24. Saravanan, S.; Dubey, R.S. Synthesis of SiO2 Nanoparticles by Sol-Gel Method and Their Optical and Structural Properties. Rom. J. Inf. Sci. Technol. 2020, 23, 105–112. [Google Scholar]
  25. Ramalla, I.; Gupta, R.; Bansal, K. Effect on superhydrophobic surfaces on electrical porcelain insulator, improved technique at polluted areas for longer life and reliability. Int. J. Eng. Technol. 2015, 4, 509. [Google Scholar] [CrossRef]
  26. Lin, C.; Rüssel, C.; van Wüllen, L. Phase Separation and Nanocrystallization in KF–ZnF2–SiO2 Glasses: Lessons from Solid-State NMR. J. Phys. Chem. B 2019, 123, 1688–1695. [Google Scholar] [CrossRef] [PubMed]
  27. Biesinger, M.C. Accessing the robustness of adventitious carbon for charge referencing (correction) purposes in XPS analysis: Insights from a multi-user facility data review. Appl. Surf. Sci. 2022, 597, 153681. [Google Scholar] [CrossRef]
  28. Wen, W.; Shitang, H.; Shunzhou, L.; Minghua, L.; Yong, P. Enhanced sensitivity of SAW gas sensor coated molecu-larly imprinted polymer incorporating high frequency stability oscillator. Sens. Actuators B Chem. 2007, 125, 422–427. [Google Scholar] [CrossRef]
  29. Du, X.; Ying, Z.; Jiang, Y.; Liu, Z.; Yang, T.; Xie, G. Synthesis and evaluation of a new polysiloxane as SAW sensor coatings for DMMP detection. Sens. Actuators B Chem. 2008, 134, 409–413. [Google Scholar] [CrossRef]
  30. Matatagui, D.; Fernández, M.J.; Fontecha, J.; Santos, J.P.; Gràcia, I.; Cané, C.; Horrillo, M.C. Love-wave sensor array to detect, discriminate and classify chemical warfare agent simulants. Sens. Actuators B Chem. 2012, 175, 173–178. [Google Scholar] [CrossRef]
  31. Di Pietrantonio, F.; Benetti, M.; Cannatà, D.; Verona, E.; Palla-Papavlu, A.; Dinca, V.; Dinescu, M.; Mattle, T.; Lippert, T. Volatile toxic compound detection by surface acoustic wave sensor array coated with chemoselective polymers deposited by laser induced forward transfer: Application to sarin. Sens. Actuators B Chem. 2012, 174, 158–167. [Google Scholar] [CrossRef]
  32. Pan, Y.; Zhang, G.W.; Guo, T.X.; Liu, X.L.; Zhang, C.H.; Yang, J.C.; Cao, B.Q.; Zhang, C.; Wang, W. Environmental characteristics of surface acoustic wave devices for sensing organophosphorus vapor. Sens. Actuators B Chem. 2020, 315. [Google Scholar] [CrossRef]
  33. Wu, Q.; Li, X.; Wang, X.M.; Yuan, Y.B.; Bu, X.R.; Wu, H.Y.; Li, X.; Han, C.Y.; Wang, X.L.; Liu, W.H. High-performance p-hexafluoroisopropanol phenyl functionalized multi-walled carbon nanotube film on surface acoustic wave device for organophosphorus vapor detection. Nanotechnology 2022, 33, 375501. [Google Scholar] [CrossRef] [PubMed]
  34. Zhuravlev, L.T. The surface chemistry of amorphous silica. Zhuravlev model. Colloids Surf. A 2000, 173, 1–38. [Google Scholar] [CrossRef]
  35. Plotnichenko, V.G.; Sokolov, V.O.; Dianov, E.M. Hydroxyl groups in high-purity silica glass. Inorg. Mater. 2000, 36, 404–410. [Google Scholar] [CrossRef]
  36. Lafuente, M.; Sanz, D.; Urbiztondo, M.; Santamaria, J.; Pina, M.P.; Mallada, R. Gas phase detection of chemical warfare agents CWAs with portable Raman. J. Hazard. Mater. 2020, 384, 121279. [Google Scholar] [CrossRef]
  37. Wang, J.; Duan, G.; Liu, G.; Li, Y.; Chen, Z.; Xu, L.; Cai, W. Detection of dimethyl methylphosphonate by thin water film confined surface-enhanced Raman scattering method. J. Hazard. Mater. 2016, 303, 94–100. [Google Scholar] [CrossRef] [PubMed]
  38. Lin, Z.; Wen, B.; Liu, W.; Fu, W.; Kong, J.; Li, J. Rapidly Detection of Chemical Warfare Agent Simulants by Surface Enhanced Raman Spectroscopy. Spectrosc. Spectr. Anal. 2022, 42, 110–114. [Google Scholar] [CrossRef]
Figure 1. The preparation process of the SAW gas sensor.
Nanomaterials 13 02871 g001
Figure 2. (a) Schematic diagram of extraction of characteristic signals from the S21 curve. (b) The response curve of the gas sensor.
Nanomaterials 13 02871 g002
Figure 3. (a) A lamellar SiO2 MIP. (b) SEM image of lamellar SiO2 MIP. (c) The optical image of SiO2 MIP powder on a SAW sensor. (d) SEM image of SiO2 MIP powder.
Nanomaterials 13 02871 g003
Figure 4. XRD of 5 SiO2 MIP samples.
Nanomaterials 13 02871 g004
Figure 5. (a) Infrared absorption spectra of SiO2 samples. (b) Fine spectrum in S4 sample.
Nanomaterials 13 02871 g005
Figure 6. (a) Isothermal adsorption and desorption curve of SiO2 MIPs. (b) Pore width distribution of SiO2 MIPs. (c) Specific surface area, pore volume, and pore width of SiO2 MIPs.
Nanomaterials 13 02871 g006
Figure 7. (a) NMR spectra of SiO2 MIPs. (b) Relationship between Si-OH peak intensity and DMMP addition.
Nanomaterials 13 02871 g007
Figure 8. (a) XPS spectra of SiO2 MIPs. (b) High-resolution Si spectrum. (c) High-resolution O spectrum. (d) High-resolution C spectrum.
Nanomaterials 13 02871 g008
Figure 9. TG analysis curves of SiO2 MIPs.
Nanomaterials 13 02871 g009
Figure 10. (a) Responsiveness of five sensors to DMMP at 16 ppm. (b) Dynamic response curves of the S4 sensor. (c) Relationship between gas concentration and response. (d) Sensor response time and recovery time. (e) The selectivity of the sensor. (f) The repeatability of the sensor.
Nanomaterials 13 02871 g010
Figure 11. (a) Aging properties of sensors. (b) Response of sensor at different relative humidity. (c) The effect of temperature on the baseline of the sensor. (d) Sensor response to ultra-low concentrations of DMMP.
Nanomaterials 13 02871 g011
Figure 12. Relationship of the amount of DMMP added to the responsiveness, pore volume, specific surface area, and NMR intensity.
Nanomaterials 13 02871 g012
Figure 13. (a) Hydrolysis of TEOS. (b) The polycondensation reaction process of silane alcohols.
Nanomaterials 13 02871 g013
Figure 14. (a) ESP of Si (OH)4. (b) ESP of DMMP. (c) Hydrogen bond between Si–H and DO1. (d) Hydrogen bond between Si–H and DO2. (e) The distance between DO1 and DO2 of DMMP is 0.261 nm. (f) The distance of three Si–H in SiO2 MIPs. (g) One DMMP forms hydrogen bonds with three hydroxyl groups.
Nanomaterials 13 02871 g014
Table 1. The recipe for preparing samples.
RecipeS1 S2S3S4S5
DMMP (μL)0255075100
Ethanol (μL)655
TEOS (μL)1260
Water (μL)205
HCl (μL)5.62
Table 2. Comparison of this work with the previous works.
FrequencySensitive MaterialLimit of Detection (DMMP)Response TimeRef.
300 MHzmolecularly imprinted polymer0.1 ppm300 s[28]
434 MHzpolymethyl[3-(2-hydroxy) phenyl] siloxane5 ppm30 s[29]
163 MHzcarbowax, polyethyleneimine, polyepichlorohydrin. etc.0.04 ppm1800 s[30]
392 MHzpolyethyleneimine, polyepichlorhydrine, polyisobutylene2.5 ppm60 s[31]
150 MHzfluoroalcoholpolysiloxane (SXFA)0.025 ppm [32]
152 MHzhexafluoroisopropanol (HFIP) modified carbon nanotubes0.1 ppm3 s[33]
152 MHzmolecularly imprinted polymer (SiO2 MIPs)0.08 ppm60 sthis work
Disclaimer/Publisher’s Note: The statements, opinions and data contained in all publications are solely those of the individual author(s) and contributor(s) and not of MDPI and/or the editor(s). MDPI and/or the editor(s) disclaim responsibility for any injury to people or property resulting from any ideas, methods, instructions or products referred to in the content.

