Communication

Eu3+ Complex-Based Superhydrophobic Fluorescence Sensor for Cr(VI) Detection in Water

1
Institute of Hybrid Materials, National Center of International Joint Research for Hybrid Materials Technology, National Base of International Sci. & Tech. Cooperation on Hybrid Materials, College of Materials Science and Engineeeing, Qingdao University, 308 Ningxia Road, Qingdao 266071, China
2
Department of Mechanical and Aerospace Engineering, North Carolina State University, Raleigh, NC 27695, USA
*
Authors to whom correspondence should be addressed.
These authors contributed equally to this work.
Nanomaterials 2023, 13(18), 2574; https://doi.org/10.3390/nano13182574
Submission received: 8 May 2023 / Revised: 2 August 2023 / Accepted: 13 September 2023 / Published: 17 September 2023

Abstract

:
Cr(VI) compounds are bioaccumulative and highly toxic pollutants, and there is a need for simple and fast detection methods to monitor their trace levels. In this work, we developed a Eu3+ complex-based fluorescence sensor to easily detect Cr(VI) in water droplets. Our sensor consists of a nanofibrous membrane electrospun with a blend of polyvinylidene fluoride (PVDF), silica particles, and Eu3+ complex. Upon modifying the membrane surface with fluoroalkyl chemistry, the sensor displayed superhydrophobicity. When a water droplet with Cr(VI) was placed on such a superhydrophobic fluorescence sensor, the overlapping absorption of Cr(VI) and Eu3+ complex facilitated the inner filter effect, allowing the selective detection of Cr(VI) down to 0.44 µM (i.e., 45.76 µg L−1). We proposed and designed of new inexpensive and fast sensor for the detection of Cr(VI).

Graphical Abstract

1. Introduction

Chromium-contaminated liquid waste is a major concern in various industrial sectors like rubber, leather, paper, tanning, sanitary landfills, etc. Chromium compounds, particularly the ones containing hexavalent chromium (Cr(VI)), are bioaccumulative and are highly toxic upon consumption [1,2,3,4,5]. In order to control such adverse effects of chromium on human health, the World Health Organization has set the permissible Cr(VI) concentration level 50 µg L−1 in drinking water [6]. Thus, simple, inexpensive, and efficient chromium sensing technologies that can monitor Cr(VI) levels in drinking water have gained significant attention [7,8,9]. While fluorescence sensors based on quantum dots and organic dyes have been explored for Cr(VI) detection, they suffer from limitations such as low sensitivity, short fluorescence lifetimes, broad emission bands, photobleaching, etc. [1,10,11,12,13,14,15,16]. Fluorescence sensors based on the inner filter effect (IFE) using lanthanide complexes overcame these limitations, but they are vulnerable to water [17,18,19,20,21,22,23,24,25,26,27,28,29]. For example, Tan et al. developed Pickering emulsion and quantum dot (QD) doping technology to fabricate Janus silica nanoflake-based fluorescence sensor arrays for the pattern recognition of multiple heavy metal ions [30]. Amin et al. synthesized a novel hydrazone functionality-based spectrophotometric probe for selective and sensitive estimation of toxic heavy metal ions [31]. Melnikov et al. proposed a new fluorescent method to selectively recognize heavy metals in an aqueous solution via employing an array of several fluorescent probes: acridine yellow, eosin, and methylene blue [32]. Currently, the detection methods mainly depend on complicated apparatus, such as liquid chromatography–tandem mass spectrometry [33], surface-enhanced Raman spectroscopy [34], high-performance liquid chromatography coupled with UV-vis determination [35], etc. However, these methodologies are usually limited owing to their drawbacks, including high cost, complicated operation, and time consumed. In contrast to the conventional instrumental methods, luminescent sensing has been proven to be a promising analysis technique owing to its high sensibility, short response time, easy manipulation and low cost. Furthermore, non-contact fluorescence sensing based on IFE has never been investigated with lanthanide complexes for Cr(VI) detection.
In this work, we developed the first ever lanthanide-complex-based non-contact fluorescence sensing approach coupled with IFE to enable Cr(VI) detection in aqueous liquids with high sensitivity and high selectivity. Our Cr(VI) sensor consists of a nanofibrous membrane electrospun with a blend of polyvinylidene fluoride (PVDF), silica particles and Eu(TTA)3Phen complex (TTA:2-thenoyltrifluoroacetone, Phen:1,10-Phenanthroline). We chose this Eu3+ complex among lanthanide complexes because of its spectral overlap with Cr(VI) to leverage the IFE. We used silica particles to impart appropriate texture and fluoroalkyl chemistry (after surface modification), which together result in superhydrophobicity (i.e., extreme repellency water) [36,37]. Due to the superhydrophobicity, water beads up on our sensor, allowing Cr(VI) detection using droplets with low liquid volumes (3 µL), unlike the traditional Cr(VI) sensors. Our sensor demonstrated Cr(VI) detection at concentrations as low as 0.44 µM (i.e., 45.76 µg L−1), with high selectivity against metal cations and anions in water. We anticipate that our results will open prospects for the design of novel inexpensive and reusable Cr(VI) sensors.

2. Experimental Section

2.1. Synthesis of Eu3+ Complex

Eu3+ complex was obtained by complexation of EuCl3·6H2O, TTA, and Phen according to the literature with some modifications [38]. First, 0.05 M solutions of EuCl3·6H2O, TTA, and Phen in DMF were prepared separately at room temperature under magnetic stirring. EuCl3·6H2O solution and TTA solution were added with the 1:3 ratio and stirred for 30 min at room temperature. Subsequently, one part of Phen solution was added to the EuCl3·6H2O and TTA solution and stirred for 2 h at room temperature. Post stirring, the solution appears colorless and contains Eu3+ complex dissolved in DMF.

2.2. Synthesis of Silica Particles

In this step, 400 nm silica particles (Figure S1) were synthesized via the classic Stöber method with 1 mL TEOS and 50 mL ethanol using 1.17 M ammonia solution [39]. A dispersion of the synthesized silica particles (1.25 g) in 5 mL DMF was prepared using an ultrasonic cell pulverizer (BILON96, Shanghai Bilon Co., Ltd., Shanghai, China) for electrospinning.

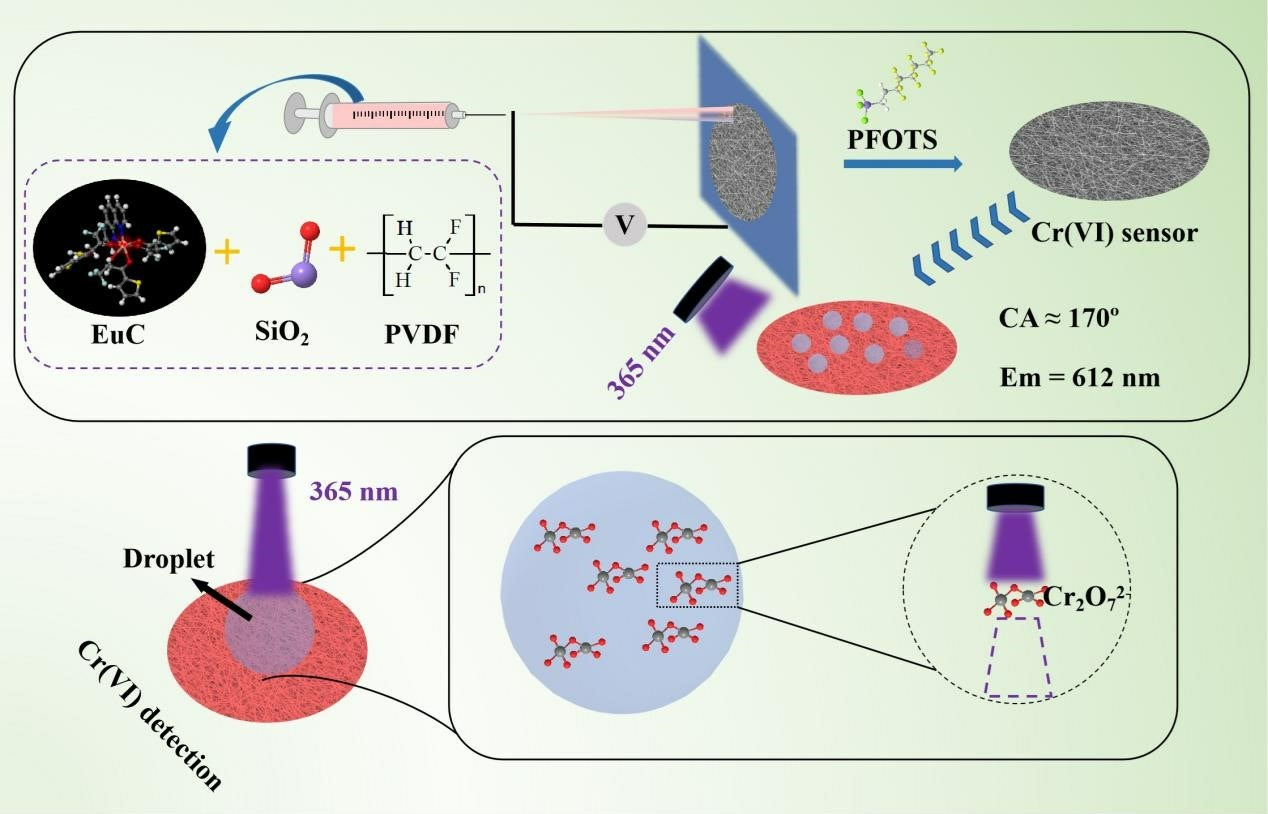
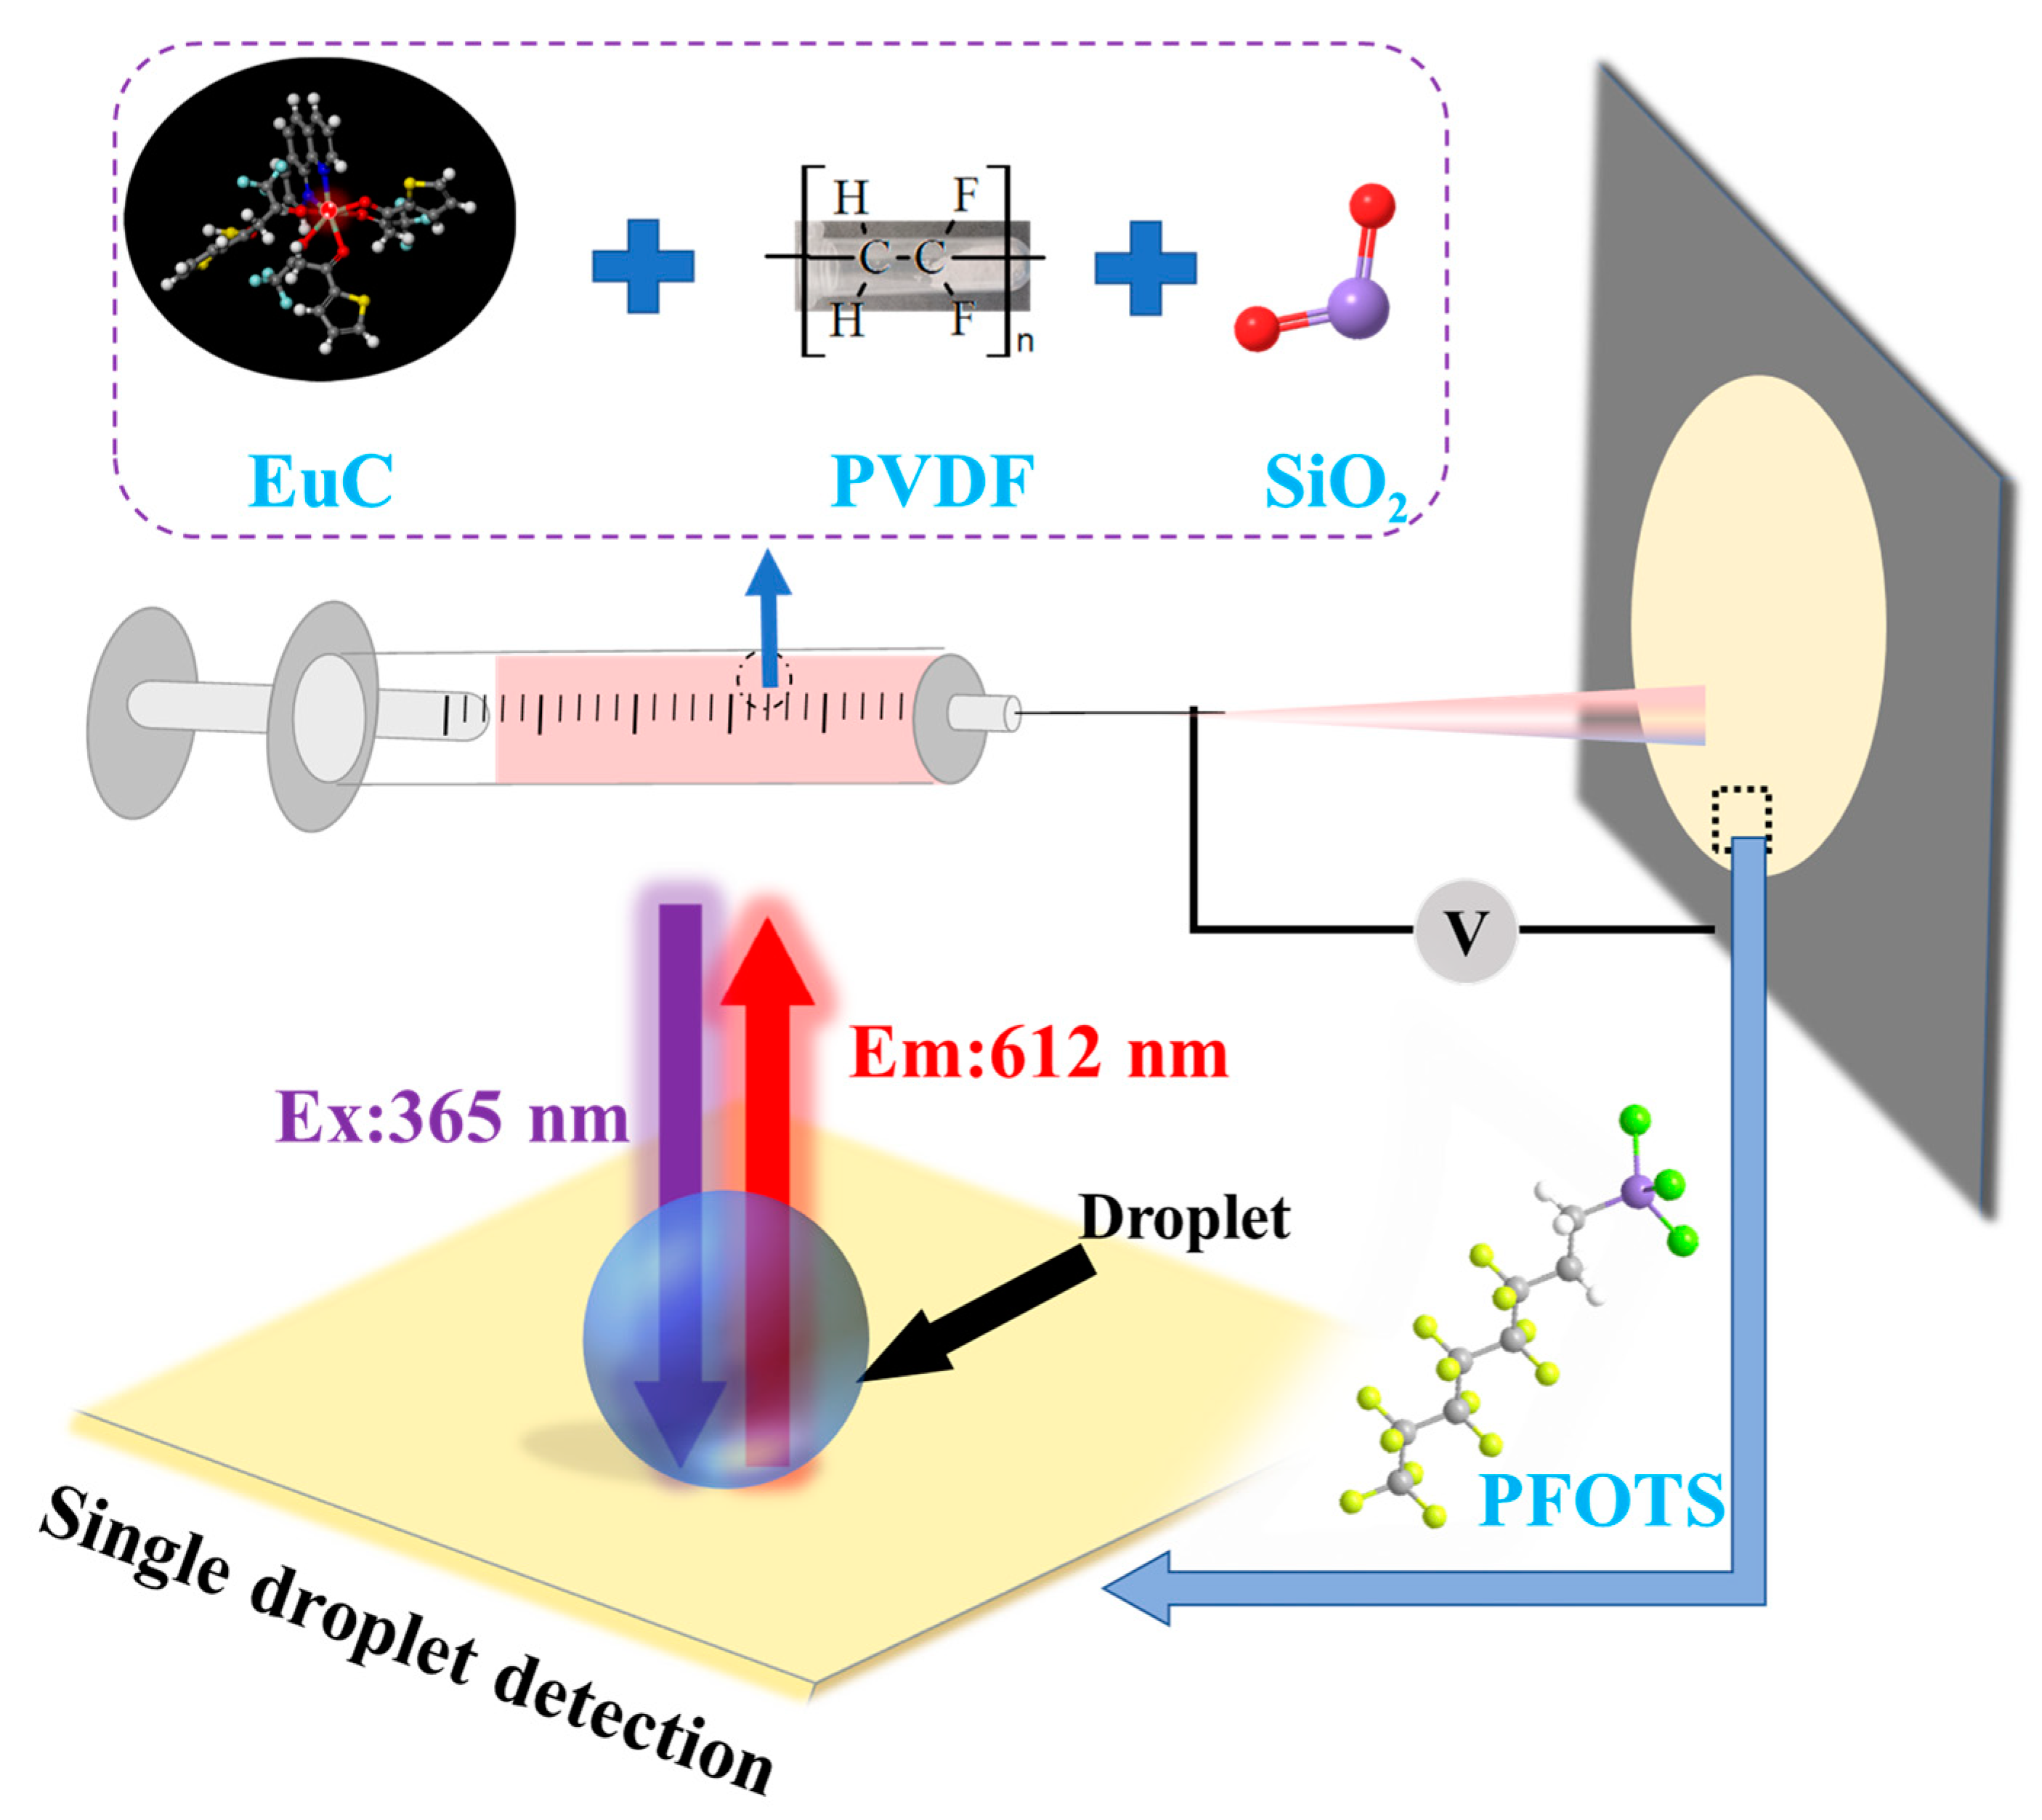
2.3. Electrospinning Nanofibrous Membranes

Five nanofibrous membranes (i.e., FM 1, FM 2, FM 3, FM 4 and FM 5) were fabricated via electrospinning using different solutions/dispersions. FM 1 was fabricated by electrospinning Eu3+ complex (55.25 mg) only. FM 2 was fabricated by electrospinning PVDF (1.25 g) only. FM 3 was fabricated by electrospinning PVDF (1.25 g) and Eu3+ complex (55.25 mg). FM 4 was fabricated by electrospinning PVDF (1.25 g), Eu3+ complex (55.25 mg), and silica particles (0.18 g). FM 5 was fabricated by treating FM 4 (Figure 1) with PFOTS at 100 °C for 90 min in an enclosed chamber. A mixture of 10 mL DMF and 3 mL acetone was used as the solvent for all solutions/dispersions. The solutions/dispersions were prepared by stirring the respective constituents at 500 rpm and 40 °C for 6 h. For electrospinning, the solutions/dispersions were loaded into a 5 mL syringe (Chongqing Co., Shanghai, China) with a blunt stainless-steel needle. The solution was fed at a flow rate of 0.3 mL min−1 using a syringe pump and was collected on a grounded aluminum foil. A positive DC voltage of 16 kV was applied at the stainless-steel tip and the distance between the stainless-steel tip and collector was set at 16 cm.

3. Characterizations

The surface morphology of the nanofibrous membranes was characterized using a scanning electron microscope (SEM; TESCAN, VEGA3, Brno, Czech Republic). The surface chemistry of nanofibrous membranes was characterized using an X-ray photoelectron spectrometer (XPS; VG Scientific, VG ESCALAB 220iXL, Waltham, MA, USA). The water repellency of nanofibrous membranes was characterized by measuring contact angles of water droplets using a contact angle meter (JC2000D). Contact angle measurements were repeated at least four times on each nanofibrous membrane. The photophysical properties of our nanofibrous membranes were characterized using UV-vis spectra and fluorescence spectra. UV-vis spectra of nanofibrous membranes were obtained using a UV755B (Youke, Beijing, China) spectrophotometer at ambient temperature. Fluorescence spectra were obtained using Cary Eclipse Fluorescence spectrophotometer (Varian, Palo Alto, CA, USA) equipped with a 75 kW Xenon lamp (Varian, Palo Alto, CA, USA) as the excitation source. The quantum yield (Φtot) and fluorescence lifetime (τobs) measurements were carried out using FLs 980 instrument (Edinburgh Instruments Ltd., Edinburgh, UK). For each nanofibrous membrane, the measurements were repeated at least three times.

Cr(VI) Sensing with Aqueous Droplets

Cr(VI) sensing with aqueous droplets was conducted on FM 5 (i.e., Cr(VI) sensor) using fluorescence spectra obtained from micro-spectroscopy (CRAIC, San Dimas, CA, USA; Figure S2). Multiple stock solutions were prepared for a wide range of Cr(VI) concentrations by diluting 0.1 M Cr2O72− (using K2Cr2O7) solution. A 3 μL droplet from the stock solution was placed over the Cr(VI) sensor, excited using a 365 nm Xenon light source (Varian, Palo Alto, CA, USA) and the fluorescence response was collected. For each droplet concentration, the test was repeated at least two times with identical parameters at room temperature. To evaluate the selectivity of Cr(VI) sensing, different 0.1 M stock solutions with a series of metal cations (Ba2+, Ca2+, K+, Mg2+, Mn2+, Na+) and anions (F, Br, Cl, I, HSO4, CH3COO) were prepared in distilled water and diluted to the desired concentration, and the fluorescence responses from the droplets were analyzed.

4. Results and Discussion

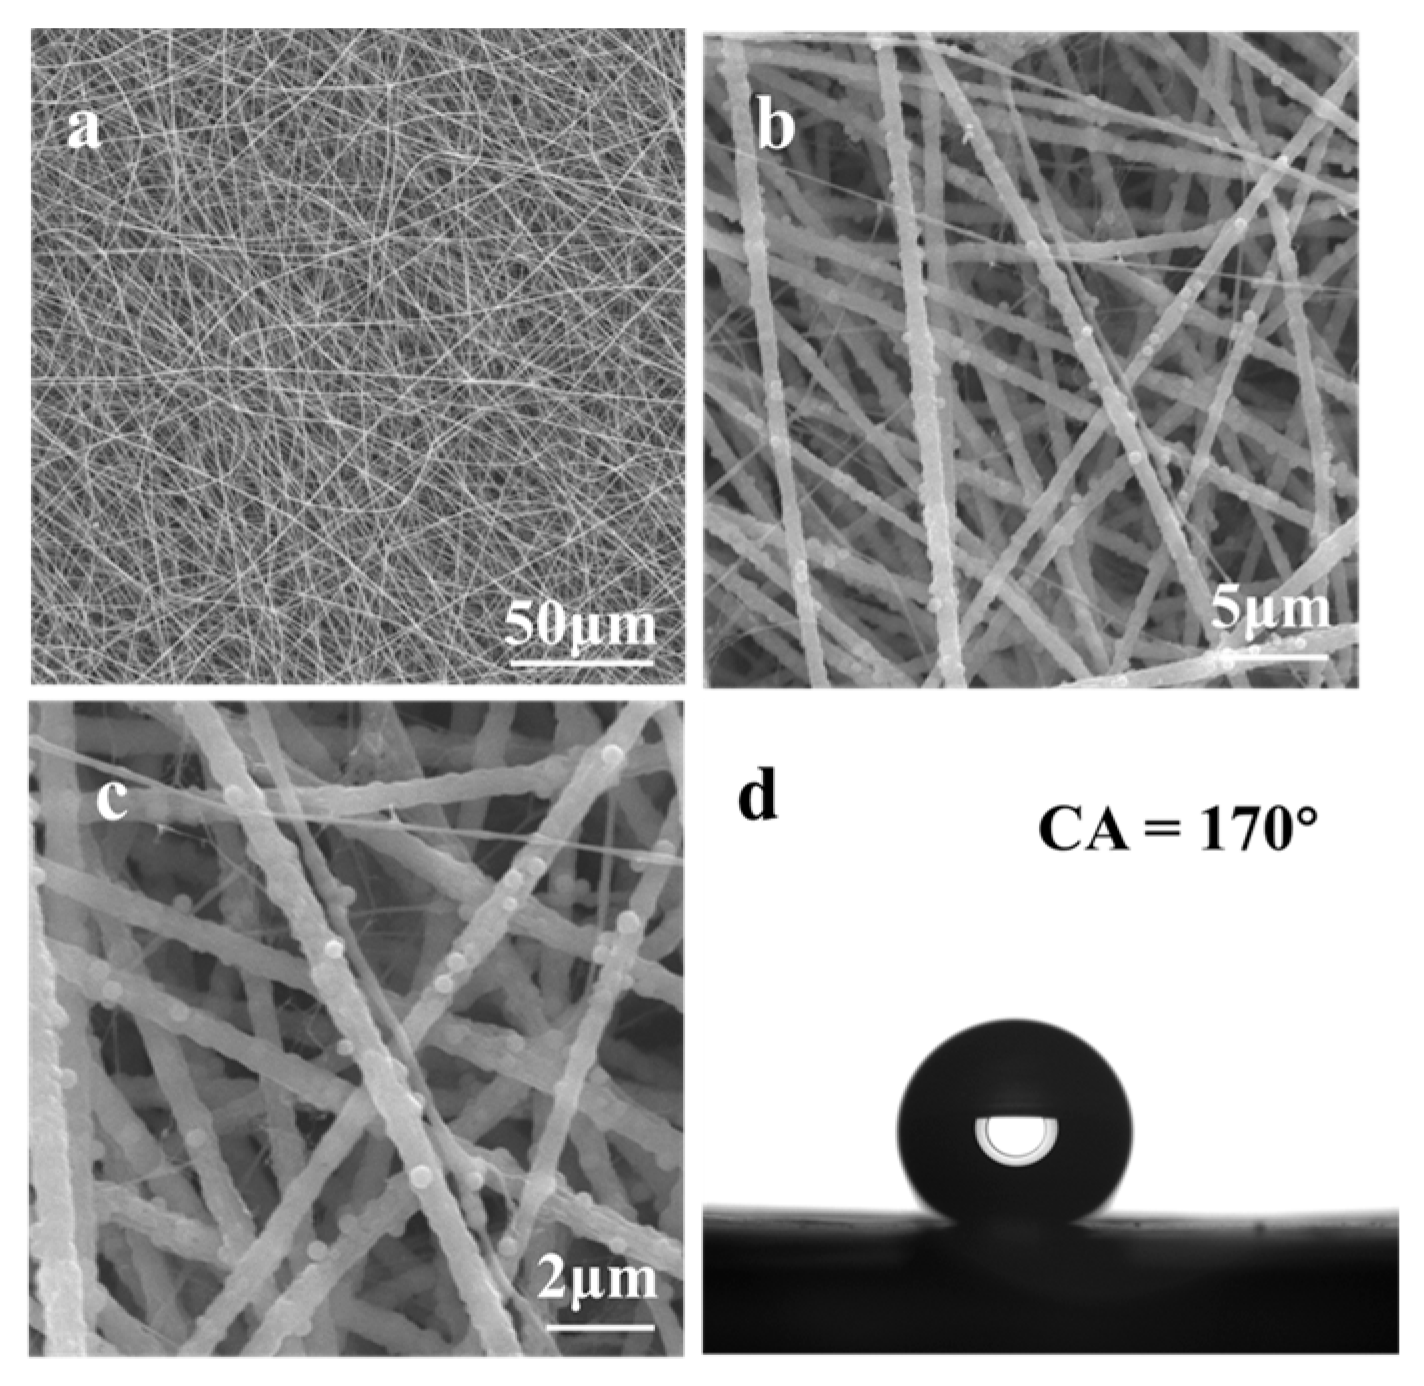
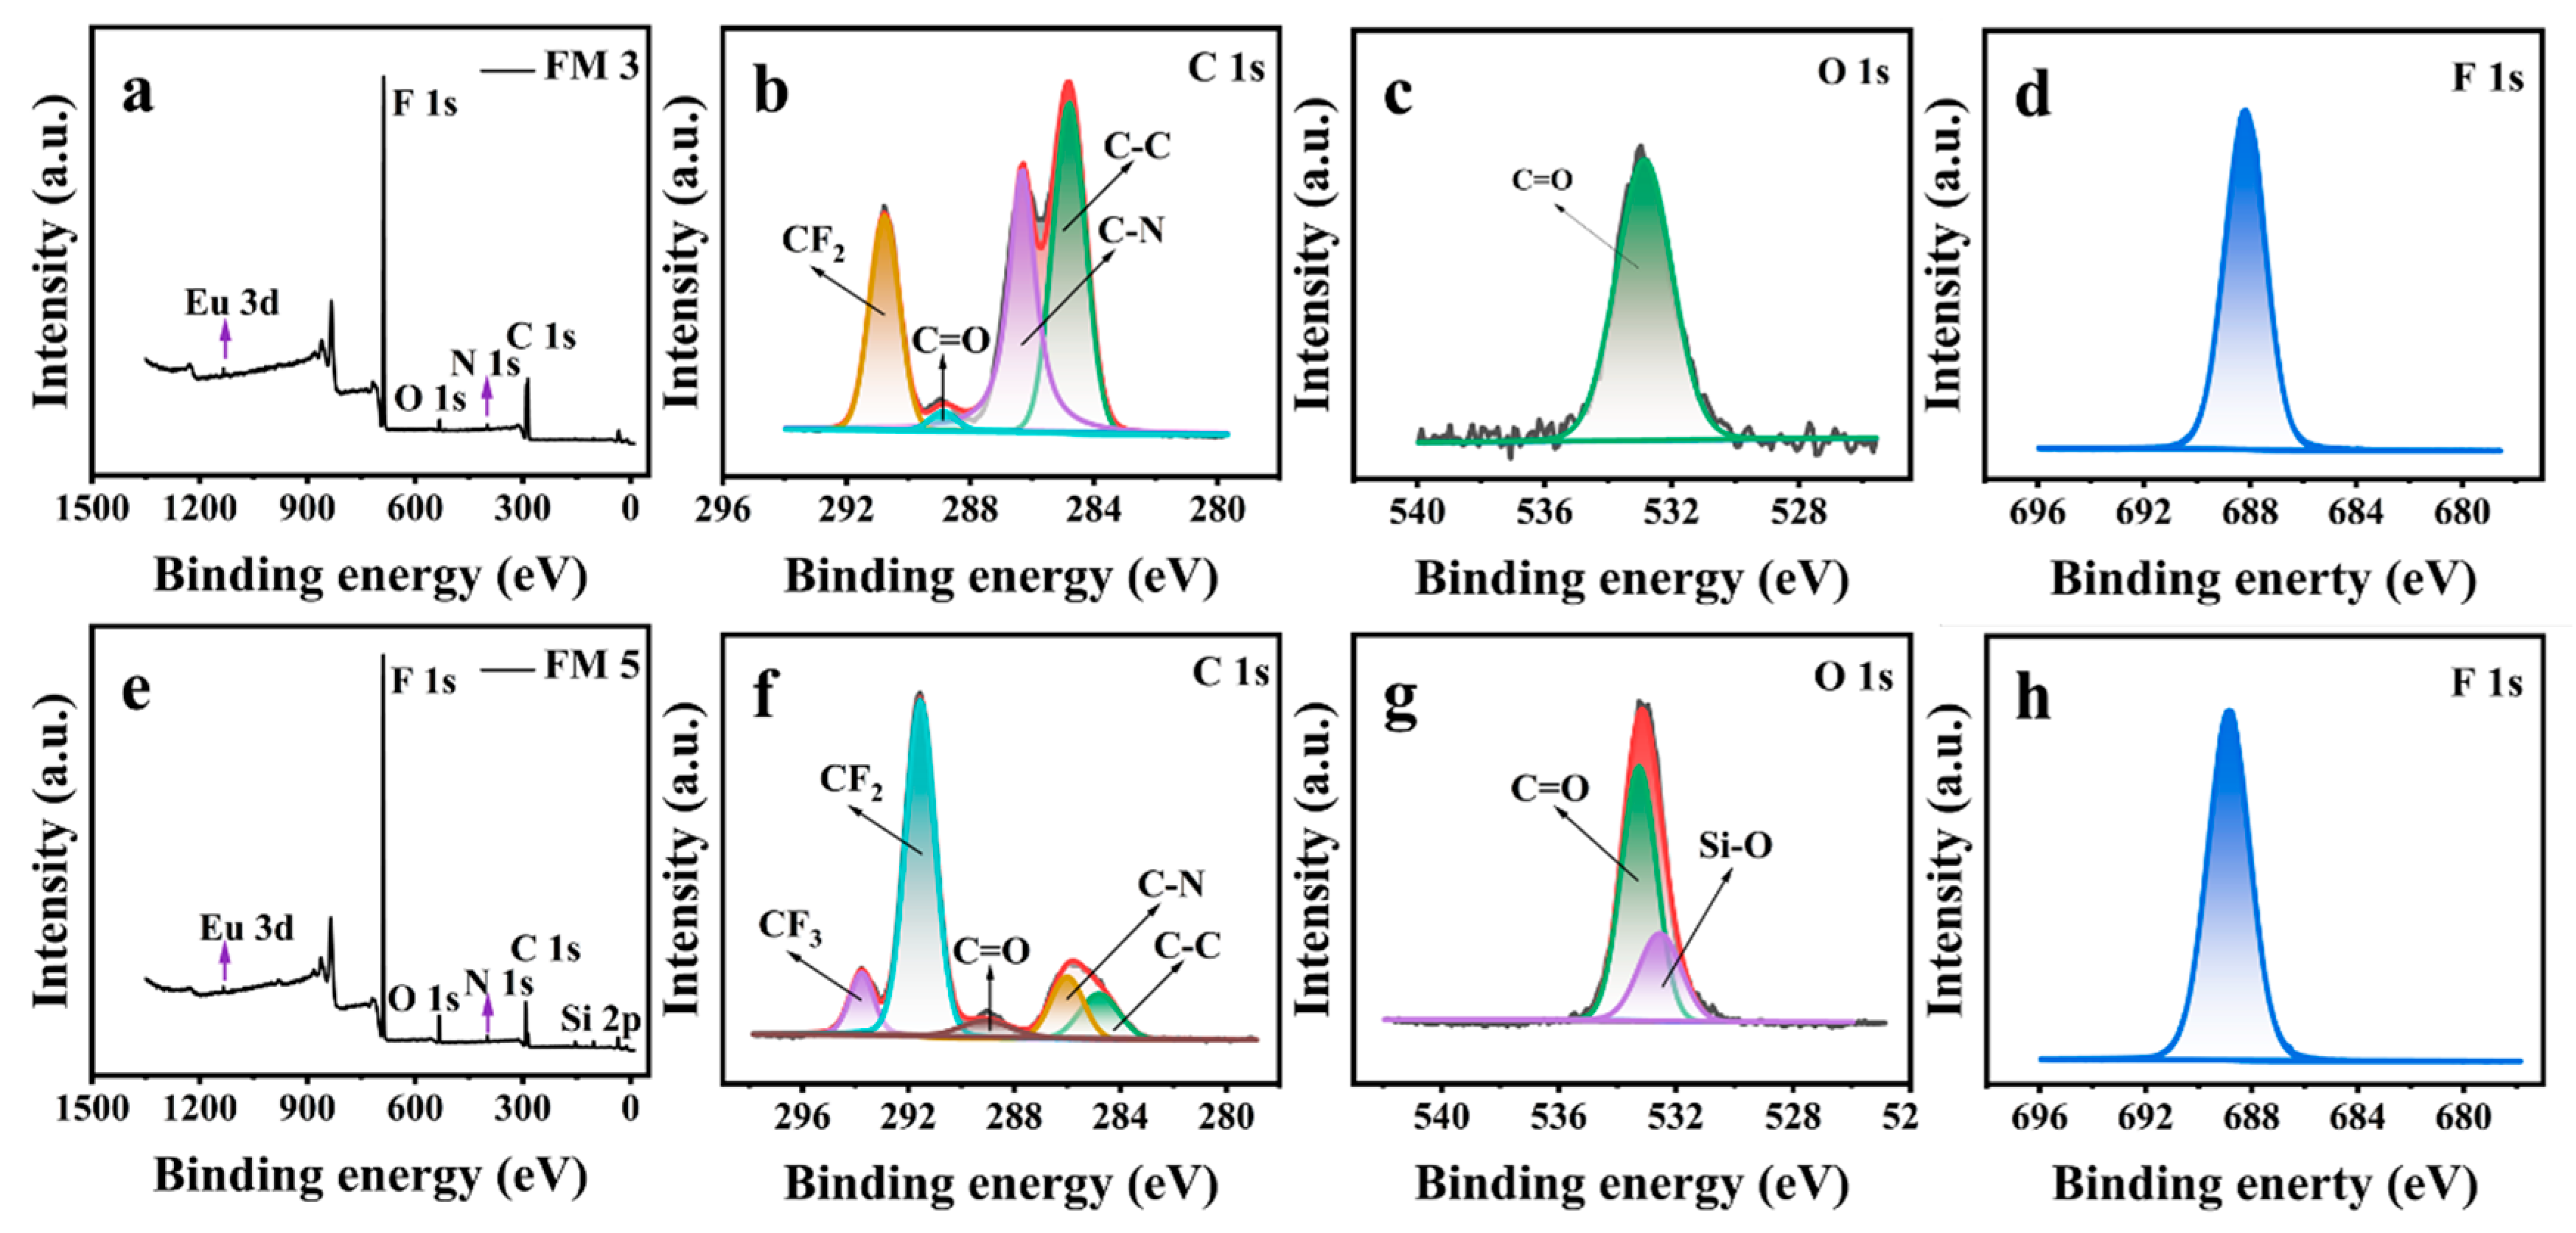
4.1. Surface Morphology, Surface Chemistry, and Water Repellency of Cr(VI) Sensor

Our Cr(VI) sensor consists of a nanofibrous membrane electrospun with a blend of polyvinylidene fluoride (PVDF), silica particles, and Eu(TTA)3Phen complex (Figure 1). In order to evaluate the influence of Eu3+ complex, silica particles, and fluoroalkyl chemistry on the photophysical properties and water repellency of our Cr(VI) sensor, we fabricated five nanofibrous membranes (see Section 2) by electrospinning: Eu3+ complex only (FM 1), PVDF only (FM 2), PVDF + Eu3+ complex (FM 3), PVDF + Eu3+ complex + silica particles (FM 4), and modifying FM 4 with 1H,1H,2H,2H-Perfluorooctyltrichlorosilane (PFOTS) to impart fluoroalkyl chemistry (FM 5; our Cr(VI) sensor). We characterized the surface morphology of our nanofibrous membranes using scanning electron microscopy (SEM). The SEM images of FM 2 (Figure S3a–c), FM 3 (Figure S3e–g), FM 4 (Figure S3i–k), and FM 5 (Figure 2a–c) indicate a nanofibrous morphology. It is evident that silica particles in FM 4 and FM 5 provide additional texture. After surface modification with PFOTS, FM 5 (i.e., Cr(VI) sensor) displayed superhydrophobicity due to a combination of the texture imparted by silica particles and the low solid surface energy imparted by PFOTS. Figure 2d shows that the sensor displays a water static contact angle of 170° and Movie S1 shows water droplets easily rolling off the sensor at a 5° tilt angle, demonstrating the sensor’s superhydrophobicity. Further, the sensor was also extremely repellent to aqueous droplets containing different concentrations of Cr(VI), and a series of metal cations and anions (Figures S4–S6). We characterized the surface chemistry of our nanofibrous membranes using X-ray photoelectron spectroscopy (XPS). Figure 3 shows a comparison of the XPS spectra of FM 3 (PVDF + Eu3+ complex) and FM 5 (PVDF + Eu3+ complex + silica particles, and subsequent surface modification; our Cr(VI) sensor). Comparison of the survey spectra (Figure 3a,e) indicates the presence of Eu 3d, F 1s, O 1s, N 1s, and C 1s peaks in both FM 3 and FM 5, and the presence of a Si 2p peak only in FM 5. This implies that PVDF and Eu3+ complexes are present in both FM 3 and FM 5, and silica particles are present only in FM 5. Comparison of the high-resolution C 1s spectra (Figure 3b,f) indicates the presence of -CF2, C=O, C-N, and C-C peaks in both FM 3 and FM 5, and the presence of a -CF3 peak only in FM 5. This indicates the fluorination on FM 5 due to surface modification with PFOTS. Comparison of high-resolution O 1s spectra (Figure 3c,g) indicates the presence of a C=O peak in both FM 3 and FM 5, and the presence of Si-O peak only in FM 5. This implies the presence of silica particles only in FM 5. Comparison of high-resolution F 1s spectra (Figure 3d,h) indicates the presence of a F 1s peak in both FM 3 and FM 5, as expected.
We also characterized the surface composition of FM 5 (i.e., our Cr(VI) sensor) through elemental mapping using energy dispersive X-ray spectroscopy (EDS; Figure S7). EDS elemental mappings indicate the presence of F, Si, Eu, O, N, S, and C in FM 5. This implies the presence of PVDF, silica particles, and Eu3+ complex in FM 5. We characterized the composition of nanofibrous membranes using Fourier-transform infrared spectroscopy (FTIR; see Supplementary Materials, Figure S8). The FTIR spectra indicate the presence of a Si-O group (peak at 1100 cm−1) only in FM 4 and FM 5. The presence of -CF (peak at 1158 cm−1), -CF2 (peak at 1450 cm−1), and -CF3 (peak at 1240 cm−1) groups only on the FTIR spectrum of FM 5 imply surface fluorination due to PFOTS. We characterized the melt temperatures of nanofibrous membranes using differential scanning calorimetry (DSC). The DSC curves (Figure S9) indicate that there is no change in the phase and melt temperatures due to incorporation of silica particles and Eu3+ complex in nanofibrous membranes. We also determined the phases of PVDF and crystal planes of silica particles using X-ray diffraction (Supplementary Materials, Figure S10).

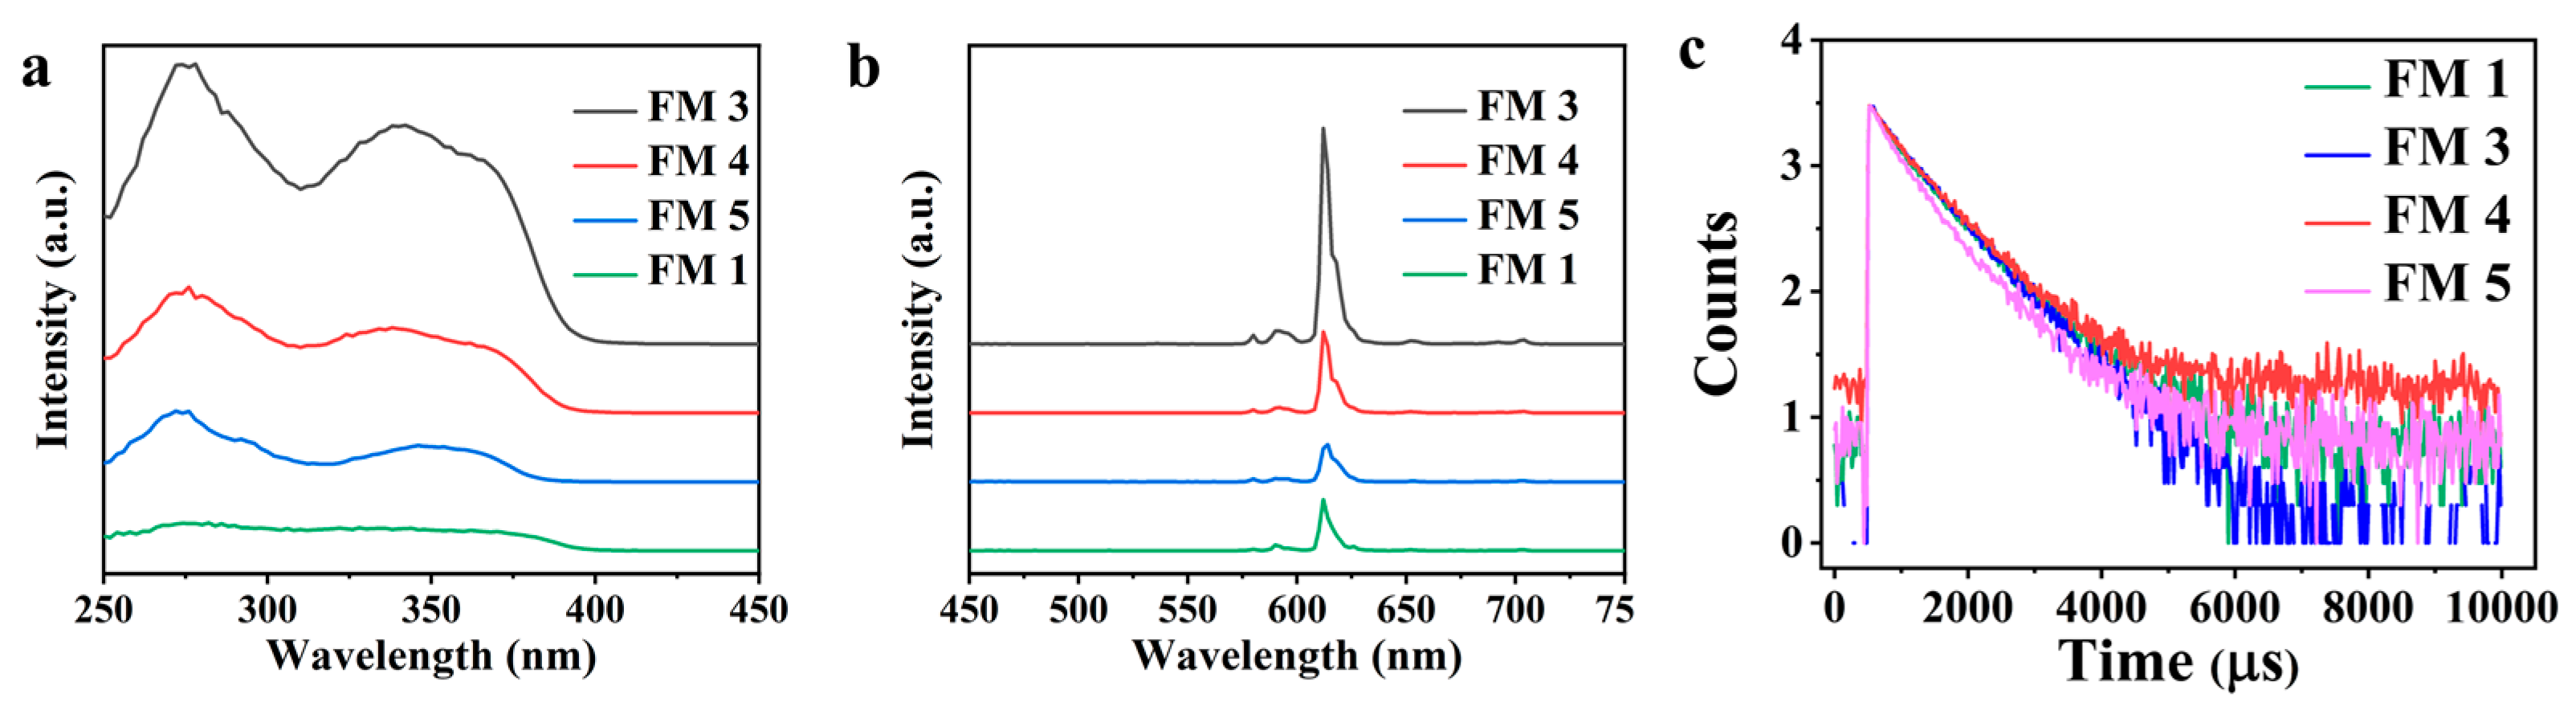
4.2. Photophysical Properties of Cr(VI) Sensor

We characterized the photophysical properties of our Cr(VI) sensor (i.e., FM 5) using fluorescence spectra. The fluorescence excitation and emission spectra on all samples containing an Eu3+ complex (i.e., FM 1, FM 3, FM 4, FM 5) displayed an excitation peak between 300 nm and 400 nm, which is primarily attributed to the excitation of the Eu3+ complex, and a sharp emission peak at 612 nm (Figure 4a), which corresponds to the Eu3+ energy level transitions, 5D07FJ (J = 0 at 579 nm, 1 at 590 nm, 2 at 612 nm, 3 at 651 nm, and 4 at 702 nm). All the samples show only one line transition for a non-degenerate electric dipole mechanism. To understand the energy transfer mechanism during fluorescence, we determined the lowest singlet and triplet excitation states of Eu3+, TTA, and Phen. The peaks at 23,999 cm−1 (417 nm) and 26,616 cm−1 (376 nm) correspond to the triplet state (3ππ*) of TTA and Phen, respectively. The peaks at 27,195 cm−1 (368 nm) and 31,080 cm−1 (322 nm) correspond to the excited state (S1) of TTA and Phen, respectively. The emission energy of 5D0 for Eu3+ lies at 16,352 cm−1. The energy difference between 5D2 of Eu3+ (456 nm) and triplet state of the TTA is 4669 cm−1, indicating a triplet (T1) excitation of TTA to 5D2 of Eu3+ excited triplet (T1) by intersystem crossing. The fluorescence intensity depends on the energy transfer resulting from the excitation in Eu3+ complex and is a critical parameter that determines the sensitivity. It must be noted that the fluorescence intensity of our Cr(VI) sensor (i.e., FM 5) is lower compared to the other samples (i.e., FM 1, FM 3, FM 4). This is due to the reduced bond coordination between Eu3+ ions in Eu3+ complex and fluorine atoms of PVDF, interference due to silica particles [40,41], and surface fluorination due to surface modification with PFOTS.
We further investigated the fluorescence properties by evaluating the fluorescence decay and fluorescence quantum yield (Φtot) of all samples (i.e., FM 1, FM 3, FM 4, FM 5). The measured fluorescence lifetimes (τobs) of FM 1, FM 3, FM 4, and FM 5 were 720, 700, 726, and 626 μs, respectively (Figure 4b and Table 1). Fluorescence quantum yield (Φtot) was determined using Equations 1–3 as [13,42]:
ϕ t o t = ϕ s e n ϕ E u  
ϕ E u = A R A D A R A D + A N R = τ o b s τ R A D
τ R A D = 1   A R A D = 1 A M D , 0 × n 3 × I t o t I M D  
Here, Φsen is the energy transfer sensitization, ΦEu is the intrinsic quantum yield, ARAD is the radiative decay rate, ANR is the non-reactive decay rate, τRAD is the radiative lifetime, AMD,0 is the spontaneous emission probability of magnetic dipole (MD) 5D07F1 transition (14.65 s−1), and n is the refractive index of the medium (1.42 for PVDF).
Table 1 indicates a lower fluorescence lifetime (τobs = 626.30 μs) and a lower quantum yield (Φtot = 27.87%) on the Cr(VI) sensor (i.e., FM 5) compared to FM 1 (Φtot = 66.02%, τobs = 726.32 μs), FM 3 (Φtot = 45.61%, τobs = 700.84 μs), and FM 4 (Φtot = 33.74%, τobs = 720.04 μs). This is due to the silica particles and surface fluorination of the Cr(VI) sensor.
We investigated the sensitivity of our Cr(VI) sensor by detecting Cr(VI) in aqueous droplets for different Cr(VI) concentrations (i.e., 1 μM to 80 μM). Figure 5a shows an overlap between the excitation spectrum of Cr(VI) sensor (i.e., FM 5) and absorption spectrum of Cr(VI) at different concentrations. It also illustrates that the increasing concentration of Cr(VI) in aqueous droplets results in increasing absorption intensities. Consequently, the emission intensities of our Cr(VI) sensor are suppressed with increasing Cr(VI) concentrations in aqueous droplets. This is referred to as fluorescence quenching [17,43]. Figure 5b shows a dramatic suppression in the emission intensity at high Cr(VI) concentrations, and the fluorescence activity is completely quenched at 200 μM concentration. We further determined the limit of detection (LOD) of our sensor based on the quantitative analysis of the quenching efficiency using the Stern–Volmer equation: F0/F = 1 + Ksv [C] [44]. Here, F0 is the fluorescence intensity of the sensor without a droplet, F is the fluorescence intensity of the sensor with a droplet, C is the Cr(VI) concentration, and Ksv is the Stern–Volmer constant. The fluorescence intensity (F0/F) linearly increases with Cr(VI) concentration in the range of 1–60 μM, with a correlation coefficient of R2 = 0.95544 (see the inset in Figure 5b). We calculated the LOD using 3σ/Ksv, where σ is the standard deviation. The LOD of our Cr(VI) sensor is 0.44 μM (i.e., 45.76 μg L−1), which indicates a high sensitivity.
We also investigated the selectivity of our Cr(VI) sensor using a series of metal cations (Ba2+, Ca2+, K+, Mg2+, Mn2+, Na+) and anions (F, Br, Cl, I, HSO4 and CH3COO) in aqueous droplets. Figure 5c,e show the UV-vis absorption spectra of aqueous droplets containing different metal cations and anions, respectively. The absorption band between 310 nm and 405 nm appears only with Cr(VI) and is not present with the metal cations and anions. Furthermore, the spectral overlap between the excitation of Eu3+ complex and absorption of Cr(VI) resulted in fluorescence quenching due to IFE enabling the detection of Cr(VI) in aqueous droplets. The fluorescent intensity decreased with increasing concentration of Cr(VI). Interestingly, the sensing mechanism could be proposed to be static quenching due to no effect on the fluorescence decay rates for the Cr(VI) fluorescent sensor (Table 1). Consequently, the presence of metal cations and anions in the aqueous droplet has no discernible effect on fluorescence quenching (Figure 5d,f) even at a high concentration (i.e., 0.1 M). This demonstrates the high selectivity of our Cr(VI) sensor even at high concentrations of metal cations and anions in aqueous droplets.

5. Conclusions

In conclusion, we developed a Eu3+ complex-based fluorescence sensor for Cr(VI) detection in water droplets. We fabricated our Cr(VI) sensor by electrospinning Eu3+ complex, PVDF, and silica particles. Furthermore, the spectral overlap between the excitation of Eu3+ complex and absorption of Cr(VI) resulted in fluorescence quenching due to IFE enabling the detection of Cr(VI) in aqueous droplets. Our Cr(VI) sensor displayed high sensitivity with a LOD of 0.44 μM (i.e., 45.76 μg L−1) and high selectivity. We anticipate that our results will open prospects for the design of novel inexpensive and fast Cr(VI) sensors.

Supplementary Materials

The following supporting information can be downloaded at: https://www.mdpi.com/article/10.3390/nano13182574/s1, Section S1: Morphology of Silica Particles; Section S2: Cr(VI) Detection in Aqueous Droplets; Section S3: Surface Morphology and Water Repellency of Nanofibrous Membranes; Section S4: Repellency of Our Cr(VI) Sensor to Aqueous Droplets with Different Concentrations of Cr(VI); Section S5: Repellency of Our Cr(VI) Sensor to Aqueous Droplets with Different Metal Cations; Section S6: Repellency of Our Cr(VI) Sensor to Aqueous Droplets with Different Anions; Section S7: Energy Dispersive X-Ray Spectroscopy of Our Cr(VI) Sensor; Section S8: Fourier-Transform Infrared Spectroscopy (FTIR) of Nanofibrous Membranes; Section S9: Differential Scanning Calorimetry (DSC) of nanofibrous membranes; Section S10: X-Ray Diffraction (XRD).

Author Contributions

J.T. and A.K.K. conceived the idea. W.D., S.V., J.L., X.W., Y.Z., Y.W.(Yao Wang), Q.T., Y.W.(Yanxin Wang) and X.Z. conducted experiments. W.D., S.V., J.L., A.K.K. and J.T. conducted the analysis. W.D., S.V., J.L., A.K.K. and J.T. wrote the manuscript. All authors have read and agreed to the published version of the manuscript.

Funding

This work was supported by State Key Projects of International Cooperation Research (2017YFE0108300, 2016YFE0110800), National Natural Science Foundation of China (51473082), the National High-End Foreign Expert of China, the Double Hundred Foreign Expert Project of Shandong Province (2018-2021), the Program for Introducing Talents of Discipline to Universities (“111” plan).

Data Availability Statement

The data that support the findings of this study are available from the corresponding author upon reasonable request.

Conflicts of Interest

The authors declare no conflict of interest.

References

  1. Sun, Z.; Yang, M.; Ma, Y.; Li, L. Multi-Responsive Luminescent Sensors Based on Two-Dimensional Lanthanide–Metal Organic Frameworks for Highly Selective and Sensitive Detection of Cr(III) and Cr(VI) Ions and Benzaldehyde. Cryst. Growth Des. 2017, 17, 4326–4335. [Google Scholar] [CrossRef]
  2. Zhou, A.-M.; Wei, H.; Gao, W.; Liu, J.-P.; Zhang, X.-M. Two 2D multiresponsive luminescence coordination polymers for selective sensing of Fe3+, CrVI anions and TNP in aqueous medium. CrystEngComm 2019, 21, 5185–5194. [Google Scholar] [CrossRef]
  3. Dutta, A.; Mahapatra, M.; Deb, M.; Mitra, M.; Dutta, S.; Chattopadhyay, P.K.; Banerjee, S.; Sil, P.C.; Maiti, D.K.; Singha, N.R. Fluorescent Terpolymers Using Two Non-Emissive Monomers for Cr(III) Sensors, Removal, and Bio-Imaging. ACS Biomater. Sci. Eng. 2020, 6, 1397–1407. [Google Scholar] [CrossRef] [PubMed]
  4. Gu, T.Y.; Dai, M.; Young, D.J.; Ren, Z.G.; Lang, J.P. Luminescent Zn(II) Coordination Polymers for Highly Selective Sensing of Cr(III) and Cr(VI) in Water. Inorg. Chem. 2017, 56, 4669–4679. [Google Scholar] [PubMed]
  5. Singh, M.; Senthilkumar, S.; Rajput, S.; Neogi, S. Pore-Functionalized and Hydrolytically Robust Cd(II)-Metal-Organic Framework for Highly Selective, Multicyclic CO2 Adsorption and Fast-Responsive Luminescent Monitoring of Fe(III) and Cr(VI) Ions with Notable Sensitivity and Reusability. Inorg. Chem. 2020, 59, 3012–3025. [Google Scholar] [CrossRef]
  6. World Health Organization. Chromium in Drinking-Water; World Health Organization: Geneva, Switzerland, 2020.
  7. Li, P.; Yin, X.-M.; Gao, L.-L.; Yang, S.-L.; Sui, Q.; Gong, T.; Gao, E.-Q. Modulating Excitation Energy of Luminescent Metal–Organic Frameworks for Detection of Cr(VI) in Water. ACS Appl. Nano Mater. 2019, 2, 4646–4654. [Google Scholar] [CrossRef]
  8. Lv, R.; Wang, J.; Zhang, Y.; Li, H.; Yang, L.; Liao, S.; Gu, W.; Liu, X. An amino-decorated dual-functional metal–organic framework for highly selective sensing of Cr(iii) and Cr(vi) ions and detection of nitroaromatic explosives. J. Mater. Chem. A 2016, 4, 15494–15500. [Google Scholar] [CrossRef]
  9. Aleem, A.R.; Ding, W.; Liu, J.; Li, T.; Guo, Y.; Wang, Q.; Wang, Y.; Wang, Y.; Rehman, F.U.L.; Kipper, M.J.; et al. Visible-light excitable Eu(3+)-induced hyaluronic acid-chitosan aggregates with heterocyclic ligands for sensitive and fast recognition of hazardous ions. Int. J. Biol. Macromol. 2021, 184, 188–199. [Google Scholar] [CrossRef]
  10. Lin, D.; Wu, J.; Wang, M.; Yan, F.; Ju, H. Triple signal amplification of graphene film, polybead carried gold nanoparticles as tracing tag and silver deposition for ultrasensitive electrochemical immunosensing. Anal. Chem. 2012, 84, 3662–3668. [Google Scholar] [CrossRef]
  11. Prakash, A.; Chandra, S.; Bahadur, D. Structural, magnetic, and textural properties of iron oxide-reduced graphene oxide hybrids and their use for the electrochemical detection of chromium. Carbon 2012, 50, 4209–4219. [Google Scholar] [CrossRef]
  12. Wang, C.-X.; Xia, Y.-P.; Yao, Z.-Q.; Xu, J.; Chang, Z.; Bu, X.-H. Two luminescent coordination polymers as highly selective and sensitive chemosensors for Cr VI-anions in aqueous medium. Dalton Trans. 2019, 48, 387–394. [Google Scholar] [CrossRef] [PubMed]
  13. Aleem, A.R.; Liu, J.; Wang, J.; Wang, J.; Zhao, Y.; Wang, Y.; Wang, Y.; Wang, W.; Rehman, F.U.L.; Kipper, M.J.; et al. Selective Sensing of Cu2+ and Fe3+ Ions with Vis-Excitation using Fluorescent Eu3+-Induced Aggregates of Polysaccharides (EIAP) in Mammalian Cells and Aqueous Systems. J. Hazard. Mater. 2020, 399, 122991. [Google Scholar] [CrossRef] [PubMed]
  14. Wang, J.; Liu, J.; Wang, J.; Wang, Y.; Cao, J.; Hou, L.; Ge, R.; Chi, J.; Huang, L.; Guo, J.; et al. Smart sensing of Cu2+ in living cells by water-soluble and nontoxic Tb3+/Eu3+-induced aggregates of polysaccharides through fluorescence imaging. J. Mater. Chem. C 2020, 8, 8171–8182. [Google Scholar] [CrossRef]
  15. Alqarni, S.A. A Review on Conducting Polymers for Colorimetric and Fluorescent Detection of Noble Metal Ions (Ag+, Pd2+, Pt2+/4+, and Au3+). Crit. Rev. Anal. Chem. 2022, 1–12. [Google Scholar] [CrossRef] [PubMed]
  16. Das, D.D. Recent developments in fluorescent sensors for trace-level determination of toxic-metal ions. TrAC Trends Anal. Chem. 2012, 32, 113–132. [Google Scholar]
  17. Chang, H.C.; Ho, J.A. Gold Nanocluster-Assisted Fluorescent Detection for Hydrogen Peroxide and Cholesterol Based on the Inner Filter Effect of Gold Nanoparticles. Anal. Chem. 2015, 87, 10362–10367. [Google Scholar] [CrossRef]
  18. Zheng, M.; Xie, Z.; Qu, D.; Li, D.; Du, P.; Jing, X.; Sun, Z. On-off-on fluorescent carbon dot nanosensor for recognition of chromium(VI) and ascorbic acid based on the inner filter effect. ACS Appl. Mater. Interfaces 2013, 5, 13242–13247. [Google Scholar] [CrossRef]
  19. Binnemans, K. Lanthanide-based luminescent hybrid materials. Chem. Rev. 2009, 109, 4283–4374. [Google Scholar] [CrossRef]
  20. Kreno, L.E.; Leong, K.; Farha, O.K.; Allendorf, M.; Van Duyne, R.P.; Hupp, J.T. Metal–organic framework materials as chemical sensors. Chem. Rev. 2012, 112, 1105–1125. [Google Scholar] [CrossRef]
  21. Lian, X.; Yan, B. A dual-functional bimetallic-organic framework nanosensor for detection and decontamination of lachrymator in drinking water. Sens. Actuators B Chem. 2019, 281, 168–174. [Google Scholar] [CrossRef]
  22. Qu, X.-L.; Yan, B. Stable Tb (III)-based metal–organic framework: Structure, photoluminescence, and chemical sensing of 2-thiazolidinethione-4-carboxylic acid as a biomarker of CS2. Inorg. Chem. 2018, 58, 524–534. [Google Scholar] [CrossRef] [PubMed]
  23. Zhang, Y.; Yan, B. A portable self-calibrating logic detector for gradient detection of formaldehyde based on luminescent metal organic frameworks. J. Mater. Chem. C 2019, 7, 5652–5657. [Google Scholar] [CrossRef]
  24. Weng, G.; Thanneeru, S.; He, J. Dynamic coordination of Eu–iminodiacetate to control fluorochromic response of polymer hydrogels to multistimuli. Adv. Mater. 2018, 30, 1706526. [Google Scholar] [CrossRef] [PubMed]
  25. Hasan, Z.; Jhung, S.H. Removal of hazardous organics from water using metal-organic frameworks (MOFs): Plausible mechanisms for selective adsorptions. J. Hazard Mater. 2015, 283, 329–339. [Google Scholar] [CrossRef]
  26. Gao, E.; Wu, S.; Wang, J.; Zhu, M.; Zhang, Y.; Fedin, V.P. Water-Stable Lanthanide Coordination Polymers with Triple Luminescent Centers for Tunable Emission and Efficient Self-Calibration Sensing Wastewater Pollutants. Adv. Opt. Mater. 2020, 8, 1901659. [Google Scholar] [CrossRef]
  27. Burtch, N.C.; Jasuja, H.; Walton, K.S. Water stability and adsorption in metal-organic frameworks. Chem. Rev. 2014, 114, 10575–10612. [Google Scholar] [CrossRef]
  28. Wang, C.; Liu, X.; Keser Demir, N.; Chen, J.P.; Li, K. Applications of water stable metal-organic frameworks. Chem. Soc. Rev. 2016, 45, 5107–5134. [Google Scholar] [CrossRef]
  29. Liu, J.; Liu, Y.; Liu, Q.; Li, C.; Sun, L.; Li, F. Iridium(III) complex-coated nanosystem for ratiometric upconversion luminescence bioimaging of cyanide anions. J. Am. Chem. Soc. 2011, 133, 15276–15279. [Google Scholar] [CrossRef]
  30. Tan, L.; Li, Y.; Wu, X.; Liu, W.; Peng, Z.; Dong, Y.; Huang, Z.; Zhang, L.; Liang, Y. Fluorescent sensor array based on Janus silica nanoflakes to realize pattern recognition of multiple aminoglycoside antibiotics and heavy metal ions. Sens. Actuators B Chem. 2023, 378, 133154. [Google Scholar] [CrossRef]
  31. Melnikov, A.G.; Bykov, D.A.; Varezhnikov, A.S.; Sysoev, V.V.; Melnikov, G.V. Toward a Selective Analysis of Heavy Metal Salts in Aqueous Media with a Fluorescent Probe Array. Sensors 2022, 22, 1465. [Google Scholar] [CrossRef]
  32. Amin, Z.; Rauf, T.; Jan, Q.; Kuchey, M.Y.; Sofi, F.A.; Ismail, T.; Rashid, A.; Bhat, B.A.; Sidiq, N.; Bhat, M.A. Synthesis of a Novel Hydrazone Functionality based Spectrophotometric Probe for Selective and Sensitive Estimation of Toxic Heavy Metal Ions. ChemistrySelect 2023, 8, e202202632. [Google Scholar] [CrossRef]
  33. Spanu, D.; Monticelli, D.; Binda, G.; Dossi, C.; Rampazzi, L.; Recchia, S. One-minute highly selective Cr(VI) determination at ultra-trace levels: An ICP-MS method based on the on-line trapping of Cr(III). J. Hazard. Mater. 2021, 412, 125280. [Google Scholar] [CrossRef] [PubMed]
  34. Wang, C.; Shang, M.; Wei, H.; Zhang, M.; Zou, W.; Meng, X.; Chen, W.; Shao, H.; Lai, Y. Specific and sensitive on-site detection of Cr(VI) by surface-enhanced Raman spectroscopy. Sens. Actuators B Chem. 2021, 346, 130594. [Google Scholar] [CrossRef]
  35. Ezebuiro, P.; Gandhi, J.; Zhang, C.L.; Mathew, J.; Ritter, M.; Humphrey, M. Optimal Sample Preservation and Analysis of Cr(VI) in Drinking Water Samples by High Resolution Ion Chromatography Followed by Post Column Reaction and UV/Vis Detection. J. Anal. Sci. Methods Instrum. 2012, 2, 74–80. [Google Scholar] [CrossRef]
  36. Wang, W.; Sun, J.; Vallabhuneni, S.; Pawlowski, B.; Vahabi, H.; Nellenbach, K.; Brown, A.C.; Scholle, F.; Zhao, J.; Kota, A.K. On-demand, remote and lossless manipulation of biofluid droplets. Mater. Horiz. 2022, 9, 2863–2871. [Google Scholar] [CrossRef]
  37. Vallabhuneni, S.; Movafaghi, S.; Wang, W.; Kota, A.K. Superhydrophobic coatings for improved performance of electrical insulators. Macromol. Mater. Eng. 2018, 303, 1800313. [Google Scholar] [CrossRef]
  38. Li, X.; Wang, J.; Liu, J.I. Strong luminescence and sharp heavy metal ion sensitivity of water-soluble hybrid polysaccharide nanoparticles with Eu 3+ and Tb 3+ inclusions. Appl. Nanosci. 2019, 9, 1833–1844. [Google Scholar] [CrossRef]
  39. Zhang, Y.; Wang, X.; Tang, J.; Wang, W.; Wang, J.; Belfiore, L.A. Strong enhancement effect of silver nanowires on fluorescent property of Eu3+-ligand complexes and desired fluorescent iPP composite materials. Opt. Mater. 2017, 66, 17–22. [Google Scholar] [CrossRef]
  40. Feng, J.; Zhang, H. Hybrid materials based on lanthanide organic complexes: A review. Chem. Soc. Rev. 2013, 42, 387–410. [Google Scholar] [CrossRef]
  41. Shahi, P.K.; Singh, A.K.; Singh, S.K.; Rai, S.B.; Ullrich, B. Revelation of the Technological Versatility of the Eu(TTA)3Phen Complex by Demonstrating Energy Harvesting, Ultraviolet Light Detection, Temperature Sensing, and Laser Applications. ACS Appl. Mater. Interfaces 2015, 7, 18231–18239. [Google Scholar] [CrossRef]
  42. Freslon, S.; Luo, Y.; Daiguebonne, C.; Calvez, G.; Bernot, K.; Guillou, O. Brightness and Color Tuning in a Series of Lanthanide-Based Coordination Polymers with Benzene-1,2,4,5-tetracarboxylic Acid as a Ligand. Inorg. Chem. 2016, 55, 794–802. [Google Scholar] [CrossRef] [PubMed]
  43. Dong, B.; Li, H.; Mujtaba Mari, G.; Yu, X.; Yu, W.; Wen, K.; Ke, Y.; Shen, J.; Wang, Z. Fluorescence immunoassay based on the inner-filter effect of carbon dots for highly sensitive amantadine detection in foodstuffs. Food Chem. 2019, 294, 347–354. [Google Scholar] [CrossRef] [PubMed]
  44. Zhao, F.; Guo, X.Y.; Dong, Z.P.; Liu, Z.L.; Wang, Y.Q. 3D Ln(III)-MOFs: Slow magnetic relaxation and highly sensitive luminescence detection of Fe(3+) and ketones. Dalton Trans. 2018, 47, 8972–8982. [Google Scholar] [CrossRef] [PubMed]
Figure 1. Schematic illustrating the fabrication of our Cr(VI) sensor.
Nanomaterials 13 02574 g001
Figure 2. (ac) SEM images of our Cr(VI) sensor at different magnifications. (d) A 3 μL water droplet beading up on our Cr(VI) sensor.
Nanomaterials 13 02574 g002
Figure 3. (ad) Full survey XPS spectrum, high-resolution C 1s spectrum, high-resolution O 1s spectrum, and high-resolution F 1s spectrum of FM 3, respectively. (eh) Full survey XPS spectrum, high-resolution C 1s spectrum, high-resolution O 1s spectrum, and high-resolution F 1s spectrum of FM 5 (i.e., our Cr(VI) sensor), respectively.
Nanomaterials 13 02574 g003
Figure 4. (a) The emission spectra of different samples. (b) The excitation spectra of different samples. (c) Fluorescence lifetime of the samples.
Nanomaterials 13 02574 g004
Figure 5. (a) Spectral overlap between the excitation of our Cr(VI) sensor (i.e., FM 5) and absorption of aqueous droplets with Cr(VI) at different concentrations. (b) Fluorescence quenching on our Cr(VI) sensor with aqueous droplets with different concentrations of Cr(Ⅵ). Inset shows Stern–Volmer plot of the sensor quenched by Cr(VI) aqueous droplets. (c,d) The UV-Vis absorption spectra and fluorescence response, respectively, from aqueous droplets with different metal cations at 0.1 M concentration. (e,f) The UV-Vis absorption spectra and fluorescence response, respectively, from aqueous droplets with different anions at 0.1 M concentration. Insets in (d,f) show F0/F = 1, indicating no discernible effect in fluorescence quenching.
Nanomaterials 13 02574 g005
Table 1. Photophysical properties of the samples.
Sampleτobs (μs) ARAD (s−1) ANR (s−1) ΦEu (%) Φtot (%)
FM 1720.04372.251011.526.9066.02
FM 3700.84683.55743.347.9145.61
FM 4726.32628.44760.445.2533.74
FM 5626.30476.27952.829.8327.87
Disclaimer/Publisher’s Note: The statements, opinions and data contained in all publications are solely those of the individual author(s) and contributor(s) and not of MDPI and/or the editor(s). MDPI and/or the editor(s) disclaim responsibility for any injury to people or property resulting from any ideas, methods, instructions or products referred to in the content.

