Article

Fabrication and Characterization of Tantalum–Iron Composites for Photocatalytic Hydrogen Evolution

1
Solar Energy Research Group, Environment and Sustainability Institute, Faculty of Environment, Science and Economy, University of Exeter, Penryn Campus, Cornwall TR10 9FE, UK
2
Faculty of Environment, Science and Economy, University of Exeter, Exeter EX4 4QF, UK
*
Authors to whom correspondence should be addressed.
Nanomaterials 2023, 13(17), 2464; https://doi.org/10.3390/nano13172464
Submission received: 9 August 2023 / Revised: 28 August 2023 / Accepted: 29 August 2023 / Published: 31 August 2023
(This article belongs to the Special Issue Photocatalytic Ability of Composite Nanomaterials)

Abstract

:
Photocatalytic hydrogen evolution represents a transformative avenue in addressing the challenges of fossil fuels, heralding a renewable and pristine alternative to conventional fossil fuel-driven energy paradigms. Yet, a formidable challenge is crafting a high-efficacy, stable photocatalyst that optimizes solar energy transduction and charge partitioning even under adversarial conditions. Within the scope of this investigation, tantalum–iron heterojunction composites characterized by intricate, discoidal nanostructured materials were meticulously synthesized using a solvothermal-augmented calcination protocol. The X-ray diffraction, coupled with Rietveld refinements delineated the nuanced alterations in phase constitution and structural intricacies engendered by disparate calcination thermal regimes. An exhaustive study encompassing nano-morphology, electronic band attributes, bandgap dynamics, and a rigorous appraisal of their photocatalytic prowess has been executed for the composite array. Intriguingly, the specimen denoted as 1000-1, a heterojunction composite of TaO2/Ta2O5/FeTaO4, manifested an exemplary photocatalytic hydrogen evolution capacity, registering at 51.24 µmol/g, which eclipses its counterpart, 1100-1 (Ta2O5/FeTaO4), by an impressive margin. Such revelations amplify the prospective utility of these tantalum iron matrices, endorsing their candidacy as potent agents for sustainable hydrogen production via photocatalysis.

1. Introduction

Due to the continuous accumulation of greenhouse gases in the atmosphere, caused mainly by human activities, extreme weather phenomena such as hurricanes, heatwaves, floods, and wildfires are occurring more frequently and with greater intensity [1]. The rise in this extreme weather has highlighted the significance of producing and using hydrogen fuel as a cleaner and more reliable energy source [2]. Governments, researchers, and businesses are stepping up their efforts to unlock the potential of hydrogen in our everyday lives and to incorporate it into our energy systems due to the urgency to mitigate climate change and advance energy sustainability [2,3]. Photocatalytic hydrogen evolution has emerged as a promising path in this quest, leveraging the extraordinary capabilities of particular materials known as photocatalysts to harness solar energy to facilitate hydrogen evolution from water splitting [4]. Some common photocatalyst materials, such as TiO2 [5], ZnO [6,7,8], Ga2O3 [9,10], CdO [11], CdS [12], MoS2 [13], g-C3N4 [14], BiVO4 [15], Ta2O5 [16], Fe2O3 [17], metal–organic frameworks (MOF) [18], and covalent organic frameworks (COF) [19], can absorb photons from sunlight and produce electron–hole pairs that drive redox processes, which ultimately cause water molecules to produce hydrogen and oxygen.
Continuous investigation and creation of novel photocatalysts are essential as they hold tremendous promise in dramatically improving the photocatalytic process’s efficiency, selectivity, and stability. These developments will make it more sustainable, economically feasible, and broadly applicable. Within this realm, there has been significant investigation of both iron- and tantalum-based photocatalysts in this area, motivated by the earth’s abundance, cost-effectiveness, and relatively high stability of iron, as well as tantalum’s corrosion resistance, stability in harsh environments, and biocompatibility. Researchers have embarked on an expedition to exploit the distinct benefits of these two elements, resulting in the development of tantalum-doped Fe2O3 [20,21] and iron-doped Ta2O5 [22,23], offering significant promise for photochemical water splitting, a critical technique for clean hydrogen generation; for instance, Chang et al. [21] demonstrated a low level of Ta-doped α-Fe2O3 nanorods for photoelectrochemical water splitting using in situ synchrotron X-ray absorption spectroscopy (XAS). According to the findings, doping α-Fe2O3 nanorods with low concentrations of Ta enhances its electronic conductivity and charge transfer, overcomes its intrinsic limits, and thus boots its photoelectrochemical water-splitting properties [21]. Iron incorporation into Ta2O5, on the other hand, can broaden the light absorption range into the visible spectrum, improving solar energy utilization efficiency [22,23]. By using the sol–gel process, Jing et al. [23] prepared Fe-doped mesoporous Ta2O5, which exhibited enhanced photocatalytic hydrogen evolution ability with a capacity of 20 µmol/h due to a notable shift in light absorption towards the visible light region brought about by the Fe ion doping.
FeTaO4 has recently garnered considerable attention in this landscape due to its unique electronic and crystal structure, high chemical stability, and long-term durability characteristics. Moreover, the design of this material intends to combine the capabilities of iron and tantalum, thereby encouraging the development of efficient, sustainable, and economically practical hydrogen evolution technologies and contributing to a greener and more renewable energy landscape. Fanjun’s group reported the development of a nano-sized FeTaO4/graphite hybrid composite for usage as an anode material in lithium-ion batteries [24]. The FeTaO4 nanoparticles are embedded in graphite nanosheets, resulting in excellent electrochemical performance with higher cycling ability and better capacity than bulk FeTaO4 [24]; additionally, Zhang et al. [25] successfully developed Fe2O3 and FeTaO4 core–shell nanorods on an F-doped SnO2 (FTO) substrate with notably enhanced photoelectrochemical (PEC) performance. The fabricated nanorods achieved a remarkable photocurrent density of 2.86 mA/cm2 at 1.23 VRHE under AM 1.5 G simulated sunlight with an intensity of 100 mW/cm2 [25].
However, FeTaO4 is a relatively unexplored material in photocatalytic hydrogen evolution. Herein, in this work, to address the existing gap in the utilization of FeTaO4 in photocatalytic hydrogen evolution, tantalum-oxide-doped FeTaO4 composites with circular sheet-like nanostructures were synthesized using a solvothermal-augmented calcination method. The crystalline phase and composition of prepared samples were investigated via XRD, Rietveld refinements, and X-ray photoelectron spectroscopy (XPS) analysis. The optical properties were investigated using UV-visible diffuse reflectance spectra (DRS) and a Tauc plot analysis. Additionally, scanning electron microscope (SEM), transmission electron microscopy (TEM), and ultraviolet photoelectron spectroscopy (UPS) were applied to demonstrate the morphology, crystallinity, and band structure of prepared tantalum–iron composites. Furthermore, the effect of calcination temperatures on the phase composition and particle size of synthesized composites has also been discussed. Additionally, a thorough analysis of their impact on the optical and photocatalytic hydrogen evolution capabilities has been supplied and comprehensively covered, offering insightful information that will help progress this crucial field of sustainable hydrogen production.

2. Experimental Section

2.1. Materials and Chemicals

Tantalum (Ⅴ) chloride (TaCl5, metal basis, 99.8%; Alfa Aesar, Heysham, UK), iron (Ⅲ) chloride anhydrous (FeCl3, laboratory reagent grade, ≥97%; Fisher Scientific, Loughborough, UK), N, N-Dimethylformamide (DMF, reagent grade, ≥99%; Honeywell, Seelze, Germany), ammonia solution (NH4OH, extra pure, 35%; Fisher Scientific, Loughborough, UK), and terephthalic acid (H2BDC, >99%; ACROS organics, Geel, Belgium) were used without further purification.

2.2. The Preparation Method of the Ta2O5/FeTaO4

A total of 1 mmol FeCl3 and 2.5 mmol H2BDC were dissolved into 75 mL of DMF. This mixture was then magnetically stirred for 30 min until a clear brown colour solution was obtained, then 1 mmol TaCl5 was added into the solution, changing the colour to yellow. An amount of 10 mL of ammonia solution was then used to adjust the pH of the solution to form a brown suspension. After further magnetically stirring for 30 min, the solution was transferred into a 100 mL Teflon-lined stainless-steel autoclave, sealed, and maintained at 150 °C for 12 h. When the autoclave cooled to room temperature, the precipitate was centrifuged and washed with ethanol several times before being dried in an oven at 70 °C for 12 h. Finally, the resultant powder was individually annealed at 1000 °C for 4 h to generate sample 1000-4 and 1100 °C for 1 h to produce sample 1100-1.

2.3. Photocatalytic Hydrogen Evolution Measurement

The photocatalytic hydrogen evolution experiment was conducted in a 530 mL side-irradiation glass reactor with two apertures sealed by two rubber septa under ambient temperature and atmospheric pressure. A Xenon lamp (Newport 66902, 300 W, Newport Spectra-Physics Ltd., Cheshire, UK) was used as the solar light source, which was placed 10 cm distant from the reactor. In total, 0.2 g of prepared tantalum–iron composites were disseminated in 470 mL of aqueous solution containing 35% methanol (v/v) as the sacrificial electron donor for the measurement. Before experimenting, dissolved oxygen was removed from the solution by constantly injecting nitrogen into the reactor while stirring for 30 min at 80 °C. After the reactor openings were all sealed, a 6 h photocatalytic hydrogen evolution procedure was carried out. For the gas analysis, 0.5 mL of headspace gas was manually injected into the gas chromatograph (GC) once every hour using a micro-injector to measure the hydrogen produced in the reactor.

2.4. Stability Study of Produced Samples for Photocatalytic Hydrogen Evolution

Following the measurement of photocatalytic hydrogen evolution, centrifugation was methodically used to separate the powder from the solution. After thoroughly washing with distilled water, the samples were reused without additional treatment. After four repetitions, the final powder was carefully collected and conservatively kept in preparation for the eventual XRD evaluation.

2.5. Photoelectrochemical Performance

The photoelectrochemical performance evaluation was performed using the Metrohm Autolab (PGSTAT302N) electrochemical workstation. A Pt wire was applied for the counter electrode, whereas the reference electrode was made of Ag/AgCl (4 M KCl). A 0.01 M NaOH solution with a pH of 12.8 was used as the electrolyte.
For the fabrication of the working electrode, the screen-printing technique was used. Initially, a solution of 1 g of ethyl-cellulose and 10 mL of ethanal was made, followed by ultrasonic dispersion at 60 °C for 12 h. Following that, magnetic stirring for 30 min produced a clear solution. Later, a slurry was created by blending 0.1 g of the prepared sample with 0.5 mL α-Terpineol and 0.5 mL of the previously described clear solution. This slurry was printed onto a 1 cm × 1 cm fluorine-doped tin oxide (FTO) glass substrate and annealed for 30 min at 450 °C. During the investigation, the transient photocurrent plots were generated over a 300 s duration using the Chrono amperometry (Δt > 1 ms) mode with a 30 s periodic light ON/OFF cycle. Furthermore, electrochemical impedance spectroscopy (ESI) results were collected from 100 kHz to 0.1 Hz, with an amplitude of 10 mV and a bias of 0.23 V vs. Ag/AgCl.

2.6. Characterizations

The crystal structures and phases of the as-prepared powder samples were characterized using a monochromatic Cu-Kα (λ = 0.154 nm) X-ray diffractometer in conjunction with the Bruker D8 Advance XRD. The high-resolution surface morphology and energy-dispersive X-ray mapping (EDX) were investigated separately using a focused ion beam scanning electron microscope (FIB/SEM, FEI Nova 600 Nanolab, Thermo Fisher Scientific, Loughborough, UK) and an FEI Quanta FEG 650 SEM (Thermo Fisher Scientific, Loughborough, UK). Transmission electron microscopy (TEM) and high-resolution transmission electron microscopy (HRTEM) images were captured using a JEOL 2100 instrument (JEOL Ltd., Tokyo, Japan) set to 200 kV accelerating voltage. The XPS and UPS investigations were carried out using a Thermo Fisher Scientific NEXSA (Thermo Fisher Scientific, Loughborough, UK) spectrometer equipped with a micro-focused monochromatic Al X-ray source (72 W) and an X-ray spot size of 400 microns. CasaXPS version 2.3.24PR1.0 software was applied for data analysis, and calibration was performed using the C 1s peak at 284.8 eV. A UV-VIS-NIR Cary 5000 spectrophotometer was used for the UV-visible DRS. The hydrogen generation activity of the produced photocatalysts was investigated using a PerkinElmer GC-580 Clarus gas chromatography (PerkinElmer, Waltham, MA, USA) with an argon carrier gas and a molsieve 5A column coupled with a thermal conductivity detector (TCD).

3. Results and Discussion

The XRD patterns of prepared samples 1000-4 and 1100-1 are shown in Figure 1a. The diffraction patterns of sample 1000-4 could be attributed to tetragonal phase FeTaO4 (space group: P42/mnm, lattice parameters: a = 4.679, b = 4.679, and c = 3.047), orthorhombic phase Ta2O5 (space group: C2mm, lattice parameters: a = 6.2, b = 3.66, and c = 3.89), and tetragonal phase TaO2 (space group: I41/a, lattice parameters: a = b = 13.32 and c = 6.12). When the temperature was raised to 1100 °C for 1 h, no TaO2 diffraction peak could be identified, and the peak width became narrower compared to sample 1000-4, which could be attributed to its increased crystallite size and lattice strain. Additionally, a Rietveld refinement analysis was used to determine the phase composition ratio of the prepared samples. As depicted in Figure 1b,c, sample 1000-4 predominantly consists of 95.1% FeTaO4, complemented by smaller proportions of 3.8% Ta2O5 and 1.1% TaO2. When the calcination temperature increased from 1000 to 1100 °C, the oxidation of TaO2 caused the phase composition to transition from triphasic to biphasic with a composition of 96.1% FeTaO4 and 3.9% Ta2O5. A marginal shift in the major phase composition of the samples, with a difference of only 1%, could be attributed to errors inherent in the Rietveld refinement analysis.
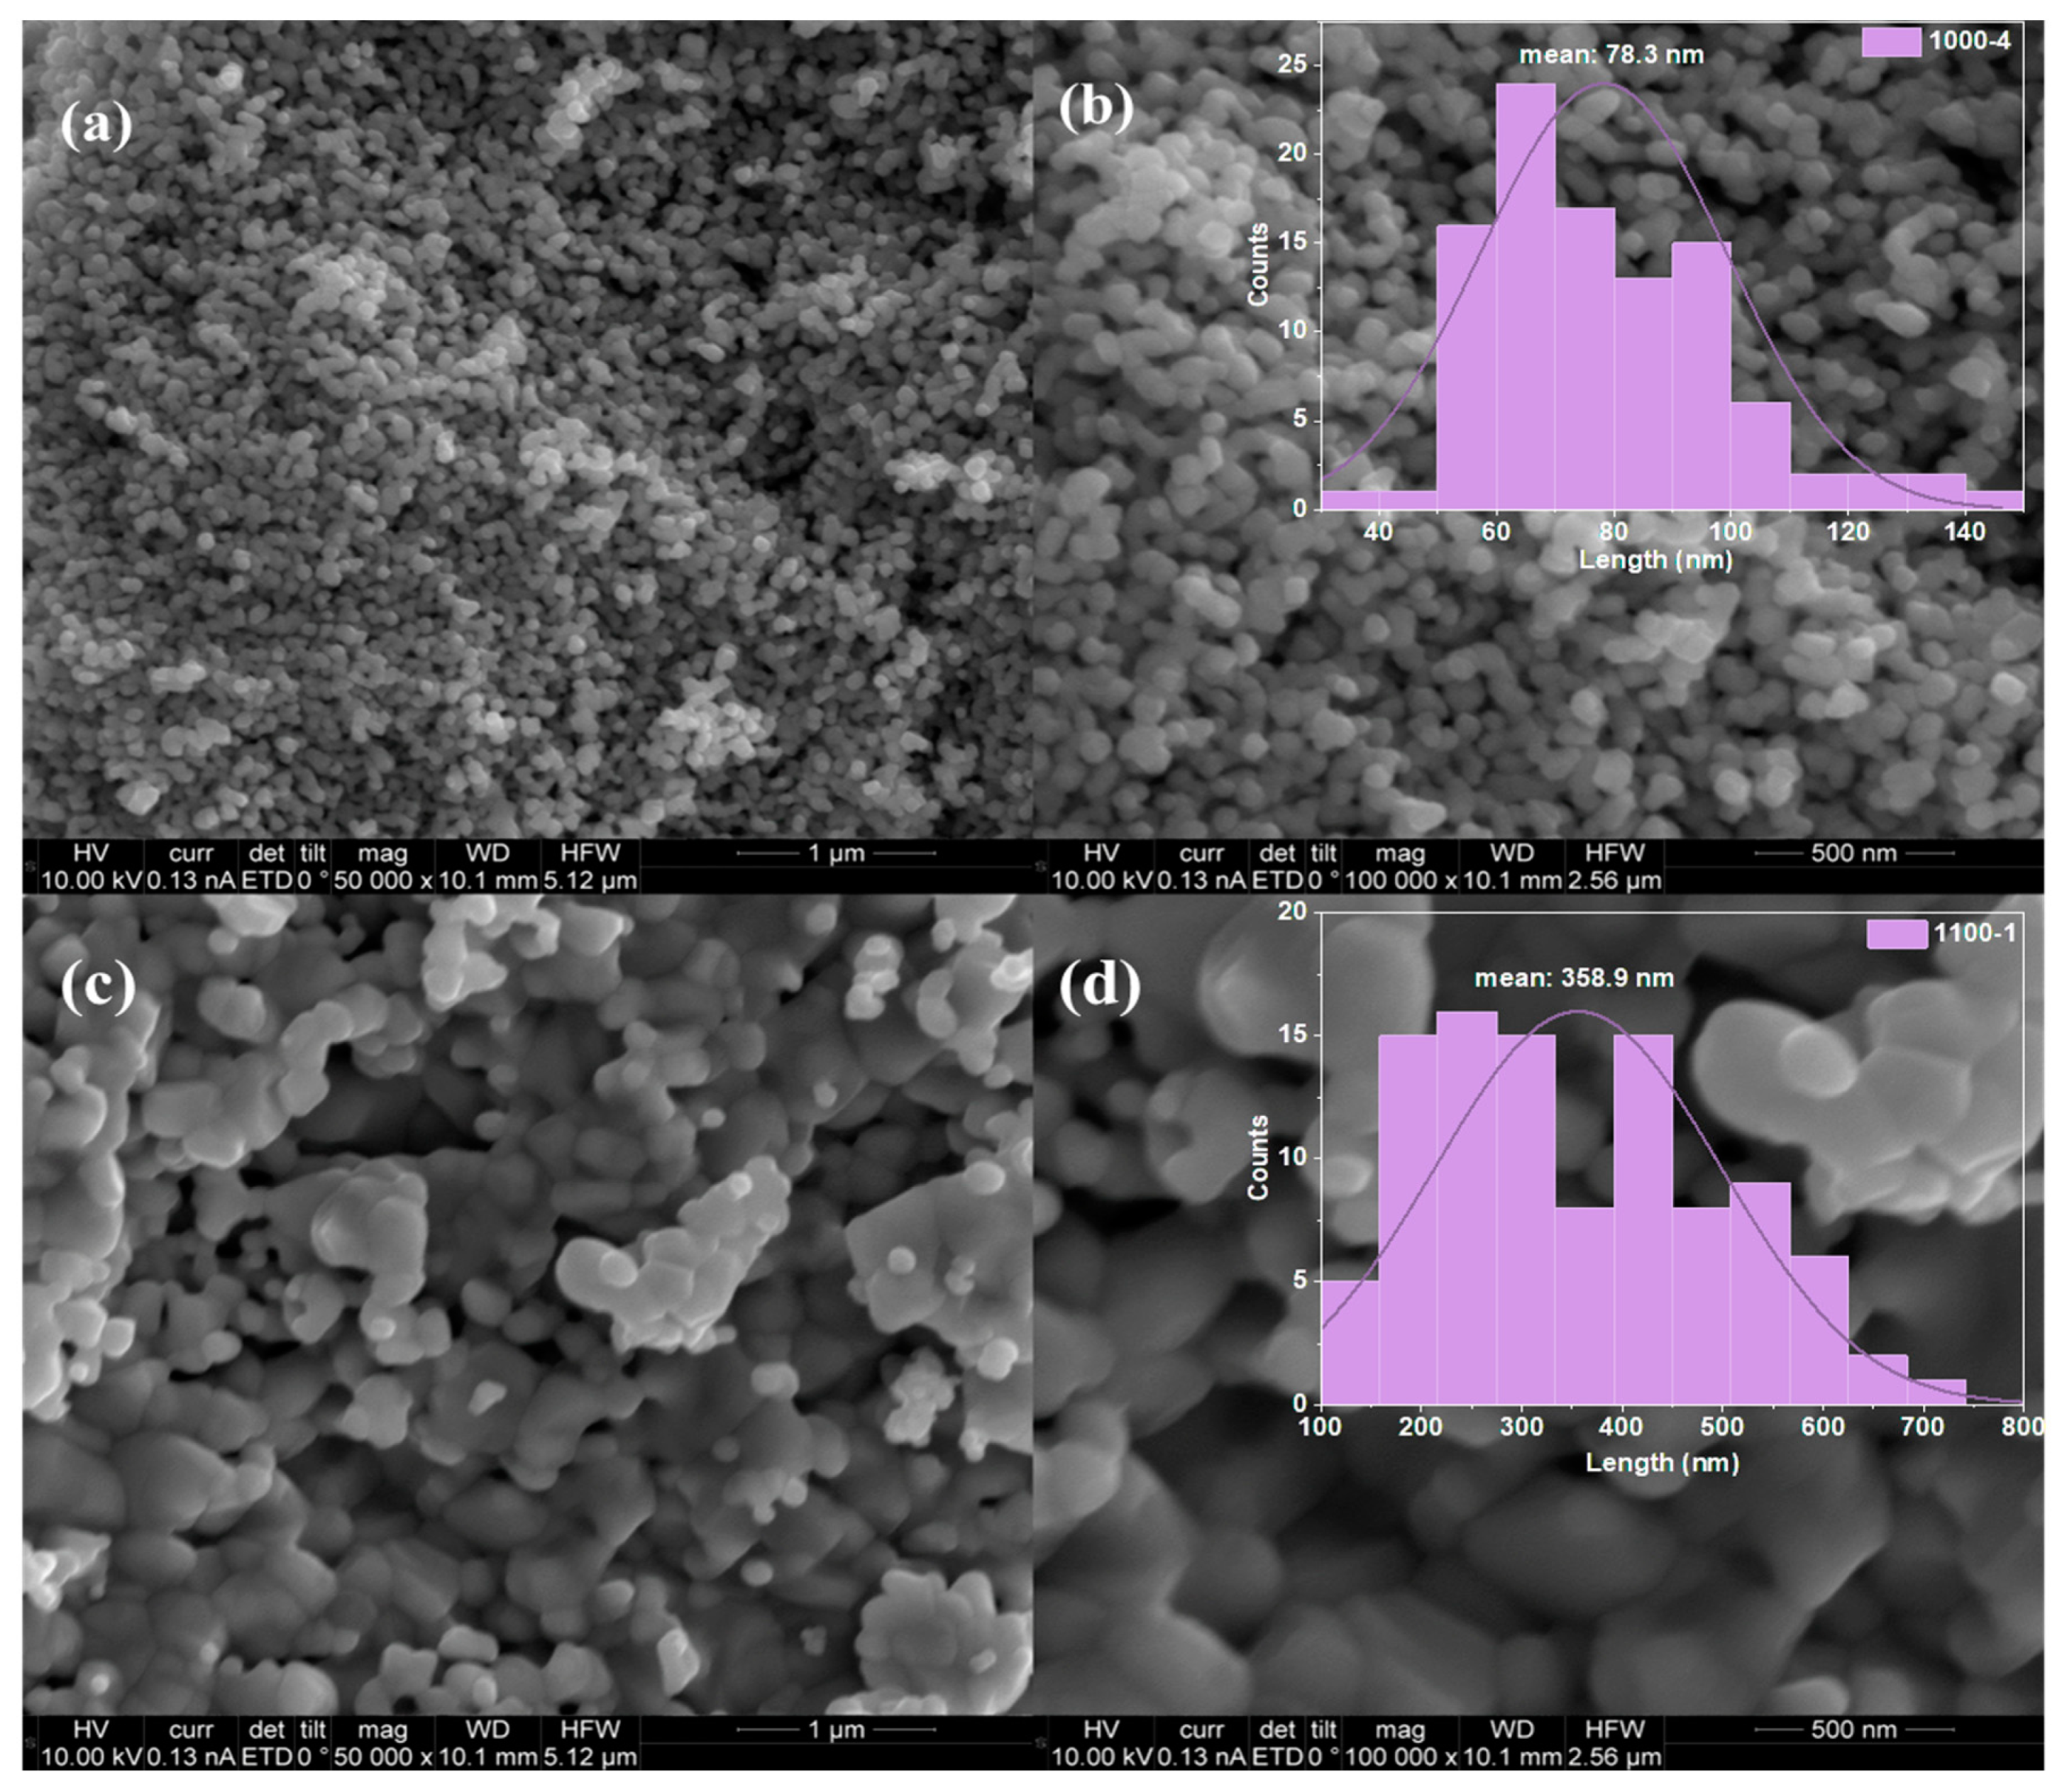
SEM investigated the surface morphologies of the produced samples. As shown in Figure 2a,b, the TaO2/Ta2O5/FeTaO4 nanoparticles exhibit highly uniform circular sheet-like morphology and are placed into stacks. The particle size distribution histogram in Figure 2b shows that the mean nanoparticle size of sample 1000-4 is around 78.3 nm, with a distribution range of 30–150 nm. The morphology of the prepared Ta2O5/FeTaO4 nanoparticles, shown in Figure 2c,d, becomes a non-uniform nanosheet structure after annealing the precursor at 1100 °C for 1 h, and the nanoparticles’ mean size increases to 358.9 nm, which is four times larger than that of sample 1000-4. Moreover, thermal treatment introduced the Ostwald ripening phenomenon [26,27], which causes particle size to increase because of surface diffusion and adhesion to pre-existing particles.
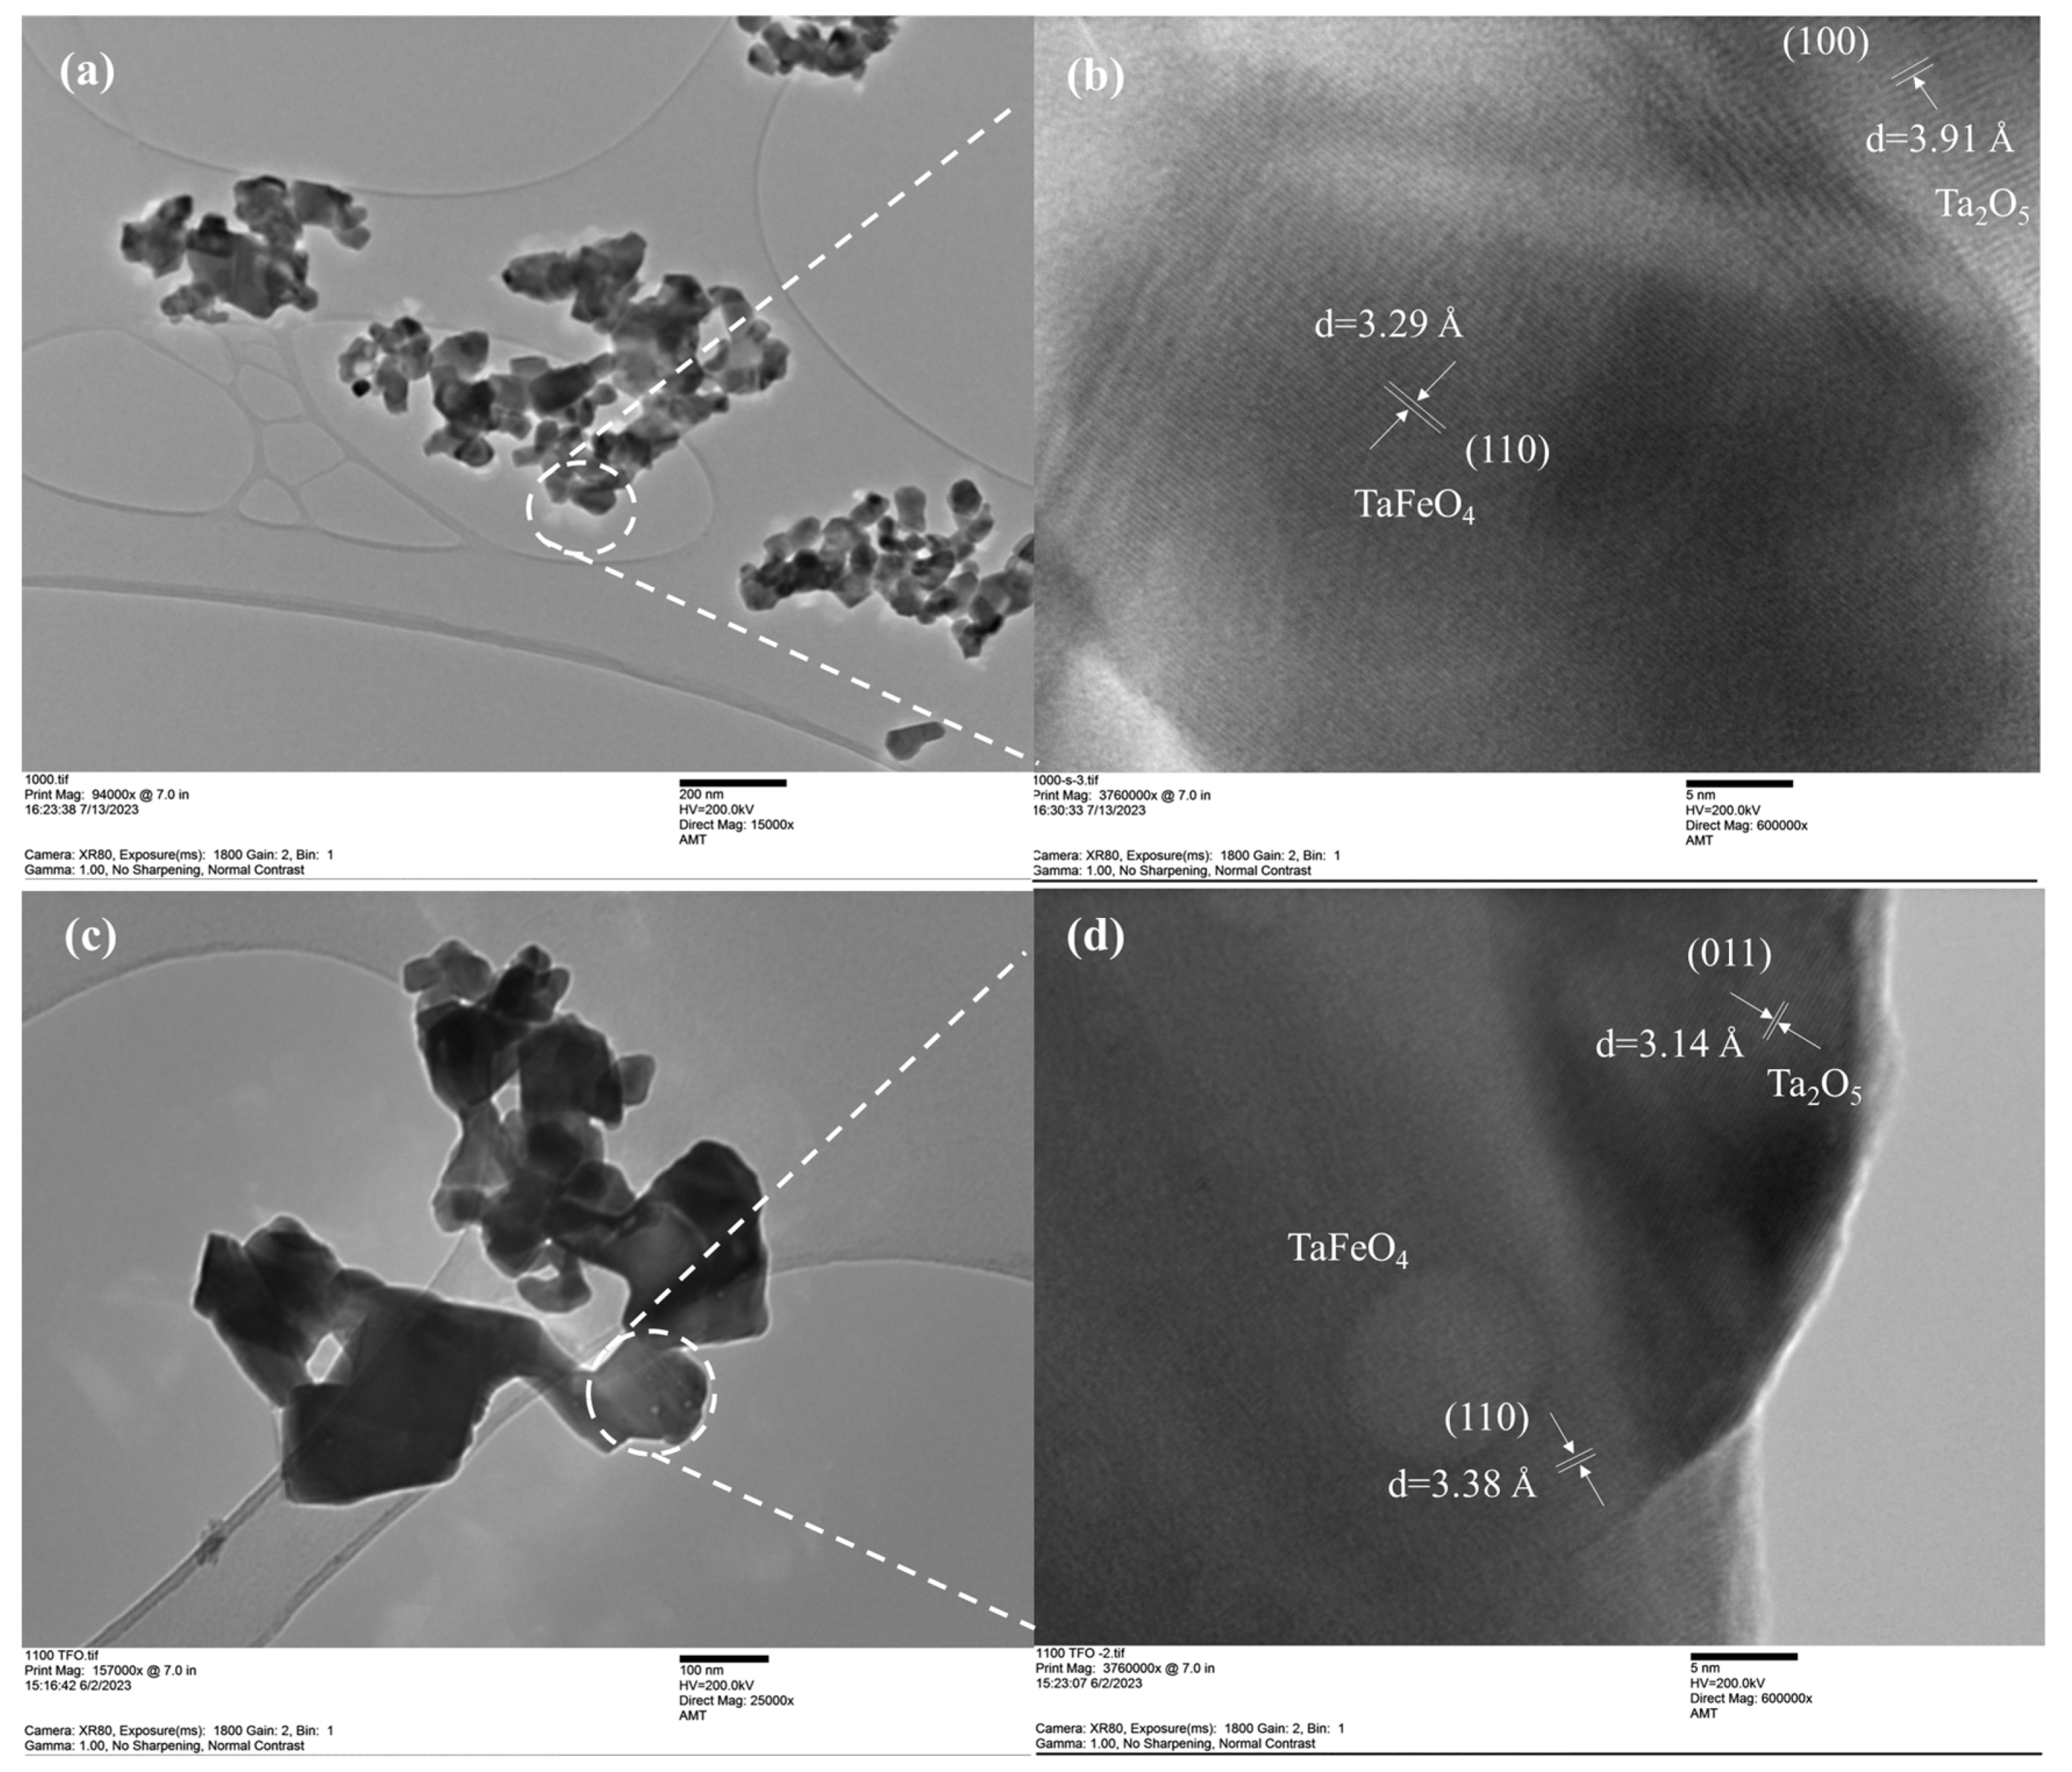
TEM and high-resolution TEM were applied to investigate the produced samples’ morphological and internal structural analyses. The TEM images, displayed in Figure 3a,c, revealed that sample 1000-4 had a sheet-like morphology with particle size less than 150 nm, while sample 1100-1 displayed significantly larger dimensions than sample 1000-4, confirming and solidifying the SEM findings. The HRTEM image in Figure 3b also shows distinct lattice fringes with interplanar spacings of 3.29 Å and 3.91 Å, corresponding to the (110) and (100) planes of FeTaO4 and Ta2O5, respectively. The clear lattice fringes in Figure 3d have interplanar spacings of 3.38 Å and 3.14 Å, respectively, consistent with the (110) and (011) planes of FeTaO4 and Ta2O5. Moreover, irregular regions on the surface of the produced FeTaO4 and Ta2O5 crystals in the form of discontinued lattice fringes suggested the presence of defects, which could be attributed to oxygen vacancies within the crystal lattice.
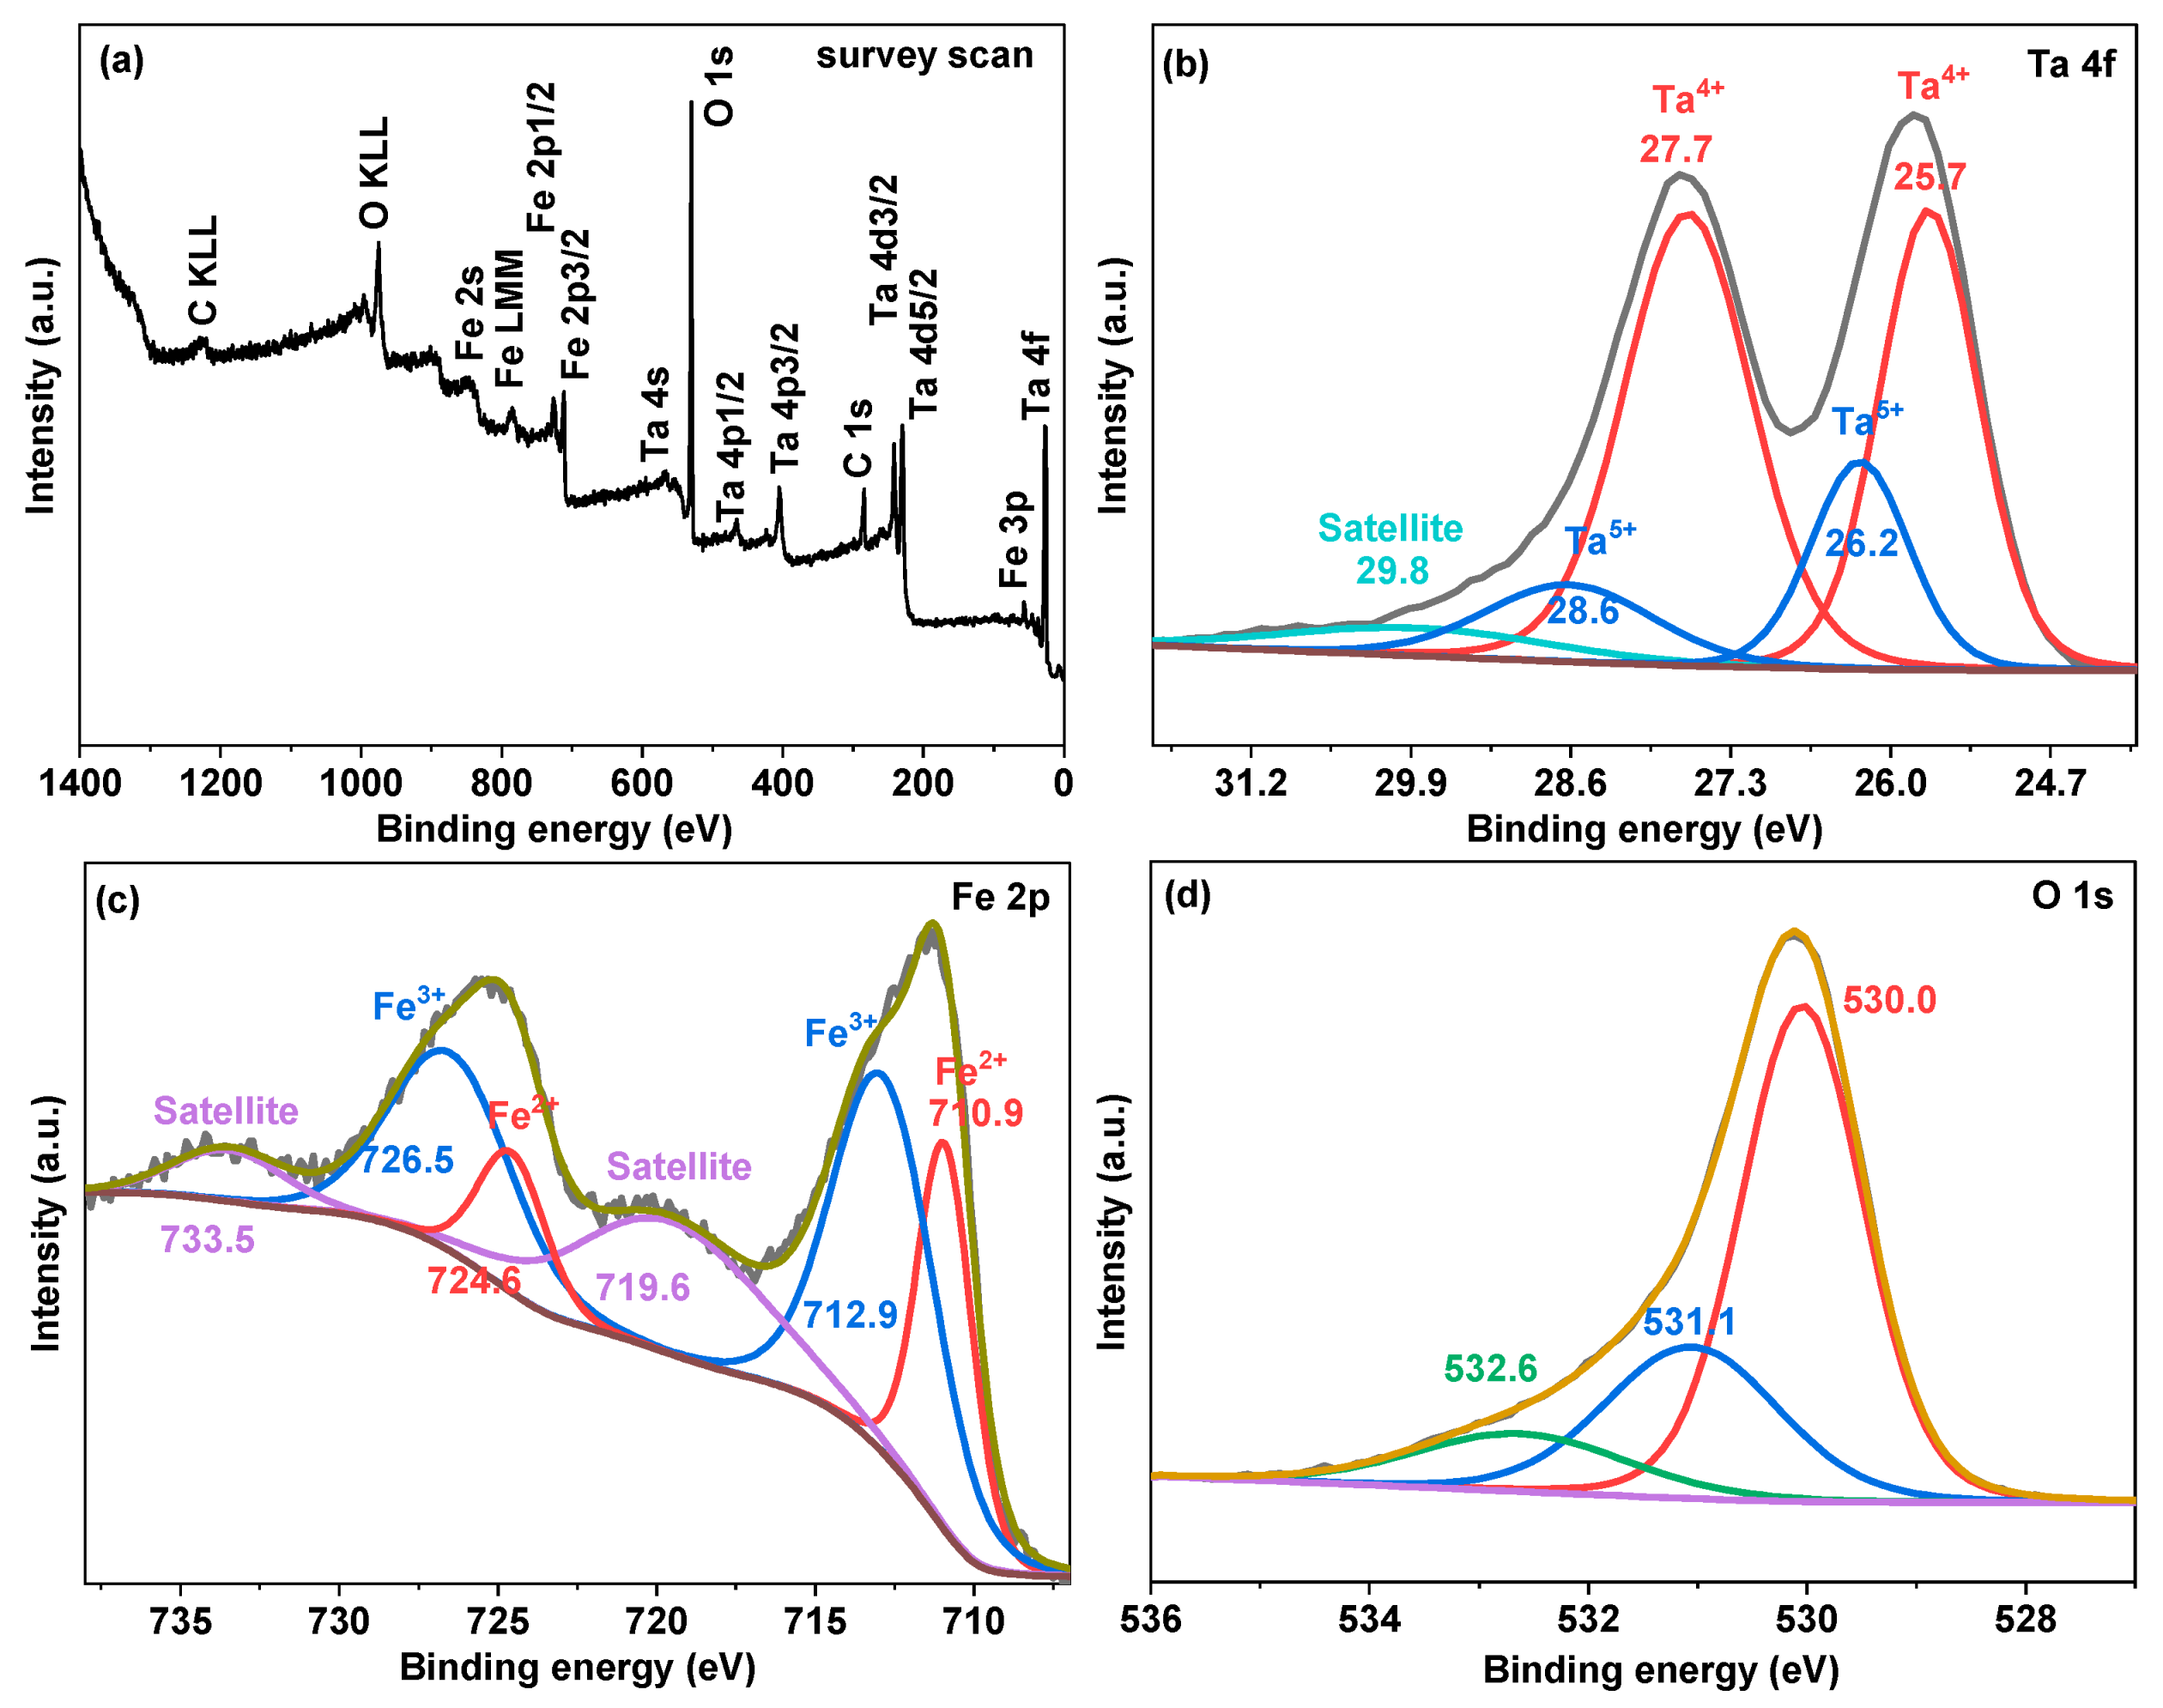
The XPS investigated the produced samples’ surface composition and chemical states. All the results were calibrated using the C 1s electron at 284.8 eV as the reference point. The survey spectrum depicted in Figure 4a reveals that the prepared sample of 1000-4 is composed of Ta, Fe, and O. The two spin-orbit peaks in the high-resolution spectrum of Ta 4f in Figure 4b correspond to Ta 4f7/2 and Ta 4f5/2, respectively. Each of the Ta 4f7/2 and Ta 4f5/2 core levels could be deconvoluted into two peaks. The 26.2 and 28.6 eV peaks could be ascribed to Ta5+ in FeTaO4 and Ta2O5.
In contrast, the two peaks at lower binding energies, 25.7 and 27.7 eV, could be attributed to Ta4+ in TaO2 and other low valance state Ta4+ species introduced by oxygen vacancies [28]. The high-resolution Fe 2p spectrum in Figure 4c shows four peaks: Fe 2p3/2 at 711.3 eV, Fe 2p1/2 at 725.2 eV, and the other two satellite peaks at 719.6 and 733.5 eV. After fitting, both the Fe 2p1/2 and Fe 2p3/2 peaks could be deconvoluted into two peaks: the peaks at 712.9 and 726.5 eV can be assigned to Fe3+ species in FeTaO4, while the other two peaks at 710.9 and 724.6 eV could be linked to Fe2+ species [29,30]. Additionally, the O 1s high-resolution spectrum in Figure 4d can be resolved into three peaks: lattice oxygen species (O2−) at 530.0 eV, oxygen vacancies in the composite at 531.1 eV, and absorbed oxygen species such as O2, H2O, and CO2 at 532.6 eV [31].
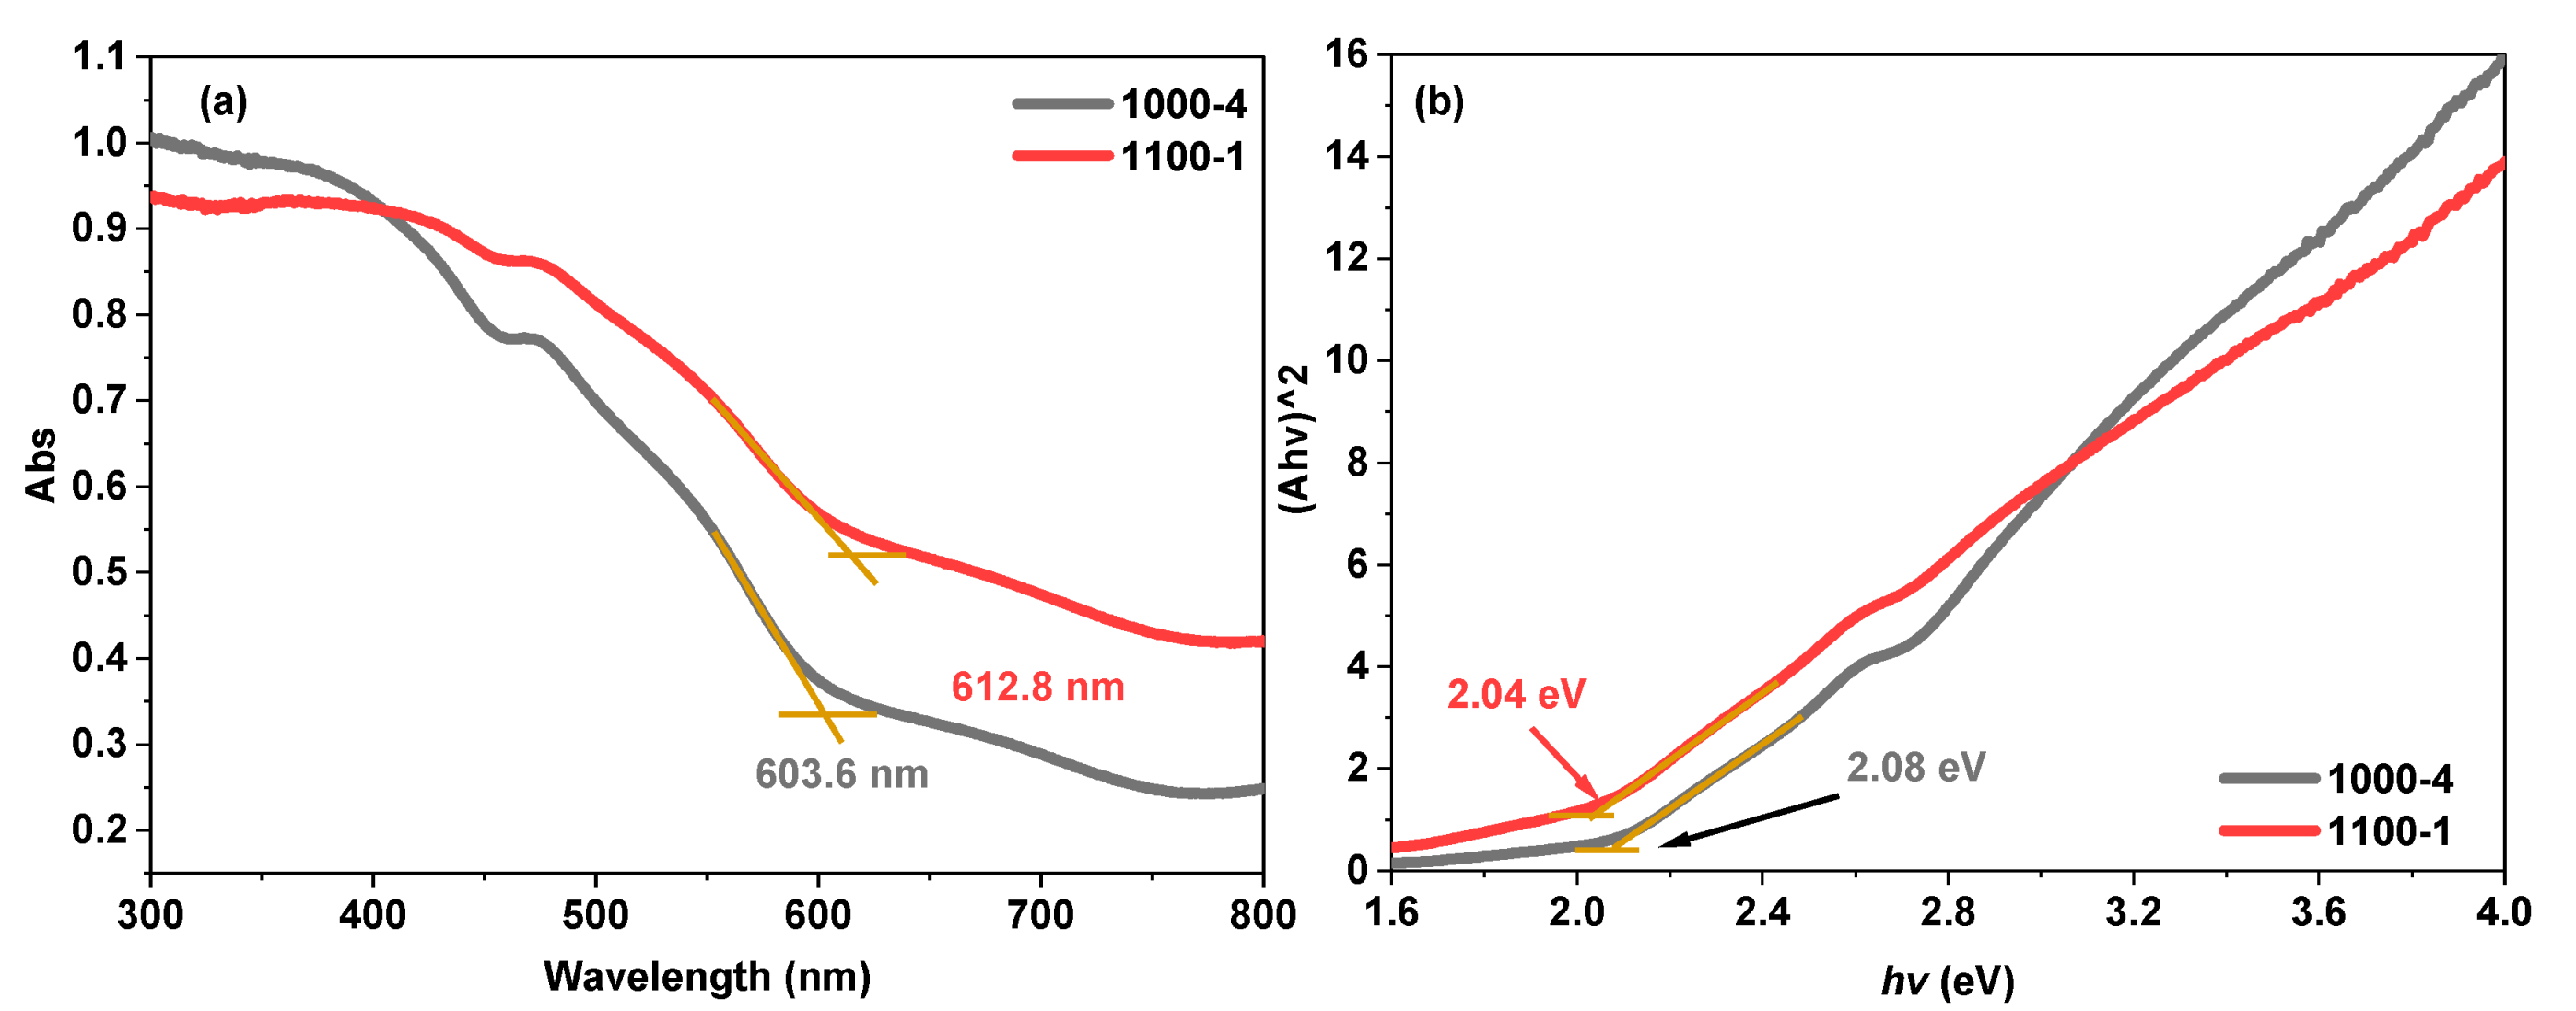
The UV-vis DRS spectroscopy investigated the light absorption behaviour of prepared samples, and the findings are shown in Figure 5a. The absorption edge of sample 1000-4, with a substantial rise in absorbance, is located at 603.6 nm, while sample 1100-1 shows a significant increase at 612.8 nm. A red-shift of the absorption band edge of produced materials with increasing temperature from 1000 to 1100 °C could be attributed to the influence of quantum confinement effects becoming less relevant as the particle size increases [32]. According to the examination of the Tauc plots in Figure 5b [33], the corresponding bandgap energies for samples 1000-4 and 1100-1 are calculated to be 2.04 eV and 2.08 eV, respectively.
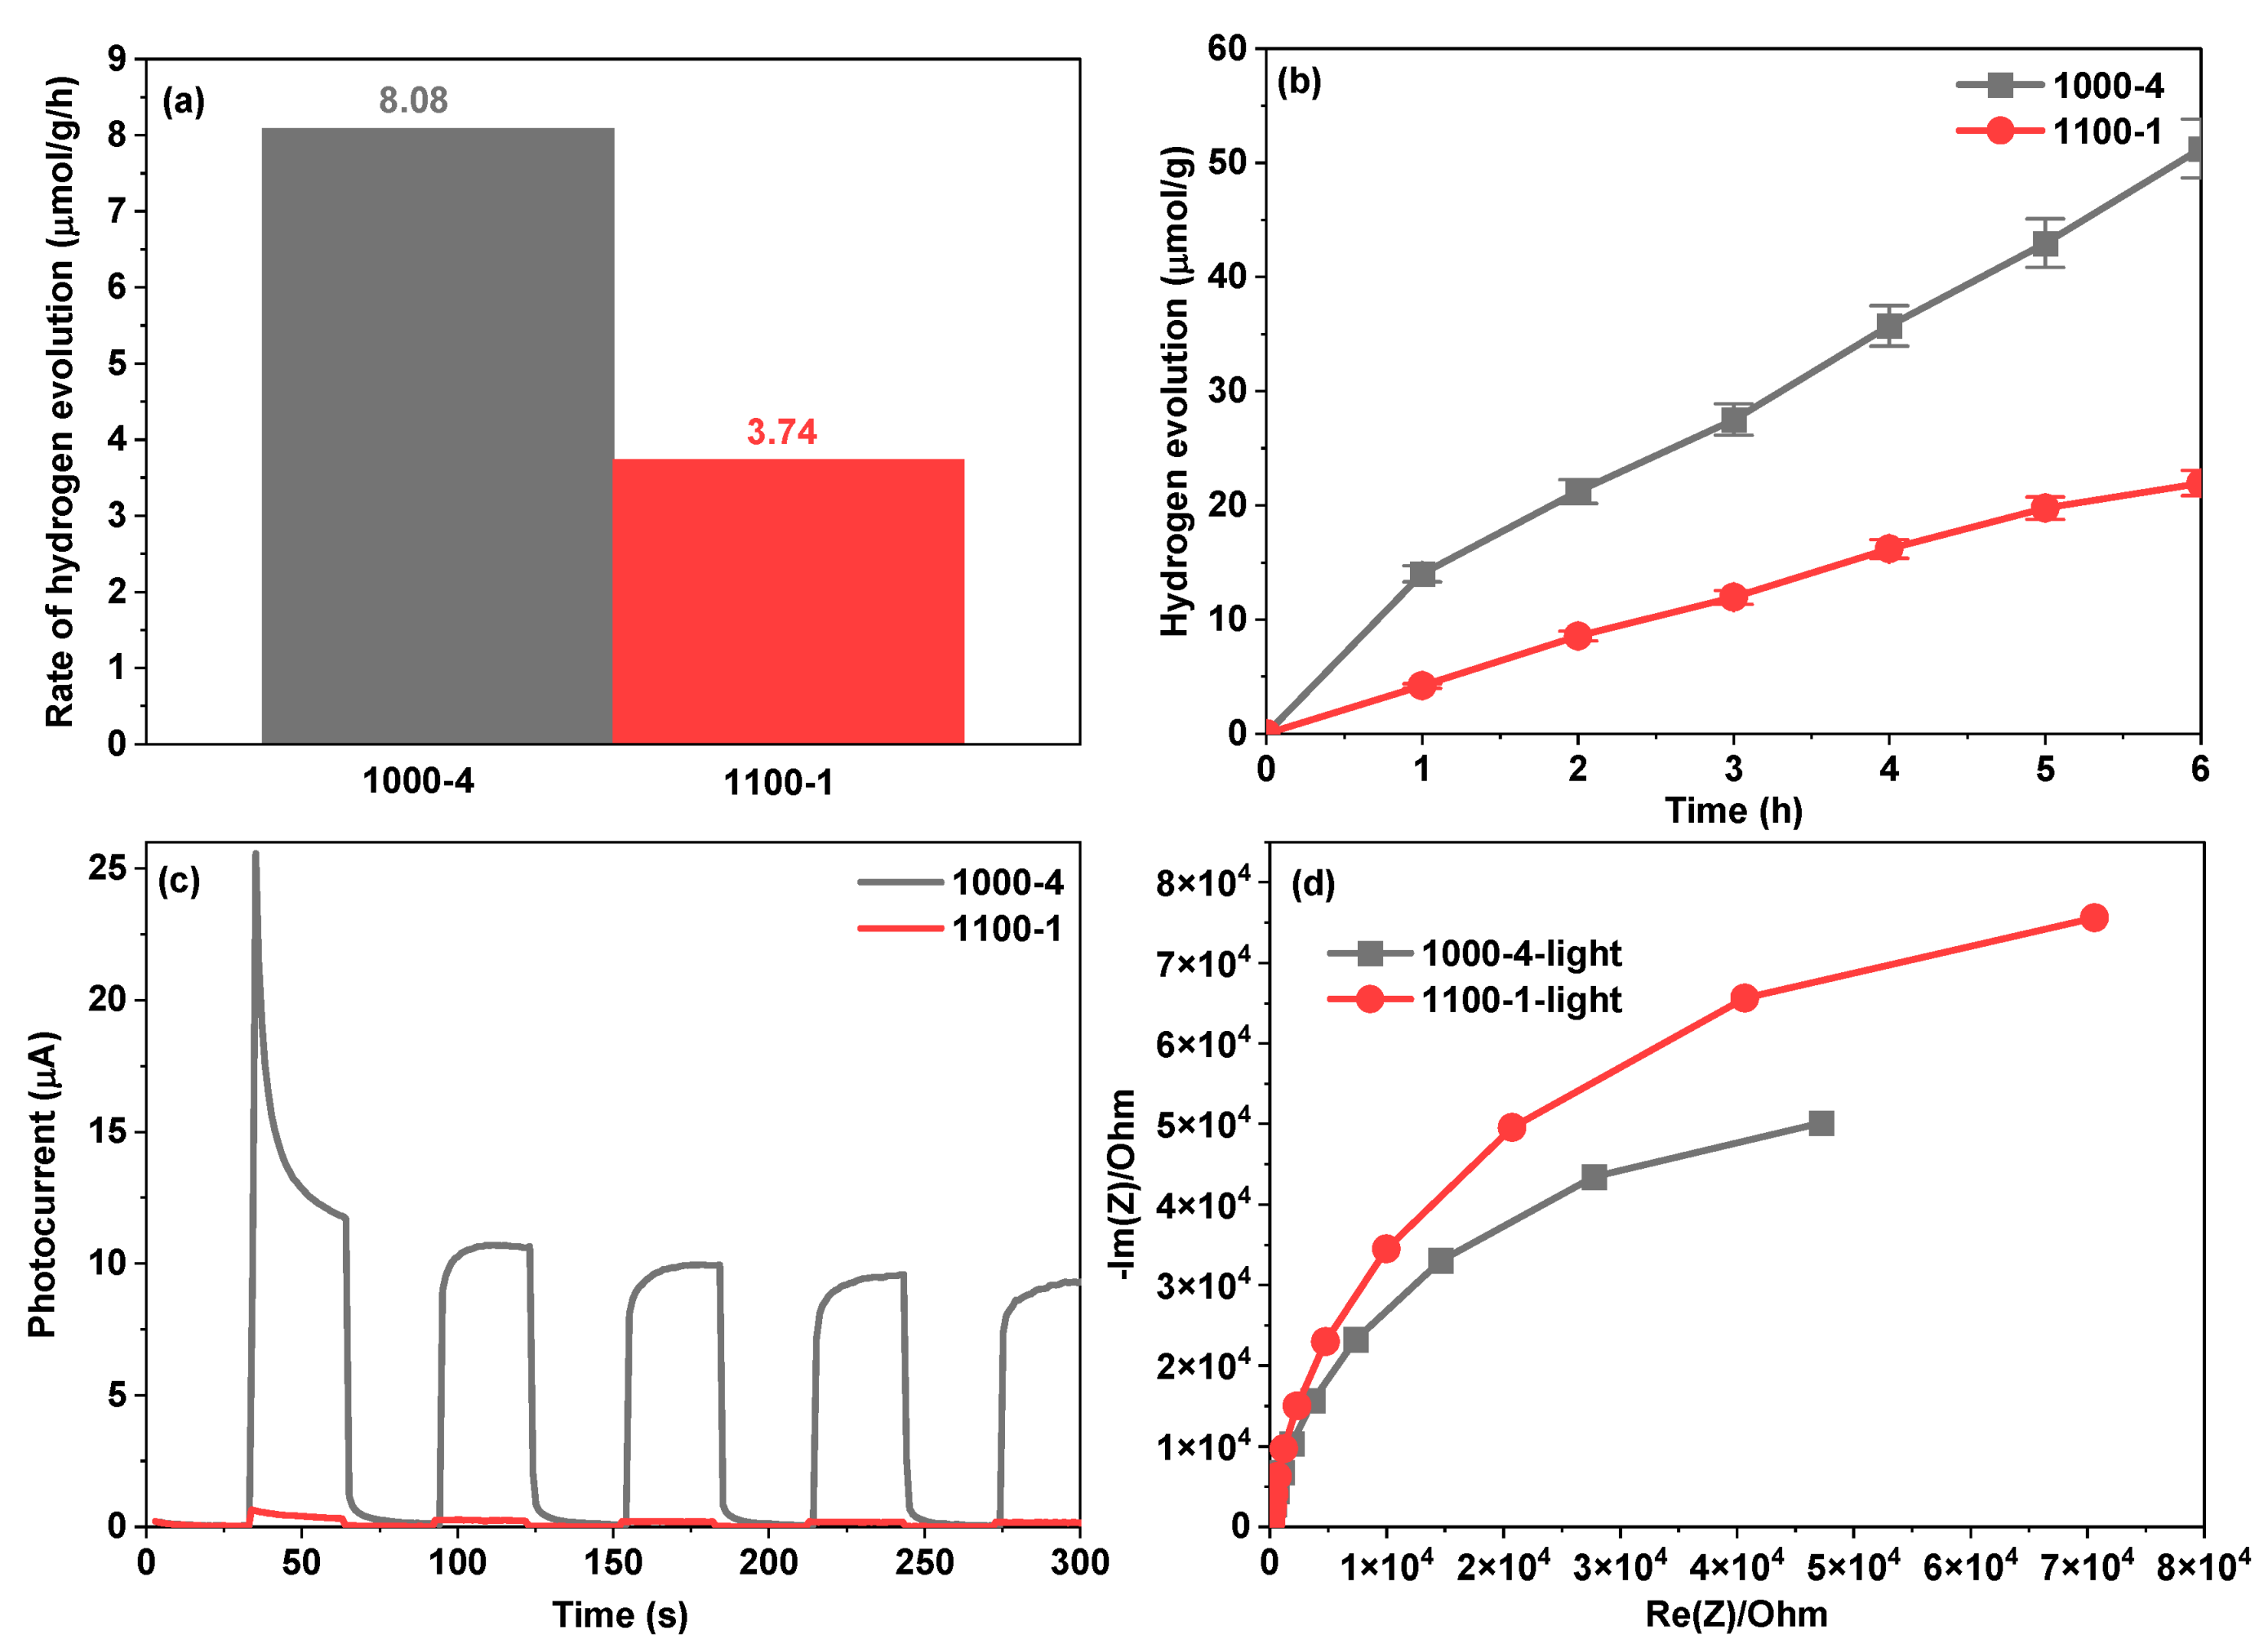
Under solar light irradiation, the prepared 1000-4 and 1100-1 samples’ photocatalytic hydrogen evolution activities were evaluated in a methanol–water solution. As illustrated in Figure 6a, sample 1000-4 demonstrated favourable hydrogen evolution ability with a rate of 8.08 µmol/g/h, surpassing the performance of other photocatalysts listed in Table 1. This rate is 2.16 times higher than 1100-1, which yielded 3.74 µmol/g/h. Additionally, after six hours of solar light irradiation, sample 1000-4 achieved a hydrogen evolution amount of 51.24 µmol/g, surpassing sample 1100-1, which produced 21.94 µmol/g. The enhanced performance in photocatalytic hydrogen evolution could be attributed to the more significant number of active sites resulting from a higher surface-area-to-volume ratio compared to the larger nanoparticles generated in sample 1100-1. Moreover, the transient photocurrent curves and the electrochemical impedance spectroscopy (ESI) plots depicted in Figure 6c,d indicate that sample 1000-4 exhibits superior photocurrent response and lower charge transfer resistance compared to sample 1100-1. These findings demonstrate that sample 1000-4 efficiently enhances charge carrier separation and transfer processes.
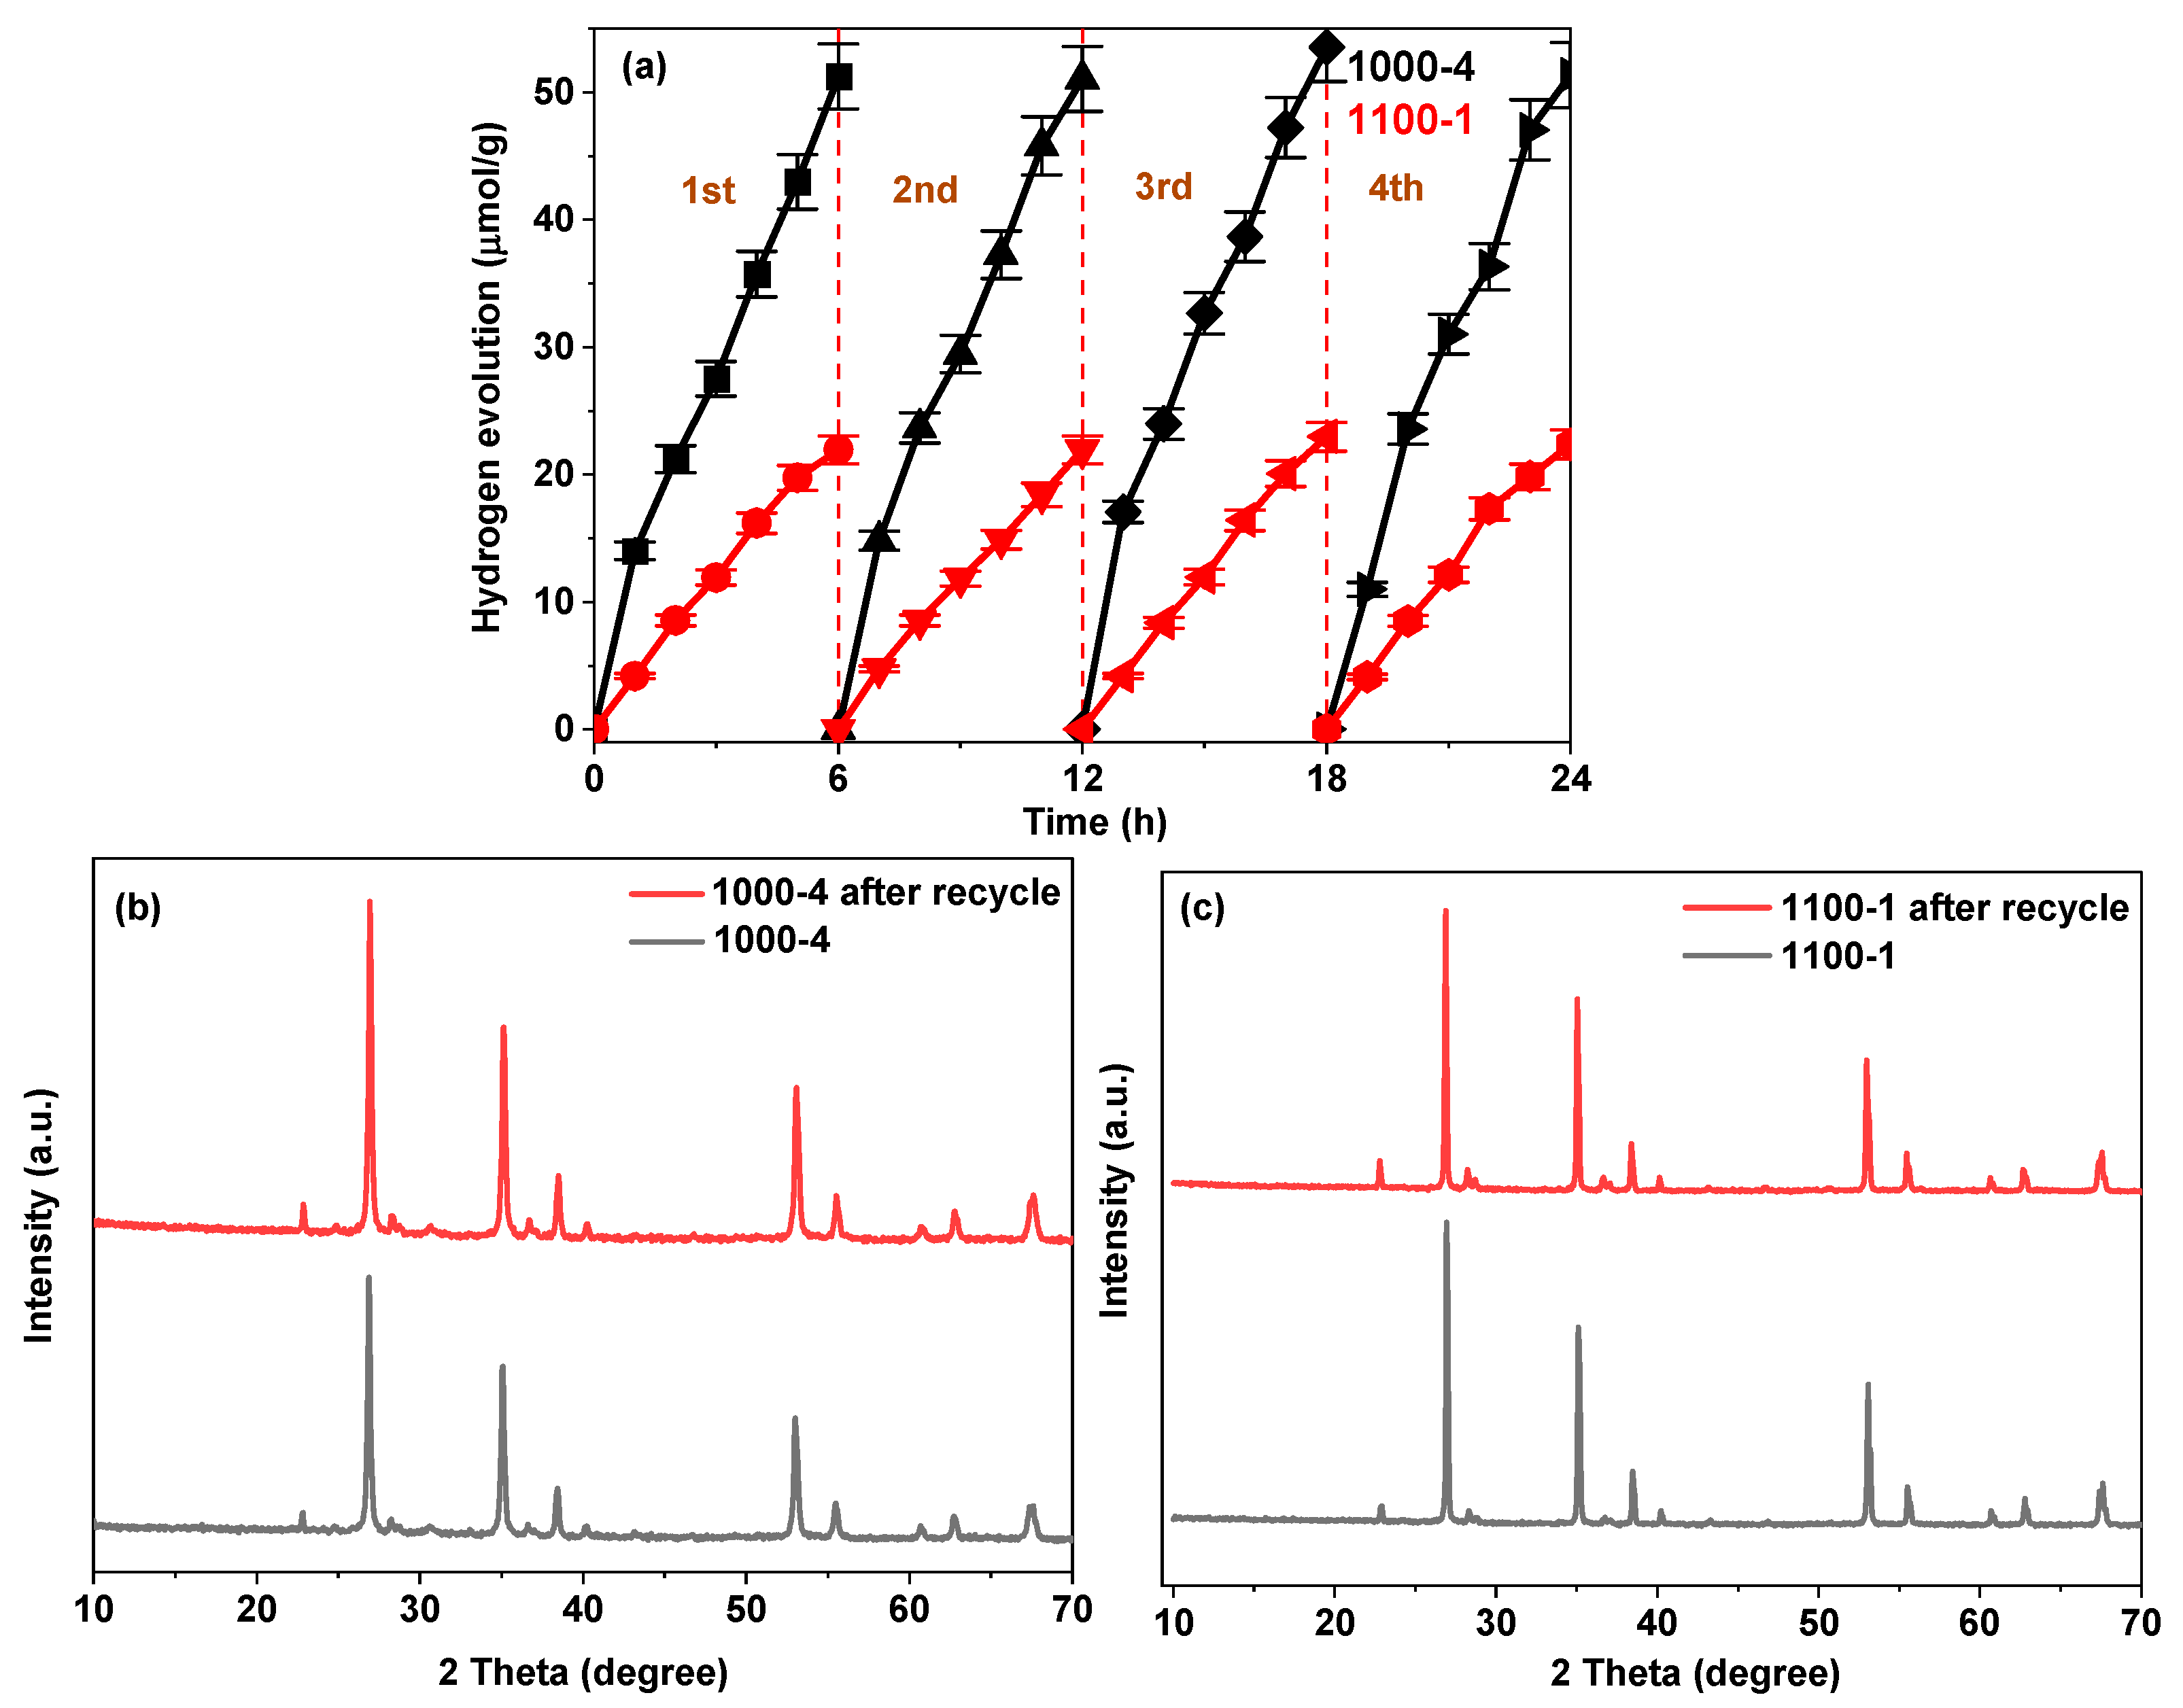
A photocatalytic test for hydrogen evolution production was conducted over four consecutive cycles without any catalyst regeneration steps to evaluate the photocatalytic stability of the produced samples. Specifically, the suspension was extracted from the photoreactor and centrifuged to recover the photocatalyst. After thorough washing with distilled water, the samples were reused without additional treatment. As shown in Figure 7a, both samples demonstrate outstanding durability in the photocatalytic hydrogen evolution reaction. The results presented in Figure 7a indicate that even after undergoing four consecutive cycles of photocatalytic hydrogen evolution reactions, there is no discernible decrease in the overall amount of hydrogen evolution. This substantiates the exceptional stability exhibited by samples 1000-4 and 1100-1. Furthermore, comparing XRD patterns before and after the photocatalytic reaction (Figure 7b,c) reveals that the crystal structure remains unaltered. This further validates the stability of the prepared samples.
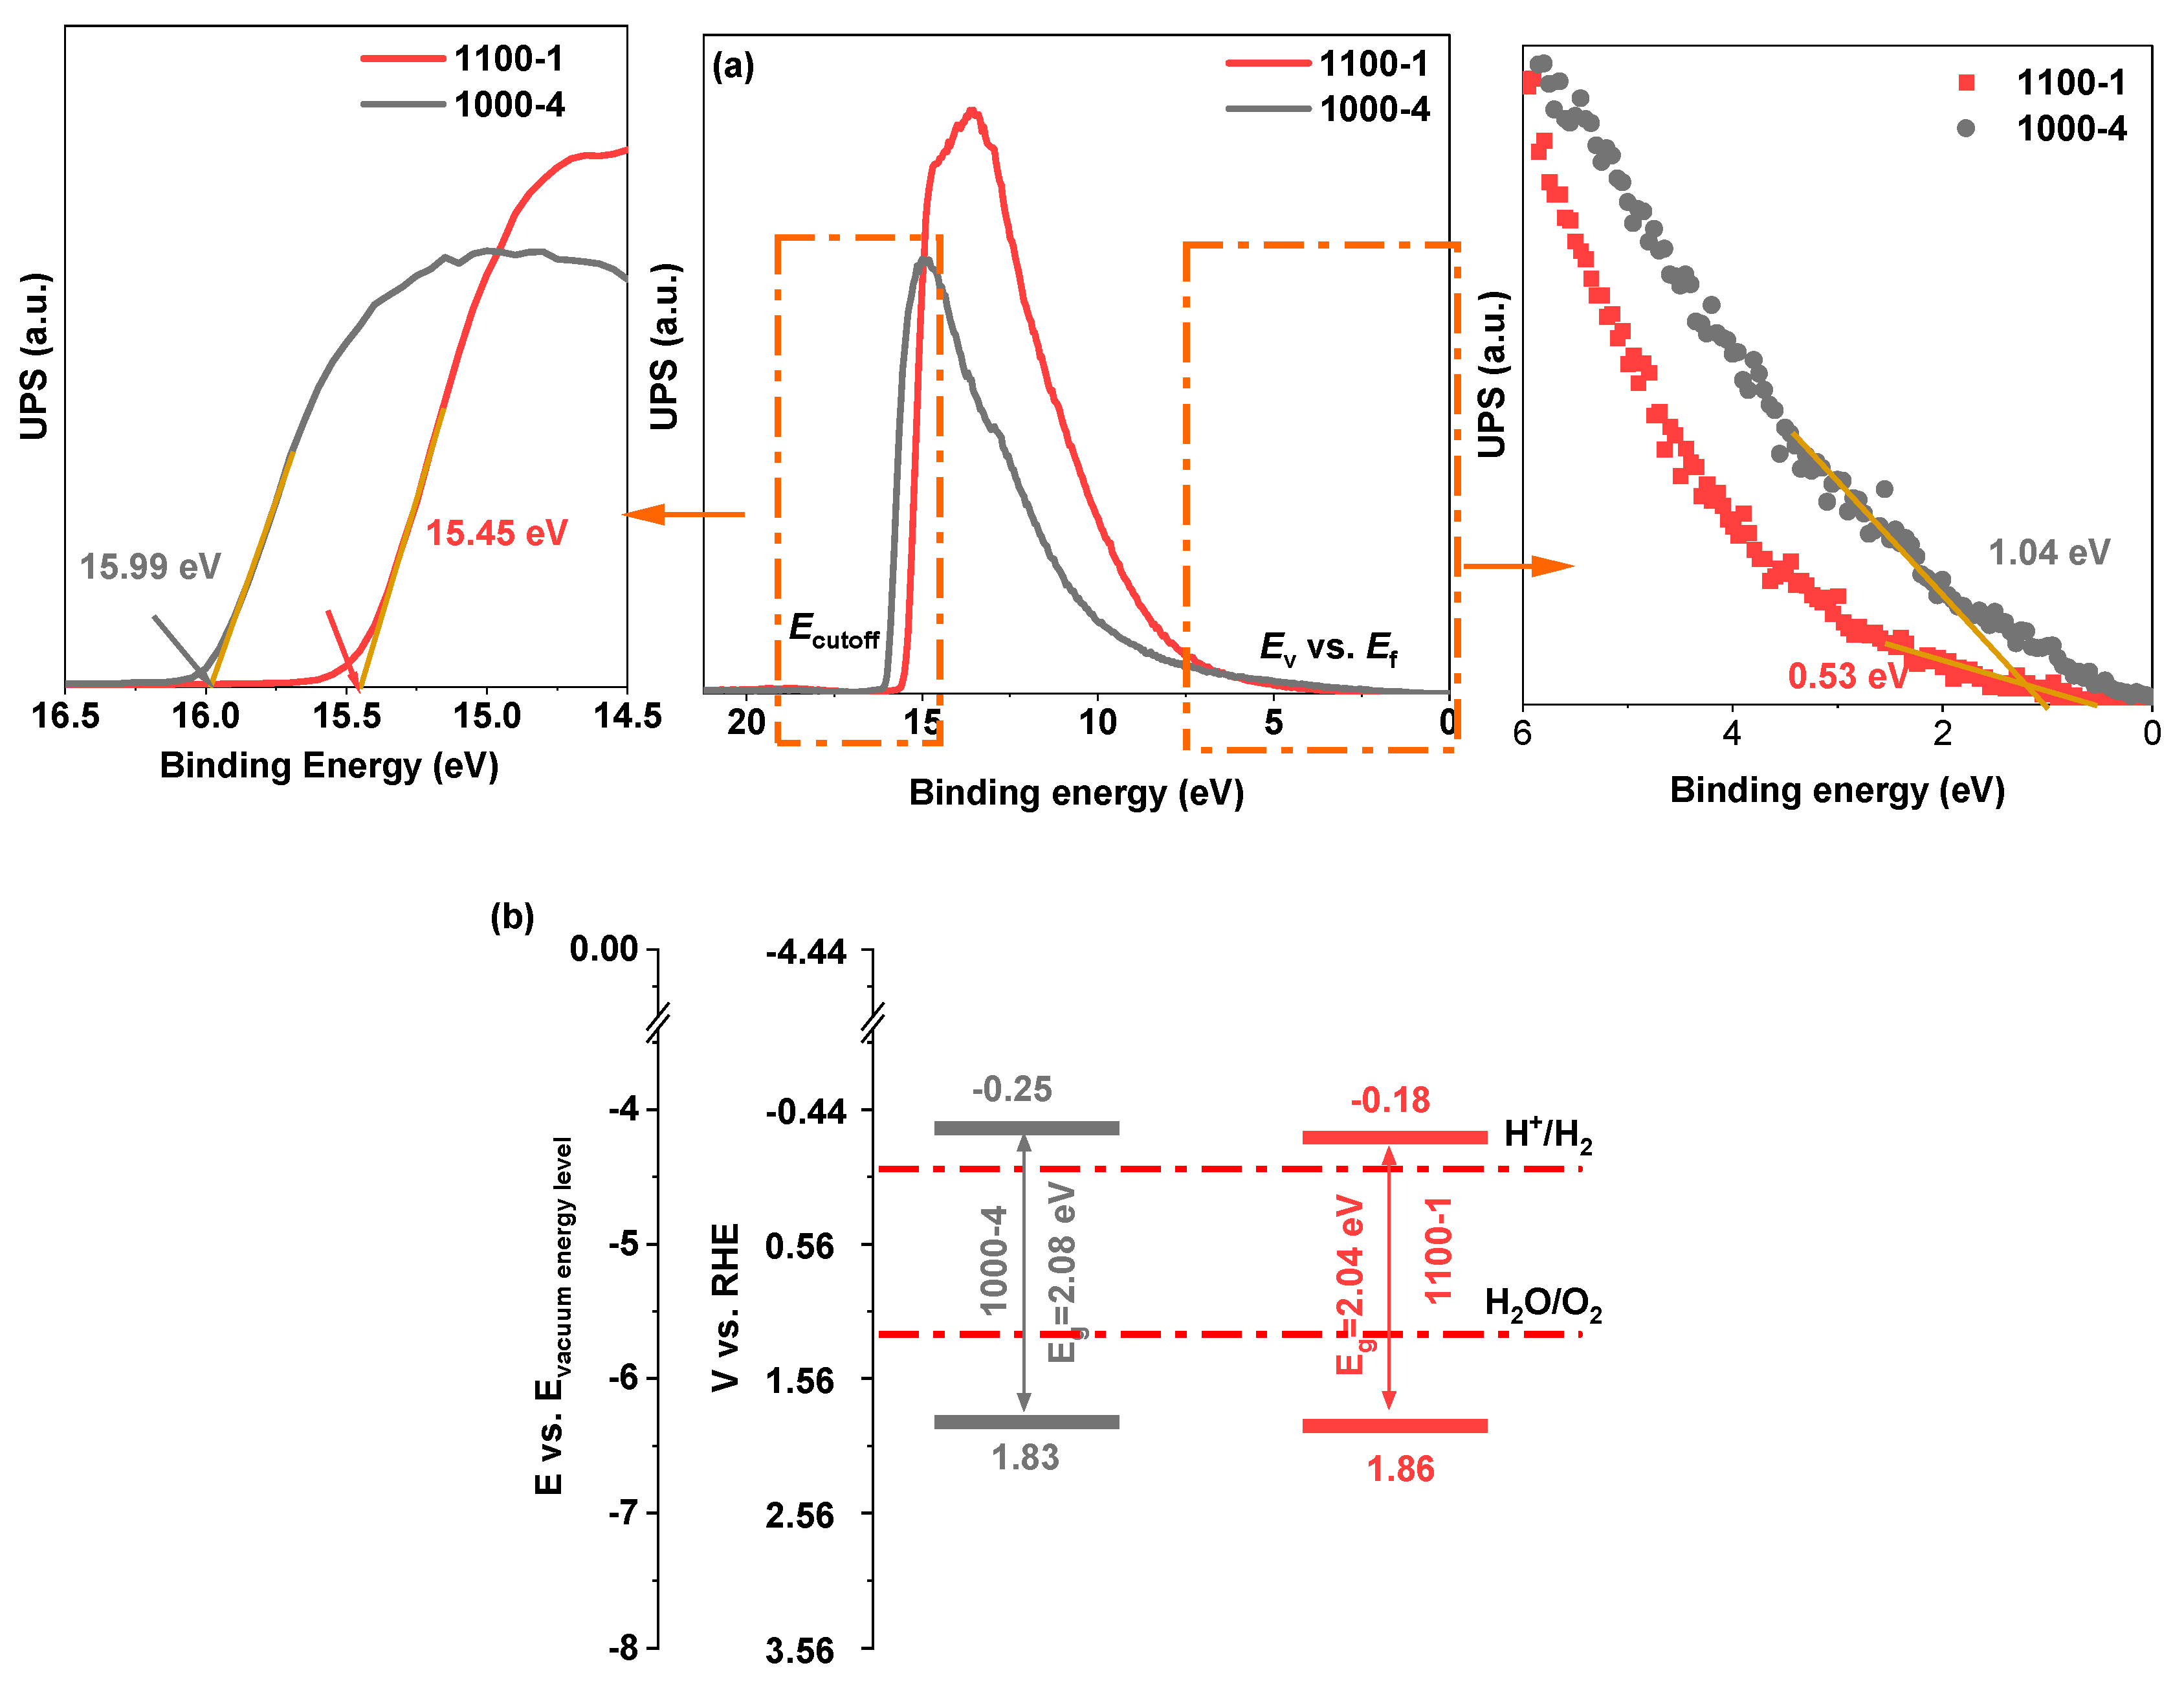
The valence band edges for the 1000-4 and 1100-1 samples were calculated using UPS, as shown in Figure 8a, and were found to be 6.27 eV and 6.3 eV vs. vacuum level, respectively. These values were derived by deducting the width of the UPS spectra from the excitation energy (21.22 eV). Additionally, as illustrated in Figure 8b, the bandgaps and band positions measured provided insight into the band structures of the produced samples. The conduction band (CB) potential of sample 1000-4 is −0.25 V vs. RHE, exhibiting a more negative value than the −0.18 V of sample 1100-1 and displaying its superior ability of photocatalytic hydrogen evolution. The more negative CB potential of sample 1000-4 increases the driving force for electron transfer. It provides the necessary energy for efficient electron transfer during water reduction, making it easier to complete photocatalytic hydrogen evolution. This more suitable band structure could be attributed to the quantum confinement effect, which generated an energy level shift by controlling the size of the nanoparticles to below 100 nm.
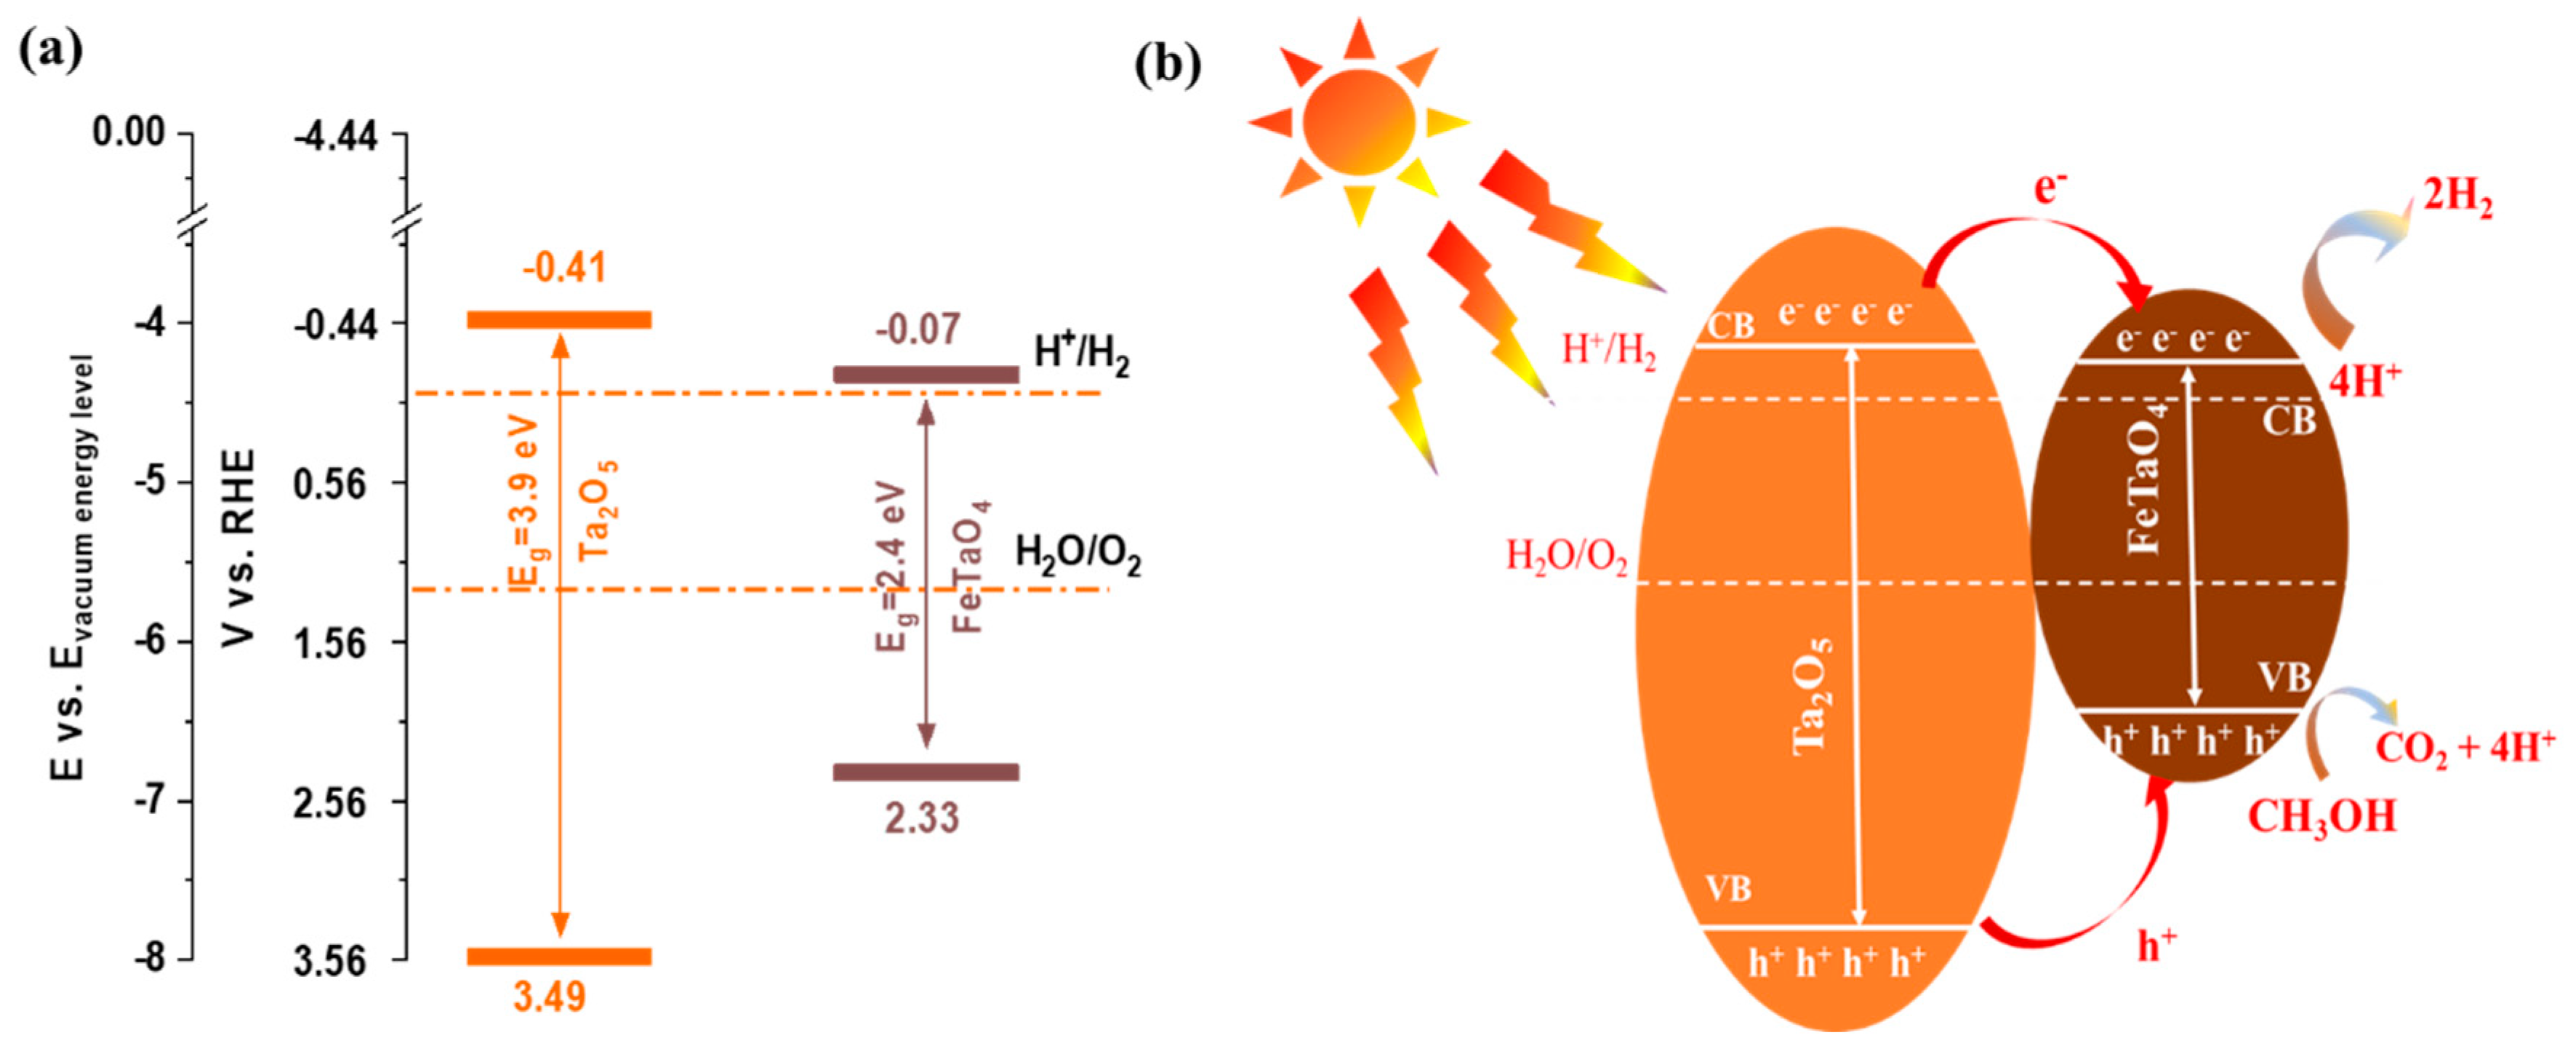
Band potential determination is a vital parameter in the precise design of the heterojunction structure. It is critical to understand the complicated mechanism of regulation of photogenerated electron and hole transfer and separation, which are crucial to photocatalytic hydrogen evolution. Given that our method did not yield pure phases of FeTaO4 and Ta2O5 directly, we have meticulously gathered the required values in Table 2 from the previous scientific literature. For visual reference, the corresponding band structure is shown in Figure 9a. Based on the results mentioned above, a possible mechanism was presented in Figure 9b to explain better the charge transfer process in these tantalum–iron composites. As illustrated in Figure 9b, Ta2O5 and FeTaO4 absorb solar radiation to produce electron–hole pairs [41,42]. The photo-generated electrons then transfer from the valence band (VB) to the conduction band (CB) of Ta2O5 and FeTaO4, while the holes remain in the VB [41,42,43]. Upon the formation of the heterojunction at the interface of Ta2O5 and FeTaO4, the photo-generated highly energetic electrons within Ta2O5 undergo a transfer to the CB of FeTaO4; at the same time, the excited holes will transfer to the VB of FeTaO4 due to their distinctive band position [42,43,44,45]. This charge carrier migration is principally contributed by the more positive CB and the more negative VB of FeTaO4. The electrons in the CB of FeTaO4 are likely to anticipate reacting with photons from water to form hydrogen. At the same time, the holes in the VB of FeTaO4 can oxidize methanol, which serves as a sacrificial electron donor, to produce photons and CO2 [44]. The metallic TaO2 in sample 1000-4 acts as a co-catalyst by providing additional electrons and a surface for catalysing photon reduction into hydrogen, further enhancing the photocatalytic hydrogen evolution process [46].

4. Conclusions

In this work, we successfully prepared circular sheet-like structural tantalum–iron composites and investigated their potential prospective use as efficient photocatalysts for hydrogen evolution. The systematic research of different calcination temperatures (1000 °C and 1100 °C) provided valuable insights into how these conditions influence the composites’ phase composition and particle size, allowing for improved control over their photocatalytic properties. Notably, sample 1000-4, composed of a TaO2/Ta2O5/FeTaO4 heterojunction composite, exhibited an impressive photocatalytic hydrogen evolution ability, surpassing the performance of sample 1100-1 (Ta2O5/FeTaO4) by more than twofold. The increased photocatalytic effectiveness found in samples 1000-4 can be attributed to several essential factors. Upon comprehensive analysis of the optical properties and band structure, it is posited that the formation of heterojunctions could amplify the photoelectrochemical properties and photocatalytic performance. This enhancement seems to be attributable to an augmentation in the number of active sites, an optimized band structure, and a heightened charge separation efficiency. Our results underscore the significance of judicious material design and highlight the potential of tantalum–iron heterojunction composites as catalysts. Such materials hold promise in advancing the renewable energy landscape, particularly within the solar hydrogen research domain.

Author Contributions

Writing—original draft preparation, X.Y.; writing—review and editing, A.R. and A.A.T.; formal analysis and investigation, all authors; funding acquisition, A.A.T. All authors have read and agreed to the published version of the manuscript.

Funding

This work was funded by the Engineering and Physical Sciences Research Council (EPSRC), grant numbers EP/T025875/1 and EP/V049046/1.

Data Availability Statement

Data are available upon request to the corresponding author.

Acknowledgments

Authors acknowledge support from EPSRC, grant numbers EP/T025875/1 and EP/V049046/1. X.Y. acknowledges financial support from the University of Exeter-China Scholarship Council PhD Scholarship.

Conflicts of Interest

The authors declare no conflict of interest.

References

  1. Gao, H.; Liu, Q.; Yan, C.; Wu, Q.; Gong, D.; He, W.; Liu, H.; Wang, J.; Mei, X. Mitigation of greenhouse gas emissions and improved yield by plastic mulching in rice production. Sci. Total Environ. 2023, 880, 162984. [Google Scholar] [CrossRef] [PubMed]
  2. Meda, U.S.; Rajyaguru, Y.V.; Pandey, A. Generation of green hydrogen using self-sustained regenerative fuel cells: Opportunities and challenges. Int. J. Hydrogen Energy 2023, 48, 28289–28314. [Google Scholar] [CrossRef]
  3. Viteri, J.P.; Viteri, S.; Alvarez-Vasco, C.; Henao, F. A systematic review on green hydrogen for off-grid communities –technologies, advantages, and limitations. Int. J. Hydrogen Energy 2023, 48, 19751–19771. [Google Scholar] [CrossRef]
  4. Kumar, A.; Khosla, A.; Sharma, S.K.; Dhiman, P.; Sharma, G.; Gnanasekaran, L.; Naushad, M.; Stadler, F.J. A review on S-scheme and dual S-scheme heterojunctions for photocatalytic hydrogen evolution, water detoxification and CO2 reduction. Fuel 2023, 333, 126267. [Google Scholar] [CrossRef]
  5. Sun, T.; Wei, J.; Zhou, C.; Wang, Y.; Shu, Z.; Zhou, J.; Chen, J. Facile preparation and enhanced photocatalytic hydrogen evolution of cation-exchanged zeolite LTA supported TiO2 photocatalysts. Int. J. Hydrogen Energy 2023, 48, 13851–13863. [Google Scholar] [CrossRef]
  6. Hunge, Y.M.; Yadav, A.A.; Kang, S.W.; Lim, S.J.; Kim, H. Visible light activated MoS2/ZnO composites for photocatalytic degradation of ciprofloxacin antibiotic and hydrogen production. J. Photochem. Photobiol. A Chem. 2023, 434, 114250. [Google Scholar] [CrossRef]
  7. Hunge, Y.; Yadav, A.; Kang, S.-W.; Kim, H. Facile synthesis of multitasking composite of Silver nanoparticle with Zinc oxide for 4-nitrophenol reduction, photocatalytic hydrogen production, and 4-chlorophenol degradation. J. Alloys Compd. 2022, 928, 167133. [Google Scholar] [CrossRef]
  8. Shrestha, N.K.; Lee, K.; Hahn, R.; Schmuki, P. Anodic growth of hierarchically structured nanotubular ZnO architectures on zinc surfaces using a sulfide based electrolyte. Electrochem. Commun. 2013, 34, 9–13. [Google Scholar] [CrossRef]
  9. Shrestha, N.K.; Lee, K.; Kirchgeorg, R.; Hahn, R.; Schmuki, P. Self-organization and zinc doping of Ga2O3 nanoporous architecture: A potential nano-photogenerator for hydrogen. Electrochem. Commun. 2013, 35, 112–115. [Google Scholar] [CrossRef]
  10. Shrestha, N.K.; Bui, H.T.; Lee, T.; Noh, Y.-Y. Interfacial Engineering of Nanoporous Architectures in Ga2O3 Film toward Self-Aligned Tubular Nanostructure with an Enhanced Photocatalytic Activity on Water Splitting. Langmuir 2018, 34, 4575–4583. [Google Scholar] [CrossRef]
  11. Zhang, H.; Zhu, Z.; Yang, M.; Li, Y.; Lin, X.; Li, M.; Tang, S.; Teng, Y.; Kuang, D.-B. Constructing the Sulfur-Doped CdO@In2O3 Nanofibers Ternary Heterojunction for Efficient Photocatalytic Hydrogen Production. Nanomaterials 2023, 13, 401. [Google Scholar] [CrossRef] [PubMed]
  12. Wang, X.; Li, Y.; Li, T.; Jin, Z. Synergistic Effect of Bimetallic Sulfide Enhances the Performance of CdS Photocatalytic Hydrogen Evolution. Adv. Sustain. Syst. 2022, 7, 2200139. [Google Scholar] [CrossRef]
  13. Balan, B.; Xavier, M.M.; Mathew, S. MoS2-Based Nanocomposites for Photocatalytic Hydrogen Evolution and Carbon Dioxide Reduction. ACS Omega 2023, 8, 25649–25673. [Google Scholar] [CrossRef]
  14. Yang, S.; Wang, K.; Yu, H.; Huang, Y.; Guo, P.; Ye, C.; Wen, H.; Zhang, G.; Luo, D.; Jiang, F.; et al. Carbon fibers derived from spent cigarette filters for supporting ZnIn2S4/g-C3N4 heterojunction toward enhanced photocatalytic hydrogen evolution. Mater. Sci. Eng. B 2023, 288, 116214. [Google Scholar] [CrossRef]
  15. Zhong, X.; Li, Y.; Wu, H.; Xie, R. Recent progress in BiVO4-based heterojunction nanomaterials for photocatalytic applications. Mater. Sci. Eng. B 2023, 289, 116278. [Google Scholar] [CrossRef]
  16. An, L.; Han, X.; Li, Y.; Wang, H.; Hou, C.; Zhang, Q. One step synthesis of self-doped F–Ta2O5 nanoshuttles photocatalyst and enhanced photocatalytic hydrogen evolution. Int. J. Hydrogen Energy 2020, 46, 3996–4006. [Google Scholar] [CrossRef]
  17. Alhabradi, M.; Nundy, S.; Ghosh, A.; Tahir, A.A. Vertically Aligned CdO-Decked α-Fe2O3 Nanorod Arrays by a Radio Frequency Sputtering Method for Enhanced Photocatalytic Applications. ACS Omega 2022, 7, 28396–28407. [Google Scholar] [CrossRef]
  18. Ren, R.; Zhao, H.; Sui, X.; Guo, X.; Huang, X.; Wang, Y.; Dong, Q.; Chen, J. Exfoliated Molybdenum Disulfide Encapsulated in a Metal Organic Framework for Enhanced Photocatalytic Hydrogen Evolution. Catalysts 2019, 9, 89. [Google Scholar] [CrossRef]
  19. Romero, N.; Bofill, R.; Francàs, L.; García-Antón, J.; Sala, X. Light-Driven Hydrogen Evolution Assisted by Covalent Organic Frameworks. Catalysts 2021, 11, 754. [Google Scholar] [CrossRef]
  20. Cao, X.; Wen, P.; Ma, R.; Liu, Y.; Sun, S.; Ma, Q.; Zhang, P.; Qiu, Y. Ni2P nanocrystals modification on Ta:α-Fe2O3 photoanode for efficient photoelectrochemical water splitting: In situ formation and synergistic catalysis of Ni2P@NiOOH cocatalyst. Chem. Eng. J. 2022, 449, 137792. [Google Scholar] [CrossRef]
  21. Chang, H.-W.; Fu, Y.; Lee, W.-Y.; Lu, Y.-R.; Huang, Y.-C.; Chen, J.-L.; Chen, C.-L.; Chou, W.C.; Chen, J.-M.; Lee, J.-F.; et al. Visible light-induced electronic structure modulation of Nb- and Ta-doped α-Fe2O3 nanorods for effective photoelectrochemical water splitting. Nanotechnology 2018, 29, 064002. [Google Scholar] [CrossRef] [PubMed]
  22. Liu, A.; Chen, Z.; Wei, X.; Xiao, W.; Ding, J. Economical Fe-doped Ta2O5 electrocatalyst toward efficient oxygen evolution: A combined experimental and first-principles study. MRS Commun. 2017, 7, 563–569. [Google Scholar] [CrossRef]
  23. Jing, D.; Guo, L. Hydrogen production over Fe-doped tantalum oxide from an aqueous methanol solution under the light irradiation. J. Phys. Chem. Solids 2007, 68, 2363–2369. [Google Scholar] [CrossRef]
  24. Kong, F.; Jiao, G.; Wang, J.; Tao, S.; Han, Z.; Fang, Y.; Zhang, L.; Qian, B.; Jiang, X. Preparation and characterization of nano-sized FeTaO4/graphite for lithium-ion batteries. Solid State Ionics 2017, 313, 45–51. [Google Scholar] [CrossRef]
  25. Zhang, H.; Noh, W.Y.; Li, F.; Kim, J.H.; Jeong, H.Y.; Lee, J.S. Three Birds, One-Stone Strategy for Hybrid Microwave Synthesis of Ta and Sn Codoped Fe2O3 @FeTaO4 Nanorods for Photo-Electrochemical Water Oxidation. Adv. Funct. Mater. 2019, 29, 1805737. [Google Scholar] [CrossRef]
  26. Lucas, S.; Moskovkin, P. Simulation at high temperature of atomic deposition, islands coalescence, Ostwald and inverse Ostwald ripening with a general simple kinetic Monte Carlo code. Thin Solid Films 2010, 518, 5355–5361. [Google Scholar] [CrossRef]
  27. Kharatyan, T.; Gopireddy, S.R.; Ogawa, T.; Kodama, T.; Nishimoto, N.; Osada, S.; Scherließ, R.; Urbanetz, N.A. Quantitative Analysis of Glassy State Relaxation and Ostwald Ripening during Annealing Using Freeze-Drying Microscopy. Pharmaceutics 2022, 14, 1176. [Google Scholar] [CrossRef]
  28. Liu, Y.; Xu, L.; Xin, Y.; Liu, F.; Xuan, J.; Guo, M.; Duan, T. IrO2-Ta2O5 Anode for Oxygen Evolution with TaOx Interlayer Prepared by Thermal Decomposition in Inert Atmosphere. J. Electrochem. Soc. 2022, 169, 046516. [Google Scholar] [CrossRef]
  29. Mathi, S.; Jayabharathi, J. Enhanced stability and ultrahigh activity of amorphous ripple nanostructured Ni-doped Fe oxyhydroxide electrode toward synergetic electrocatalytic water splitting. RSC Adv. 2020, 10, 26364–26373. [Google Scholar] [CrossRef]
  30. Zhang, Q.; Liu, N.; Guan, J. Accelerative oxygen evolution by Cu-doping into Fe-Co oxides. Sustain. Energy Fuels 2020, 4, 143–148. [Google Scholar] [CrossRef]
  31. Li, Z.; Chen, H.; Liu, W. Full-Spectrum Photocatalytic Activity of ZnO/CuO/ZnFe2O4 Nanocomposite as a PhotoFenton-Like Catalyst. Catalysts 2018, 8, 557. [Google Scholar] [CrossRef]
  32. Abdelkader, E.; Nadjia, L.; Naceur, B.; Favier-Teodorescu, L. Thermal, structural and optical properties of magnetic BiFeO3 micron-particles synthesized by coprecipitation method: Heterogeneous photocatalysis study under white LED irradiation. Cerâmica 2022, 68, 84–96. [Google Scholar] [CrossRef]
  33. Maia DL, S.; Pepe, I.; da Silva, A.F.; Silva, L.A. Visible-light-driven photocatalytic hydrogen production over dye-sensitized β-BiTaO4. J. Photochem. Photobiol. A Chem. 2012, 243, 61–64. [Google Scholar] [CrossRef]
  34. Montoya, A.T.; Gillan, E.G. Enhanced Photocatalytic Hydrogen Evolution from Transition-Metal Surface-Modified TiO2. ACS Omega 2018, 3, 2947–2955. [Google Scholar] [CrossRef] [PubMed]
  35. Gao, L.; Diwu, J.; Zhang, Q.; Xu, H.; Chou, X.; Tang, J.; Xue, C. A Green and Facile Synthesis of Carbon-Incorporated Co3O4 Nanoparticles and Their Photocatalytic Activity for Hydrogen Evolution. J. Nanomater. 2015, 2015, 618492. [Google Scholar] [CrossRef]
  36. Ye, J.; Zou, Z.; Oshikiri, M.; Matsushita, A.; Shimoda, M.; Imai, M.; Shishido, T. A novel hydrogen-evolving photocatalyst InVO4 active under visible light irradiation. Chem. Phys. Lett. 2002, 356, 221–226. [Google Scholar] [CrossRef]
  37. Zou, Z.; Ye, J.; Sayama, K.; Arakawa, H. Direct splitting of water under visible light irradiation with an oxide semiconductor photocatalyst. Nature 2001, 414, 625–627. [Google Scholar] [CrossRef] [PubMed]
  38. Zou, Z.; Ye, J.; Sayama, K.; Arakawa, H. Photocatalytic and photophysical properties of a novel series of solid photocatalysts, BiTa1−xNbxO4 (0 ≤ x ≤ 1). Chem. Phys. Lett. 2001, 343, 303–308. [Google Scholar] [CrossRef]
  39. Yang, M.; Huang, X.; Yan, S.; Li, Z.; Yu, T.; Zou, Z. Improved hydrogen evolution activities under visible light irradiation over NaTaO3 codoped with lanthanum and chromium. Mater. Chem. Phys. 2010, 121, 506–510. [Google Scholar] [CrossRef]
  40. Hu, C.-C.; Nian, J.-N.; Teng, H. Electrodeposited p-type Cu2O as photocatalyst for H2 evolution from water reduction in the presence of WO3. Sol. Energy Mater. Sol. Cells 2008, 92, 1071–1076. [Google Scholar] [CrossRef]
  41. El-Bery, H.M.; Salah, M.R.; Ahmed, S.M.; Soliman, S.A. Efficient non-metal based conducting polymers for photocatalytic hydrogen production: Comparative study between polyaniline, polypyrrole and PEDOT. RSC Adv. 2021, 11, 13229–13244. [Google Scholar] [CrossRef]
  42. Yin, X.-T.; Dastan, D.; Wu, F.-Y.; Li, J. Facile Synthesis of SnO2/LaFeO3−XNX Composite: Photocatalytic Activity and Gas Sensing Performance. Nanomaterials 2019, 9, 1163. [Google Scholar] [CrossRef] [PubMed]
  43. Wang, R.; Wang, Y.; Mao, S.; Hao, X.; Duan, X.; Wen, Y. Different Morphology MoS2 Over the g-C3N4 as a Boosted Photo-Catalyst for Pollutant Removal Under Visible-Light. J. Inorg. Organomet. Polym. Mater. 2020, 31, 32–42. [Google Scholar] [CrossRef]
  44. Yao, Y.; Gao, X.; Li, Z.; Meng, X. Photocatalytic Reforming for Hydrogen Evolution: A Review. Catalysts 2020, 10, 335. [Google Scholar] [CrossRef]
  45. Liu, D.; Zi, W.; Sajjad, S.D.; Hsu, C.; Shen, Y.; Wei, M.; Liu, F. Reversible Electron Storage in an All-Vanadium Photoelectrochemical Storage Cell: Synergy between Vanadium Redox and Hybrid Photocatalyst. ACS Catal. 2015, 5, 2632–2639. [Google Scholar] [CrossRef]
  46. Park, G.-S.; Kim, Y.B.; Park, S.Y.; Li, X.S.; Heo, S.; Lee, M.-J.; Chang, M.; Kwon, J.H.; Kim, M.; Chung, U.-I.; et al. In situ observation of filamentary conducting channels in an asymmetric Ta2O5−x/TaO2−x bilayer structure. Nat. Commun. 2013, 4, 2382. [Google Scholar] [CrossRef] [PubMed]
  47. Chun, W.-J.; Ishikawa, A.; Fujisawa, H.; Takata, T.; Kondo, J.N.; Hara, M.; Kawai, M.; Matsumoto, Y.; Domen, K. Conduction and Valence Band Positions of Ta2O5, TaON, and Ta3N5 by UPS and Electrochemical Methods. J. Phys. Chem. B 2003, 107, 1798–1803. [Google Scholar] [CrossRef]
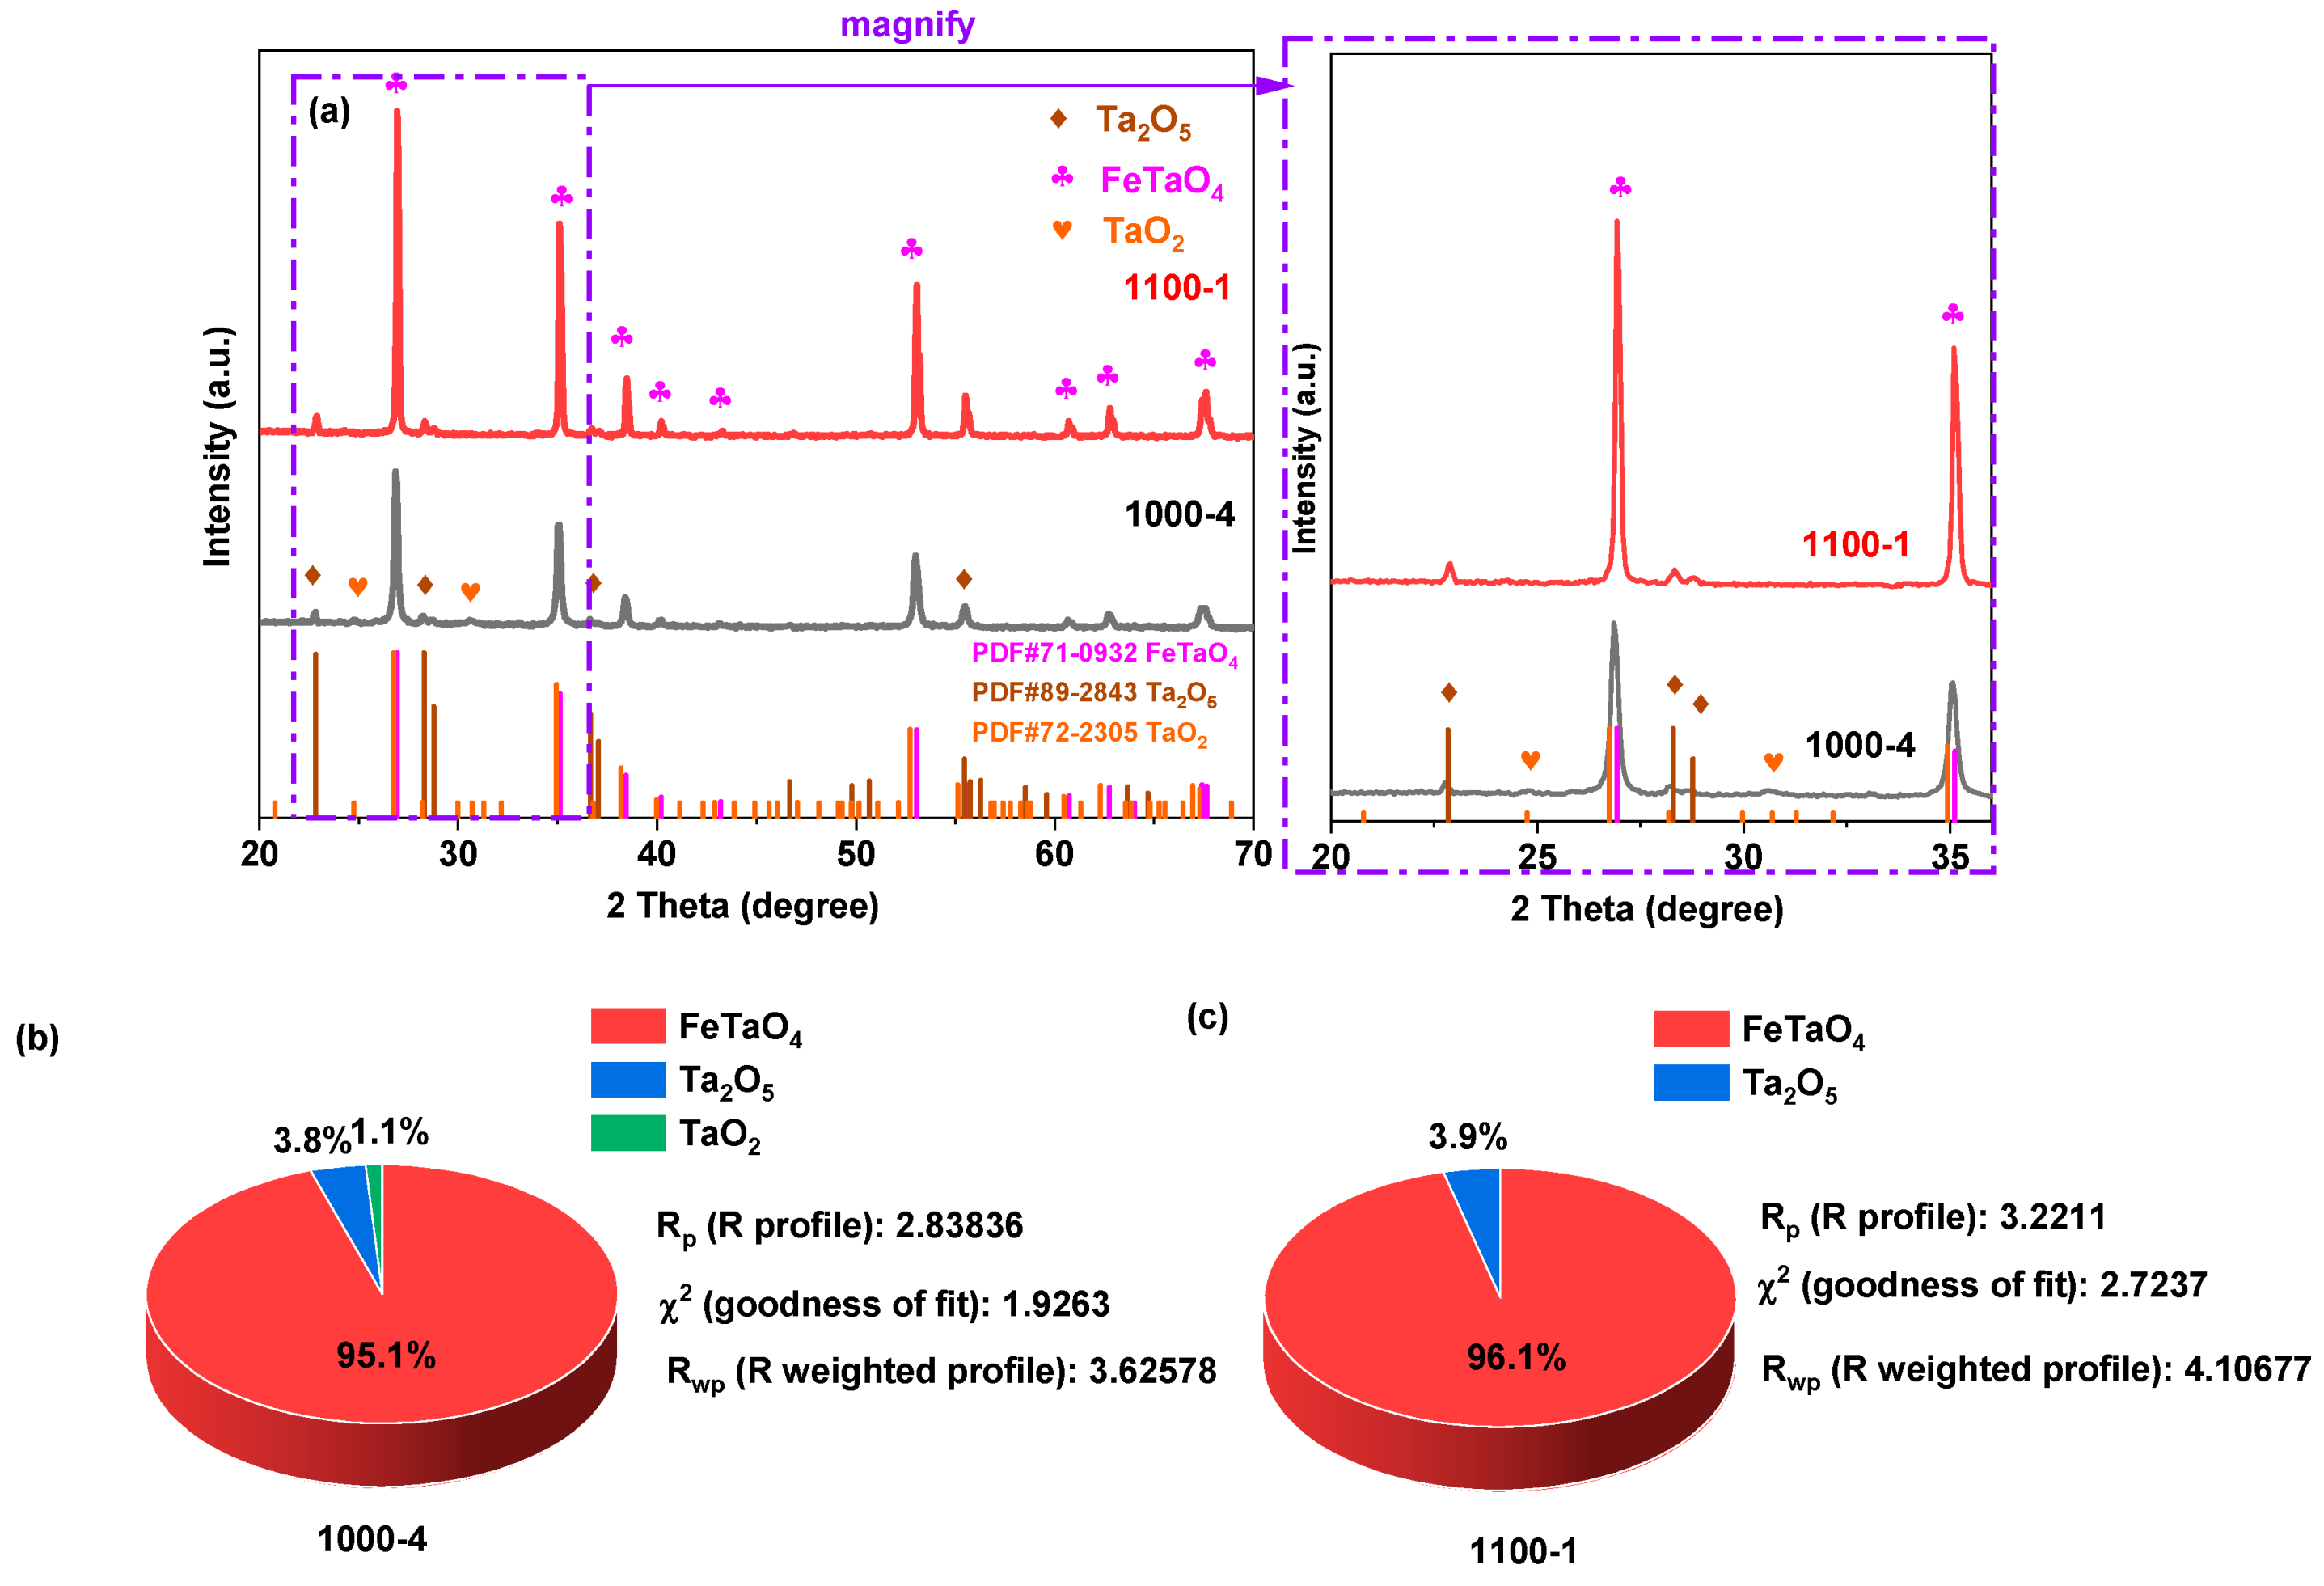
Figure 1. (a) XRD patterns; Phase composition and corresponding refined parameters revealed from the Rietveld refinement analysis: (b) sample 1000-4 and (c) sample 1100-1.
Nanomaterials 13 02464 g001
Figure 2. SEM images of the prepared samples and their respective particle size distribution histograms: (a,b) for sample 1000-4, (c,d) for sample 1100-1.
Nanomaterials 13 02464 g002
Figure 3. TEM (a) and HRTEM (b) images of sample 1000-4; TEM (c) and HRTEM (d) images of sample 1100-1.
Nanomaterials 13 02464 g003
Figure 4. (a) XPS survey scan spectrum of sample 1000-4, and the corresponding high-resolution spectra for (b) Ta 4f, (c) Fe 2p, and (d) O 1s.
Nanomaterials 13 02464 g004
Figure 5. (a) UV-vis DRS spectra and (b) Tauc plot analyses for bandgap determination of sample 1000-4 and 1100-1.
Nanomaterials 13 02464 g005
Figure 6. (a) Photocatalytic hydrogen evolution rates, (b) time-dependent photocatalytic hydrogen evolution performance, (c) transient photocurrent plots, and (d) ESI Nyquist plots of produced samples 1000-4 and 1100-1.
Nanomaterials 13 02464 g006
Figure 7. (a) Photocatalytic stability plots for hydrogen evolution rate; XRD patterns of sample 1000-4 (b) and 1100-1 (c) before and after the reaction.
Nanomaterials 13 02464 g007
Figure 8. The produced samples’ (a) UPS spectra and (b) band structure diagram.
Nanomaterials 13 02464 g008
Figure 9. (a) Energy band positions of Ta2O5 and FeTaO4 and (b) corresponding schematic diagram depicting the photocatalytic hydrogen generation process.
Nanomaterials 13 02464 g009
Table 1. Metal oxide photocatalysts for photocatalytic hydrogen evolution.
PhotocatalystsHydrogen Evolution Rate (µmol/h)Light ResourceRef.
P256.4Ultraviolet light[34]
Carbon-incorporated Co3O40.85Solar light[35]
InVO45Ultraviolet light[36]
InTaO44Ultraviolet light[37]
BiTaO44Ultraviolet light[38]
NaTaO3: La/Cr4.4Ultraviolet light[39]
Cu2O/WO31.9Ultraviolet light[40]
Table 2. Band gap energy (Eg), valance band (Ev) band position, and conduction band (Ec) position.
Eg (eV)Ec (eV)Ev (eV)Ref.
Ta2O53.9−4.03−7.93[47]
FeTaO42.4−0.162.24[25]
Disclaimer/Publisher’s Note: The statements, opinions and data contained in all publications are solely those of the individual author(s) and contributor(s) and not of MDPI and/or the editor(s). MDPI and/or the editor(s) disclaim responsibility for any injury to people or property resulting from any ideas, methods, instructions or products referred to in the content.