Article

Impact of Ce/Zr Ratio in the Nanostructured Ceria and Zirconia Composites on the Selective CO2 Adsorption

1
Institute of Organic Chemistry with Centre of Phytochemistry, Bulgarian Academy of Sciences, 1113 Sofia, Bulgaria
2
Faculty of Science, University of Jan Evangelista Purkyně, Pasteurova 3632/15, 400 96 Ústí nad Labem, Czech Republic
3
Research Centre for Natural Sciences, Institute of Materials and Environmental Chemistry, Magyar Tudosok krt. 2, 1117 Budapest, Hungary
4
Institute of General and Inorganic Chemistry, Bulgarian Academy of Sciences, 1113 Sofia, Bulgaria
5
Institute of Optical Materials and Technologies, Bulgarian Academy of Sciences, 1113 Sofia, Bulgaria
*
Author to whom correspondence should be addressed.
Nanomaterials 2023, 13(17), 2428; https://doi.org/10.3390/nano13172428
Submission received: 22 July 2023 / Revised: 15 August 2023 / Accepted: 23 August 2023 / Published: 26 August 2023
(This article belongs to the Special Issue Nanostructured Mesoporous and Zeolite-Based Materials)

Abstract

:
High surface-area, mesoporous CeO2, ZrO2, and Ce-Zr composite nanoparticles were developed using the hydrothermal template-assisted synthesis method. Samples were characterized using XRD, N2 physisorption, TEM, XPS, and FT-IR spectroscopic methods. The CO2 adsorption ability of the obtained materials was tested under dynamic and equilibrium conditions. A high CO2 adsorption capacity in CO2/N2 flow or CO2/N2/H2O was determined for all studied adsorbents depending on their composition flow. A higher CO2 adsorption was registered for Ce-Zr composite nanomaterials due to the presence of strong O2− base sites and enriched surface oxygen species. The role of the Ce/Zr ratio is the process of the formation of highly active and selective adsorption sites is discussed. The calculated heat of adsorption revealed the processes of chemisorption and physisorption. Experimental data could be appropriately described by the Yoon–Nelson kinetic model. The composites reused in five adsorption/desorption cycles showed a high stability with a slight decrease in CO2 adsorption capacities in dry flow and in the presence of water vapor.

1. Introduction

Today’s rapid economic development contributes to a significant increase in the use of energy obtained from conventional fossil fuels (coal, oil, and natural gas) [1,2]. The massive use of fossil fuels leads to adverse effects on the environment, namely global warming, and critical climate change on earth. Global warming is the result of the increasing concentration of greenhouse gases and in particular, carbon dioxide (CO2), the main anthropogenic greenhouse gas [3]. The significant increase in CO2 concentration in the atmosphere from 340 ppm in 1980 to 408 ppm in 2019 leads to a negative impact on the environment [4]. Nowadays, the high concentration of carbon dioxide in the atmosphere can be reduced by increasing the share of renewable carbon sources or reducing CO2 emissions with anthropogenic origin [1]. For the elimination of greenhouse gases, much attention has been focused on improving the activity of absorbents for the capture of CO2. Various CO2 capture technologies are available at present including adsorption, absorption (chemical and physical absorptions), and different membrane technologies [5,6,7,8,9,10]. The development of efficient materials for these processes is of great importance. Therefore, the CO2 adsorption efficiency can be improved by selecting an appropriate material as an adsorbent. At present, a lot of porous material hosts, such as activated carbon, zeolites, organic polymers, mesoporous silicas, metal-oxide molecular sieves, finely dispersed CaO and nanosized metal-oxide composites are widely investigated [11,12,13,14,15,16,17,18,19]. Among these materials, mesoporous oxide-based adsorbents have been thoroughly studied in recent years. They can be promising candidates in CO2 capture applications due to the possibility to control the pore structure, their good chemical/thermal stability, and good mass transfer of modifiers to the mesoporous matrix. Particular interest and efforts have been focused on the preparation of porous metal oxides with a high specific surface area consisting of crystalline nanosized particles, using various synthesis techniques [13]. The main advantage of these nano-systems over conventional bulk oxides is the large number of available and easily accessible active centers due to the nanoscale state of the material and the very well-developed outer surface.
The presence of water in the flue gas from thermal power plants is one of the major problems for selective CO2 separation by adsorbents [14]. A significant decrease in CO2 adsorption in the presence of H2O is observed for conventional adsorbents such as zeolite. The selectivity for CO2 capture can be increased by applying metal oxides as adsorbents assuming that H2O is physically adsorbed onto their surface and CO2 is chemically adsorbed [14]. Among these oxides, CeO2 exhibited a larger adsorption amount (around 275 mmol/L in dry conditions at 50 °C) and relatively low desorption temperature (below 190 °C) [14]. A remarkable improvement in its physicochemical properties such as density, ionic conductivity, thermal properties, and lattice parameters [15]. The cerium–zirconium oxide systems are used as oxygen storage materials and they are excellent environmental catalysts for pollutant removal, showing high activity, selectivity, and stability [20,21]. Various preparation procedures have been developed for the preparation of mixed cerium–zirconium oxide materials, such as co-precipitation, micro-emulsion methods, sol-gel, thermal method, template synthesis, etc. [22,23,24,25,26,27,28]. Hsiang et al. [22] used the co-precipitation method and found that Ce0.6Zr0.4O2 decomposed into Ce-rich (cubic structure) and Zr-rich (tetragonal structure) phases from a single cubic phase after the calcination process at high temperature. Rumruangwong et al. [24] synthesized ceria–zirconia mixed oxide by sol-gel technique and established that the surface area of the CexZr1−xO2 powders was improved by increasing ceria content, and their thermal stability was increased by the incorporation of ZrO2. Over the past several years, different surfactants (CTAB, Pluronic P123, and F127) have been applied as templates to synthesize mesoporous nanosized ceria–zirconia materials [27,29]. The removal of surfactants after calcination at high temperatures gave rise to the formation of fluorite-structured CexZr1−xO2 materials with well-developed mesoporous structures and a high specific surface area. It has been established that the Ce–Zr mixed oxides are more active catalysts than pure CeO2, due to the partial substitution of Ce4+ (ionic radii = 0.97 Å) with Zr4+ (ionic radii = 0.84 Å), which leads to deformation of the lattice, improving its oxygen storage capacity, the redox properties, and enhancing the catalytic performance and thermal stability [30,31,32,33,34,35,36]. Suguira Masahiro et al. [37] demonstrated that the incorporation of the significantly smaller Zr4+ ion into the cerium-oxide lattice leads to the formation of oxygen vacancies associated with structural relaxation, due to the reduction of Ce4+ to the larger Ce3+ ions. The structural, textural, and reduction properties of Zr-based catalysts can be ascribed to the higher number of defects, formed upon the addition of Zr4+ ions into the ceria lattice, and the subsequent increase in oxygen mobility [38]. The authors [38] established that the surface oxygen sites adjacent to the Ce(III) favor CO2 adsorption compared to those adjacent to Ce(IV), Zr, or surface hydroxyl sites. However, CO2 adsorption capacity and CO2 desorption trends in the presence of H2O for metal-oxide adsorbents remained unclear despite its importance, considering that flue gas contains larger amount of H2O.
In the present study, we focused our attention on the preparation of Ce–Zr composite materials in a wide range of compositions using template-assisted hydrothermal synthesis. The pure CeO2, pure ZrO2, and Ce–Zr composites were studied in CO2 adsorption experiments. The comparative study of samples with different Ce/Zr ratios and a variation of preparation procedures was used for understanding the impact of structural, morphological, textural, and surface features of these materials on their CO2 adsorption capacity, which is important for the control and optimization of the adsorbents’ properties.

2. Experimental Section

2.1. Materials

Cerium(III) chloride heptahydrate (99%) (Alfa Aesar, Kendal, Germany), zirconium chloride anhydrous (98%) (Sigma-Aldrich, Saint Louis, MO, USA), and hexadecyltrimethylammonium bromide (CTAB) (≥98%) (Sigma-Aldrich Chemie, Schnelldorf, Germany) chemicals were used without further purification.

2.2. Preparation of ZrO2, CeO2 and CexZry Adsorbents

CexZry materials were synthesized via hydrothermal method at Ce:Zr molar feed ratios of 1:1 (Ce0.5Zr0.5), 1:2 (Ce0.33Zr0.67), and 2:1 (Ce0.67Zr0.33). Endmembers of the series, i.e., CeO2 and ZrO2, were prepared as well.

2.2.1. Synthesis of CeO2 and ZrO2 Adsorbents

The synthesis of CeO2 and ZrO2 was performed using the following procedure; 5.41 g cerium(III) chloride heptahydrate (CeCl3∙7H2O) or 3.75 g zirconium chloride (ZrCl4), respectively, were completely dissolved in 50 mL distilled water at 50 °C and stirred for 45 min. The solution was mixed with a solution containing 10 mL 25 wt.% ammonia (NH3) in 10 mL H2O. The homogeneous solution was transferred to a Teflon vessel jacketed in a stainless-steel autoclave and heated in an oven at 100 °C for 24 h under static conditions. The white precipitate product was filtered, washed with distilled water, and dried at 40 °C overnight.

2.2.2. Synthesis of Ce0.5Zr0.5, Ce0.67Zr0.33, and Ce0.33Zr0.67 Adsorbents

The synthesis of (1) Ce0.5Zr0.5, (2) Ce0.67Zr0.33, and (3) Ce0.33Zr0.67 was performed using the following procedure. A solution of (1) 1.87 g (2) 1.25 g (3) 2.5 zirconium chloride (ZrCl4) in 50 mL distilled water and (1) 2.71 g, (2) 3.61 g, and (3) 1.81 g cerium(III) chloride heptahydrate (CeCl3∙7H2O) in 50 mL water were added at room temperature to a solution of 6 g CTAB in 100 mL water and stirred for 45 min. The above solution was mixed with a solution containing 10 mL ammonia 25 wt.% (NH3) in 10 mL water. The homogeneous solution was transferred to a Teflon vessel jacketed in a stainless-steel autoclave. Subsequently, the temperature was increased to 100 °C and aged for 24 h under static conditions. The white precipitate product was filtered, washed with distilled water, and dried at 40 °C overnight. The template was removed by calcination at 300 °C for 6 h. An adsorbent with Ce0.5Zr0.5 composition was prepared with the same procedure, but the template was removed by extraction method. The filtered synthesis product was extracted with ethanol at 80 °C for 5 h and dried under vacuum at 40 °C overnight. The latter one is denoted as ext.Ce0.5Zr0.5.

2.3. Characterization

Powder X-ray diffraction patterns were collected on Bruker D8 Advance diffractometer equipped with Cu Kα radiation and LynxEye detector. Phases were identified by Diffrac.EVA v.4 using ICDD-PDF-2 (2021) database. For the estimation of the mean crystallite size, the broadening of the diffraction lines was analyzed by means of whole powder pattern profile fitting using the program Topas v.4.2. The corrections for the instrumental broadening were included by the fundamental approach technique implemented in the program (accounting for the real elements on the beam path).
Determination of the specific surface area and pore size distribution was performed by low-temperature nitrogen adsorption. The adsorption and desorption isotherms of nitrogen at −196 °C were determined in the pressure range of p/p0 = 0.001–1, using an advanced micropore size and chemisorption analyzer “AUTOSORB iQ-MP/AG” (Anton Paar GmbH, Graz, Austria). Before every measurement, the samples were degassed at 80 °C for 16 h.
The morphology, the phase composition, and the microstructure of the samples were analyzed by Transmission Electron Microscopy (TEM) using High Resolution Transmission Electron Microscope HRTEM JEOL JEM 2100 (JEOL Ltd., Tokio, Japan). All measurements were held at 200 kV accelerating voltage. Match software (Version 3.13). Crystal Impact GbR, Bonn, Germany) with Crystallography Open Database (COD) was applied for the phase identification of the samples. The measurements of the nanoparticles diameters for the statistical analysis were implemented by means of Image J freeware (National Institutes of Health, Bethesda, MD, USA).
X-ray photoelectron spectroscopy (XPS) spectra have been obtained using a Phoibos 100 (SPECS) based X-ray photoelectron spectrometer operating in Fixed Analyzer Transmission (FAT) mode with 5-channel MCD-5 detector (SPECS). The spectrometer is equipped with a non-monochromatic X-ray source XR50 with double Al/Mg anode operated under 12 kV (200 W), the core-level spectra were measured using Al Kα radiation (hν = 1486.6 eV), and no flood gun was used. The samples were placed on double-sided carbon conductive adhesive tape. The spectra analyses were made in CasaXPS software with the use of the Shirley background model and built-in RSF for composition calculations. The binding energy was adjusted on a base of valence band XPS spectra.
In situ FT-IR spectra were measured by a Nicolet Compact 6700 spectrometer (Thermo Fisher Scientific, Waltham, MA, USA). Thin, self-supported wafers with 2 cm2 surface area were prepared and pyridine (Py, 6 mbar) was adsorbed at 100 °C for 30 min on the formerly dehydrated samples (300 °C, 1 h) in a special, in situ FT-IR cell. Subsequently, Py was desorbed by evacuation at elevating temperatures 100–300 °C for 30 min. Spectra were recorded at the IR beam temperature with 128 scans at a resolution of 2 cm−1. For quantitative comparison, the spectra were normalized to 5 mg/cm2 weight.
In situ FT-IR CO2 adsorption experiments were conducted in the same spectroscopic system. Mixed-oxide adsorbents were pretreated at 300 °C in high vacuum for 1 h before room temperature CO2 adsorption (15 mbar) for 30 min. Spectra were recorded in CO2 atmosphere at RT, followed by evacuation at RT, 100, 200, and 300 °C. Spectra were also measured with the same parameters as before, namely 128 scans at 2 cm−1 resolution and were normalized to 5 mg/cm2 weight.

2.4. Dynamic and Static CO2 Adsorption

CO2 adsorption experiments were performed in dynamic conditions in a flow-through system. The sample (0.40 g adsorbent) was dried at 150 °C for 1 h, and 3 vol. % CO2/N2 at a flow rate of 30 mL/min was applied for the adsorption experiments at 25 °C. The gas was analyzed online by using a gas chromatograph NEXIS GC-2030 ATF (Shimadzu, Japan) with a 25 m PLOT Q capillary column. CO2 adsorption measurements under static conditions were measured at 0 °C and 25 °C with an AUTOSORB iQ-MP-AG (Anton Paar GmbH, Graz, Austria) surface area and pore size analyzer (from Quantachrome, Anton Paar GmbH, Graz, Austria).

3. Results and Discussion

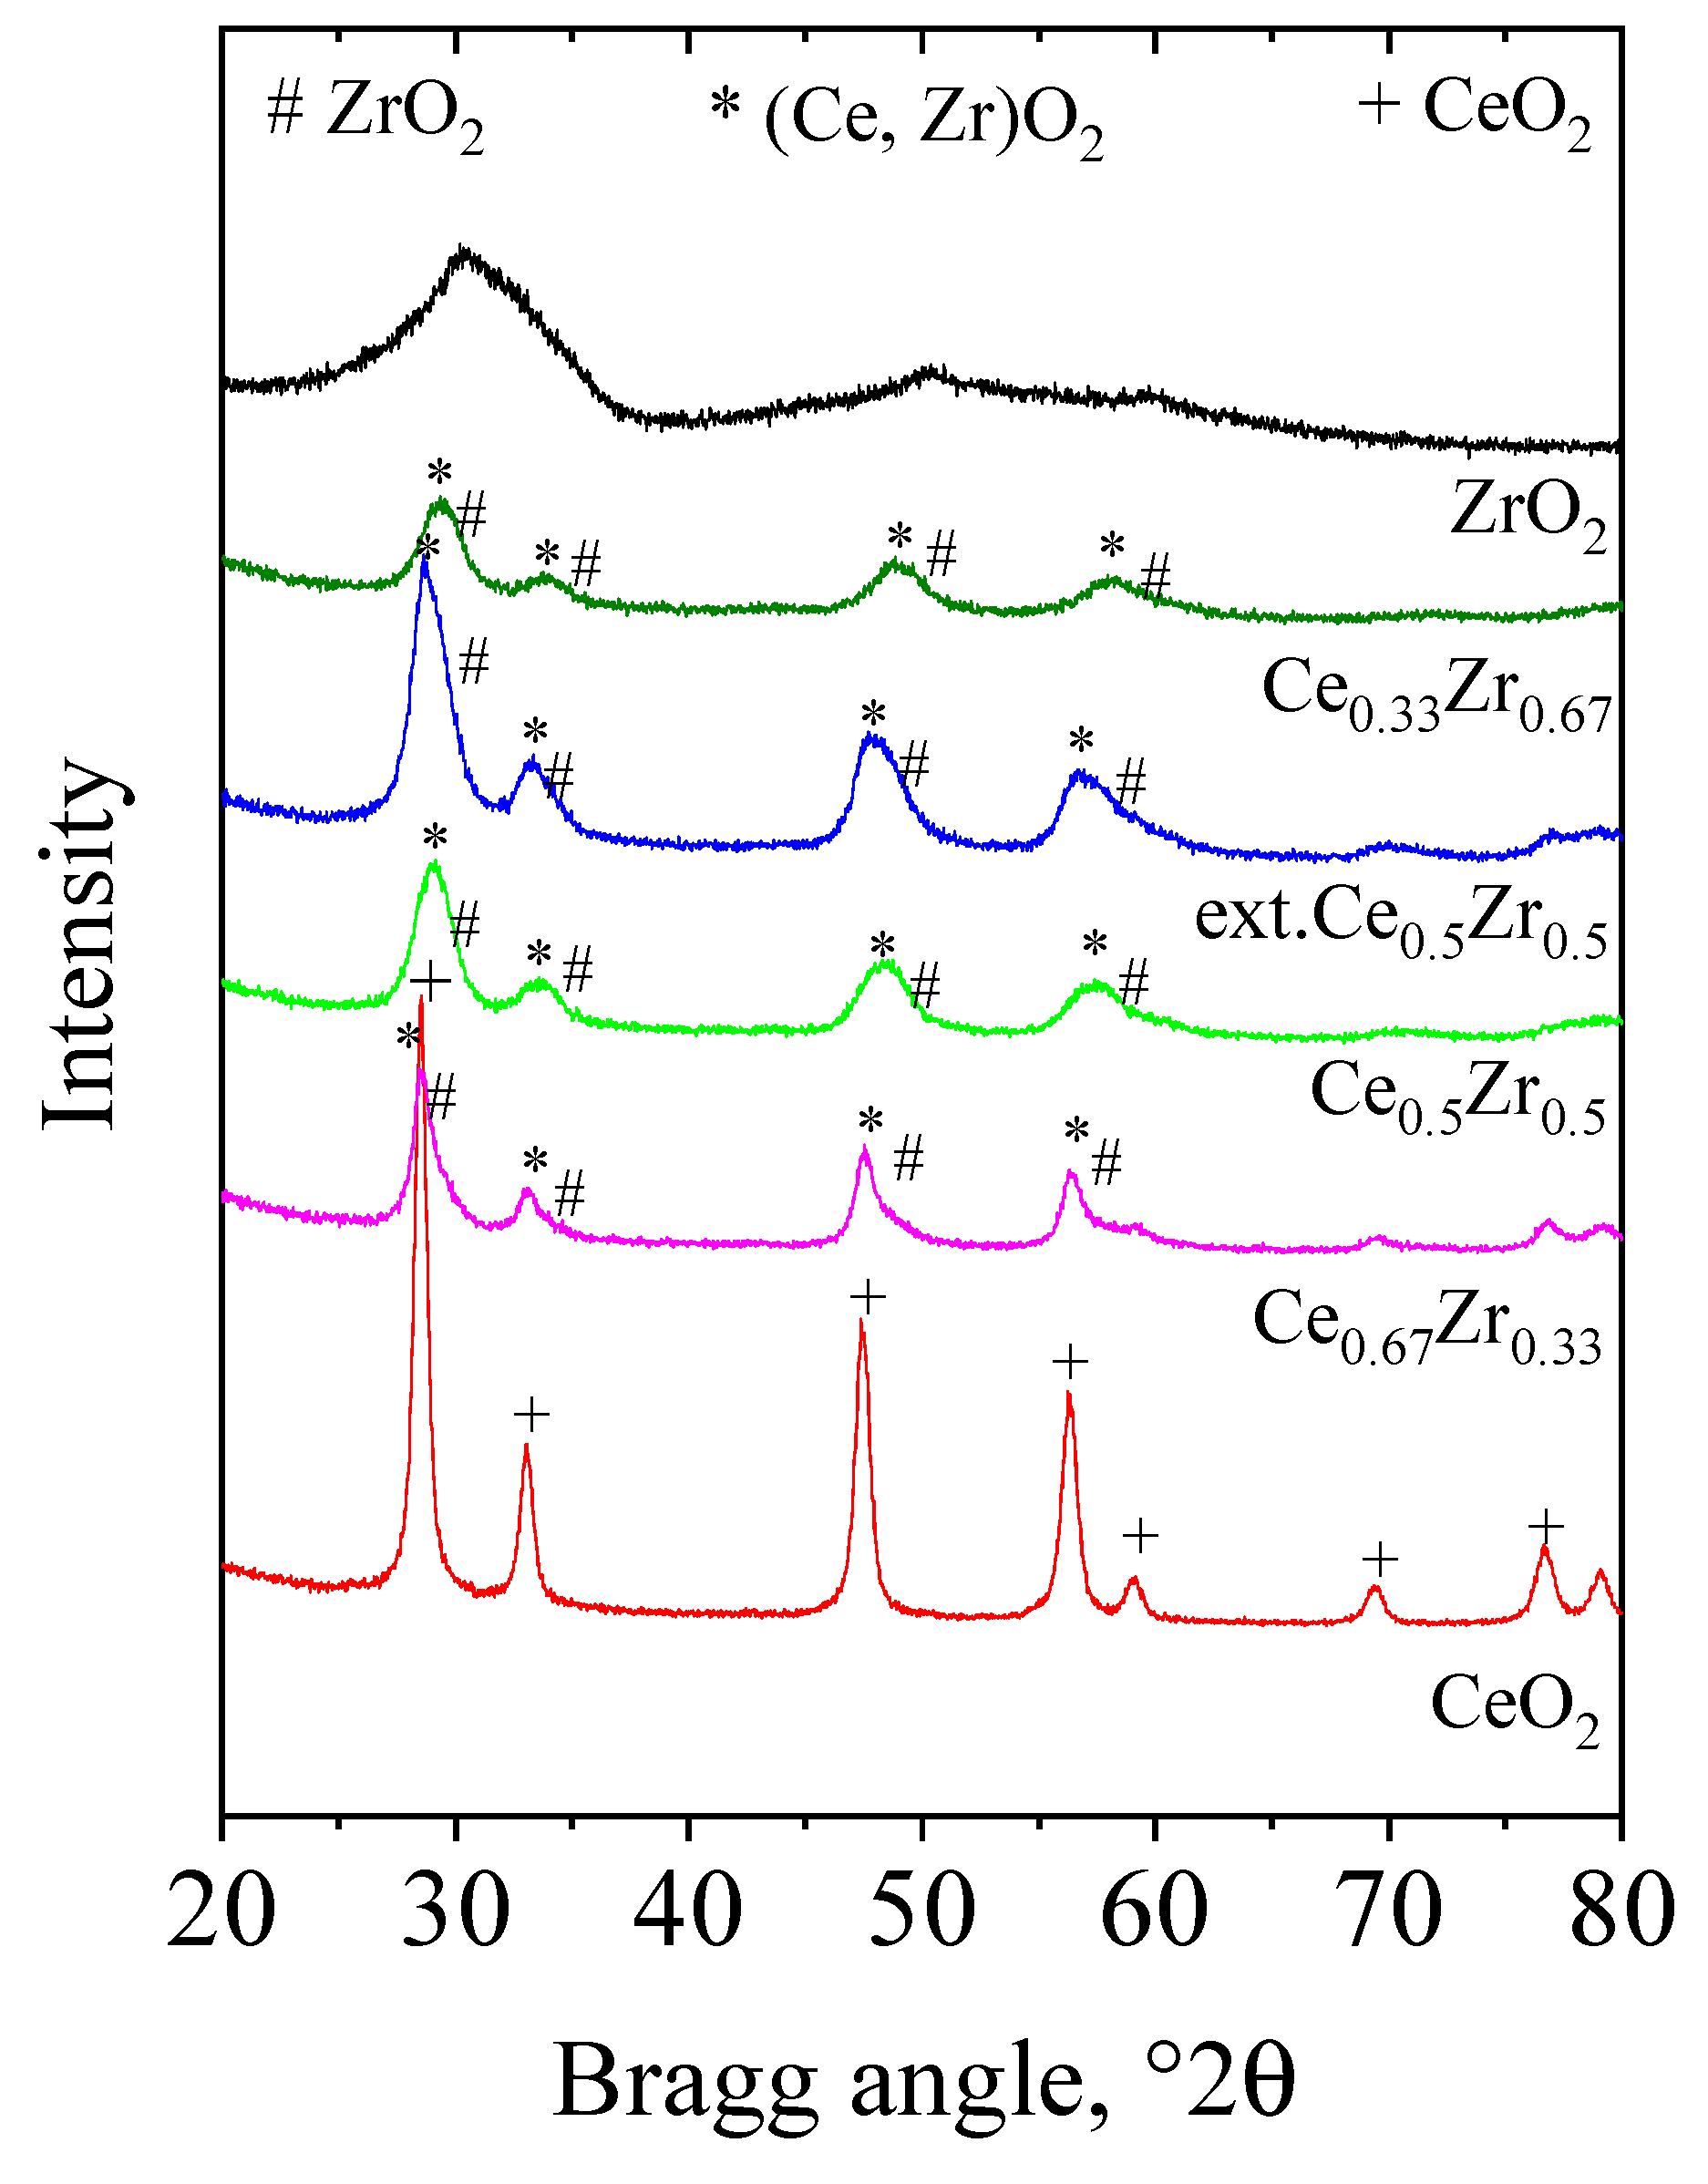
3.1. Textural Characterization
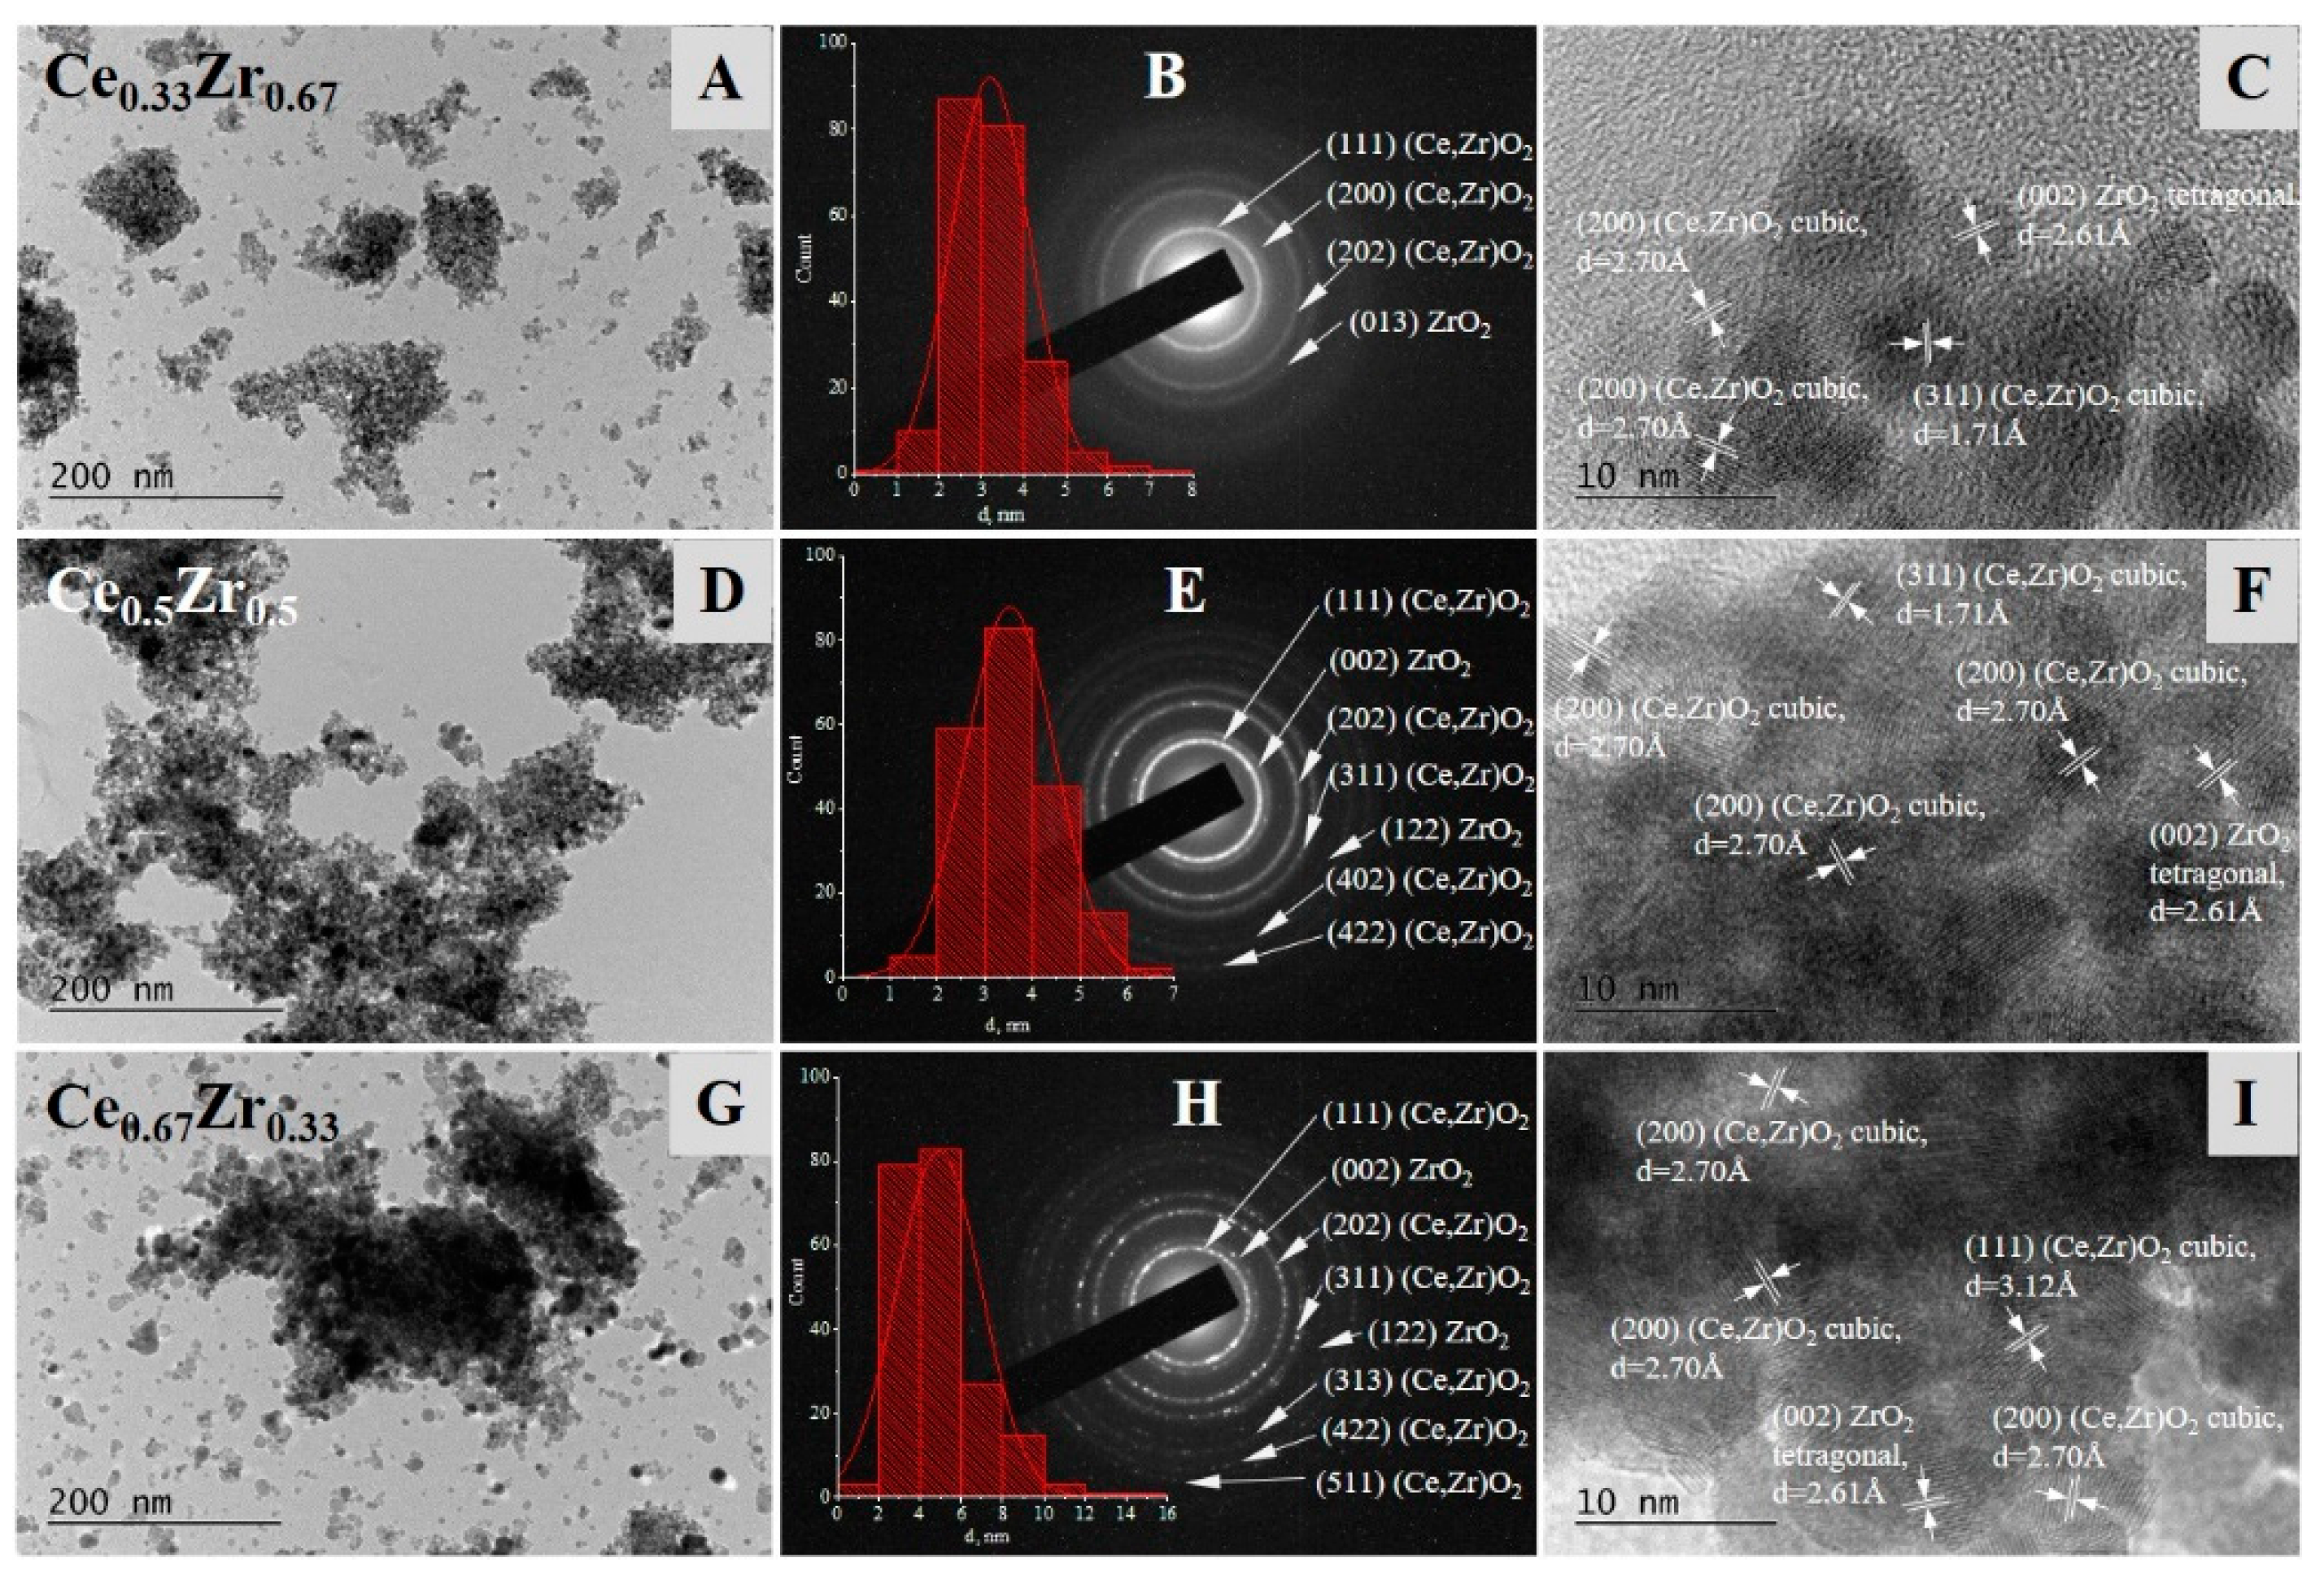
Nitrogen physisorption isotherms of the prepared adsorbents are shown in Figure S1. Specific surface area and total pore volume, calculated from the nitrogen adsorption/desorption isotherms are presented in Table 1. All the isotherms are of type IV, ZrO2 and CeO2 with H3 type, and the mixed oxides are similarly to each other, with H2 type hysteresis loops. ZrO2 showed the highest specific surface area and pore volume, and on the contrary, CeO2 has the lowest one. The Ce–Zr composite adsorbents showed transition values proportional to their zirconia content. The use of the extraction method for template removal (Table 1) resulted in a higher surface area than its counterpart obtained by calcination. The observed differences in the shape of the hysteresis loop indicate the presence of “slit-like” or wedge-shaped pores between flaky particles of pure ZrO2 and CeO2 oxides, and “ink-bottle-like” pores for all mixed-oxide materials.
XRD patterns of samples are presented in Figure 1.
The phase composition, unit cell parameters, and average crystallite size are shown in Table 2. The XRD pattern of ZrO2 represents a broad peak typical of amorphous materials. The CeO2 adsorbent exhibits a face-centered, cubic, fluorite-type structure with crystallite size of 16 nm. In the case of the mixed metal-oxide samples, the CeO2 reflections are broader, lower in intensity, and slightly shifted to higher Bragg angles as well. The broadening of the reflections means a decrease in the crystallite size of the fluorite-like phase, whereas the intensity decrease together with the shifting of position could be assigned to the incorporation of Zr in the ceria lattice. The differences observed in the lattice parameters with the change of the Ce/Zr ratio suggest an alteration in the degree of incorporation of Zr into the fluorite lattice. Considering the smaller ionic radius of Zr4+ (0.084 nm) compared to Ce4+ (0.097 nm), an incorporation of the Zr into ceria lattice can be concluded [30,39,40]. A significant shift of the lattice parameter is observed for the Ce0.33Zr0.67 nanomaterial most probably due to the strongest interaction between CeO2 and ZrO2.

3.2. TEM Analysis

In Figure 2, TEM micrographs at low (40,000×) and high (600,000×) magnifications, histograms of the particles size distribution, and Selected Area Electron Diffraction (SAED) patterns for the composite samples are presented.
The statistical analysis of TEM images revealed a formation of relatively uniform nanoparticles with mean sizes between 3 and 5 nm and narrow size distributions for all three materials. The calculated mean particle diameters dmean for the tree samples studied with the corresponding standard deviations (SD) are as follows: d1mean = 3.21 nm (SD = 0.92 nm) for Ce0.33Zr0.67, d2mean = 3.53 nm (SD = 0.95 nm) for Ce0.5Zr0.5, and d3mean = 4.91 nm (SD = 2.05 nm) for Ce0.67Zr0.33 sample. They follow the same trend of slightly increasing with a decreasing amount of zirconia, similarly to the average crystallite diameters obtained from X-ray diffraction. The SAED patterns and HRTEM indexing and phase composition analysis clearly proved the interaction of CeO2 and ZrO2 by the established formation of a solid solution phase (Ce,Zr)O2 in the mixed-oxide samples. The phase of monometallic oxide ZrO2 was also detected in all samples (CeO2 cubic, a = 5.40730 Å, COD Entry #96-156-2990; ZrO2 tetragonal, a = 3.61200 Å c = 5.21200 Å, COD Entry #96-152-6428).

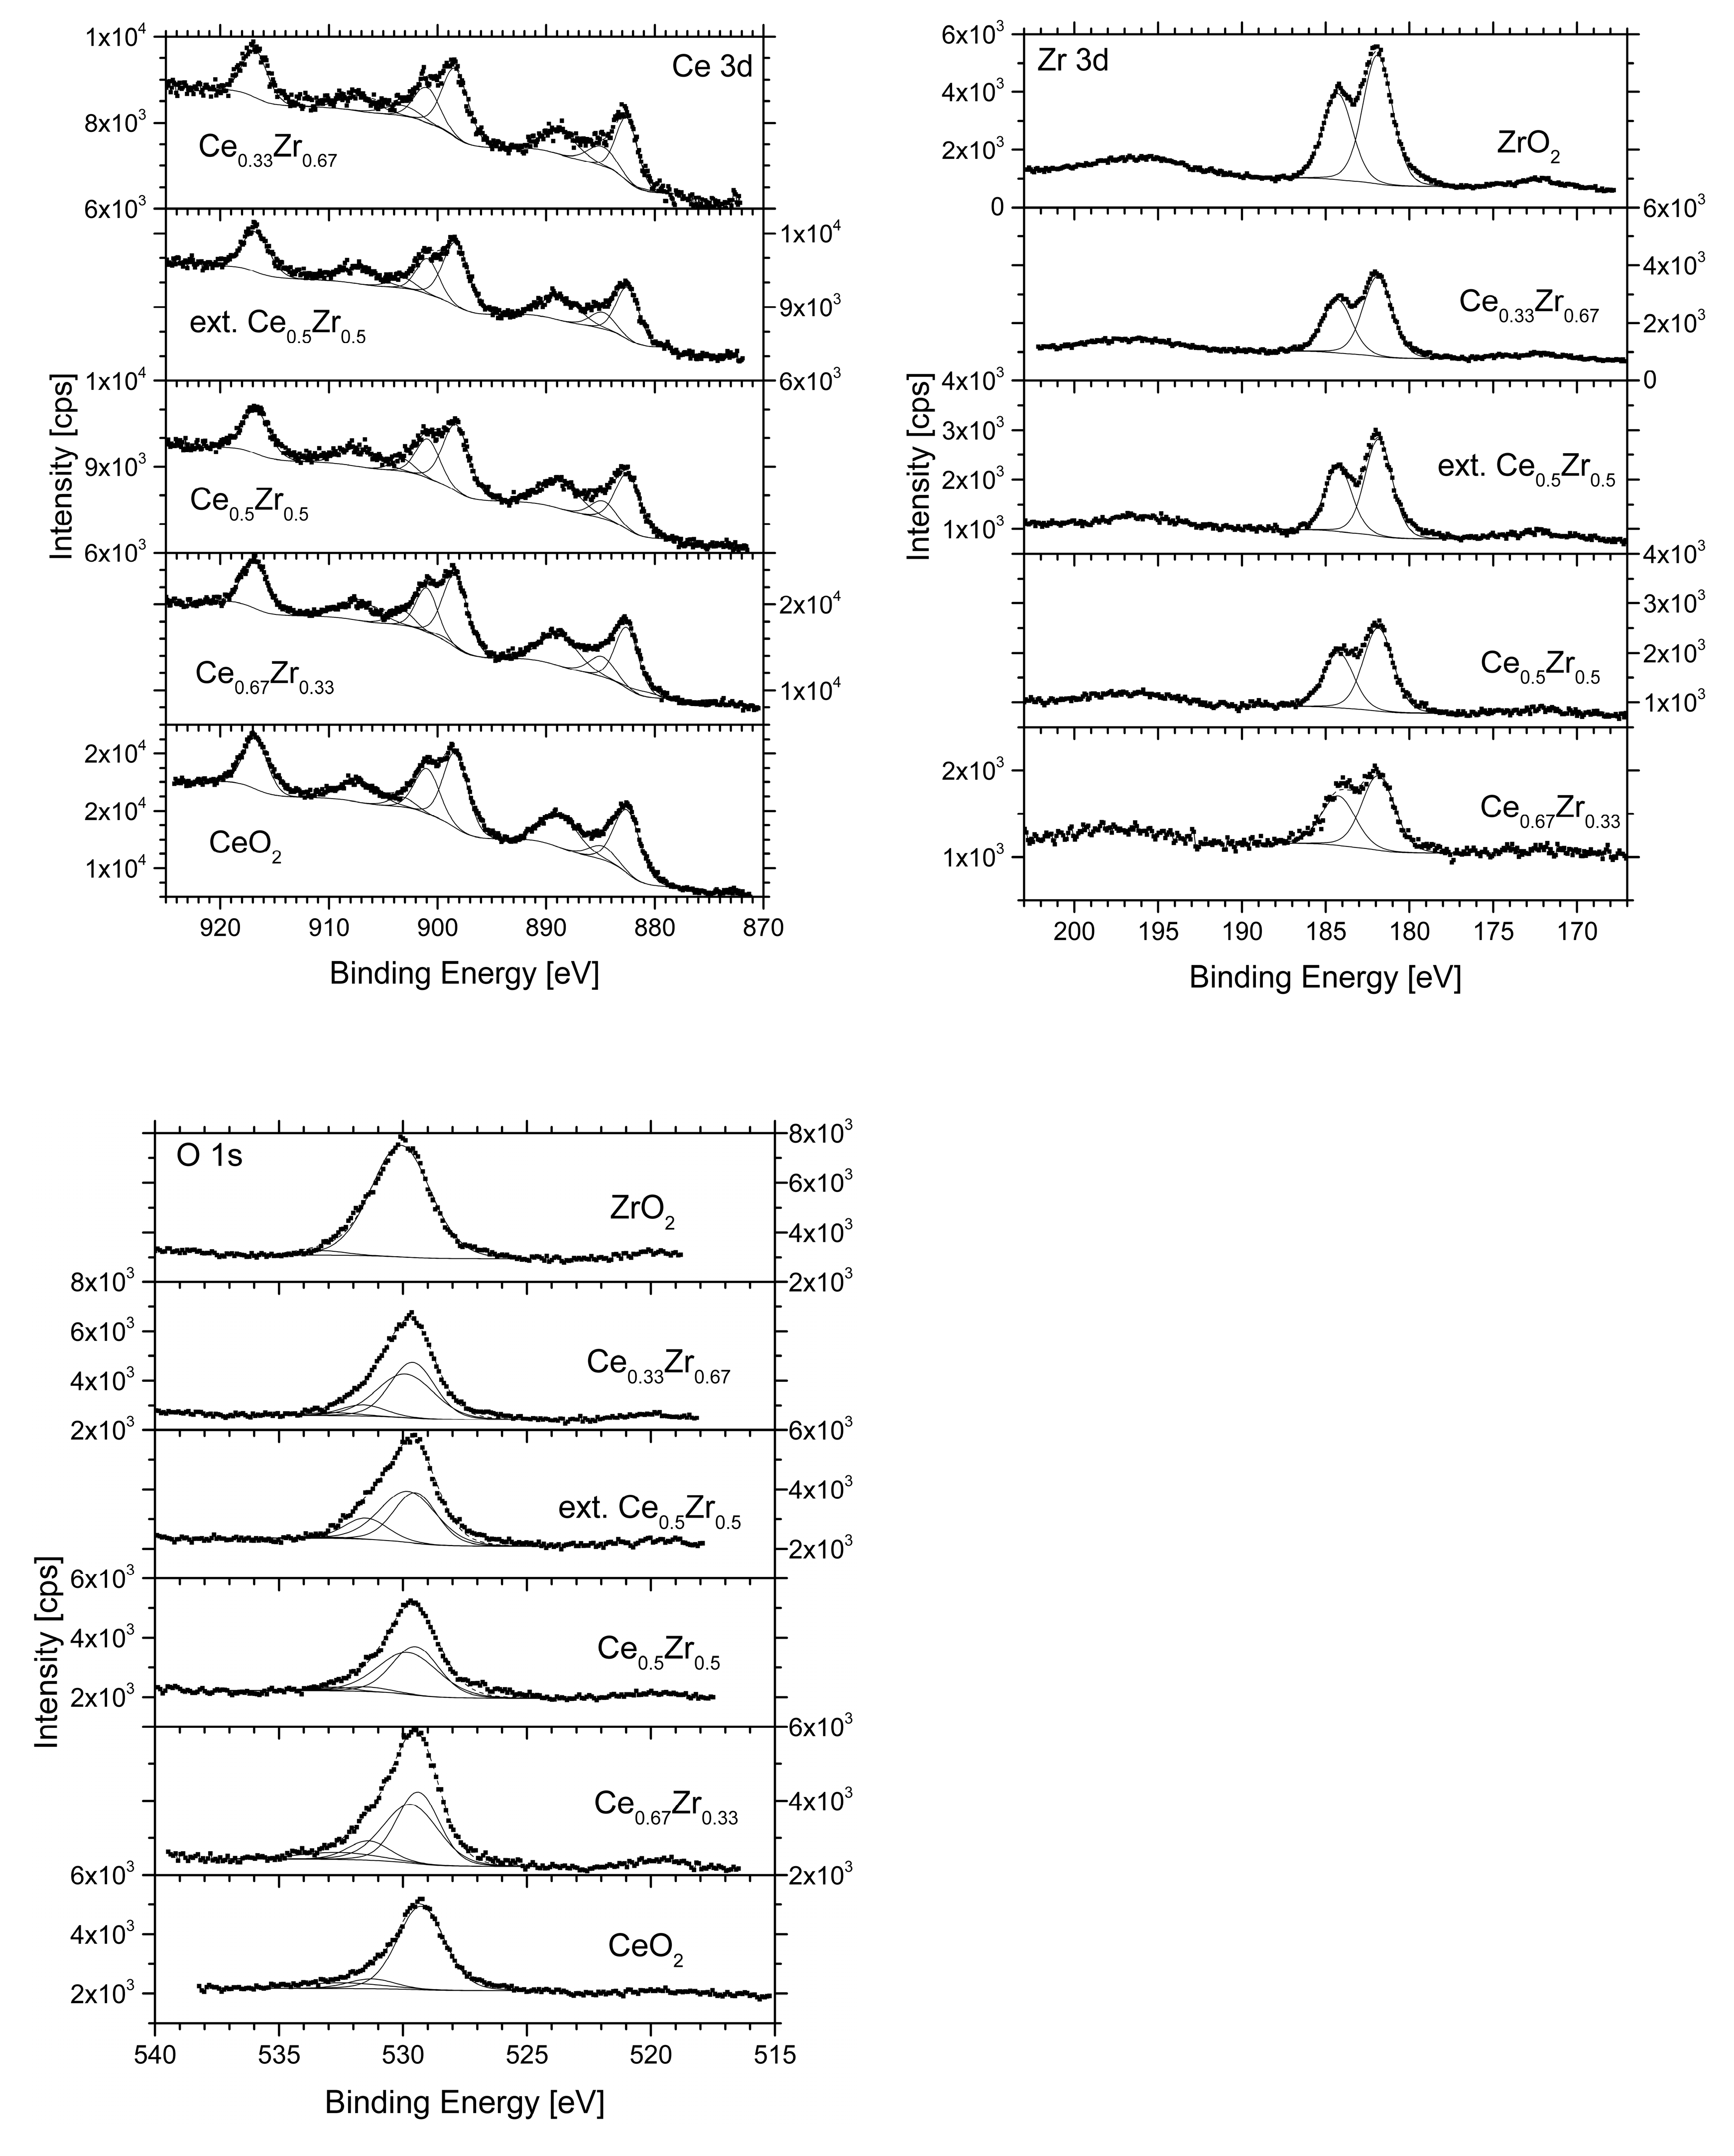
3.3. X-ray Photoelectron Spectroscopy (XPS)

The XPS spectra (Figure 3) of the CeO2 sample shows multiple peaks at 882.5 and 900.9 eV, due to photoemission from Ce 3d3/2 and Ce3d5/2 levels for Ce4+ ions, respectively and the peaks at 888.7, 898.3, 907.2, and 916.7 eV are its Ce 3d Ce4+ satellites [41,42,43,44].
Ce3+ oxides have Ce 3d3/2 and Ce 3d5/2 spectra consisting of another two multiplets. The peaks with the highest binding energies are localized at 903.3 eV and 884.8 eV, and the energy states with low binding energy are at 899.4 eV and 880.9 eV, respectively [41]. The observed doublets in Ce 3d spectra are typical of Ce4+ ions and Ce3+ ions. The observed slight decrease in the atomic concentration of the Ce 3d component for the bi-component samples compared to pure CeO2 may be due to the formation of Zr–O–Ce bonds [45]. XPS spectra of the mixed-oxide samples [46,47] showed that the O 1s peak was decomposed into two sets of components.
The peaks at about 529.5 and 529.7 eV correspond to oxygen from the oxide lattice in Ce4+ and Zr4+. The observed slight shift to lower binding energy is probably due to the interaction between CeO2 and ZrO2. The third component at 531.5 eV is usually associated with chemisorbed oxygen, such as hydroxyl groups, O22−, O oxygen centres, or molecular oxygen [46] but here it is also a component associated with oxygen bonded to Ce3+. This effect clearly shows that the close contact between the metals in the mixed-oxide system leads to the formation of oxygen vacancies and increased oxygen mobility. In addition, promoting the oxygen mobility leads to enhancing the basicity, and enriching the surface oxygen species, which are efficient at activating CO2.
Hydroxyl groups associated with a binding energy of about 533 eV were also observed in an amount decreasing from 9% for the CeO2 sample to less than 3% for samples with higher Zr content. The BE of Zr 3d5/2 and Zr 3d3/2 is 181.9 eV and 184.2 eV, respectively [48], and the peaks are registered at the same position in the spectra of all Zr-containing samples. The surface area elemental composition is presented in Table 3. It is obvious that the Ce3+ concentration on the surface is higher for the Ce0.67Zr0.33 and Ce0.33Zr0.67 mixed-oxide nanomaterials compared to pure CeO2 (Table 3). This is an indication of a higher degree of substitution of Zr ions in the cerium-oxide lattice and enhanced oxygen mobility. It should be noted that, the small systematic shift of binding energy of O-Ce4+, O-Ce3+ and O-Zr4+ peaks (Table 3), which is in accordance with X-ray analysis (Table 2) showing strong interaction between cerium and zirconium oxides, partial incorporation of smaller zirconium ions into the fluorite-oxide lattice and formation of cerium ions in a low oxidation state. The Ce3+ surface concentration is higher for Ce–Zr composite materials as compared to pure CeO2 (Table 3), which indicates a high degree of Zr incorporation into ceria lattice with the formation of oxygen vacancies [49]. XPS analysis data of high ceria containing samples (CeO2, Ce0.67Zr0.33) show that the concentration of Ce is lower on the surface than theoretically calculated, whereas the oxygen content is higher than the theoretical content (73/71 at. %, instead of 66 at. %). It means that these samples are surface-rich with defect sites and OH groups due to the very small particle size or adsorbed O-containing species.
The amount of surface oxygen functional groups or adsorbed O-containing species in all mixed oxides increases. The absence of zirconium oxide in a lower oxidation state is indicative of segregation of the zirconia phase over the ceria particles, which is in accordance with XRD and TEM results.

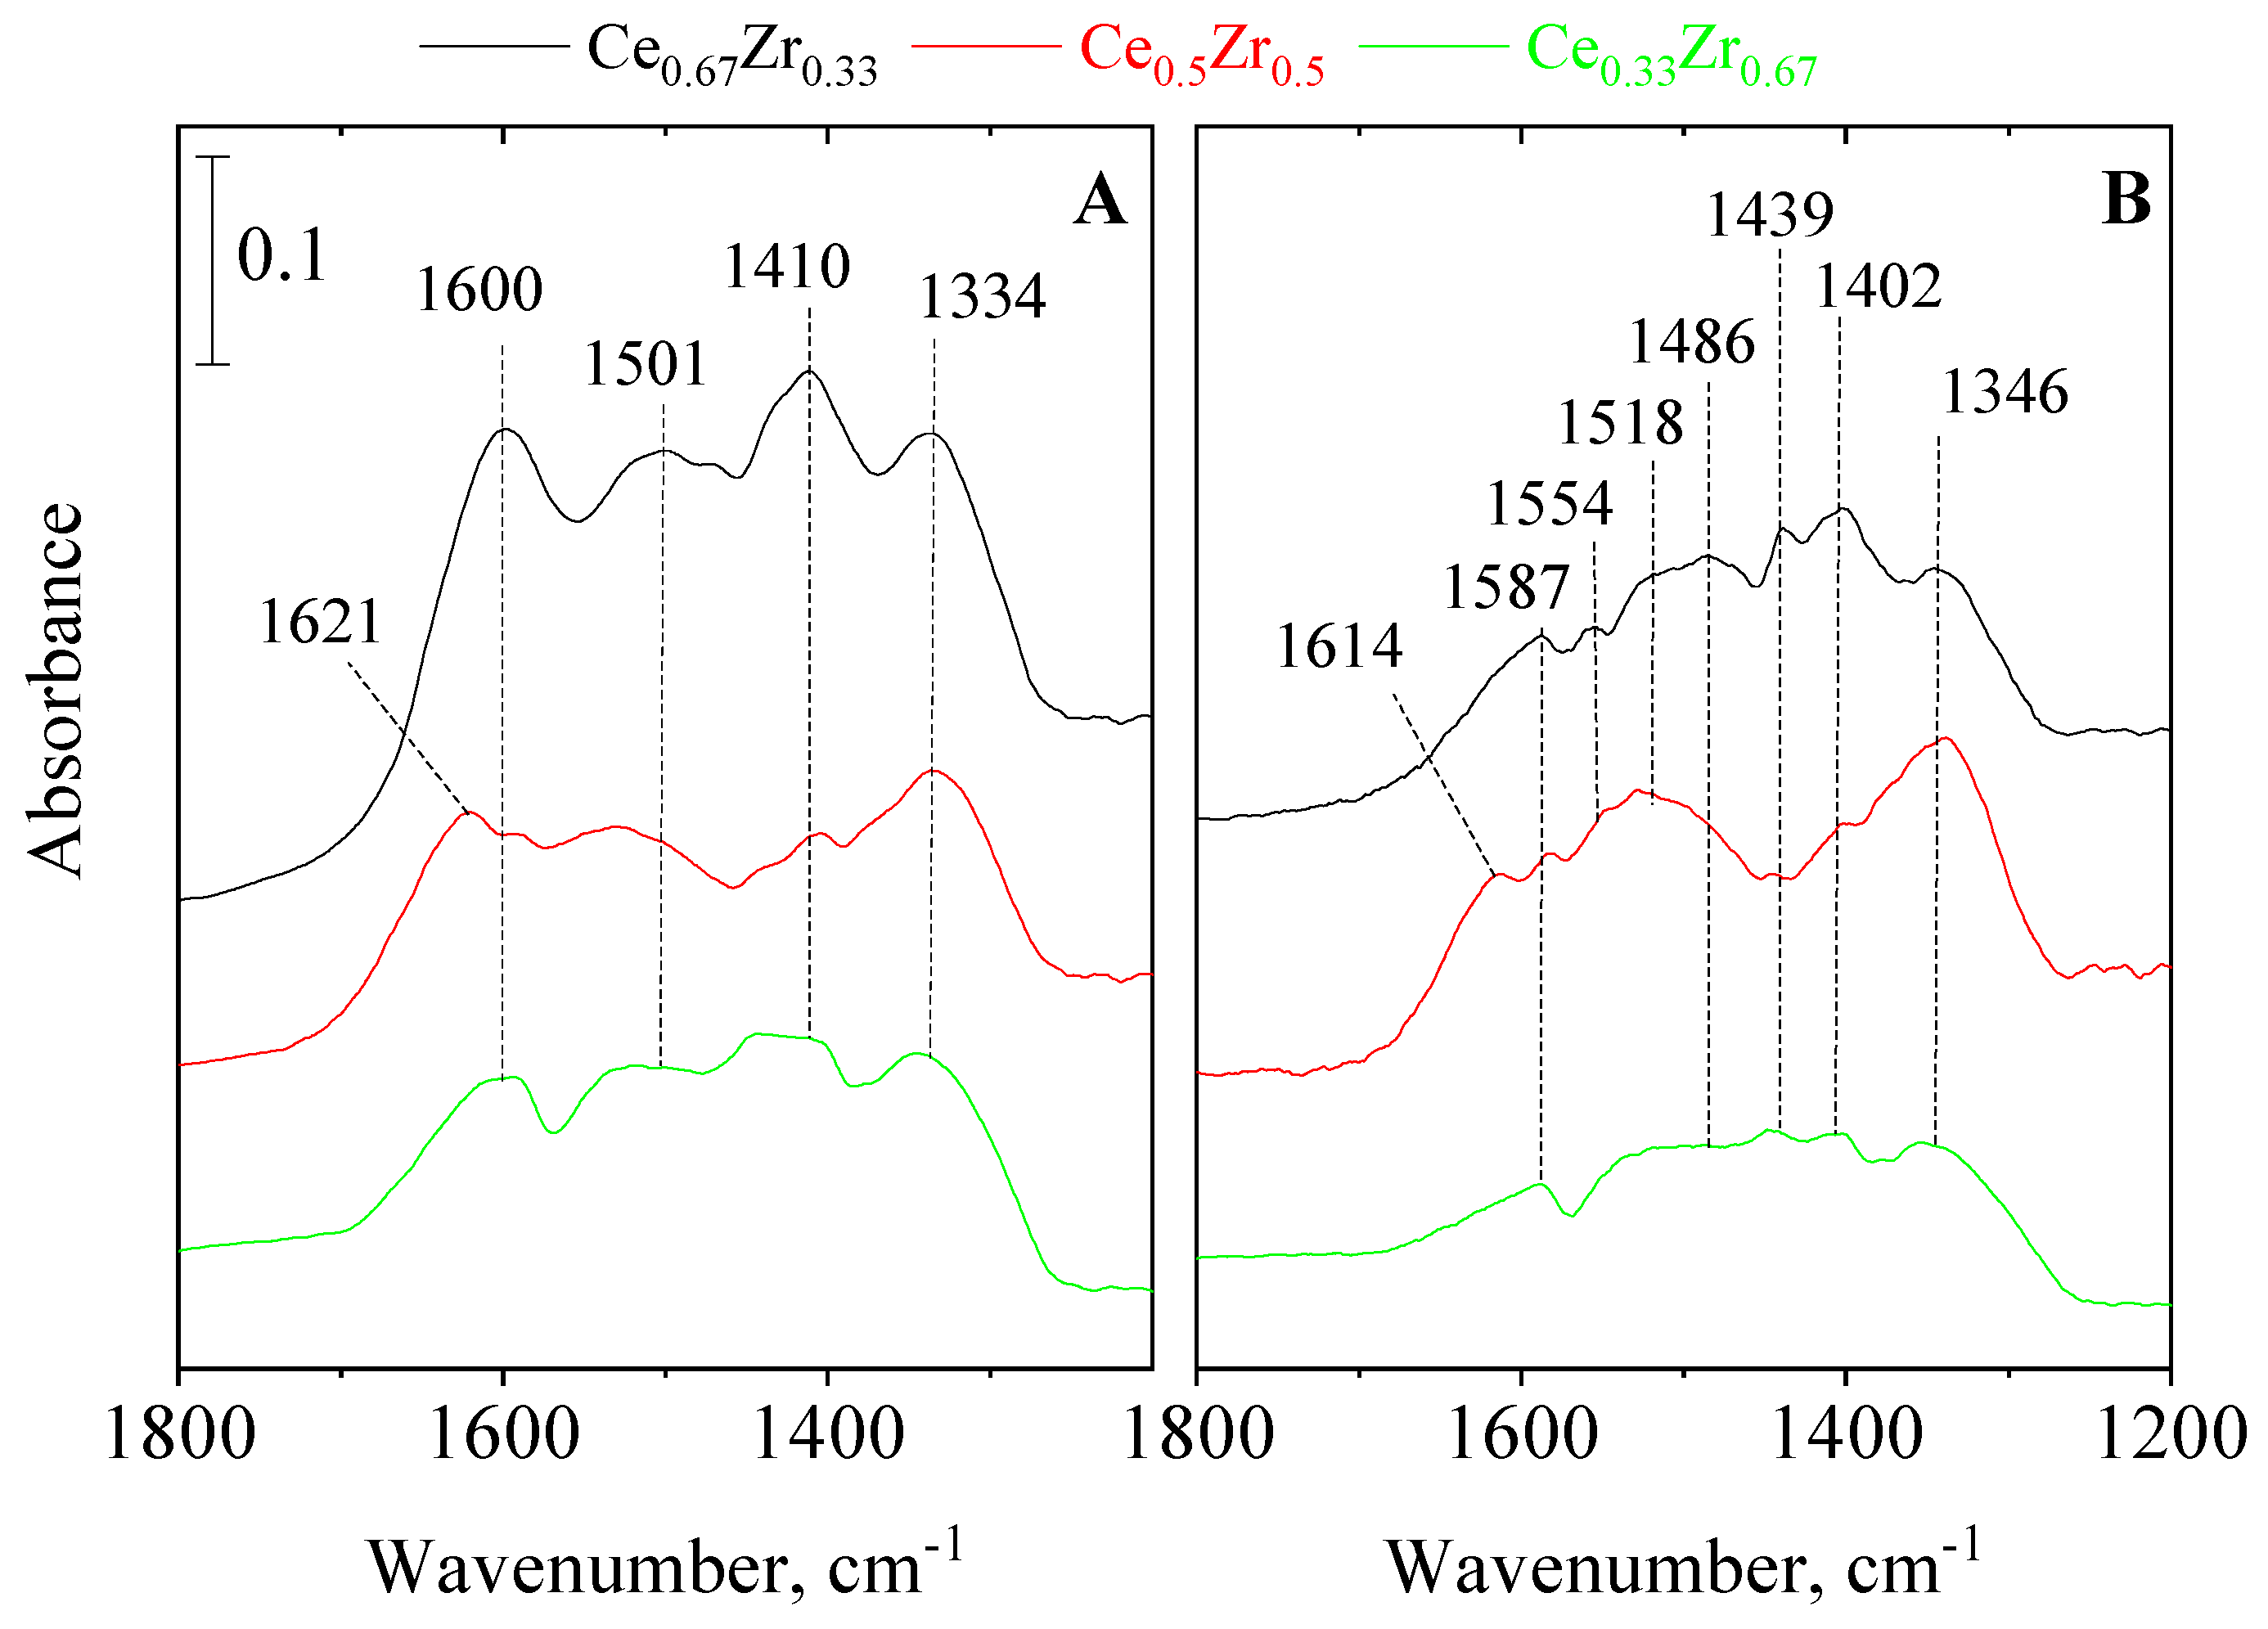
3.4. In Situ FT-IR Spectroscopy of Adsorbed Pyridine and CO2
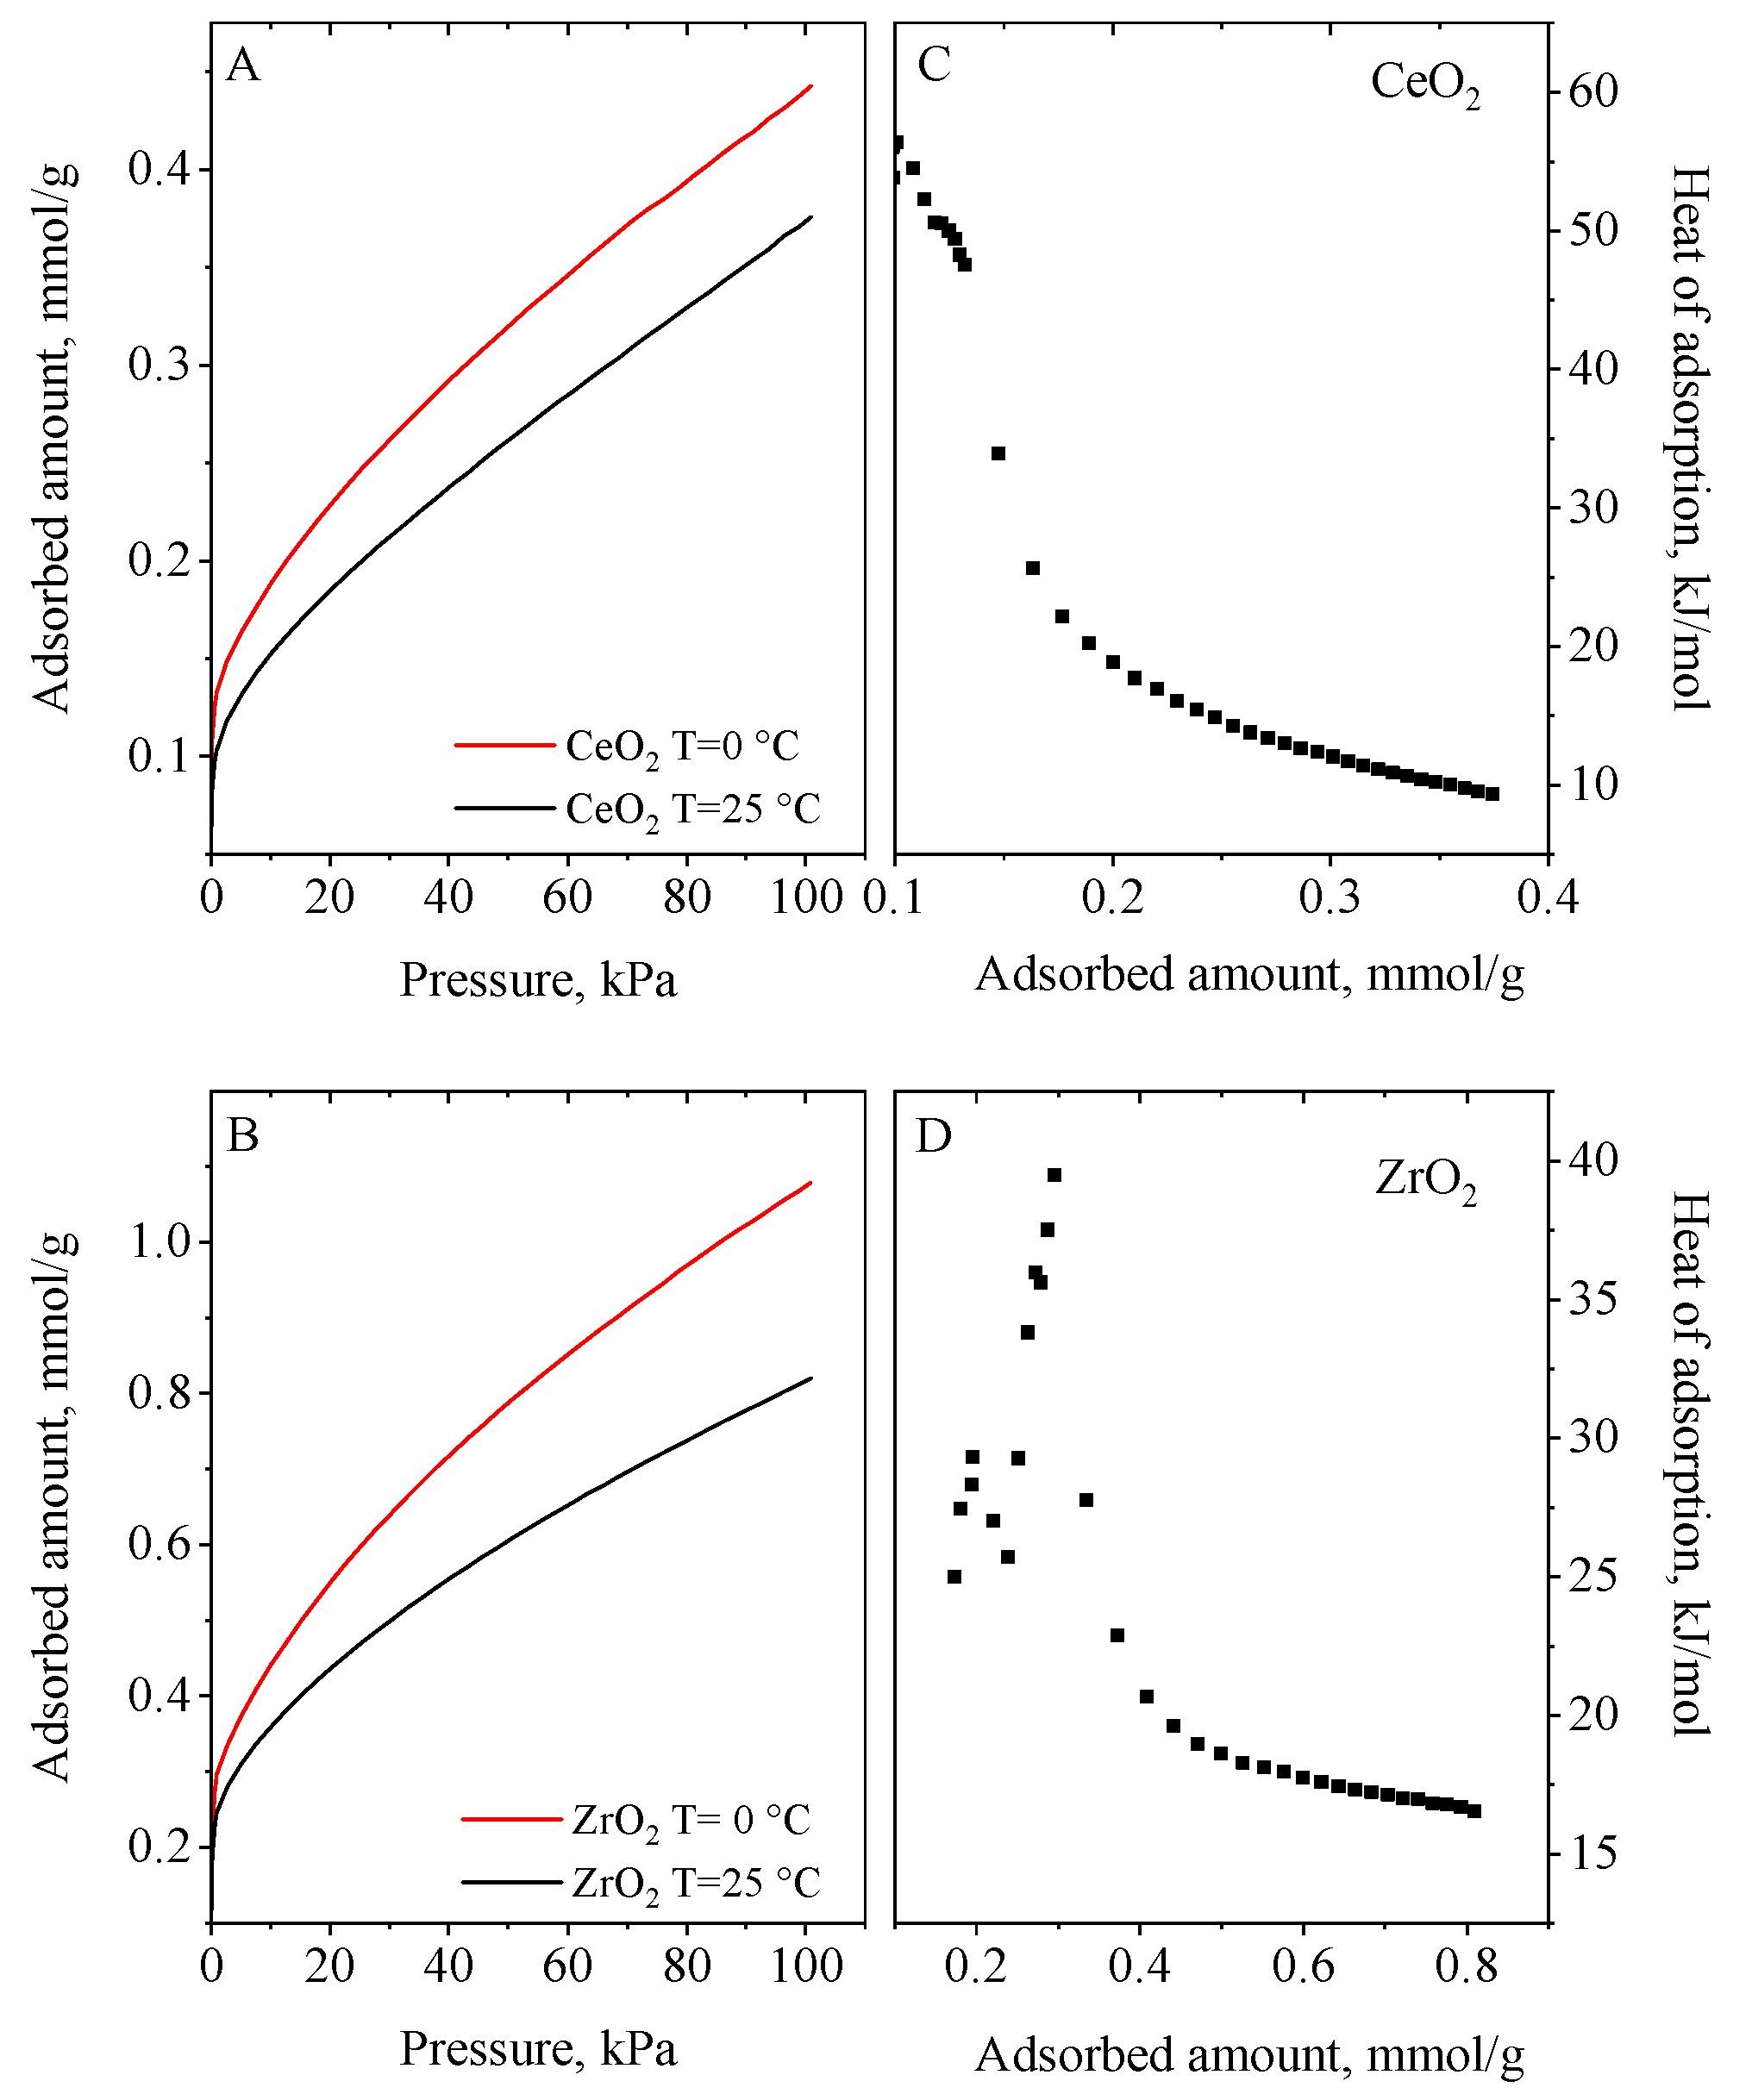
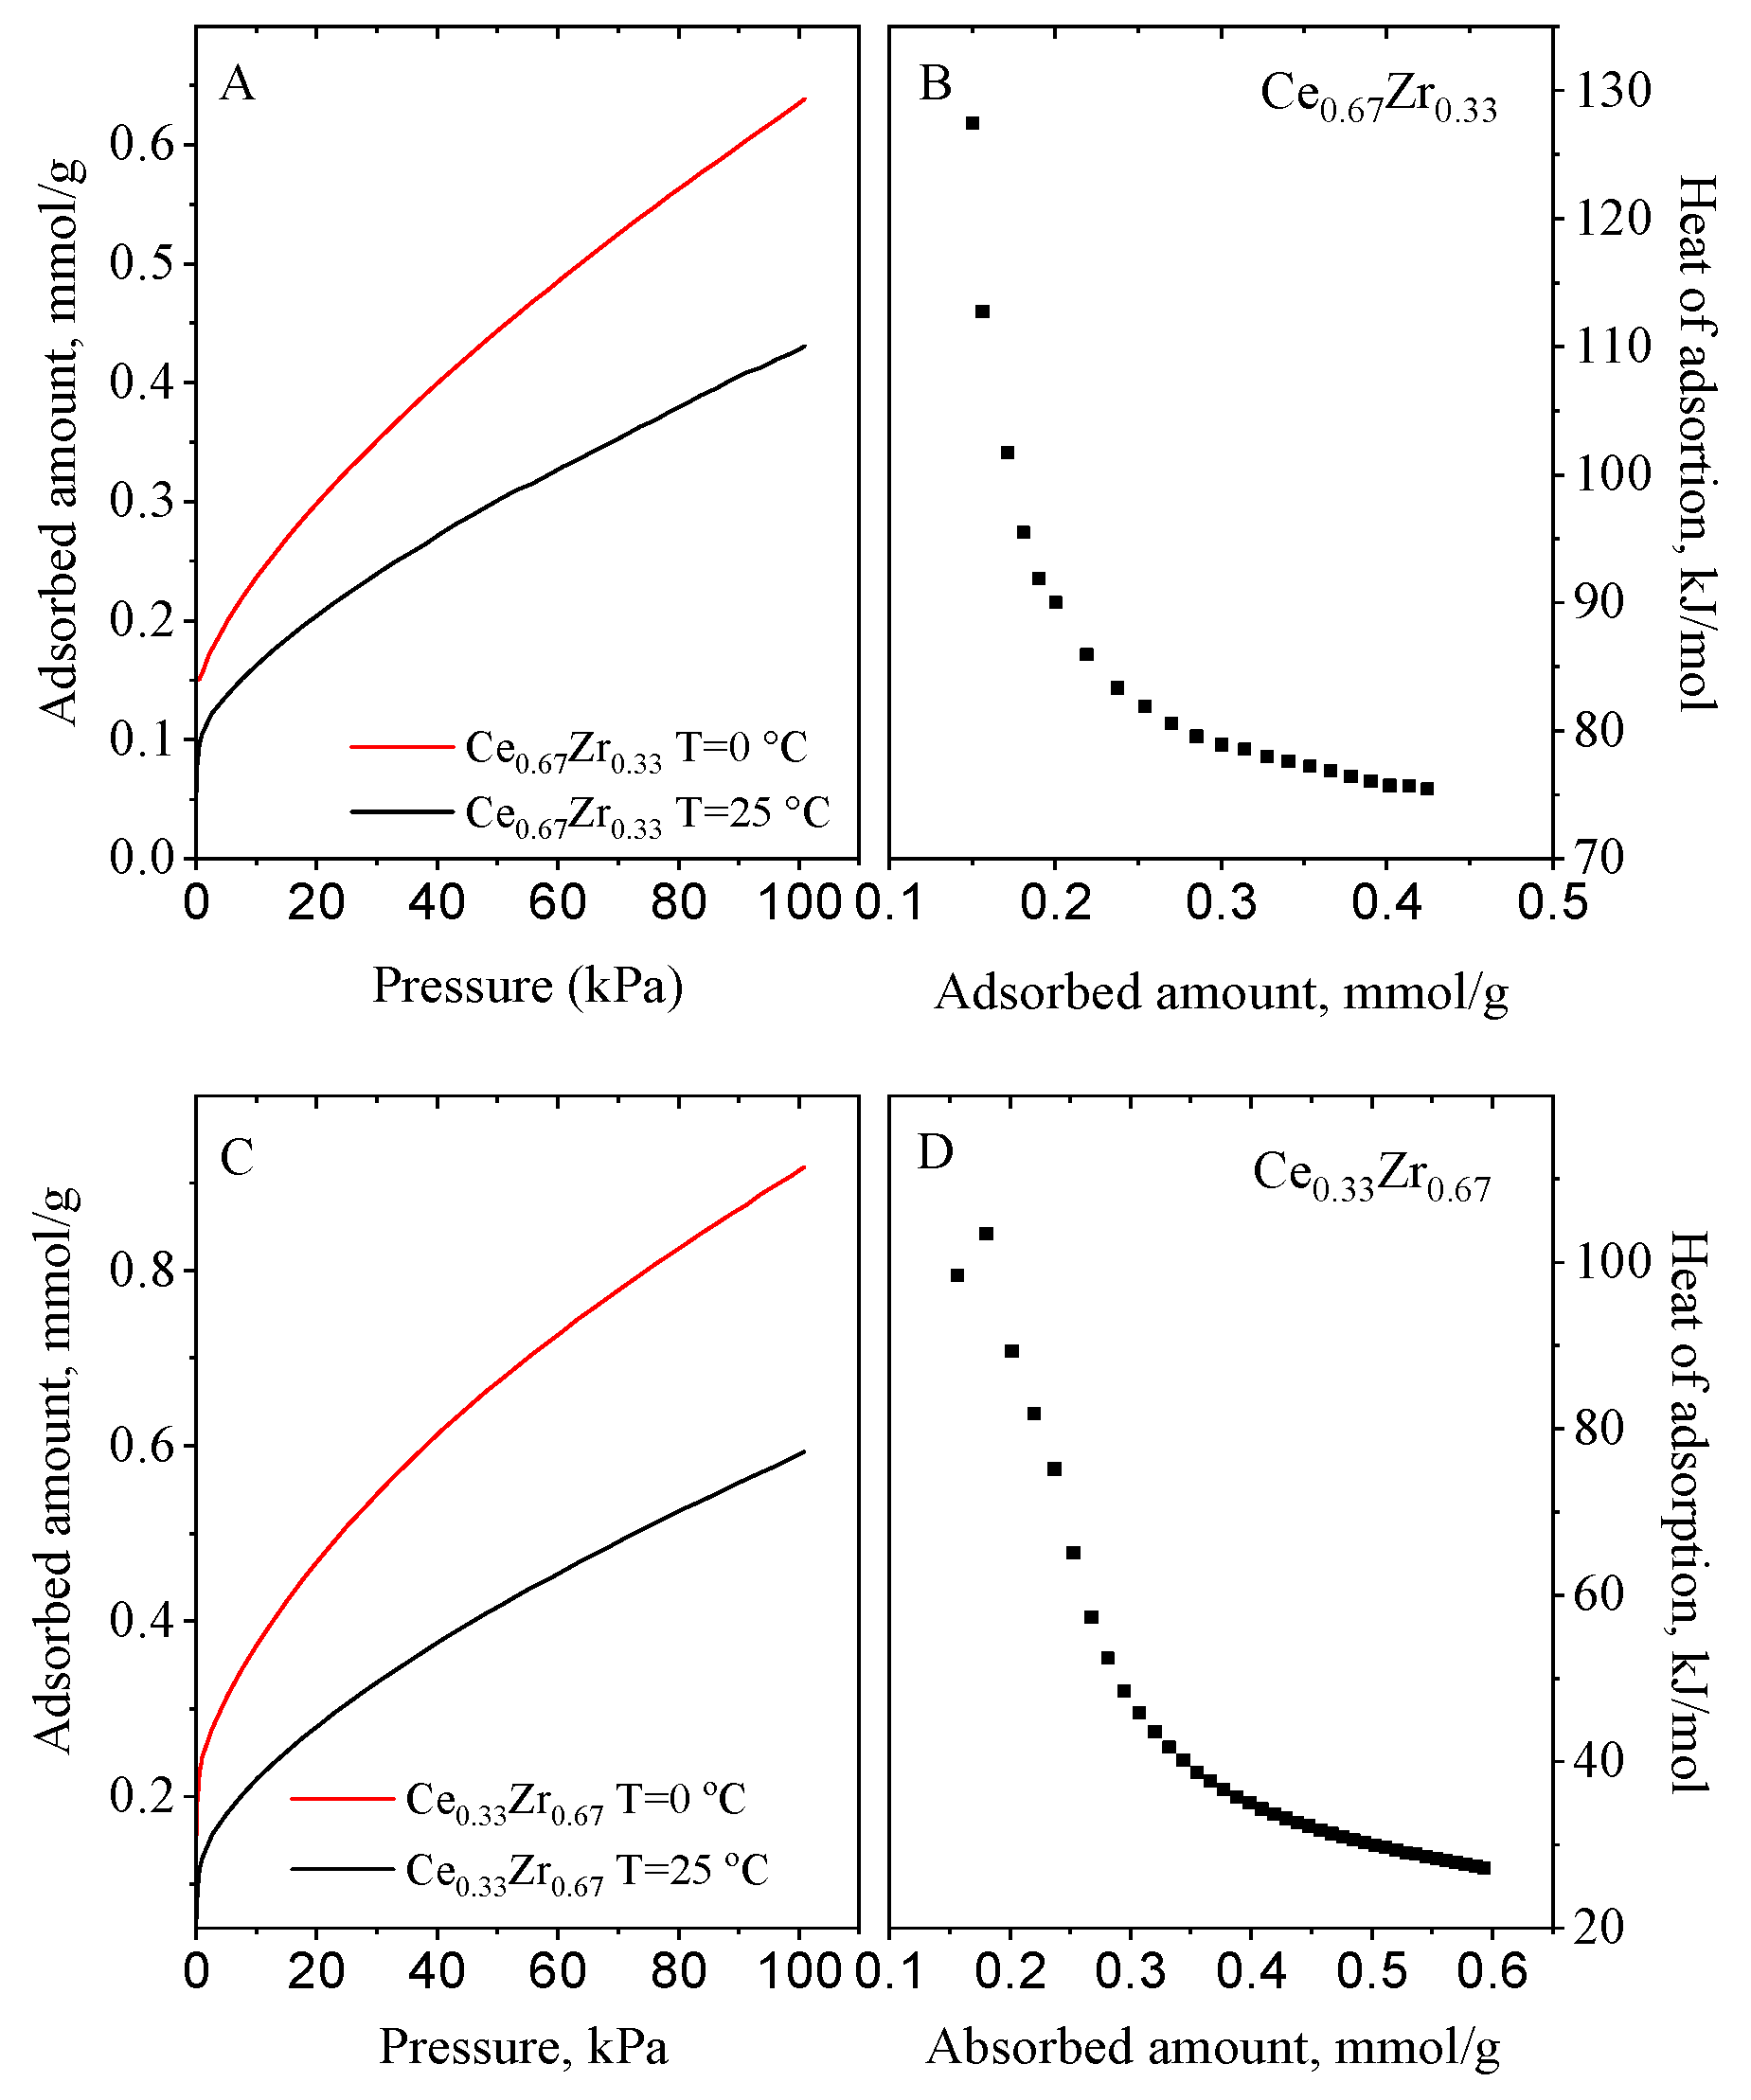
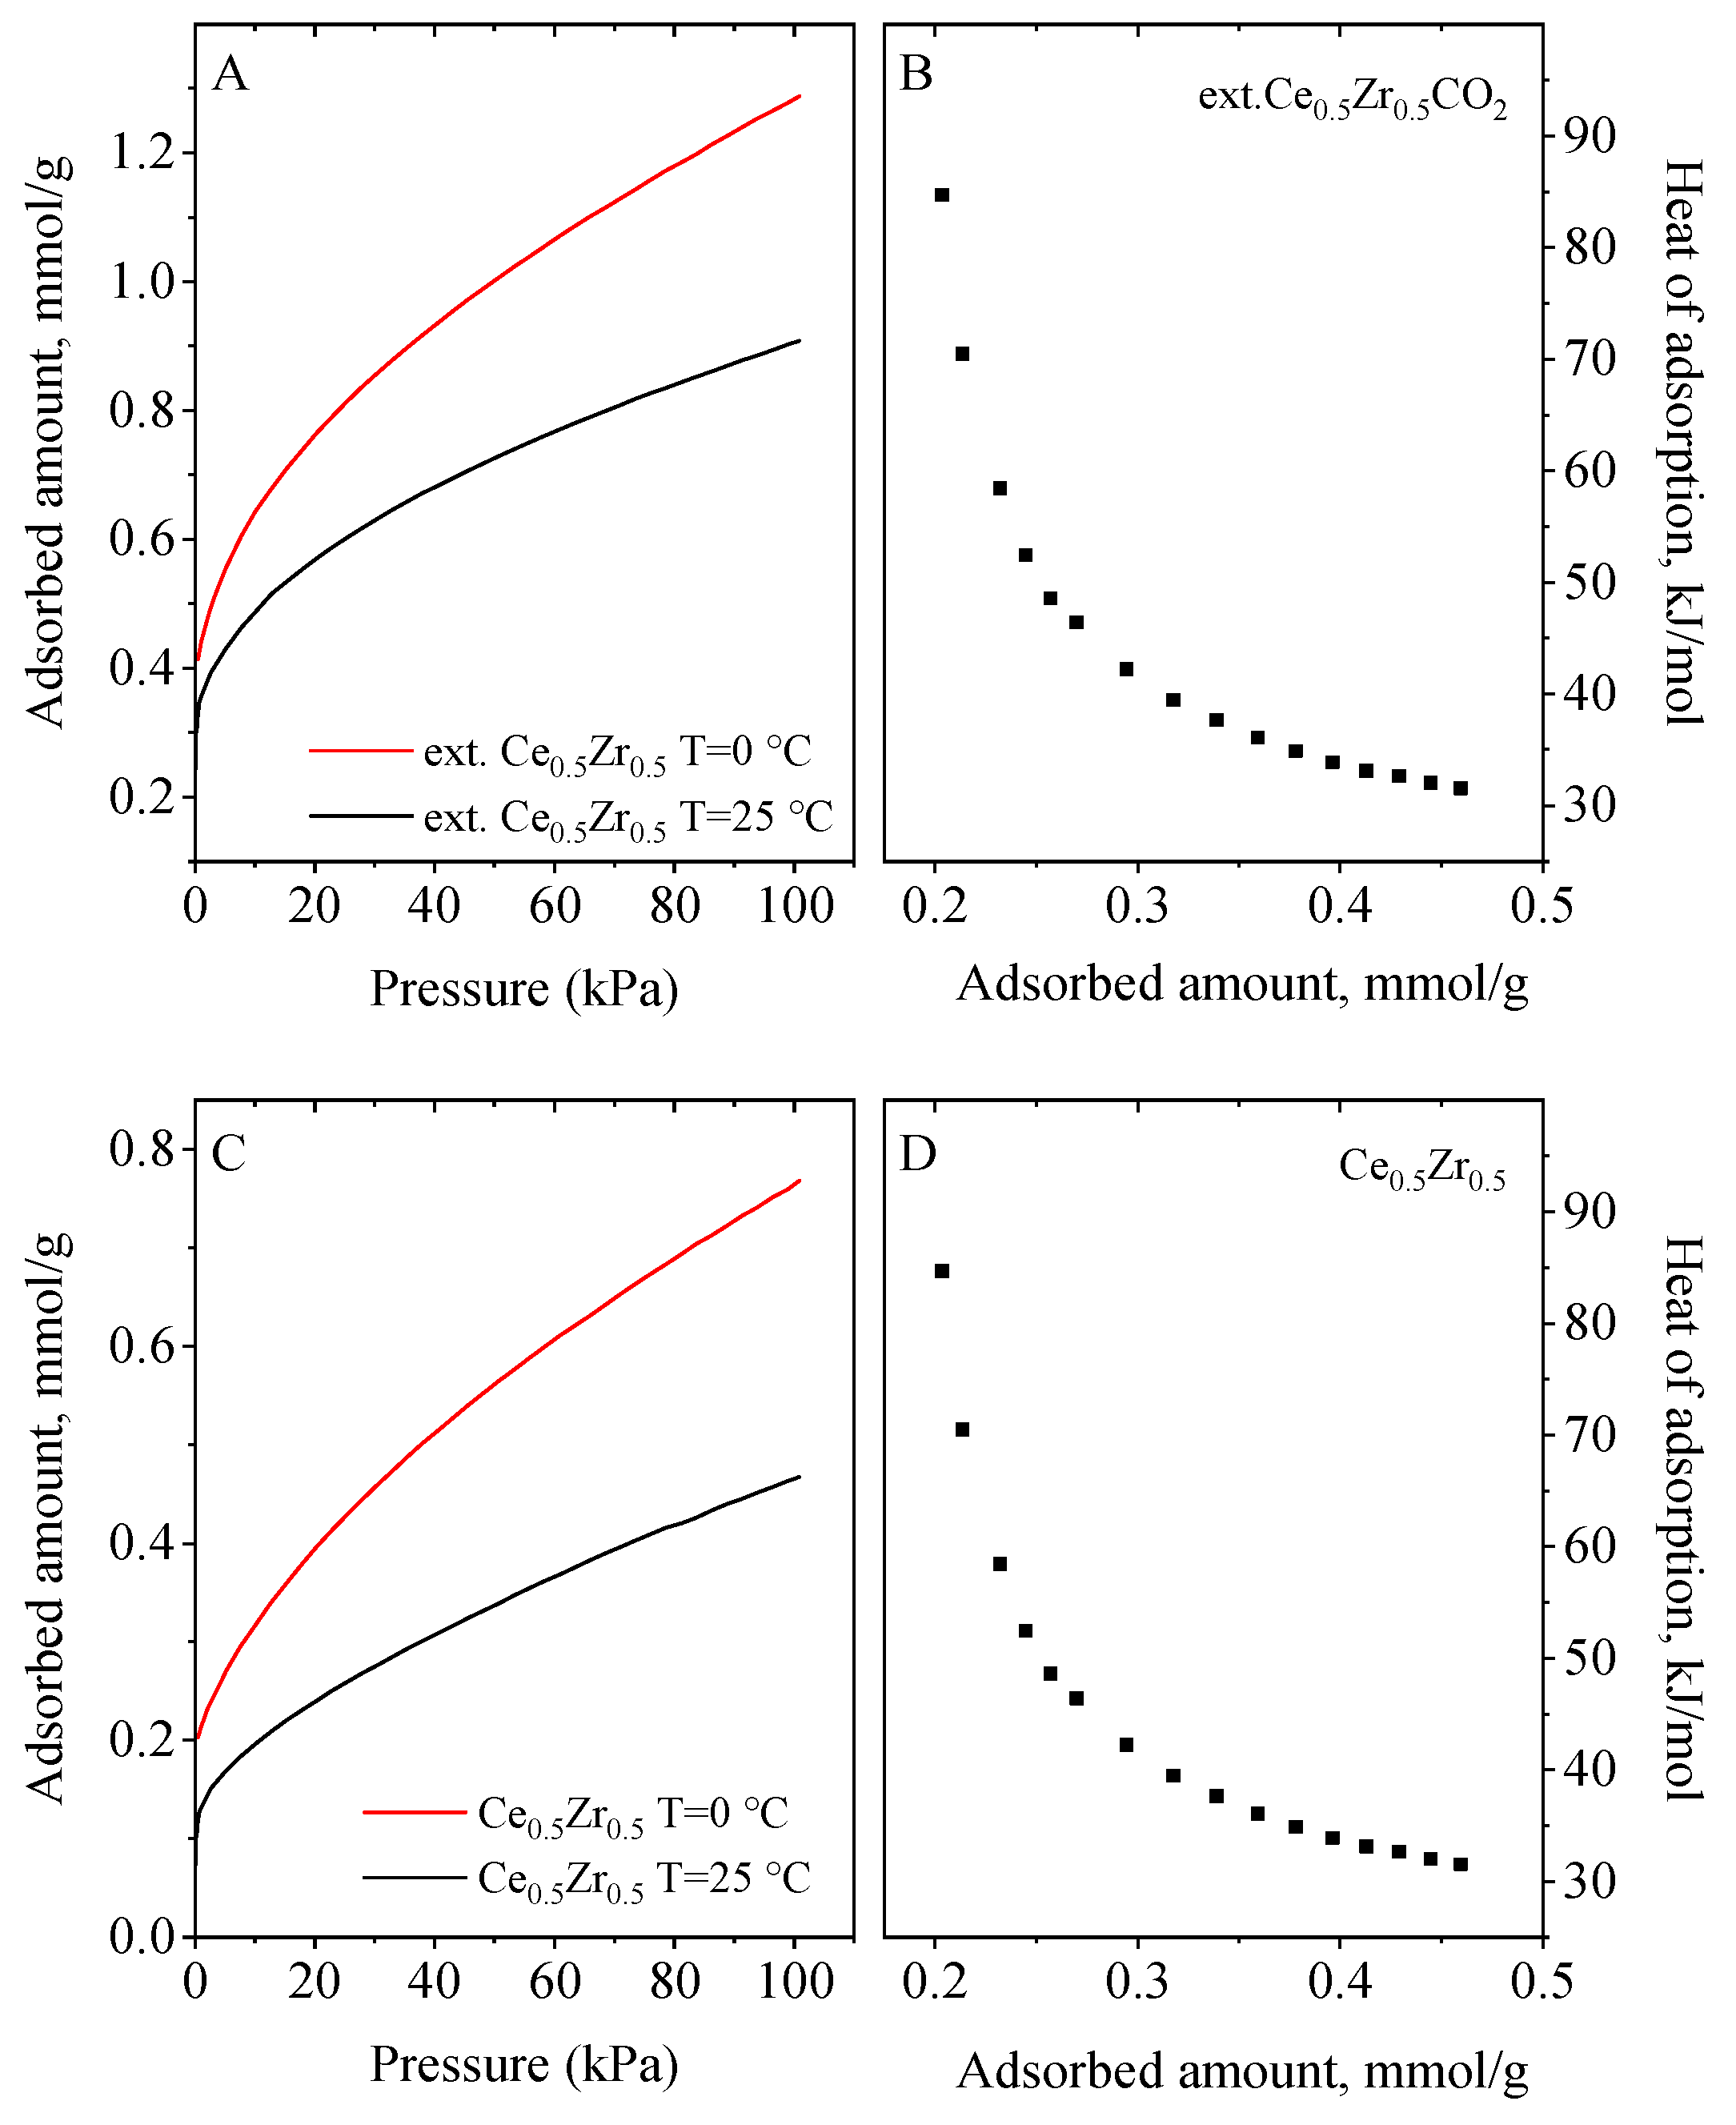
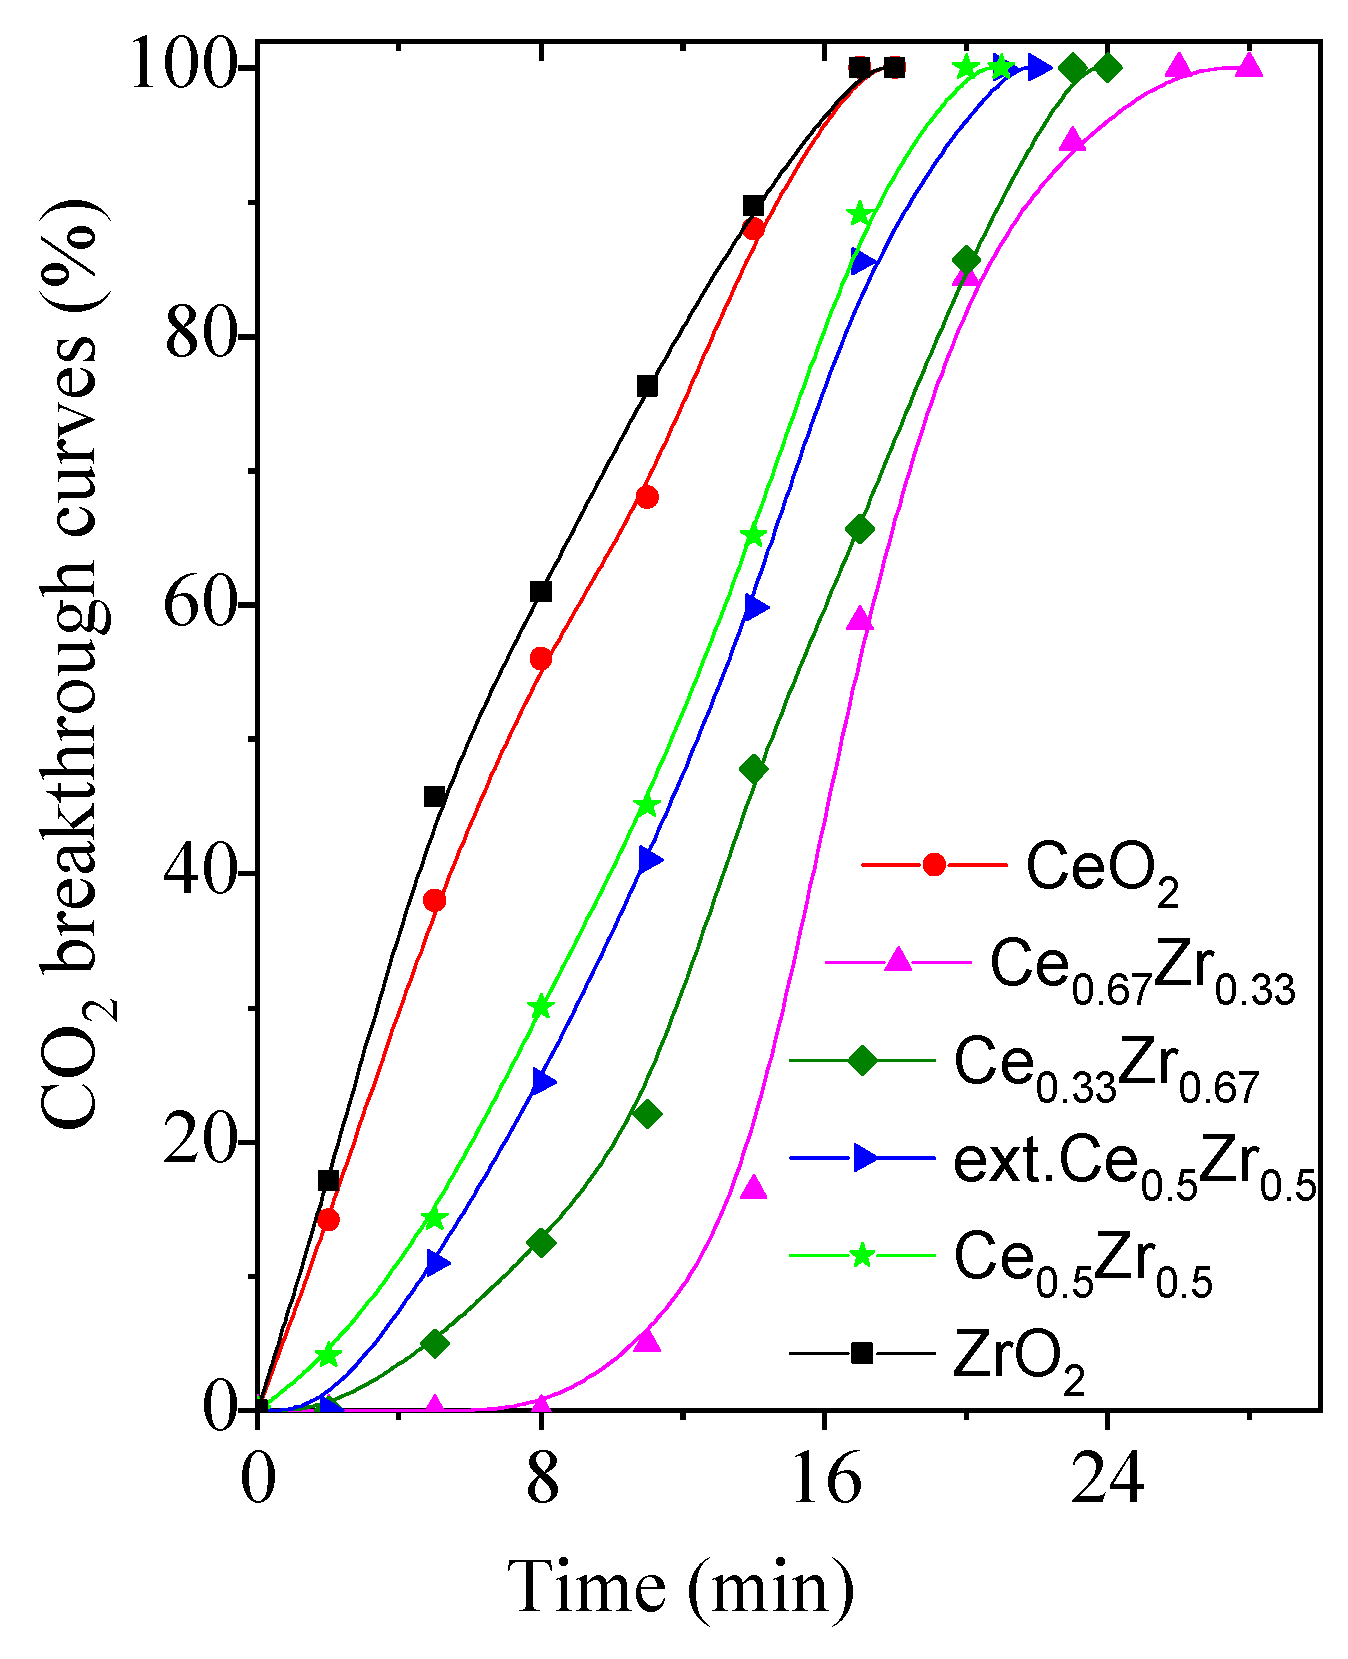
The surface species of oxides can also be described as acid-base pairs. Oxygen atoms of the structure serve as basic sites (Lewis) for adsorbents, whereas coordinatively unsaturated metals or oxygen vacancies act as Lewis acid centers. Bridged hydroxyl groups connecting to transition metals of different valent or oxidation states (e.g., Ce3+–O(H)–Ce4+) show Brønsted acid character by proton donating ability. Acidity of the samples was characterized by in situ FT-IR spectroscopy using pyridine (Py) adsorption as a base probe molecule. Figure S2 shows the Py adsorption spectra of the studied samples. Py adsorption studies supported the strong Lewis acidity of the samples. It was found that only the CeO2 sample exhibited some weak Brønsted acidity. The latter result supports the XPS data, detecting reduced Ce3+ species on the surface. Spectra of mixed-oxide samples exhibit rather the characteristics of CeO2. Considering the amount of acid sites, it can be observed that ZrO2 shows a higher acidity compared to CeO2. Surface basicity of oxides can be characterized by CO2 chemisorption. When basic surface hydroxyl groups react with CO2, bicarbonate (hydrogencarbonate) species are formed. Through the interaction of structural O2− ions (Lewis base) with CO2, carbonate species can be detected. The various surface species, formed by CO2 adsorption, can be observed in the 1800–800 cm−1 spectral range [50]. FT-IR spectra of adsorbed CO2 on mixed CeO2/ZrO2 samples are shown in Figure 4. Spectra were collected by room-temperature adsorption for 30 min, followed by desorption at RT (Figure 4A), and at 100 °C (Figure 4B) in high vacuum. Comparing the RT CO2 desorption spectra of mixed oxides, similar bands with some variation in intensity ratios can be observed, however the Ce0.67Zr0.33 sample shows more intensive ones. Characteristic stretching vibrations ν(CO3) bands of hydrocarbonates at 1600 and 1410 cm−1 [51,52] are very intensive in the sample, and almost diminishes in the other two. This fact is in accordance with XPS investigations, showing a high concentration of OH groups on the CeO2 sample and a decreasing tendency with increasing Zr content.
By increasing the desorption temperature to 100 °C, the weakly bound hydrogencarbonate bands disappear and several, better resolved ones appear (Figure 4B). According to Datturi et al. [52], the bands can be associated with surface monodentate (1518 cm−1), bidentate (1587, 1346 cm−1), and polydentate (1439, 1402 cm−1) carbonate species. The other two mixed-oxides with a lower Ce ratio show only monodentate and bidentate carbonate species with much lower intensity. Formation of thermally stable, polydentate, or core-carbonate species indicates the incorporation of carbonate ions into the surface layer, thus its restructuration. It seems that the high mobility of oxygen atoms in pure ceria is stabilized by the presence of zirconium ions and an optimal composition makes the surface more appropriate for CO2 adsorption. Daturi et al. [52] draw the conclusion from their similar FT-IR spectroscopic results that the incorporation of Zr4+ ions into the ceria framework enhances the surface oxygen relaxation over 50% Ce content and has the opposite effect on the relaxion of Ce4+ with already low Zr level, thus stabilizing the surface Ce4+ framework. Based on the FT-IR spectroscopic results, it can be expected that Ce0.67Zr0.33 sample will show more favorable CO2 adsorption properties compared to other mixed and pure oxides.

3.5. CO2 Adsorption

CO2 adsorption breakthrough curves under dynamic conditions of the pure and the mixed-oxide materials are presented in Figure 5.
CeO2 and ZrO2 show low adsorption capacity, whereas a significantly higher capacity is detected for the mixed-oxide materials. The shape of the breakthrough curves is similar, which can be due to their similar porosity. The ratio between Ce/Zr influences the adsorption performance of the materials. As predicted by the FT-IR results, the highest capacity for CO2 adsorption is detected for Ce0.67Zr0.33 (3.5 mmol/g) (Table 4). A large quantity of surface oxygen groups or adsorbed O-containing species in Ce–Zr composite nanomaterials could be a reason for the higher CO2 capacity. The Ce0.5Zr0.5 and ext. Ce0.5Zr0.5 show similar CO2 adsorption despite the difference in the surface area.
The observed effect indicates that the surface composition is more important than other structure peculiarities. Moreover, the time required to reach the total adsorption for CeO2 and ZrO2 materials (T = 17 min) is shorter than that of the mixed-metal oxides (T = 20–26 min). Additional adsorption experiments were performed with the addition of 1 vol.% water vapor to the CO2/N2 flow at a rate of 30 mL/min to determine the CO2 selectivity. In the latter case, higher CO2 adsorption capacity was determined for all the adsorbents (Table 4). The highest capacity in the humid environment was detected for Ce0.67Zr0.33 (3.7 mmol/g). Under dry conditions, surface oxygen reacts with CO2 generating carbonate species [14,53]. Under wet conditions, it is assumed that the surface oxygen reacts with water molecules in the gas leading to the formation of hydroxyl groups. The reaction of the hydroxyl groups with CO2 results in the generation of hydrogen carbonate species and thereby accelerating the carbon dioxide adsorption.
Adsorption capacity of synthesized nanomaterials were determined using a laboratory scale fixed-bed reactor. The Yoon–Nelson model [54] was applied for adsorption kinetics in a fixed-bed column. The linear form of the model is represented by Equation (1):
ln(Ct/Co − Ct) = κYNt − τκYN
where kYN is the Yoon–Nelson rate constant (min−1), τ is the time required for 50% of adsorbate breakthrough (min), t is the sampling time (min), C0 is the initial concentration of CO2, and C is the concentration of CO2 at any time during evaluation. It was found that the model and experimental data have a strong correlation (R2 > 0.99) (Figure S3).
Samples were also tested for CO2 capture under equilibrium conditions and the results are presented in Figure 6, Figure 7 and Figure 8. CO2 adsorption under static saturation mode without nitrogen stream shows a lower adsorption capacity than those obtained in the dynamic conditions. The heat of adsorption was calculated from CO2 adsorption isotherms at 0 °C and 25 °C using the Clausius–Clapeyron equation. They ranged between 25 and 130 kJ/mol. The mixed cerium–zirconium materials exhibited higher values in comparison to CeO2 and ZrO2 materials. The Ce0.33Zr0.67 and Ce0.67Zr0.33 (Figure 7) adsorbents demonstrated the highest ones (115−128 kJ/mol) due to the formation of Ce–O–Zr species. They are around three times higher than that of CeO2 and ZrO2 (40–55 kJ/mol) (Figure 6). Ce0.5Zr0.5 and ext.Ce0.5Zr0.5 (Figure 8) have very similar values, which are two times higher than pure oxides (Figure 6).
Based on the calculated adsorption heats, CO2 is physisorbed on CeO2 and ZrO2 materials whereas chemisorption of CO2 is assumed on the mixed cerium–zirconium nanomaterials. According to the literature [14], under dry conditions, the surface oxygen of CeO2 reacts with CO2, generating carbonate species when the Ce–Zr composites are used as adsorbents. When the mixed Ce/Zr oxides are used as adsorbents, we assume that the stronger interaction of CO2 molecules with oxygen of the adsorbent surface is due to the stronger basicity of O2− in them than that of O2− in the pure CeO2 and ZrO2 nanoparticles.
A stronger interaction between CO2 molecules and the Ce–Zr composite materials is also proved by the higher CO2 desorption temperature (100 °C), which is needed for total regeneration of the adsorbents.

4. Conclusions

CeO2, ZrO2, and the Ce–Zr composite nanoparticles with a high specific surface area were successfully synthesized using the hydrothermal synthesis procedure. A high CO2 adsorption capacity was determined for all the adsorbents depending on their composition and structural peculiarities. Additionally, CO2 chemisorption enhanced the CO2 capture on Ce–Zr composites due to the presence of strong O2− base sites and enriched surface oxygen species. Materials reused in five adsorption/desorption cycles revealed a high stability with only a slight decrease in adsorption capacity. Among the studied materials, the Ce0.67Zr0.33 material showed the highest adsorption capacity (3.7 mmol/g). CO2 chemisorption is assumed based on the calculated adsorption heat. Enhanced CO2 adsorption capacities were detected in experiments with 3 vol.% CO2 plus 1 vol.% water vapor due to the additional chemisorption of CO2. Total CO2 desorption from the Ce–Zr composites was achieved at 100 °C. Experimental data can be appropriately described by the Yoon–Nelson kinetic model. For the first time, it is described that Ce–Zr composite nanomaterials are promising materials for CO2 adsorption in dry and humid media.

Supplementary Materials

The following supporting information can be downloaded at: https://www.mdpi.com/2079-4991/13/17/2428/s1, Figure S1. Nitrogen physisorption isotherms of the studied CeO2, ZrO2 and CeO2/ZrO2 mixed oxide materials. Figure S2. FT-IR spectra of adsorbed pyridine on the studied adsorbents. Py (6 mbar) was adsorbed on 300 °C dehydrated samples at 100 °C and desorbed at 100 °C in high vacuum. Figure S3. Fitting of experimental data on kinetic model at 0 °C.

Author Contributions

Conceptualization, M.P.; supervision, M.P.; writing—original draft, M.P., Á.S., G.I., M.K., D.K. (Daniela Kovacheva) and D.K. (Daniela Karashanova); writing—review and editing, M.P., Á.S., D.K. (Daniela Kovacheva) and D.K. (Daniela Karashanova); project administration, M.P.; investigation, G.I., M.K., D.K. (Daniela Kovacheva) and D.K. (Daniela Karashanova), O.T.; formal analysis, M.K., D.K. (Daniela Kovacheva) and D.K. (Daniela Karashanova); data curation, M.P. and G.I.; funding acquisition, M.P. All authors have read and agreed to the published version of the manuscript.

Funding

This work is supported by Bulgarian National Science Fund, Grant KП-06-KOCT/11, 15 December 2021) and EU COST action CA20127. Support of this work in the framework of the bilateral grant agreement between the Bulgarian Academy of Sciences and the Hungarian Academy of Sciences (IC-HU/02/2022-2023) is gratefully acknowledged. Research equipment of the Distributed Research Infrastructure INFRAMAT, part of the Bulgarian National Roadmap for Research Infrastructures supported by Bulgarian Ministry of Education and Science, were used in this investigation.

Data Availability Statement

Not applicable.

Conflicts of Interest

The authors declare no conflict of interest.

References

  1. Azmi, A.A.; Aziz, M.A.A. Mesoporous adsorbent for CO2 capture application under mild condition: A review. J. Environ. Chem. Eng. 2019, 7, 103022. [Google Scholar] [CrossRef]
  2. Belmabkhout, Y.; Guillerm, V.; Eddaoudi, M. Low concentration CO2 capture using physical adsorbents: Are metal–organic frameworks becoming the new benchmark materials? Chem. Eng. J. 2016, 296, 386–397. [Google Scholar] [CrossRef]
  3. Davis, S.J.; Caldeira, K.; Matthews, H.D. Future CO2 emissions and climate change from existing energy infrastructure. Science 2010, 329, 1330–1333. [Google Scholar] [CrossRef] [PubMed]
  4. Satterthwaite, D. Cities’ contribution to global warming: Notes on the allocation of greenhouse gas emissions. Environ. Urban. 2008, 20, 539–549. [Google Scholar] [CrossRef]
  5. Bhave, A.; Taylor, R.H.; Fennell, P.; Livingston, W.R.; Shah, N.; Mac Dowell, N.; Dennis, J.; Kraft, M.; Pourkashanian, M.; Insa, M.; et al. Screening and techno-economic assessment of biomass-based power generation with CCS technologies to meet 2050 CO2 targets. Appl. Energy 2017, 190, 481–489. [Google Scholar] [CrossRef]
  6. Yu, C.-H.; Huang, C.-H.; Tan, C.-S. A Review of CO2 Capture by Absorption and Adsorption. Aerosol Air Qual. Res. 2012, 12, 745–769. [Google Scholar] [CrossRef]
  7. Li, H.; Yan, D.; Zhang, Z.; Lichtfouse, E. Prediction of CO2 absorption by physical solvents using a chemoinformatics-based machine learning model. Environ. Chem. Lett. 2019, 17, 1397–1404. [Google Scholar] [CrossRef]
  8. Li, H.; Zhang, Z. Mining the intrinsic trends of CO2 solubility in blended solutions. J. CO2 Util. 2018, 26, 496–502. [Google Scholar] [CrossRef]
  9. Rochelle, G.T. Amine scrubbing for CO2 capture. Science 2009, 325, 1652–1654. [Google Scholar] [CrossRef]
  10. Yeh, J.T.; Resnik, K.P.; Rygle, K.; Pennline, H.W. Semi-batch absorption and regeneration studies for CO2 capture by aqueous ammonia. Fuel Process. Technol. 2005, 86, 1533–1546. [Google Scholar] [CrossRef]
  11. Chen, S.; Zhu, M.; Fu, Y.; Huang, Y.; Tao, Z.; Li, W. Using 13X, LiX, and LiPdAgX zeolites for CO2 capture from post-combustion flue gas. Appl. Energy 2017, 191, 87–98. [Google Scholar] [CrossRef]
  12. Lakhi, K.S.; Cha, W.S.; Joseph, S.; Wood, B.J.; Aldeyab, S.S.; Lawrence, G.; Choy, J.-H.; Vinu, A. Cage type mesoporous carbon nitride with large mesopores for CO2 capture. Catal. Today 2015, 243, 209–217. [Google Scholar] [CrossRef]
  13. Hiremath, V.; Shavi, R.; Seo, J.G. Controlled oxidation state of Ti in MgO-TiO2 composite for CO2 capture. Chem. Eng. J. 2017, 308, 177–183. [Google Scholar] [CrossRef]
  14. Yoshikawa, K.; Kaneeda, M.; Nakamura, H. Development of Novel CeO2-based CO2 adsorbent and analysis on its CO2 adsorption and desorption mechanism. Energy Procedia 2017, 114, 2481–2487. [Google Scholar] [CrossRef]
  15. Xu, H.; Hou, X. Synergistic effect of CeO2 modified Pt/C electrocatalysts on the performance of PEM fuel cells. Int. J. Hydrog. 2007, 32, 4397–4401. [Google Scholar] [CrossRef]
  16. Kozerozhets, V.; Panasyuk, G.P.; Semenov, E.A.; Voroshilov, I.L.; Avdeeva, V.V.; Buzanov, G.A.; Danchevskaya, M.N.; Kolmakova, A.A.; Malinina, E.A. A new approach to the synthesis of nanosized powder CaO and its application as precursor for the synthesis of calcium borates. Ceram. Int. 2022, 48, 7522–7532. [Google Scholar] [CrossRef]
  17. Arifutzzaman, A.; Musa, I.N.; Aroua, M.K.; Saidur, R.M. Xene based activated carbon novel nano-sandwich for efficient CO2 adsorption in fixed-bed column. J. CO2 Util. 2023, 68, 102353. [Google Scholar] [CrossRef]
  18. Ligero, A.; Calero, M.; Martín-Lara, M.Á.; Blázquez, G.; Solís, R.R.; Pérez, A. Fixed-bed CO2 adsorption onto activated char from the pyrolysis of a non-recyclable plastic mixture from real urban residues. J. CO2 Util. 2023, 73, 102517. [Google Scholar] [CrossRef]
  19. Kozerozhets, I.V.; Panasyuk, G.P.; Semenov, E.A.; Buzanov, G.A.; Avdeeva, V.V.; Danchevskaya, M.N.; Tsvetov, N.S.; Shapovalov, S.S.; Vasil’ev, M.G. Function of the Non-Crystalline X-Ray Amorphous Phase of Highly Dispersed Powder of CaO in Adsorption of CO2 and H2O. Russ. J. Gen. Chem. 2021, 91, S98–S105. [Google Scholar] [CrossRef]
  20. Buckeridge, J.; Scanlon, D.O.; Walsh, A.; Catlow, C.R.A.; Sokol, A.A. Dynamical response and instability in ceria under lattice expansion. Phys. Rev. B 2013, 87, 214304. [Google Scholar] [CrossRef]
  21. Sharan, R.; Dutta, A. Structural analysis of Zr4+ doped ceria, a possible material for ammonia detection in ppm level. J. Alloys Compd. 2017, 693, 936–944. [Google Scholar] [CrossRef]
  22. Chuang, C.-C.; Hsiang, H.-I.; Yen, F.-S.; Chen, C.-C.; Yang, S.-J. Phase evolution and reduction behavior of Ce0.6Zr0.4O2 powders prepared using the chemical co-precipitation method. Ceram. Int. 2013, 39, 1717–1722. [Google Scholar] [CrossRef]
  23. Trovarelli, A.; Zamar, F.; Llorca, J.; Leitenburg, C.; Dolcetti, G.; Kiss, J.T. Nanophase Fluorite-Structured CeO2–ZrO2 Catalysts Prepared by High-Energy Mechanical Milling. J. Catal. 1997, 169, 490–502. [Google Scholar] [CrossRef]
  24. Rumruangwong, M.; Wongkasemjit, S. Synthesis of ceria–zirconia mixed oxide from cerium and zirconium glycolates via sol–gel process and its reduction property. Appl. Organomet. Chem. 2006, 20, 615–625. [Google Scholar] [CrossRef]
  25. Sajeevan, A.C.; Sajith, V. Synthesis of stable cerium zirconium oxide nanoparticle—Diesel suspension and investigation of its effects on diesel properties and smoke. Fuel 2016, 183, 155–163. [Google Scholar] [CrossRef]
  26. Reddy, G.K.; Gunugunuri, K.R.; Ibram, G.; Ferreira, J. Single step synthesis of nanosized CeO2–MxOy mixed oxides (MxOy = SiO2, TiO2, ZrO2, and Al2O3) by microwave induced solution combustion synthesis: Characterization and CO oxidation. J. Mater. Sci. 2009, 44, 2743–2751. [Google Scholar] [CrossRef]
  27. Liu, J.; Zhao, Z.; Xu, C.; Liu, J. Structure, synthesis, and catalytic properties of nanosize cerium-zirconium-based solid solutions in environmental catalysis. Chin. J. Catal. 2019, 40, 1438–1487. [Google Scholar] [CrossRef]
  28. Mukherjee, D.; Rao, B.G.; Reddy, B.M. CO and soot oxidation activity of doped ceria: Influence of dopants. Appl. Catal. B 2016, 197, 105–115. [Google Scholar] [CrossRef]
  29. Campos, P.T.A.; Oliveira, C.F.; Lima, J.P.V.; Queiroz Silva, D.R.; Dias, S.C.L.; Dias, J.A. Cerium–zirconium mixed oxide synthesized by sol-gel method and its effect on the oxygen vacancy and specific surface area. J. Solid State Chem. 2022, 307, 122752. [Google Scholar] [CrossRef]
  30. Reddy, B.M.; Bharali, P.; Saikia, P.; Park, S.E.; van den Berg, M.W.E.; Muhler, M.; Grünert, W. Structural Characterization and Catalytic Activity of Nanosized CexM1-xO2 (M = Zr and Hf) Mixed Oxides. J. Phys. Chem. C 2008, 112, 11729–11737. [Google Scholar] [CrossRef]
  31. Shih, S.-J.; Wu, Y.-Y.; Chou, Y.-J.; Borisenko, K.B. Nanoscale control of composition in cerium and zirconium mixed oxide nanoparticles. Mater. Chem. Phys. 2012, 135, 749–754. [Google Scholar] [CrossRef]
  32. Nagai, Y.; Yamamoto, T.; Tanaka, T.; Yoshida, S.; Nonaka, T.; Okamoto, T.; Suda, A.; Sugiura, M. X-ray absorption fine structure analysis of local structure of CeO2–ZrO2 mixed oxides with the same composition ratio (Ce/Zr = 1). Catal. Today 2002, 74, 225–234. [Google Scholar] [CrossRef]
  33. Yoshioka, T.; Dosaka, K.; Sato, T.; Okuwaki, A.; Tanno, S.; Miura, T. Preparation of spherical ceria-doped tetragonal zirconia by the spray-pyrolysis method. J. Mater. Sci. 1992, 11, 51–55. [Google Scholar] [CrossRef]
  34. Schulz, H.; Stark, W.J.; Maciejewski, M.; Pratsinis, S.E.; Baiker, A. Flame-made nanocrystalline ceria/zirconia doped with alumina or silica: Structural properties and enhanced oxygen exchange capacity. J. Mater. Chem. 2003, 13, 2979–2984. [Google Scholar] [CrossRef]
  35. Aguirre, S.B.; Vargas, L.; Rodriguez, J.R.; Estrada, M.; Castillon, F.; Lopez, M.; Simakova, I.; Simakov, A. One-pot synthesis of uniform hollow nanospheres of Ce–Zr–O mixed oxides by spray pyrolysis. Micropor. Mesopor. Mater. 2020, 294, 109886. [Google Scholar] [CrossRef]
  36. Alifanti, B.B.M.; Blangenois, N.; Naud, J.; Grange, P.; Delmon, B. Characterization of CeO2−ZrO2 Mixed Oxides. Comparison of the Citrate and Sol−Gel Preparation Methods. Chem. Mater. 2003, 15, 395–403. [Google Scholar] [CrossRef]
  37. Sugiura, M.; Ozawa, M.; Suda, A.; Suzuki, T.; Kanazawa, T. Development of Innovative Three-Way Catalysts Containing Ceria–Zirconia Solid Solutions with High Oxygen Storage/Release Capacity. Bull. Chem. Soc. Jpn. 2005, 78, 752–767. [Google Scholar] [CrossRef]
  38. Boaro, M.; Colussi, S.; Trovarelli, A. Ceria-Based Materials in Hydrogenation and Reforming Reactions for CO2 Valorization. Front. Chem. Sec. Phys. Chem. Chem. Phys. 2019, 7, 28. [Google Scholar] [CrossRef]
  39. Chen, W.; Fan, L.; Jiang, X.; Guo, J.; Liu, H.; Tian, M. Preparation of CexZr1–xO2 by Different Methods and Its Catalytic Oxidation Activity for Diesel Soot. ACS Omega 2022, 7, 16352–16360. [Google Scholar] [CrossRef]
  40. Hori, C.E.; Permana, H.; Ng, K.Y.S.; Brenner, A.; More, K.; Rahmoeller, K.M.; Belton, D. Thermal stability of oxygen storage properties in a mixed CeO2-ZrO2 system. Appl. Catal. B Environ. 1998, 16, 105–117. [Google Scholar] [CrossRef]
  41. Ai, C.; Zhang, Y.; Wang, P.; Wang, W. Catalytic Combustion of Diesel Soot on Ce/Zr Series Catalysts Prepared by Sol-Gel Method. Catalysts 2019, 9, 646. [Google Scholar] [CrossRef]
  42. Bêche, E.; Charvin, P.; Perarnau, D.; Abanades, S.; Flamant, G. Ce 3d XPS investigation of cerium oxides and mixed cerium oxide (CexTiyOz). Surf. Interface Anal. 2008, 40, 264–267. [Google Scholar] [CrossRef]
  43. Jampaiah, D.; Ippolito, S.J.; Sabri, Y.M.; Tardio, J.; Selvakannan, P.R.; Nafady, A.; Reddy, B.M.; Bhargava, S.K. Ceria–zirconia modified MnOx catalysts for gaseous elemental mercury oxidation and adsorption. Catal. Sci. Technol. 2016, 6, 1792–1803. [Google Scholar] [CrossRef]
  44. Rao, M.V.R.; Shripathi, T. Photoelectron spectroscopic study of X-ray induced reduction of CeO2. J. Electron Spectrosc. Relat. Phenom. 1997, 87, 121–126. [Google Scholar] [CrossRef]
  45. Galtayries, A.; Sporken, R.; Riga, J.; Blanchard, G.; Caudano, R. XPS comparative study of ceria/zirconia mixed oxides: Powders and thin film characterisation. J. Electron Spectrosc. Relat. Phenom. 1998, 88–91, 951–956. [Google Scholar] [CrossRef]
  46. Shan, W.; Liu, F.; He, H.; Shi, X.; Zhang, C. An environmentally-benign CeO2-TiO2 catalyst for the selective catalytic reduction of NOx with NH3 in simulated diesel exhaust. Catal. Today 2012, 184, 160–165. [Google Scholar] [CrossRef]
  47. Zhang, R.; Zhong, Q.; Zhao, W.; Yu, L.; Qu, H. Promotional effect of fluorine on the selective catalytic reduction of NO with NH3 over CeO2-TiO2 catalyst at low temperature. Appl. Surf. Sci. 2014, 289, 237–244. [Google Scholar] [CrossRef]
  48. Tsunekawa, S.; Asami, K.; Ito, S.; Yashima, M.; Sugimoto, T. XPS study of the phase transition in pure zirconium oxide nanocrystallites. Appl. Surf. Sci. 2005, 252, 1651–1656. [Google Scholar] [CrossRef]
  49. Tsoncheva, T.; Ivanova, R.; Henych, J.; Dimitrov, M.; Kormunda, M.; Kovacheva, D.; Scotti, N.; Dal Santo, V. Effect of preparation procedure on the formation of nanostructured ceria–zirconia mixed oxide catalysts for ethyl acetate oxidation:Homogeneous precipitation with urea vs template-assisted hydrothermal synthesis. Appl. Catal. A 2015, 502, 418–432. [Google Scholar] [CrossRef]
  50. Daturi, M.; Binet, C.; Lavalley, J.C.; Blanchard, G. Surface FTIR investigations on CexZr1-xO2 system. Surf. Interface Anal. 2000, 30, 273–277. [Google Scholar] [CrossRef]
  51. Li, M.; Tumuluri, U.; Wu, Z.; Dai, S. Effect of Dopants on the Adsorption of Carbon Dioxide on Ceria Surfaces. Chem. Sus. Chem. 2015, 8, 3651–3660. [Google Scholar] [CrossRef] [PubMed]
  52. Daturi, M.; Binet, C.; Lavalley, J.-C.; Galtayries, A.; Sporken, R. Surface investigation on CexZr1-xO2 compounds. Phys. Chem. Chem. Phys. 1999, 1, 5717–5724. [Google Scholar] [CrossRef]
  53. Yoshikawa, K.; Sato, H.; Kaneeda, M.; Kondo, J.N. Synthesis and analysis of CO2 adsorbents based on cerium oxide. J. CO2 Util. 2014, 8, 34–38. [Google Scholar] [CrossRef]
  54. Bhatta, L.K.G.; Subramanyam, S.; Chengala, M.D.; Bhatta, U.M.; Pandita, N.; Venkatesh, K. Investigation of CO2 adsorption on carbon material derived from Mesua ferrea L. seed cake. J. Environ. Chem. Eng. 2015, 3, 2957–2965. [Google Scholar] [CrossRef]
Figure 1. XRD patterns of CeO2, ZrO2, and Ce-Zr composites (CeO2-PDF2 #01-071-4199, ZrO2-PDF2 #00-068-0200).
Nanomaterials 13 02428 g001
Figure 2. TEM micrographs at low (40,000×) and high (600,000×) magnifications, histograms of the particles size distribution, and Selected Area Electron Diffraction (SAED) patterns of Ce0.33Zr0.67 (AC); Zr0.5Ce0.5 (DF); and Ce0.67Zr0.33 (GI).
Nanomaterials 13 02428 g002
Figure 3. XPS spectra of CeO2, ZrO2, and CeO2/ZrO2 samples.
Nanomaterials 13 02428 g003
Figure 4. FT-IR spectra of adsorbed CO2 on Ce-Zr composites. CO2 was adsorbed at RT on 300 °C dehydrated samples followed by RT (A) and 100 °C (B) desorption in high vacuum.
Nanomaterials 13 02428 g004
Figure 5. CO2 adsorption breakthrough curves of the studied samples.
Nanomaterials 13 02428 g005
Figure 6. CO2 adsorption isotherms at 0 and 25 °C (A,B) and heat of adsorption curves (C,D) of the CeO2 and ZrO2 samples.
Nanomaterials 13 02428 g006
Figure 7. CO2 adsorption isotherms at 0 and 25 °C (AC) and heat of adsorption curves (BD) of the prepared Ce0.67Zr0.33 and Ce0.33Zr0.67 composites.
Nanomaterials 13 02428 g007
Figure 8. CO2 adsorption isotherms at 0 and 25 °C (AC) and heat of adsorption curves (BD) of the prepared Ce0.5Zr0.5 and Ce0.5Zr0.5 composites.
Nanomaterials 13 02428 g008
Table 1. Textural properties of cerium- and zirconium-oxide materials.
SamplesSBET,
m2/g
Pore Volume, cm3/g
ZrO22710.41
Ce0.33Zr0.671850.18
ext.Ce0.5Zr0.51810.15
Ce0.5Zr0.51530.17
Ce0.67Zr0.33 1190.13
CeO2550.10
Table 2. Phase composition, fluorite unit cell parameters, and average crystallite size of CeO2, ZrO2 and the Ce–Zr composite nanomaterials.
SamplesPhase Composition
(Space Group)
Unit Cell Parameters (Å)Crystallite Size,
nm (±0.5–1 nm)
CeO2CeO2 (Fm-3m)a = 5.4146(3)16
Ce0.67Zr0.33(Ce,Zr)O2 (Fm-3m)
ZrO2 (P42/nmc)
a = 5.406(1)
a = 3.709(5)
c = 5.33(1)
12
5
Ce0.5Zr0.5(Ce,Zr)O2 (Fm-3m)
ZrO2 (P42/nmc)
a = 5.382(5)
a = 3.710(5)
c = 5.313(8)
8
6
ext.Ce0.5Zr0.5(Ce,Zr)O2 (Fm-3m)
ZrO2 (P42/nmc)
a = 5.394(2)
a = 3.709(3)
c = 5.339(5)
10
5
Ce0.33Zr0.67(Ce,Zr)O2 (Fm-3m)
ZrO2 (P42/nmc)
a = 5.36(1)
a = 3.70(1)
c = 5.31(2)
6
5
ZrO2n.d.n.d.n.d.
Table 3. Surface composition of the CeO2, ZrO2, Ce0.67Zr0.33, Ce0.33Zr0.67, and Ce0.5Zr0.5 materials based on XPS analysis.
SamplesConcentration,
at. %
Ratio of Oxidation States, %Binding Energy,
eV
Ce
(Ce 3d)
Zr
(Zr 3d)
O
(O 1s)
Ce4+:Ce3+O1s Ce4+O1s Zr
CeO227-7393:7529.27-
Ce0.67Zr0.3317127187:13 529.39529.68
Ce0.5Zr0.511236791:9 529.49529.79
ext.Ce0.5Zr0.510216990:10 529.49529.79
Ce0.33Zr0.675286787:13529.61529.90
ZrO2-3763- -530.09
Table 4. CO2 adsorption capacities of the prepared materials in dynamic conditions.
SamplesCO2 ads. CO2/N2,
mmol/g
CO2 ads.
CO2/H2O/N2 1,
mmol/g
Repeated CO2 ads. CO2/H2O/N2 2,
mmol/g
ZrO22.02.11.9
Ce0.33Zr0.673.23.43.2
Ce0.5Zr0.52.93.13.0
ext.Ce0.5Zr0.53.03.53.4
Ce0.67Zr0.333.53.73.6
CeO22.32.42.3
1 Experiments performed with 3 vol.% CO2 plus 1 vol.% water vapor; 2 results obtained by 5 adsorption/desorption cycles.
Disclaimer/Publisher’s Note: The statements, opinions and data contained in all publications are solely those of the individual author(s) and contributor(s) and not of MDPI and/or the editor(s). MDPI and/or the editor(s) disclaim responsibility for any injury to people or property resulting from any ideas, methods, instructions or products referred to in the content.

