Article

The Role of Polymer Chain Stiffness and Guest Nanoparticle Loading in Improving the Glass Transition Temperature of Polymer Nanocomposites

1
Department of Physics, Zhejiang Normal University, Jinhua 321004, China
2
Department of Physics, Zhejiang University, Hangzhou 310027, China
3
Department of Physics, Jordan University of Science & Technology, P.O. Box 3030, Irbid 22110, Jordan
4
Department of Physics, Khalifa University of Science and Technology, P.O. Box 127788, Abu Dhabi 127788, United Arab Emirates
*
Authors to whom correspondence should be addressed.
Nanomaterials 2023, 13(13), 1896; https://doi.org/10.3390/nano13131896
Submission received: 18 April 2023 / Revised: 8 June 2023 / Accepted: 13 June 2023 / Published: 21 June 2023
(This article belongs to the Section Nanocomposite Materials)

Abstract

:
The impact of polymer chain stiffness characterized by the bending modulus (kθ) on the glass transition temperature (Tg) of pure polymer systems, as well as polymer nanocomposites (PNCs), is investigated using molecular dynamics simulations. At small kθ values, the pure polymer system and respective PNCs are in an amorphous state, whereas at large kθ values, both systems are in a semicrystalline state with a glass transition at low temperature. For the pure polymer system, Tg initially increases with kθ and does not change obviously at large kθ. However, the Tg of PNCs shows interesting behaviors with the increasing volume fraction of nanoparticles (fNP) at different kθ values. Tg tends to increase with fNP at small kθ, whereas it becomes suppressed at large kθ.

1. Introduction

The glass transition temperature (Tg) and melting temperature (Tm) are two important properties of polymers related to the order of polymer chains in any polymer system [1]. The degree of ordering of chains in the bulk mainly depends on stiffness which can be adjusted by tuning the bending modulus (kθ) in the simulations incorporated via the bending potential given in Equation (3) [2,3,4]. A finitely long polymer chain behaves like a flexible polymer at smaller values of kθ and it turns into a rod-like structure at high enough values of kθ. Experimentally, the stiffness of a polymer chain can be tailored by introducing some functional groups or by initiating crosslinking [5]. During the annealing process of an amorphous polymer system (with no long-range order of polymer chains), the transition of a glass state into a rubber state takes place at a particular temperature referred to as Tg while Tm is referred to as a phase transition of a crystalline polymer system (with a higher degree of polymer order) into its liquid form. The partial polymer crystalline order can be witnessed in long semiflexible neutral polymer systems while a higher degree of polymer order can be observed in highly stiff short polymers [6,7,8,9]. An increase in polymer concentration and stiffness can trigger a transition of a polymer system from a highly disordered (isotropic) to a relatively ordered (nematic) state [6,10,11,12,13]. The crystallinity of the polymer can be witnessed in several polymer nanocomposites (PNCs) along with several biological systems [14,15,16].
Natural and synthetic polymers exhibit a lot of variations in their properties depending on stiffness, especially Tg [17]. An understanding of Tg is of significant importance and has continued to spark intense discussion among scientists [18,19,20,21,22,23]. The glass transition is not only limited to conventional polymers but also extends to other important partially stiff biopolymers, such as DNA and proteins [24,25]. The polymer chain stiffness also influences the static and dynamic behaviours of the polymer [26,27]. It was pointed out that the diffusion of polymer strands can also influence various cellular functions [28]. The dynamics of biological polymers are dependent on the Tg and are also distorted by guest filler loading [29,30,31,32,33,34,35,36,37]. For example, fillers such as cytoskeleton, actin, nucleus, and additive chromatins, etc., significantly alter the dynamics of living polymers such as RNAs and proteins [30,34,38,39,40]. The arrangement of polymer chains in any system is also largely reliant on the interplay between chain rigidity and entropy [24,27,41,42,43].
The guest nanoparticles (NPs) can be incorporated into the host polymer system to enhance their macroscopic characteristics [44,45,46,47,48,49,50,51,52,53,54,55]. So, the polymer/NP systems have countless applications in technological fields along with industrial formulations [46,49,52]. The impact of the loading of NPs on a polymer’s dynamical and structural properties is a hot research topic [44,56,57,58,59,60,61,62,63,64]. The size and loading percentage of NPs have a substantial impact on the dynamics and conformational characteristics of polymers and hence the Tg [56,57,58,59,60,61,65]. Moreover, it was also revealed that the attraction between polymers and NPs significantly alters the properties of polymers [46,57,58,66]. For example, experiments on PMMA nanocomposites with silica NPs reported a significant improvement in the Tg due to the strong attraction generated by the substantial surface charge density of NPs towards PMMA [58]. An improvement in the Tg of polyimide (PI) nanocomposite with attractive octa(aminophenyl) polyhedral oligomeric silsesquioxane (OAPS) NPs was also reported, whereas the change in Tg was almost negligible with repulsive octaphenyl silsesquioxane (OPS) NPs [66]. Atomistic molecular dynamics simulations reported a significant influence on the dynamics of the polymer interface with silica NP [67]. The change in the stiffness of a polymer chain can also influence the Tg of polymer bulk and PNCs. For example, coarse-grained molecular-dynamics simulations demonstrated that the Tg of polymer bulk with three types of chain stiffness, i.e., freely jointed chain (FJC), freely rotating chain (FRC), and rotation isomeric state (RIS) with a stiffness order of FJC < FRC < RIS, increases by increasing polymer chain stiffness [68]. However, this aspect in the case of PNCs has rarely been studied so far. For instance, one such study that has some partial relevance with polymer chain stiffness and the Tg of PNCs was carried out by Podsiadlo et al. [1] in early 2000. Their differential scanning calorimetry (DSC) study on PNCs of PVA and montmorillonite (MTM) crosslinked with glutaraldehyde (GA) showed significant improvement in the Tg because of the improvement in PVA stiffness. However, for a better understanding of such systems, a deep molecular dynamics simulation study is still required.
In this paper, we investigate the impact of the stiffness of polymer chain and volume fraction of NPs on the Tg of pure polymer and PNCs excluding the melting temperature because the underlying physics behind both phenomena is the same for any possible shift. We find that NPs interact differently with polymer chain stiffness in PNCs and, hence, the Tg shows different trends with the increasing volume fraction of NPs.
Polymers are thermally less stable and exhibit a lot of variation in their stiffness depending on the type of polymer. So, the nanoparticles are added to improve the stability of polymers. To date, it is not clear whether the loading of NPs increases the thermal stability of polymers or in some cases can suppress it. In this work, we considered polymer chains with different chain stiffnesses and loaded attractive NPs to explore the impact on Tg. We expect that this study could be helpful in understanding the Tg of various PNC systems consisting of polymer chains with a wide range of stiffnesses.

2. Model and Simulation Method

The Tg and other properties of pure polymer and PNCs with mobile and attractive NPs are investigated in a crowded environment using molecular-dynamics simulations. The system consists of a total number of n = 96 chains with the same polymer length N = 44. A large system size (greater than 5<Rg> with <Rg> as the mean radius of gyration of polymer in bulk) is adopted here to minimize the size effect. The volume fraction of NPs, fNP, is defined as:
f N P = π 6 N N P σ N P 3 V
Here, the diameter of NPs is represented by σNP and the quantity of NPs in the system by NNP. The simulations are conducted in a cubic simulation system with a volume V = L3, where L is the length of a cubical box. Along the x, y, and z directions, periodic boundary conditions (PBCs) are used. We have investigated the Tg in two ways: at different values of kθ and at different values of fNP. Various samples were introduced, i.e., from kθ = 1 representing a flexible polymer chain to kθ = 60 representing a highly ordered semicrystalline polymer chain. Since the polymer chains’ order at kθ = 60 is relatively high, we restricted ourselves up to kθ = 40 only for PNC cases. The volume fraction of NPs is tailored from fNP = 0 to fNP = 0.15. Figure 1a–c present different systems with kθ = 1, kθ = 10 and kθ = 40, respectively, at fNP = 0.06. An increase in the polymer chains’ order with increasing polymer chain stiffness is obvious. In our simulation system fNP, polymer chain stiffness and the NP–polymer interaction strength can be regulated; however, we preferred to work with a constant NP–polymer interaction strength. The Tg was studied by monitoring the temperature–volume relations of the system. The diffusivity of polymer chains and conformational properties were calculated by running several NPT simulations.
The linear polymer chains employed in the simulation are made up of N identical, spherical monomers that have size σ, equal to the size of a NP, i.e., σ = σNP = 1. In various simulation systems, mainly four types of interactions are involved. Each interaction has a distinct potential. The interaction between bonded monomers in a chain is represented by the FENE potential given by Equation (2). To control polymer chain stiffness, Equation (3) is used. For the interactions between non-bonded monomers, between monomers and NPs, and between NPs, Equation (4) is used [69,70,71].
V FENE ( b ) = 1 2 K R 0 2 ln 1 b R 0 2 + 4 ε PP σ b 12 σ b 6 + 1 4 ,   b < R 0 ,   b R 0
V bend ( θ ) = k θ ( 1 + cos θ )
V ij LJ ( r ) = 4 ε ij σ r 12 σ r 6 4 ε ij σ r c 12 σ r c 6 ,   r < r c   0 ,   r r c
In Equation (2), b represents the bond length, K is the elastic coefficient and R0 is the longest bond length that each bond may extend. We set K = 30εPP/σ2 and R0 = 1.5σ in this work. In Equation (3), Vbend(θ) represents the bending potential with kθ the bending modulus and θ the bond angle between two successive bonds in a polymer chain [3]. In Equation (4), indices i and j correspond to the different species (P for polymer monomer and N for NP). The interaction strengths are denoted as εPP, εNP, and εNN, respectively. The cutoff distances are set as rc = 2.5σ for monomer–monomer and monomer–NP interactions and rc = 21/6σ for NP–NP interactions. Here, the cutoff at rc = 21/6σ enables pure repulsion between NPs.
The Langevin dynamics equation describes how polymer monomers and NPs move across the simulation system.
m i d 2 r i d t 2 = F c m i Γ i v i + F r
Here, Fc is the conservative force in the system, i.e., F c = i ( V FENE + V PP LJ + V PN LJ + V NN LJ ) and the summation is applied to all NPs and monomers. The viscous damping force is expressed by the second term, where Γi is the frictional coefficient. For polymer monomers and NPs, Γi is configured to be a constant. The final term takes into account the white noise force, which has a zero mean and a correlator < F r ( t 1 ) F r ( t 2 ) > = 6 m i Γ i k B T δ ( t 1 t 2 ) . Here, δ ( t 1 t 2 ) denotes the Dirac delta-function. There are no correlations between the thermal noise force and multiple cartesian directions. The mass of NP, mNP, is determined by the size and density of the NP. In the current simulations, we used mNP = 1.
LJ units are used to express each physical quantity. We set m = 1, σ = 1 and εPP = 1 as the corresponding units for mass, length, and energy, respectively. The reduced unit for time is τ 0 = m σ 2 ε P P . The unit of temperature is εPP/kB with kB, the Boltzmann’s constant. We fix εNP = 2 and εNN = 1 in this work. Polymers and NPs can be mixed very well at large εNP.
The Tg and the other characteristics of pure polymer and PNC systems are simulated by using Large-scale Atomic/Molecular Massively Parallel Simulator (LAMMPS) software (https://www.lammps.org/download.html, accessed on 15 April 2023) [72]. LAMMPS software has been extensively used for PNC systems [73,74]. We adopted NPT simulations using a Langevin thermostat with a damping constant Γ = τ0−1 and a damping parameter for pressure 0.001τ0−1. The pressure P = 1 is set as constant during the whole simulation. The time step is Δt = 0.0001τ0. In the current study, we calculated the Tg using the system’s volume–temperature relation at constant P. Firstly, we created a low density (ρ = 0.5) simulation box. Secondly, we slowly compressed the whole system along all the sides at a steady rate to produce the required pressure at T = 3. In the third step, the equilibrium of the system was achieved at T = 3 after a long simulation run (about 3 × 10⁷τ0). The system was assumed to be in equilibrium when the fluctuation of volume versus time was small. Ultimately, we conducted a simulated annealing process from a higher temperature T = 3 to a lower temperature 0.02 by using an NPT ensemble at P = 1 [75]. The annealing time consumed during this process is about 5.5 × 10⁷τ0. However, the production run was only considered from T = 2.5 to 0.02, neglecting the melting phase at higher temperatures. A slope change spot was detected from the volume versus temperature plot to determine the Tg. To study the diffusion and other properties of the polymer, we performed another equilibrium step at T = 2, not far from the Tg for a sufficiently long time (20 × 107τ0). The simulation results are averaged over 2–5 independent samples to make sure that the difference in the result is no more than 6% for various samples.

3. Results and Discussion

With the increase in the stiffness of a polymer chain, it is possible that a transformation of a polymer chain system from an amorphous state to a semicrystalline or crystalline state takes place. In the crystalline state, polymer chains behave like a highly ordered structure. To visualize the transformation of an amorphous state to a highly ordered semicrystalline state (when kθ is increased), we first calculate the nematic order parameter ( S 2 ) as follows:
S 2 = 1 2 < 3 u ^ · n ^ 2 1 >
Here, S2 and the director ( n ^ ) can be calculated by solving the tensor matrix:
Q = 1 n i = 1 n 3 2 u ^ i u ^ i 1 2 I
with I, the unit second-rank tensor. Here S2 is the largest eigenvalue and n ^ the relevant unit eigenvector of the matrix Q [76,77,78].
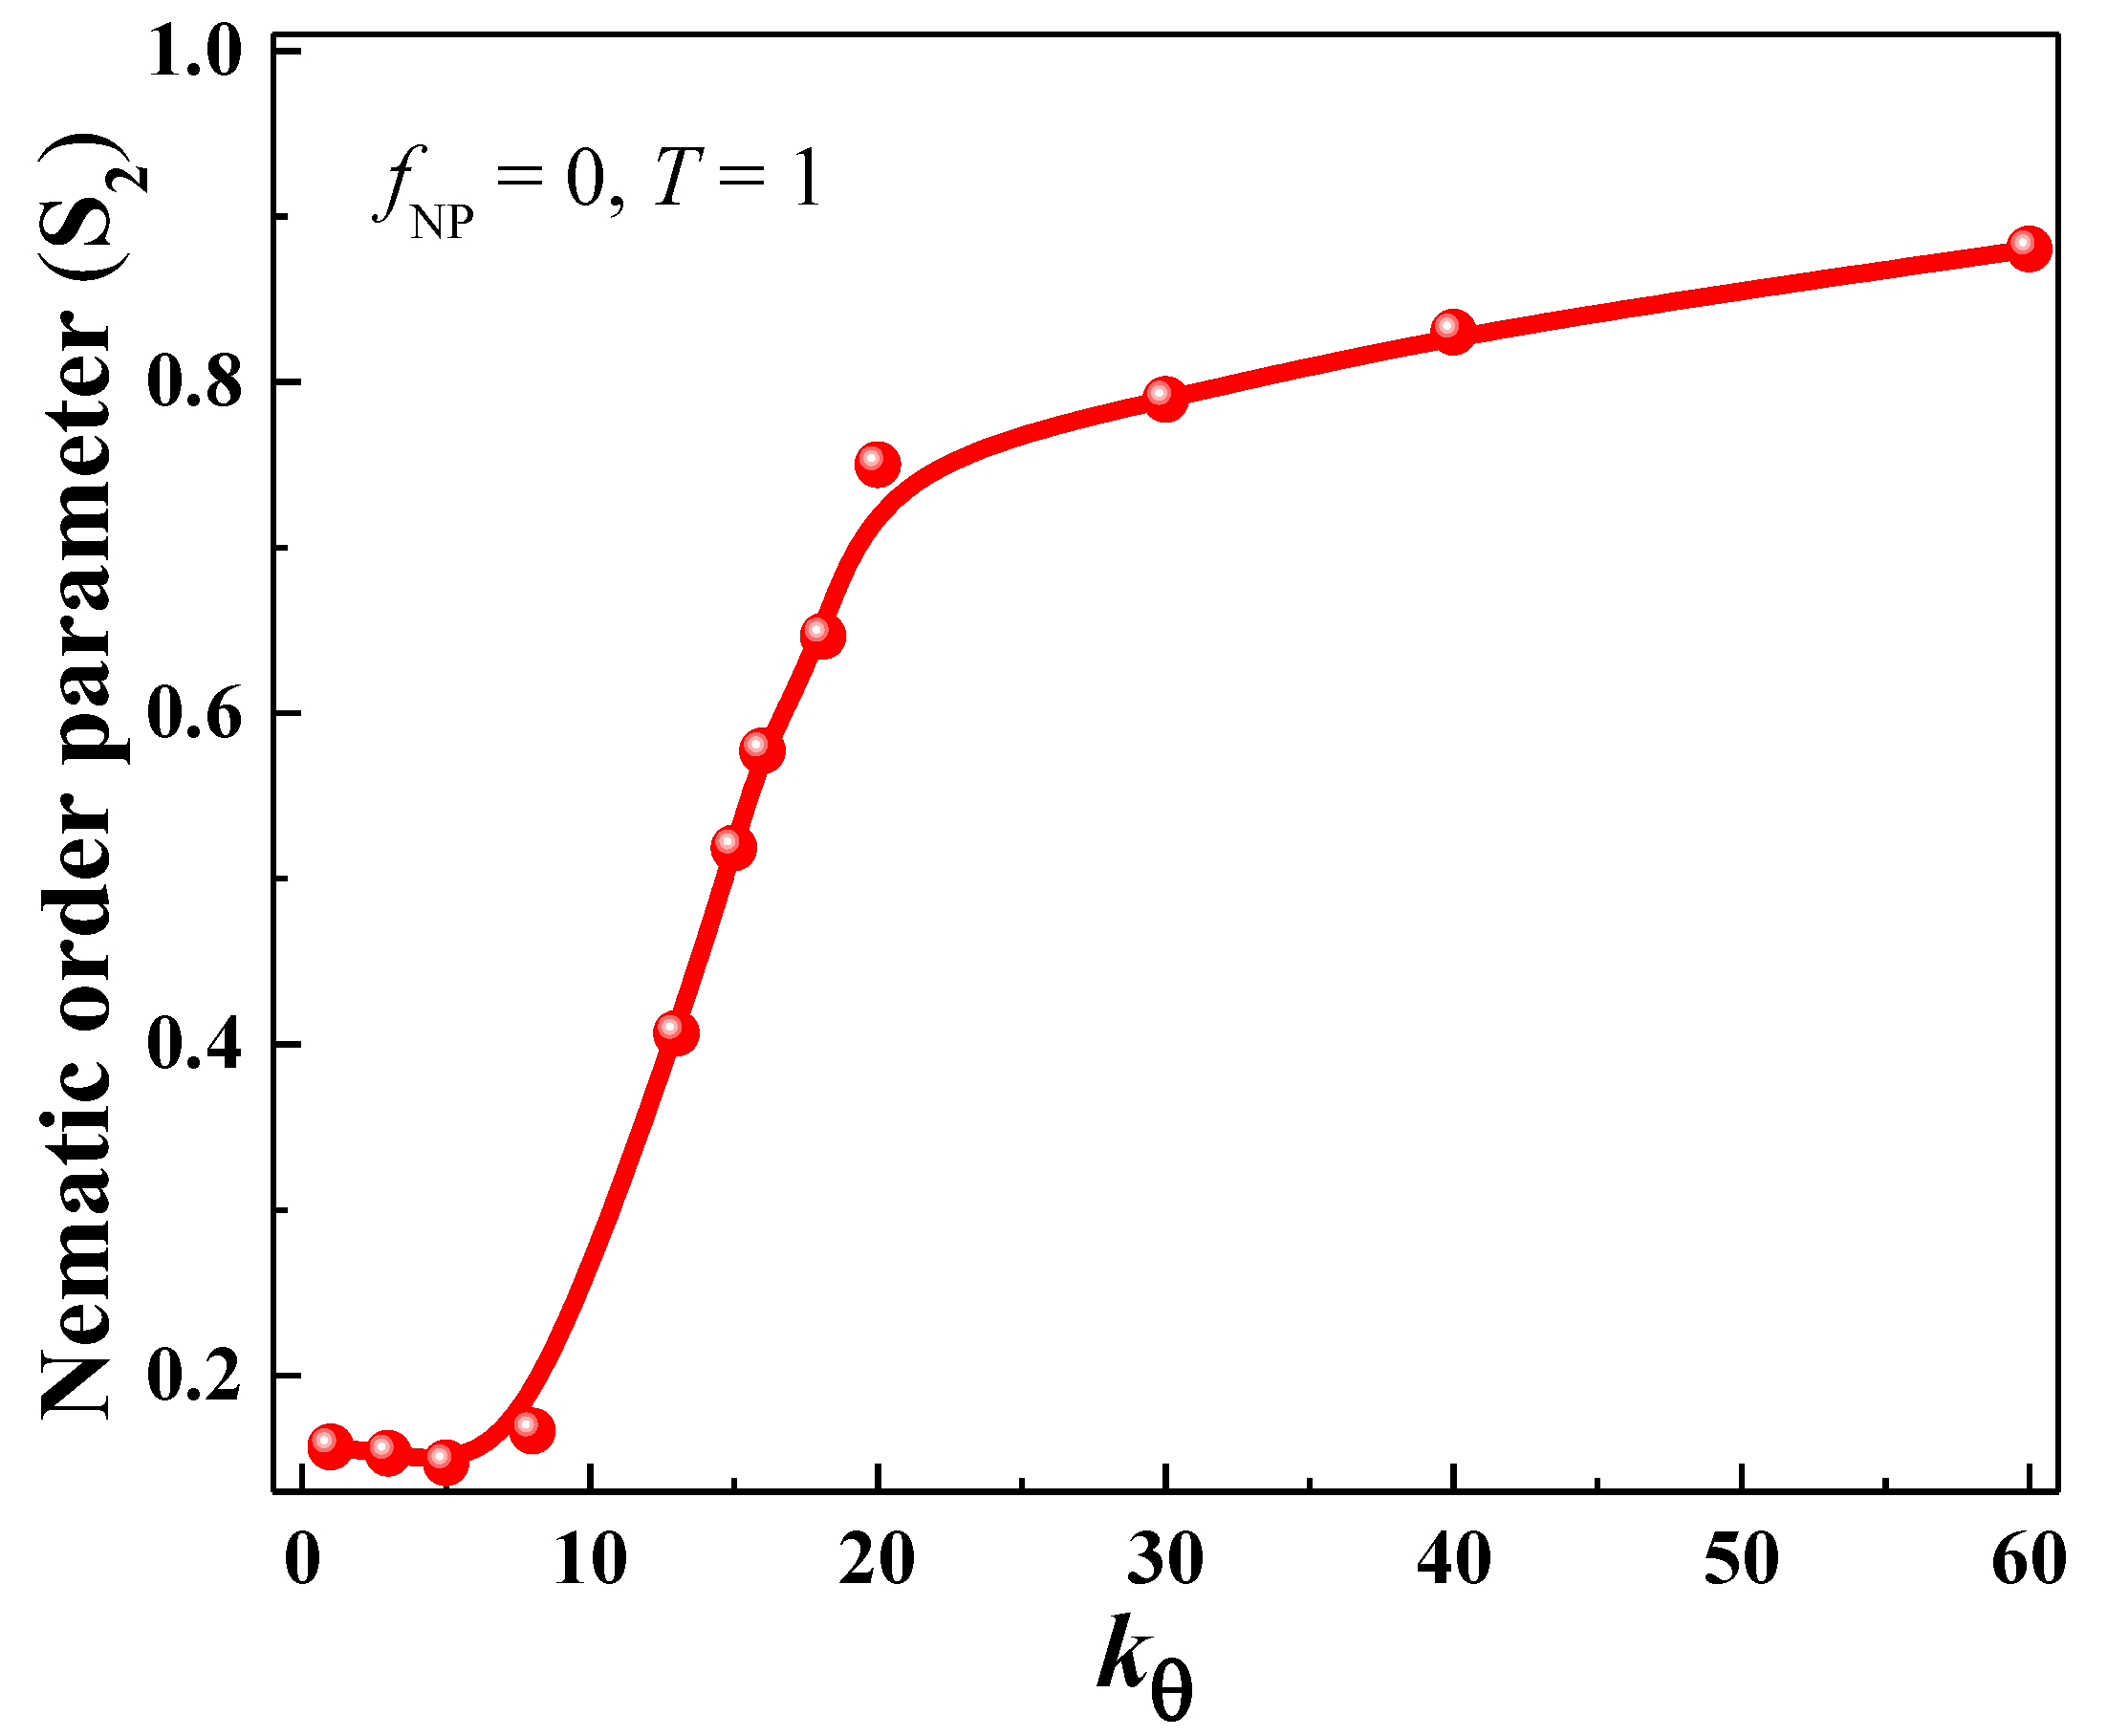
The evolution of the nematic order parameter ( S 2 ) with kθ at fNP = 0 is shown in Figure 2. It is clear that S 2 is strongly dependent on kθ. We can divide the S 2 vs. kθ curve behavior into three distinct parts: part I: kθ = (1–10), part II: kθ = (10–20) and part III: kθ = (20–60). In part I, S 2 does not change significantly and remains constant throughout this interval with an average value of S 2 at around 0.16. However, in part II, S 2 increases sharply with kθ as indicated by the steep slope in this particular interval which means a transformation of the polymer chain from an amorphous to a semicrystalline state takes place at a faster rate. From kθ = 20 onwards,  S 2 continues to increase at a slower rate (smaller slope than that in part II) until it reaches a maximum value of 0.88 at kθ = 60, indicating more order in the semicrystalline state. The variation of S 2 with polymer chain stiffness observed here is in agreement with similar works presented in the literature [2,77].

3.1. Glass Transition and Diffusion in Bulk Polymer System

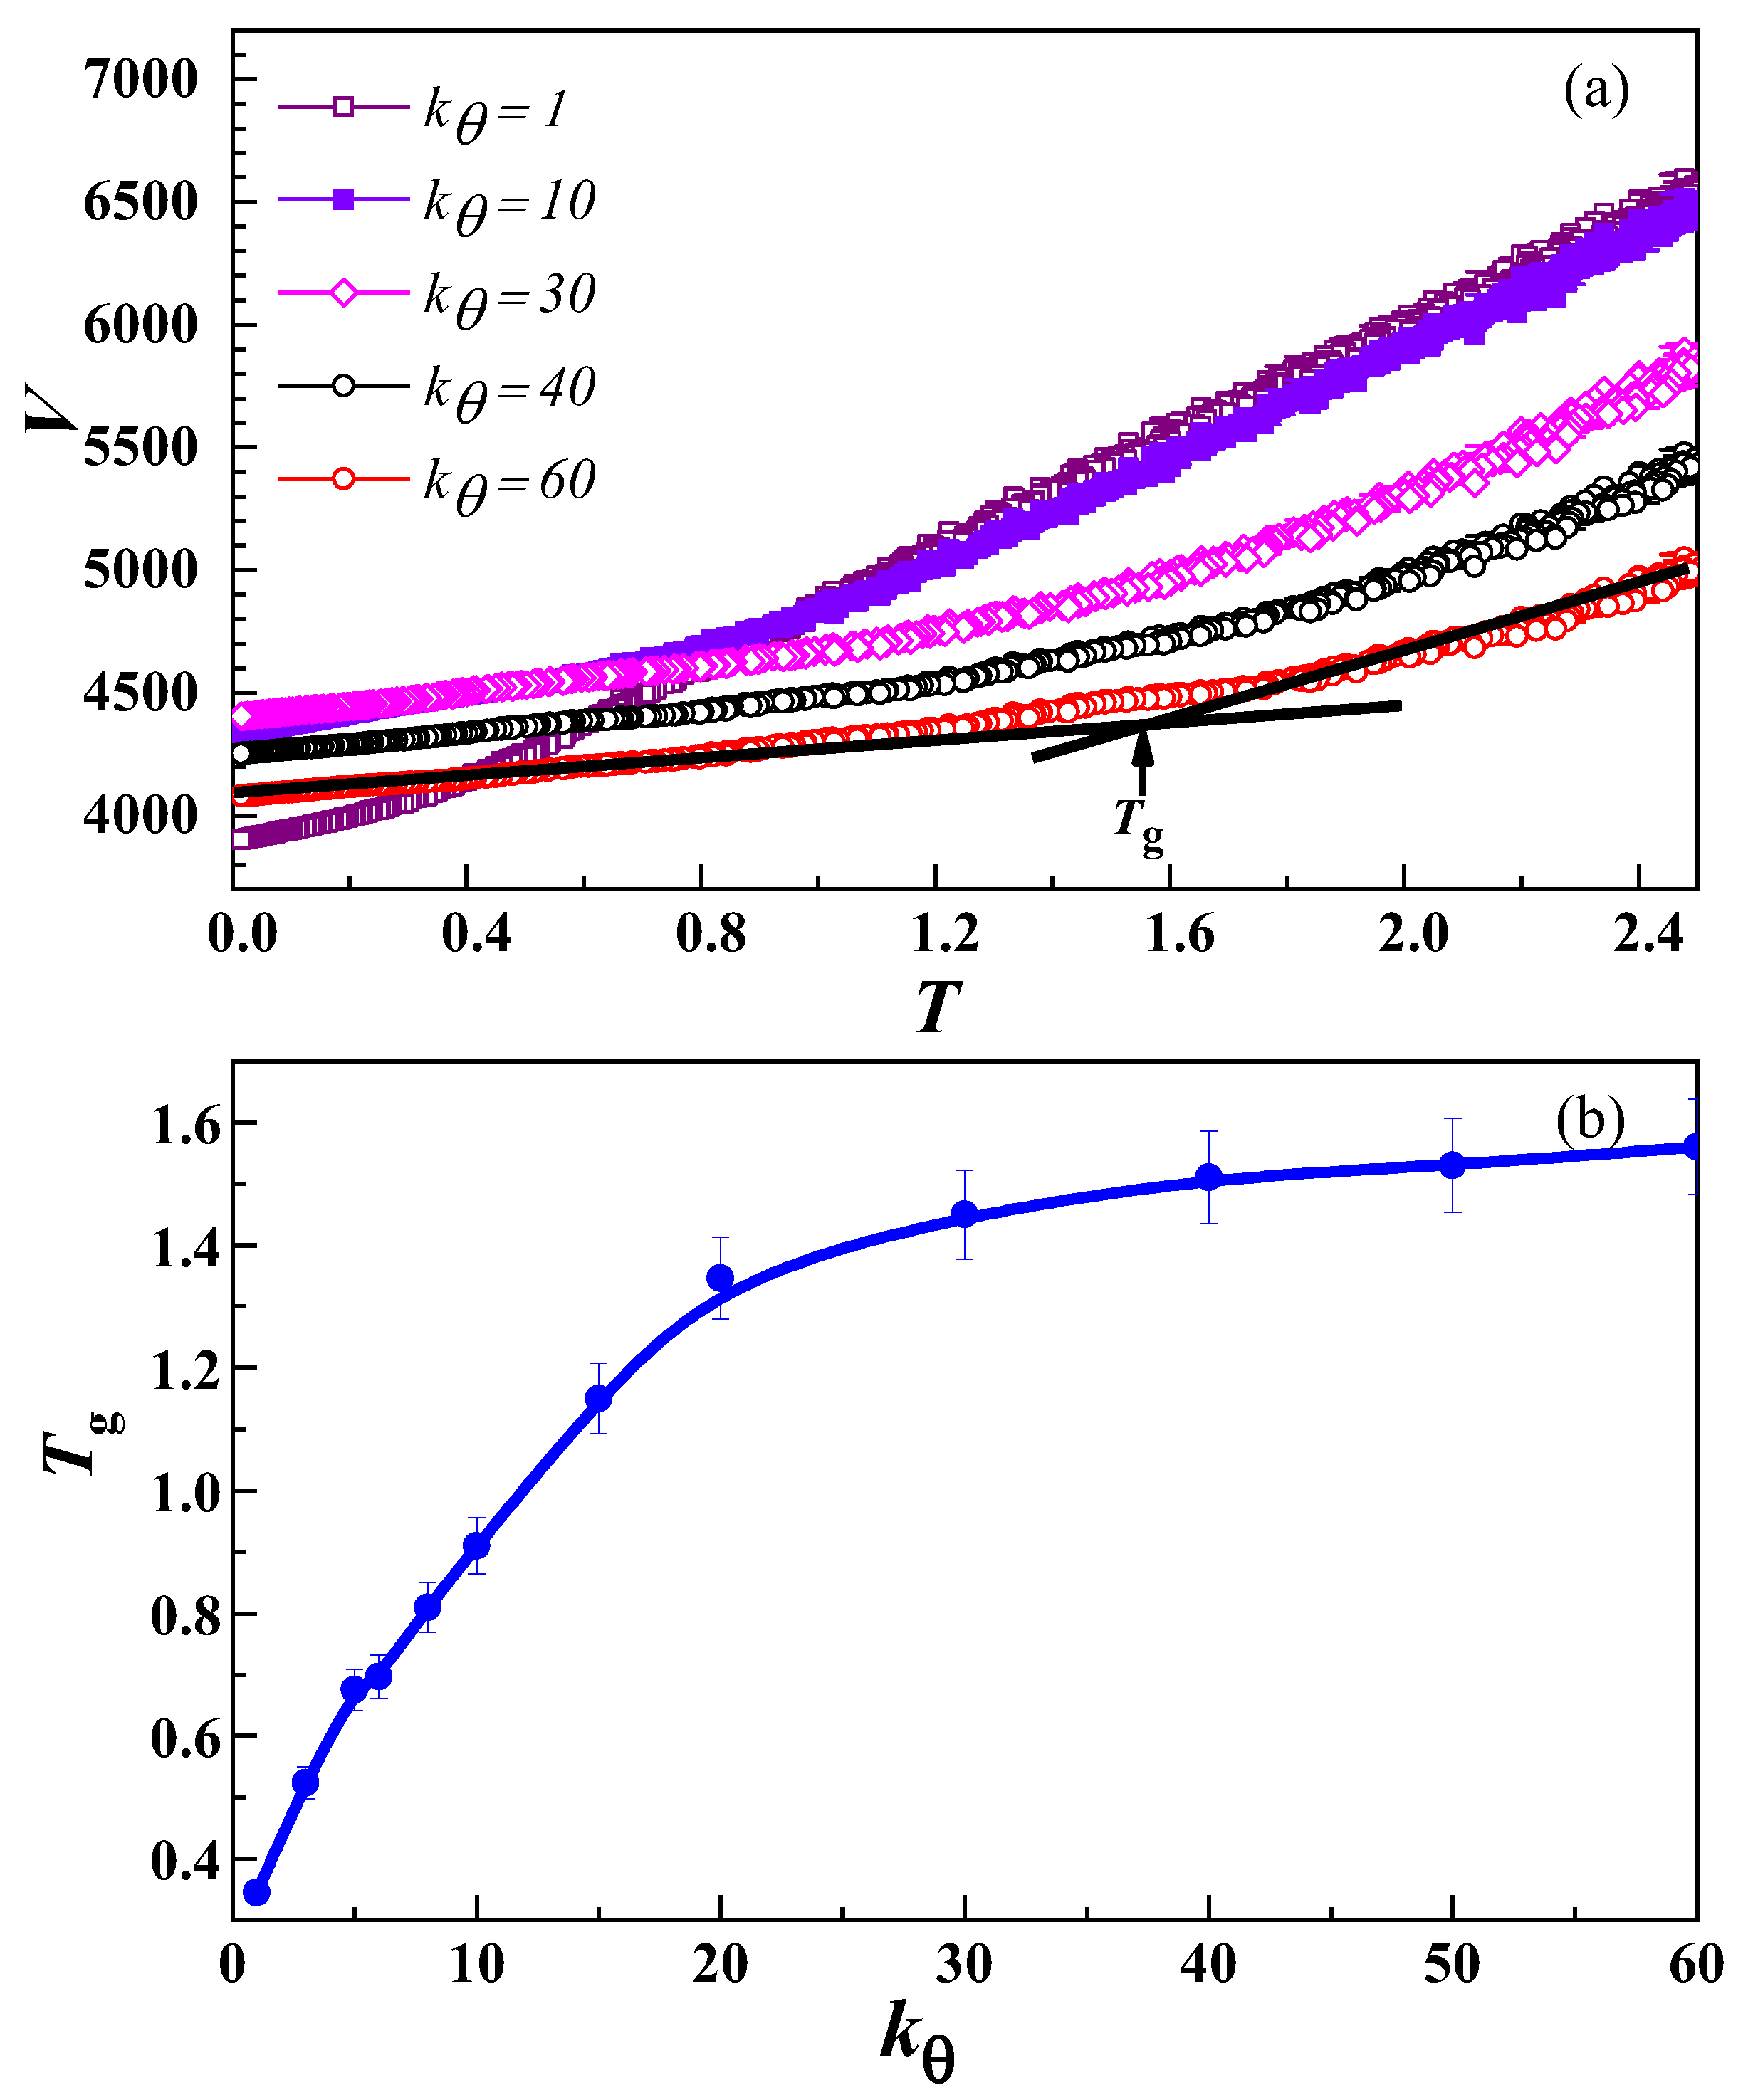
Figure 3a presents the variation of V with T at different values of kθ for various systems containing only polymer chains. For every kθ, the total number of polymer chains, n, is equal to 96, where each chain length, N, is equal to 44. The Tg is defined by the VT curve, i.e., the temperature at which the behaviour of the slope of the curve changes differently. Figure 3a shows that Tg depends on kθ, which is varied from kθ = 1 to kθ = 60 in the current study. At small kθ values, the change in system volume is larger than that at high kθ. This difference is mainly due to the increase in semicrystalline regions with increasing kθ values.
The values of Tg at different kθ are also displayed in Figure 3b. Initially, with the increase in kθ, more amorphous regions turn into ordered states; so, an increasing behaviour of the Tg is noticed, i.e., Tg increases from the lowest value of 0.3 at kθ = 1 up to a higher value of 1.45 at kθ = 20. After that (kθ > 20), the increase in Tg slows down notably until it reaches a maximum value and levels off, indicating that more crystalline regions are already formed.
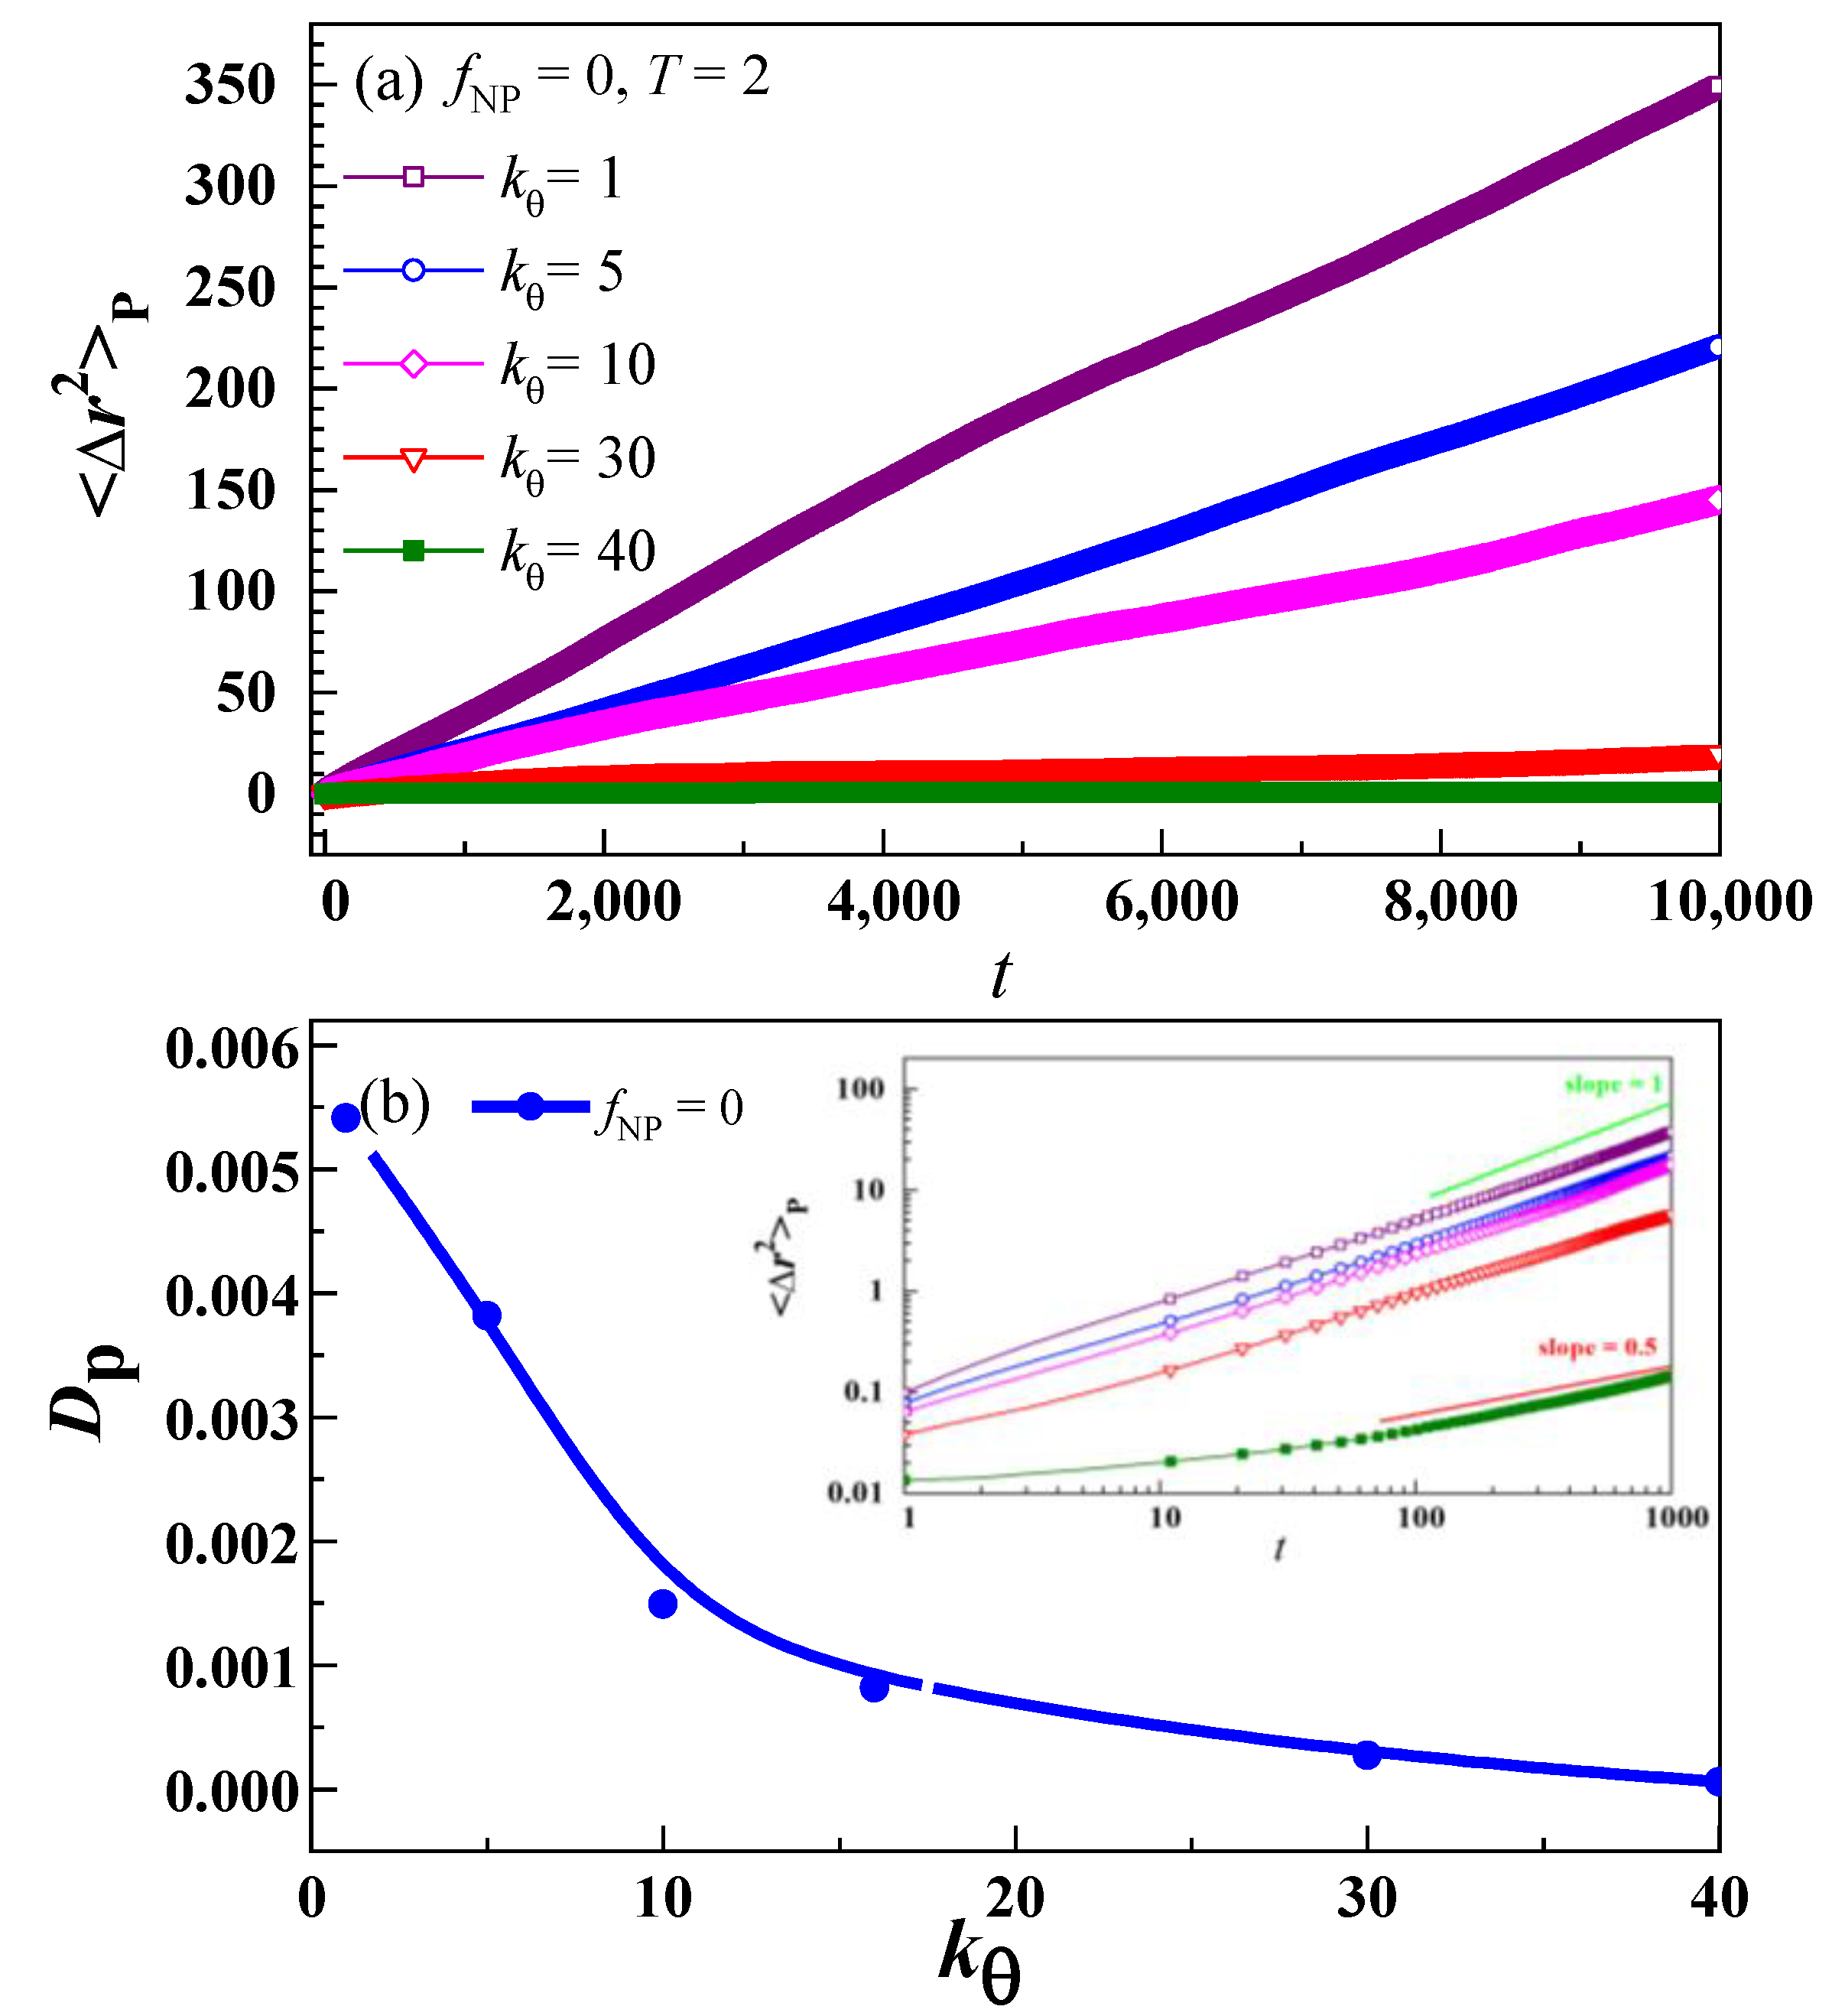
To verify the Tg behaviour with kθ depicted in Figure 3b, we looked into the diffusivity of the polymer at T = 2, which was higher than Tg. The diffusion of Polymer (DP = <Δr2(t)>P/6t) is calculated from the MSD equation Δ r 2 t = r c m t r c m 0 2 . The changes in MSD <Δr2(t)>P in relation to fNP = 0 at different values of kθ are shown in Figure 4a. The MSD <Δr2(t)>P of the polymer increases with time. Although at high stiffness (where the nematic order is high) the chain translation becomes highly anisotropic, but since we are interested in the overall behavior of the pure polymer and PNC system, we will not discuss anisotropic characteristics here [67].
Figure 4b describes the diffusion constant DP behaviour at different kθ values. The variation of DP and Tg are consistent with one another, i.e., as Tg increases at a faster rate, DP decreases at a similar rate and vice versa for the same kθ values. These results indicate that the calculated Tg values of polymer systems are strongly inversely related to the diffusion of polymer. The inset of Figure 4b shows the log–log plot of MSD with time. It is interesting to see that, at lower values of kθ, the slope of MSD curves is around 1 (Einstein diffusion), and at higher values, especially at kθ = 40, the slope is around 0.5 (the prediction of the Rouse model). So, the final normal diffusion of polymer chains is not achieved for large stiffnesses as our simulation time is not long enough [79,80]. It is also interesting to see how the guest NPs interact with the polymer (having different stiffness) and shift the Tg, as no detailed study is available so far regarding this phenomenon. So, we have also studied the effect of NPs on the Tg of PNCs consisting of polymers with variable stiffness.

3.2. Glass Transition in Polymer Nanocomposites

Figure 5a shows the change in system volume V with respect to T at different values of fNP for kθ = 40. It is obvious that the Tg is heavily dependent on fNP. The values of Tg obtained from VT curves at different fNP for kθ = (1, 40) are plotted in Figure 5b.
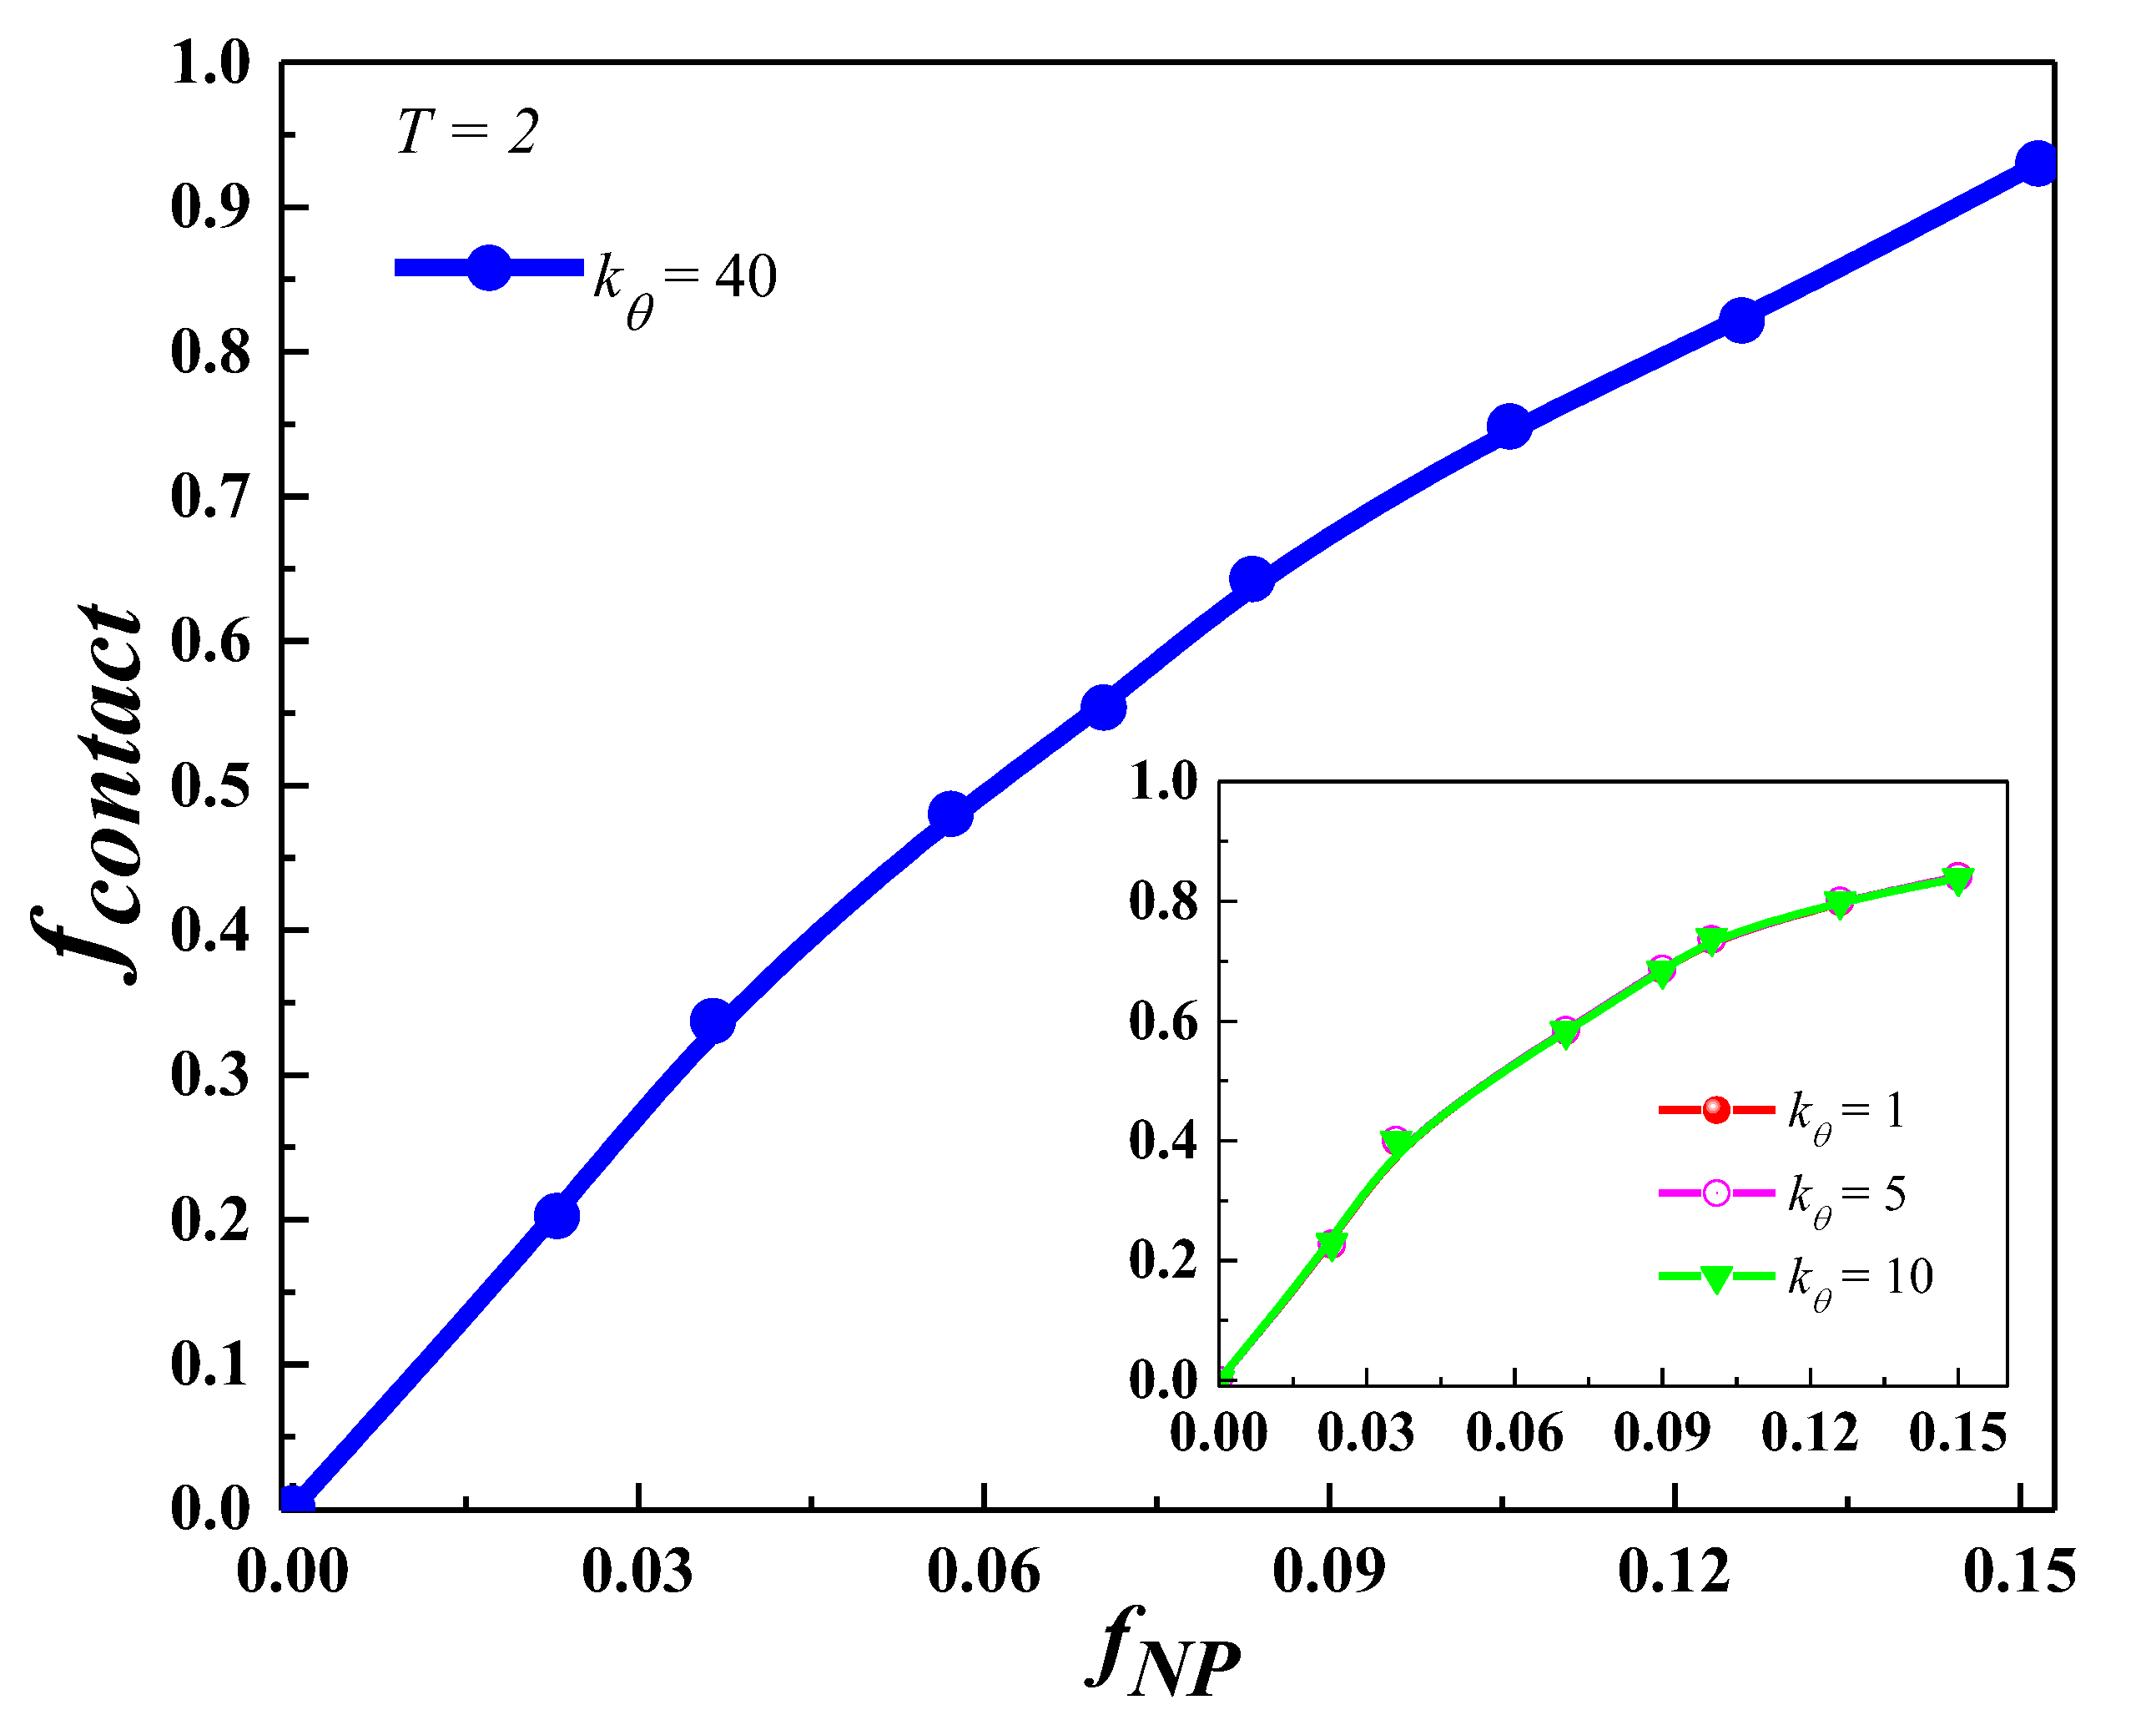
The volume fraction of NPs is varied from fNP = 0 to fNP = 0.15 while keeping other parameters (N, n) intact. A linear decreasing behaviour of Tg is noticed for the kθ = 40 case, which is totally different from Tg behaviour for other kθ values shown in the inset of Figure 5b. Results show a fast increase in Tg at kθ = 1 that is consistent with our recent work [81], a slight increase in Tg at kθ = 5 and a negligible effect of fNP on Tg at kθ = 10. Recently, we showed that the increase in Tg at kθ = 0 is due to the fraction of monomers contacted with NPs at low fNP. So, here it will be interesting to calculate the fraction of monomers contacted with the NPs (fcontact) at different kθ and fNP. Generally, the extent of fcontact is mainly dependent on the type of interaction between polymer monomers and NPs, its strength and the volume fraction of NPs.
Figure 6 shows the variation of fcontact with fNP at kθ = 1, 5, 10, and 40. Here, a monomer is considered as contacted with a NP if the monomer–NP center-to-center distance is less than 0.5σNP + σ = 1.5σ. We noticed that at kθ = 1, 5 and 10, fcontact is almost independent of polymer chain stiffness. However, at kθ = 40, fcontact is slightly higher than at other kθ values.
We have also studied the impact of nanoparticle loading on the mean square end-to-end distance (<R2>) of the polymer at different kθ, as shown in Figure 7. It is noticed that at kθ = 1, there is a small change of about 4% in <R2> when fNP is increased to a maximum value of 0.15. Similarly, at kθ = 5, we see a change of about 12% in <R2>, at kθ = 10 about 30%, and at kθ = 40 just a change of 1.8%. So, we can conclude that the size of very flexible and very stiff polymers is least affected by the presence of nanofillers.
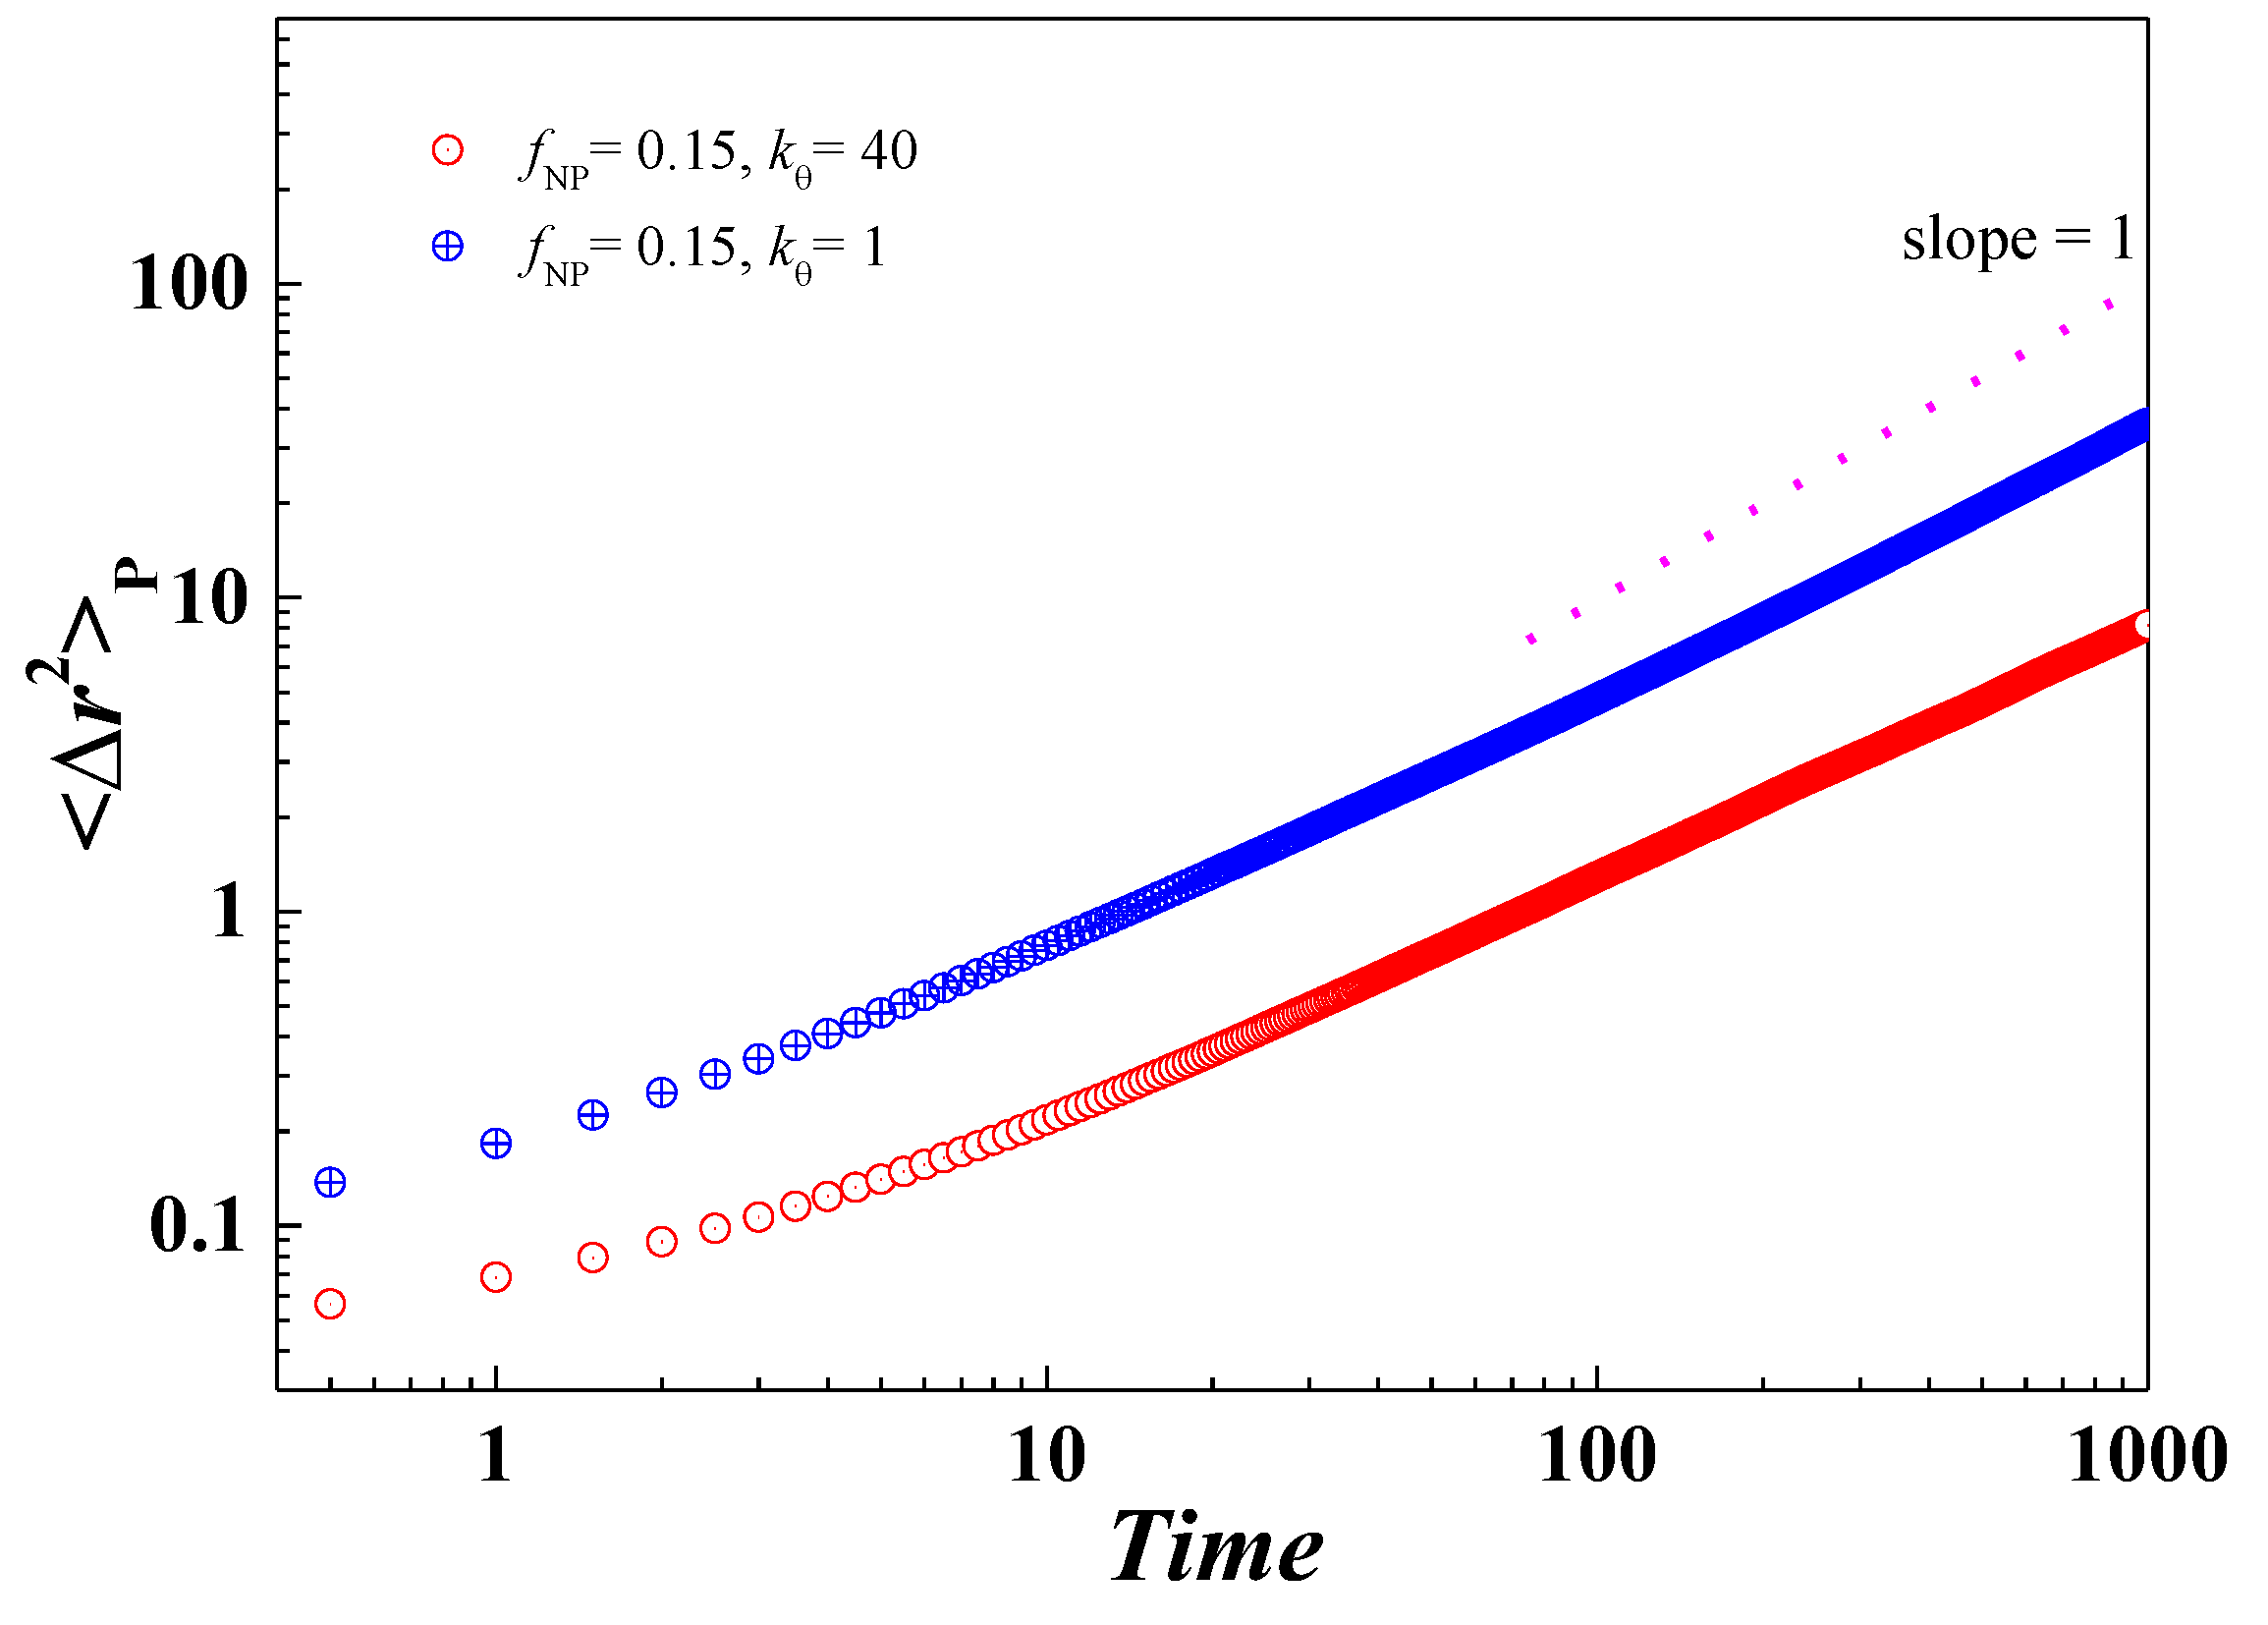
Finally, it is also important to check if there is any change in the diffusion mode of polymers in PNC. For this purpose, we chose a constant volume fraction of NPs (fNP = 0.15) and different values of polymer chain stiffness, i.e., kθ = 1 and kθ = 40, as shown in Figure 8. It is interesting to see that at kθ = 1, the polymer undergoes diffusion close to the normal Einstein diffusion as is also presented for a pure polymer system in Figure 4b. However, we observed a significant change in the case of kθ = 40. For the pure polymer, we revealed diffusion as predicted by the Rouse model, but in the case of nanocomposites, a transformation towards normal Einstein diffusion was observed that is consistent with the Tg behavior.

4. Conclusions

The glass transition temperature of pure polymer and respective nanocomposites consisting of different polymer chain stiffnesses (kθ) and loadings of nanoparticles is investigated in the current study using MD simulation. We revealed that at small kθ, pure polymer systems and polymer nanocomposites (PNCs) exhibit a glass transition at low temperature. For a pure polymer system, Tg initially increases with the increase in kθ, and it does not change obviously at higher values of kθ. However, in the case of PNC, Tg changes differently with the increasing volume fraction of NPs (fNP) at different kθ values. As the fNP is increased, Tg increases rapidly at kθ = 1, slowly at kθ = 5, and changes negligibly at kθ = 10. At large enough kθ, e.g., kθ = 40, it is noticed that Tg decreases with increasing fNP. We have also demonstrated that in the case of polymer nanocomposite, the fraction of monomers contacting with NPs (fcontact) is not affected by the changing polymer chain stiffness. However, NPs obviously affect the mean square end-to-end distance (<R2>) of the polymer at different stiffnesses of polymer chains. Due to the unique behaviors of the PNC systems explored here, our study would be helpful in the development of more stable polymer nanocomposites in the future.

Author Contributions

Conceptualization, R.A.A.K., I.A.Q. and D.H.; Methodology, R.A.A.K., M.L., A.M.A., S.A. and A.Z.; Software, R.A.A.K. and M.L.; Validation, R.A.A.K., I.A.Q. and S.A.; Formal analysis, R.A.A.K., A.M.A., D.H. and A.Z.; Investigation, S.A.; Data curation, I.A.Q.; Writing—original draft, A.M.A.; Writing—review & editing, A.Z.; Supervision, M.L. Funding acquisition and Resources S.A., R.A.A.K. and M.L. All authors have read and agreed to the published version of the manuscript.

Funding

This research was funded by National Natural Science Foundation of China (grant number 11835011 and 11974305), Postdoctoral Fellowship and Startup Grant (grant number ZC304022916) and Abu Dhabi Award for Research Excellence (AARE) 2019 (Project Contract No. AARE19-202).

Data Availability Statement

Data available on request.

Acknowledgments

R.A.A. Khan Acknowledges the Postdoctoral fellowship and startup grant (No. ZC304022916) funded by the Zhejiang Normal University. R.A.A. Khan is very thankful to Gao Xianlong from the Department of Physics, Zhejiang Normal University, for his kind support and help during this research. The authors acknowledge support from the National Natural Science Foundation of China (Grant Nos. 11835011 and 11974305). The authors are also thankful for the support provided by Abu Dhabi Award for Research Excellence (AARE) 2019 (Project Contract No. AARE19-202).

Conflicts of Interest

The authors declare no conflict of interest.

References

  1. Podsiadlo, P.; Kaushik, A.K.; Arruda, E.M.; Waas, A.M.; Shim, B.S.; Xu, J.; Nandivada, H.; Pumplin, B.G.; Lahann, J.; Ramamoorthy, A. Ultrastrong and stiff layered polymer nanocomposites. Science 2007, 318, 80–83. [Google Scholar] [CrossRef]
  2. Yu, B.; Liang, H.; Rumyantsev, A.M.; de Pablo, J.J. Isotropic-to-Nematic Transition in Salt-Free Polyelectrolyte Coacervates from Coarse-Grained Simulations. Macromolecules 2022, 55, 9627–9639. [Google Scholar] [CrossRef]
  3. Tsehay, D.A.; Luo, M. Static and dynamic properties of a semiflexible polymer in a crowded environment with randomly distributed immobile nanoparticles. Phys. Chem. Chem. Phys. 2018, 20, 9582–9590. [Google Scholar] [CrossRef]
  4. Nguyen, H.T.; Smith, T.B.; Hoy, R.S.; Karayiannis, N.C. Effect of chain stiffness on the competition between crystallization and glass-formation in model unentangled polymers. J. Chem. Phys. 2015, 143, 144901. [Google Scholar] [CrossRef] [PubMed] [Green Version]
  5. Cha, C.; Kohman, R.H.; Kong, H. Biodegradable polymer crosslinker: Independent control of stiffness, toughness, and hydrogel degradation rate. Adv. Funct. Mater. 2009, 19, 3056–3062. [Google Scholar] [CrossRef]
  6. Semenov, A.N.; Khokhlov, A.R. Statistical physics of liquid-crystalline polymers. Sov. Phys. Uspekhi 1988, 31, 988. [Google Scholar] [CrossRef]
  7. Chen, Z.Y. Nematic ordering in semiflexible polymer chains. Macromolecules 1993, 26, 3419–3423. [Google Scholar] [CrossRef]
  8. Dijkstra, M.; Frenkel, D. Simulation study of the isotropic-to-nematic transitions of semiflexible polymers. Phys. Rev. E 1995, 51, 5891. [Google Scholar] [CrossRef] [Green Version]
  9. Lai, J.C.; Mei, J.F.; Jia, X.Y.; Li, C.H.; You, X.Z.; Bao, Z. A stiff and healable polymer based on dynamic-covalent boroxine bonds. Adv. Mater. 2016, 28, 8277–8282. [Google Scholar] [CrossRef] [PubMed]
  10. Escobedo, F.A.; de Pablo, J.J. Monte Carlo simulation of athermal mesogenic chains: Pure systems, mixtures, and constrained environments. J. Chem. Phys. 1997, 106, 9858–9868. [Google Scholar] [CrossRef]
  11. Weber, H.; Paul, W.; Binder, K. Monte Carlo simulation of a lyotropic first-order isotropic-nematic phase transition in a lattice polymer model. Phys. Rev. E 1999, 59, 2168. [Google Scholar] [CrossRef]
  12. Egorov, S.A.; Milchev, A.; Virnau, P.; Binder, K. A new insight into the isotropic–nematic phase transition in lyotropic solutions of semiflexible polymers: Density-functional theory tested by molecular dynamics. Soft Matter 2016, 12, 4944–4959. [Google Scholar] [CrossRef] [PubMed]
  13. Milchev, A.; Nikoubashman, A.; Binder, K. The smectic phase in semiflexible polymer materials: A large scale molecular dynamics study. Comput. Mater. Sci. 2019, 166, 230–239. [Google Scholar] [CrossRef] [Green Version]
  14. Biswas, S.; Fukushima, H.; Drzal, L.T. Mechanical and electrical property enhancement in exfoliated graphene nanoplatelet/liquid crystalline polymer nanocomposites. Compos. Part A Appl. Sci. Manuf. 2011, 42, 371–375. [Google Scholar] [CrossRef]
  15. Shakya, A.; King, J.T. DNA local-flexibility-dependent assembly of phase-separated liquid droplets. Biophys. J. 2018, 115, 1840–1847. [Google Scholar] [CrossRef] [Green Version]
  16. Lueckheide, M.; Vieregg, J.R.; Bologna, A.J.; Leon, L.; Tirrell, M.V. Structure–property relationships of oligonucleotide polyelectrolyte complex micelles. Nano Lett. 2018, 18, 7111–7117. [Google Scholar] [CrossRef]
  17. Bunn, C. The melting points of chain polymers. J. Polym. Sci. Part B Polym. Phys. 1996, 34, 799–819. [Google Scholar] [CrossRef]
  18. Dudowicz, J.; Freed, K.F.; Douglas, J.F. The glass transition temperature of polymer melts. J. Phys. Chem. B 2005, 109, 21285–21292. [Google Scholar] [CrossRef]
  19. Winkler, R.G.; Reineker, P.; Harnau, L. Models and equilibrium properties of stiff molecular chains. J. Chem. Phys. 1994, 101, 8119–8129. [Google Scholar] [CrossRef]
  20. Barkema, G.T.; Panja, D.; Van Leeuwen, J. Semiflexible polymer dynamics with a bead-spring model. J. Stat. Mech. Theory Exp. 2014, 2014, P11008. [Google Scholar] [CrossRef] [Green Version]
  21. Aharoni, S.M. Increased glass transition temperature in motionally constrained semicrystalline polymers. Polym. Adv. Technol. 1998, 9, 169–201. [Google Scholar] [CrossRef]
  22. Louzguine-Luzgin, D. Structural changes in metallic glass-forming liquids on cooling and subsequent vitrification in relationship with their properties. Materials 2022, 15, 7285. [Google Scholar] [CrossRef] [PubMed]
  23. Ojovan, M.I.; Louzguine-Luzgin, D.V. On Structural Rearrangements during the Vitrification of Molten Copper. Materials 2022, 15, 1313. [Google Scholar] [CrossRef]
  24. Laudat, J.; Laudat, F. Indications of glass transition in DNA. EPL Europhys. Lett. 1992, 20, 663. [Google Scholar] [CrossRef]
  25. Ringe, D.; Petsko, G.A. The ‘glass transition’in protein dynamics: What it is, why it occurs, and how to exploit it. Biophys. Chem. 2003, 105, 667–680. [Google Scholar] [CrossRef] [PubMed]
  26. Xie, Y.; Yang, H.; Yu, H.; Shi, Q.; Wang, X.; Chen, J. Excluded volume effect on confined polymer translocation through a short nanochannel. J. Chem. Phys. 2006, 124, 174906. [Google Scholar] [CrossRef] [Green Version]
  27. Hsu, H.-P.; Kremer, K. Static and dynamic properties of large polymer melts in equilibrium. J. Chem. Phys. 2016, 144, 154907. [Google Scholar] [CrossRef] [Green Version]
  28. Guigas, G.; Weiss, M. Sampling the cell with anomalous diffusion—The discovery of slowness. Biophys. J. 2008, 94, 90–94. [Google Scholar] [CrossRef] [PubMed] [Green Version]
  29. Weiss, M.; Elsner, M.; Kartberg, F.; Nilsson, T. Anomalous subdiffusion is a measure for cytoplasmic crowding in living cells. Biophys. J. 2004, 87, 3518–3524. [Google Scholar] [CrossRef] [Green Version]
  30. Banks, D.S.; Fradin, C. Anomalous diffusion of proteins due to molecular crowding. Biophys. J. 2005, 89, 2960–2971. [Google Scholar] [CrossRef] [Green Version]
  31. Saxton, M.J. A biological interpretation of transient anomalous subdiffusion. I. Qualitative model. Biophys. J. 2007, 92, 1178–1191. [Google Scholar] [CrossRef] [Green Version]
  32. Jeon, J.-H.; Tejedor, V.; Burov, S.; Barkai, E.; Selhuber-Unkel, C.; Berg-Sørensen, K.; Oddershede, L.; Metzler, R. In vivo anomalous diffusion and weak ergodicity breaking of lipid granules. Phys. Rev. Lett. 2011, 106, 048103. [Google Scholar] [CrossRef] [Green Version]
  33. Barkai, E.; Garini, Y.; Metzler, R. Strange kinetics of single molecules in living cells. Phys. Today 2012, 65, 29. [Google Scholar] [CrossRef] [Green Version]
  34. Höfling, F.; Franosch, T. Anomalous transport in the crowded world of biological cells. Rep. Prog. Phys. 2013, 76, 046602. [Google Scholar] [CrossRef] [PubMed] [Green Version]
  35. Lampo, T.J.; Stylianidou, S.; Backlund, M.P.; Wiggins, P.A.; Spakowitz, A.J. Cytoplasmic RNA-protein particles exhibit non-Gaussian subdiffusive behavior. Biophys. J. 2017, 112, 532–542. [Google Scholar] [CrossRef] [PubMed] [Green Version]
  36. Goychuk, I.; Pöschel, T. Fingerprints of viscoelastic subdiffusion in random environments: Revisiting some experimental data and their interpretations. Phys. Rev. E 2021, 104, 034125. [Google Scholar] [CrossRef]
  37. Baez, W.D.; Wiese, K.J.; Bundschuh, R. Behavior of random RNA secondary structures near the glass transition. Phys. Rev. E 2019, 99, 022415. [Google Scholar] [CrossRef] [PubMed] [Green Version]
  38. Hui, S.; Tang, L.-H. Ground state and glass transition of the RNA secondary structure. Eur. Phys. J. B-Condens. Matter Complex Syst. 2006, 53, 77–84. [Google Scholar] [CrossRef] [Green Version]
  39. Frank, A.T.; Zhang, Q.; Al-Hashimi, H.M.; Andricioaei, I. Slowdown of interhelical motions induces a glass transition in RNA. Biophys. J. 2015, 108, 2876–2885. [Google Scholar] [CrossRef] [Green Version]
  40. Doster, W. The protein-solvent glass transition. Biochim. Biophys. Acta (BBA)-Proteins Proteom. 2010, 1804, 3–14. [Google Scholar] [CrossRef]
  41. Norberg, J.; Nilsson, L. Glass transition in DNA from molecular dynamics simulations. Proc. Natl. Acad. Sci. USA 1996, 93, 10173–10176. [Google Scholar] [CrossRef] [PubMed] [Green Version]
  42. Tsereteli, G.; Belopolskaya, T.; Grunina, N.; Vaveliouk, O. Calorimetric study of the glass transition process in humid proteins and DNA. J. Therm. Anal. Calorim. 2000, 62, 89–99. [Google Scholar] [CrossRef]
  43. Kumar, P.; Yan, Z.; Xu, L.; Mazza, M.G.; Buldyrev, S.; Chen, S.-H.; Sastry, S.; Stanley, H. Glass transition in biomolecules and the liquid-liquid critical point of water. Phys. Rev. Lett. 2006, 97, 177802. [Google Scholar] [CrossRef] [PubMed] [Green Version]
  44. Zhu, J.; Uhl, F.M.; Morgan, A.B.; Wilkie, C.A. Studies on the mechanism by which the formation of nanocomposites enhances thermal stability. Chem. Mater. 2001, 13, 4649–4654. [Google Scholar] [CrossRef]
  45. Lee, J.Y.; Buxton, G.A.; Balazs, A.C. Using nanoparticles to create self-healing composites. J. Chem. Phys. 2004, 121, 5531–5540. [Google Scholar] [CrossRef]
  46. Bockstaller, M.R.; Mickiewicz, R.A.; Thomas, E.L. Block copolymer nanocomposites: Perspectives for tailored functional materials. Adv. Mater. 2005, 17, 1331–1349. [Google Scholar] [CrossRef]
  47. Rittigstein, P.; Torkelson, J.M. Polymer–nanoparticle interfacial interactions in polymer nanocomposites: Confinement effects on glass transition temperature and suppression of physical aging. J. Polym. Sci. Part B Polym. Phys. 2006, 44, 2935–2943. [Google Scholar] [CrossRef]
  48. White, S.I.; Mutiso, R.M.; Vora, P.M.; Jahnke, D.; Hsu, S.; Kikkawa, J.M.; Li, J.; Fischer, J.E.; Winey, K.I. Electrical percolation behavior in silver nanowire–polystyrene composites: Simulation and experiment. Adv. Funct. Mater. 2010, 20, 2709–2716. [Google Scholar] [CrossRef]
  49. Kumar, S.K.; Krishnamoorti, R. Nanocomposites: Structure, phase behavior, and properties. Annu. Rev. Chem. Biomol. Eng. 2010, 1, 37–58. [Google Scholar] [CrossRef] [Green Version]
  50. Suzuki, N.; Zakaria, M.B.; Chiang, Y.-D.; Wu, K.C.-W.; Yamauchi, Y. Thermally stable polymer composites with improved transparency by using colloidal mesoporous silica nanoparticles as inorganic fillers. Phys. Chem. Chem. Phys. 2012, 14, 7427–7432. [Google Scholar] [CrossRef]
  51. Qi, X.; Tan, C.; Wei, J.; Zhang, H. Synthesis of graphene–conjugated polymer nanocomposites for electronic device applications. Nanoscale 2013, 5, 1440–1451. [Google Scholar] [CrossRef] [PubMed]
  52. Burgos-Marmol, J.J.; Patti, A. Unveiling the impact of nanoparticle size dispersity on the behavior of polymer nanocomposites. Polymer 2017, 113, 92–104. [Google Scholar] [CrossRef] [Green Version]
  53. Al-Shamari, A.; Abdelghany, A.; Alnattar, H.; Oraby, A. Structural and optical properties of PEO/CMC polymer blend modified with gold nanoparticles synthesized by laser ablation in water. J. Mater. Res. Technol. 2021, 12, 1597–1605. [Google Scholar] [CrossRef]
  54. Ming, Y.; Zhou, Z.; Hao, T.; Nie, Y. Polymer Nanocomposites: Role of modified filler content and interfacial interaction on crystallization. Eur. Polym. J. 2022, 162, 110894. [Google Scholar] [CrossRef]
  55. Wang, Y.-H.; Wang, W.-H.; Zhang, Z.; Xu, L.; Li, P. Study of the glass transition temperature and the mechanical properties of PET/modified silica nanocomposite by molecular dynamics simulation. Eur. Polym. J. 2016, 75, 36–45. [Google Scholar] [CrossRef]
  56. Hu, X.; Zhang, W.; Si, M.; Gelfer, M.; Hsiao, B.; Rafailovich, M.; Sokolov, J.; Zaitsev, V.; Schwarz, S. Dynamics of polymers in organosilicate nanocomposites. Macromolecules 2003, 36, 823–829. [Google Scholar] [CrossRef]
  57. Desai, T.; Keblinski, P.; Kumar, S.K. Molecular dynamics simulations of polymer transport in nanocomposites. J. Chem. Phys. 2005, 122, 134910. [Google Scholar] [CrossRef]
  58. Lin, C.-C.; Gam, S.; Meth, J.S.; Clarke, N.; Winey, K.I.; Composto, R.J. Do attractive polymer–nanoparticle interactions retard polymer diffusion in nanocomposites? Macromolecules 2013, 46, 4502–4509. [Google Scholar] [CrossRef]
  59. Tung, W.-S.; Bird, V.; Composto, R.J.; Clarke, N.; Winey, K.I. Polymer chain conformations in CNT/PS nanocomposites from small angle neutron scattering. Macromolecules 2013, 46, 5345–5354. [Google Scholar] [CrossRef]
  60. Li, C.-Y.; Luo, M.-B.; Huang, J.-H.; Li, H. Equilibrium and dynamical properties of polymer chains in random medium filled with randomly distributed nano-sized fillers. Phys. Chem. Chem. Phys. 2015, 17, 31877–31886. [Google Scholar] [CrossRef]
  61. Huang, X.-W.; Peng, Y.; Huang, J.-H.; Luo, M.-B. A study on the diffusivity of polymers in crowded environments with periodically distributed nanoparticles. Phys. Chem. Chem. Phys. 2017, 19, 29975–29983. [Google Scholar] [CrossRef] [PubMed]
  62. Peng, Y.; Zhang, H.; Huang, X.-W.; Huang, J.-H.; Luo, M.-B. Monte Carlo simulation on the dynamics of a semi-flexible polymer in the presence of nanoparticles. Phys. Chem. Chem. Phys. 2018, 20, 26333–26343. [Google Scholar] [CrossRef] [PubMed]
  63. Zhang, X.; Wei, W.; Jin, X.; Xiong, H. Chain Dimension and Dynamics of Polymers in Well-Defined Non-sticky Nanocomposites of Molecular Nanoparticle Polyhedral Oligomeric Silsesquioxane/Poly (butylene oxide). Macromolecules 2020, 53, 5627–5637. [Google Scholar] [CrossRef]
  64. Khan, R.A.A.; Qi, H.-K.; Huang, J.-H.; Luo, M.-B. A simulation study on the effect of nanoparticle size on the glass transition temperature of polymer nanocomposites. Soft Matter 2021, 17, 8095–8104. [Google Scholar] [CrossRef]
  65. Khan, R.A.A.; Zulfqar, A.; Mateen, M.; Hussain, M.; Rasool, R.T.; Ashraf, G.A.; Xianlong, G. Improvement of the glass transition temperature in novel molybdenum carbide doped polyaniline nanocomposites. Ceram. Int. 2023; in press. [Google Scholar] [CrossRef]
  66. Iyer, P.; Coleman, M.R. Thermal and mechanical properties of blended polyimide and amine-functionalized poly (orthosiloxane) composites. J. Appl. Polym. Sci. 2008, 108, 2691–2699. [Google Scholar] [CrossRef]
  67. Ndoro, T.V.; Böhm, M.C.; Müller-Plathe, F. Interface and interphase dynamics of polystyrene chains near grafted and ungrafted silica nanoparticles. Macromolecules 2012, 45, 171–179. [Google Scholar] [CrossRef]
  68. Bulacu, M.; van der Giessen, E. Molecular-dynamics simulation study of the glass transition in amorphous polymers with controlled chain stiffness. Phys. Rev. E 2007, 76, 011807. [Google Scholar] [CrossRef] [Green Version]
  69. Weeks, J.D.; Chandler, D.; Andersen, H.C. Role of repulsive forces in determining the equilibrium structure of simple liquids. J. Chem. Phys. 1971, 54, 5237–5247. [Google Scholar] [CrossRef]
  70. Bulacu, M.; van der Giessen, E. Effect of bending and torsion rigidity on self-diffusion in polymer melts: A molecular-dynamics study. J. Chem. Phys. 2005, 123, 114901. [Google Scholar] [CrossRef] [Green Version]
  71. Gersappe, D. Molecular mechanisms of failure in polymer nanocomposites. Phys. Rev. Lett. 2002, 89, 058301. [Google Scholar] [CrossRef] [PubMed]
  72. Plimpton, S. Fast parallel algorithms for short-range molecular dynamics. J. Comput. Phys. 1995, 117, 1–19. [Google Scholar] [CrossRef] [Green Version]
  73. Cheng, S.; Xie, S.-J.; Carrillo, J.-M.Y.; Carroll, B.; Martin, H.; Cao, P.-F.; Dadmun, M.D.; Sumpter, B.G.; Novikov, V.N.; Schweizer, K.S. Big effect of small nanoparticles: A shift in paradigm for polymer nanocomposites. ACS Nano 2017, 11, 752–759. [Google Scholar] [CrossRef] [PubMed]
  74. Sorichetti, V.; Hugouvieux, V.; Kob, W. Structure and dynamics of a polymer–nanoparticle composite: Effect of nanoparticle size and volume fraction. Macromolecules 2018, 51, 5375–5391. [Google Scholar] [CrossRef]
  75. Li, M.; Liu, X.; Qin, J.; Gu, Y. Molecular dynamics simulation on glass transition temperature of isomeric polyimide. Express Polym. Lett. 2009, 3, 665–675. [Google Scholar] [CrossRef]
  76. Burgos-Mármol, J.J.; Álvarez-Machancoses, O.S.; Patti, A. Modeling the effect of polymer chain stiffness on the behavior of polymer nanocomposites. J. Phys. Chem. B 2017, 121, 6245–6256. [Google Scholar] [CrossRef] [Green Version]
  77. Martínez-Fernández, D.; Herranz, M.; Foteinopoulou, K.; Karayiannis, N.C.; Laso, M. Local and Global Order in Dense Packings of Semi-flexible Polymers of Hard Spheres. Polymers 2023, 15, 551. [Google Scholar] [CrossRef]
  78. Milchev, A.; Egorov, S.A.; Midya, J.; Binder, K.; Nikoubashman, A. Blends of Semiflexible Polymers: Interplay of Nematic Order and Phase Separation. Polymers 2021, 13, 2270. [Google Scholar] [CrossRef]
  79. Eslami, H.; Muller-Plathe, F. How thick is the interphase in an ultrathin polymer film? Coarse-grained molecular dynamics simulations of polyamide-6, 6 on graphene. J. Phys. Chem. C 2013, 117, 5249–5257. [Google Scholar] [CrossRef]
  80. Eslami, H.; Rahimi, M.; Müller-Plathe, F. Molecular dynamics simulation of a silica nanoparticle in oligomeric poly (methyl methacrylate): A model system for studying the interphase thickness in a polymer–nanocomposite via different properties. Macromolecules 2013, 46, 8680–8692. [Google Scholar] [CrossRef]
  81. Khan, R.A.A.; Chen, X.; Qi, H.-K.; Huang, J.-H.; Luo, M.-B. A novel shift in the glass transition temperature of polymer nanocomposites: A molecular dynamics simulation study. Phys. Chem. Chem. Phys. 2021, 23, 12216–12225. [Google Scholar] [CrossRef] [PubMed]
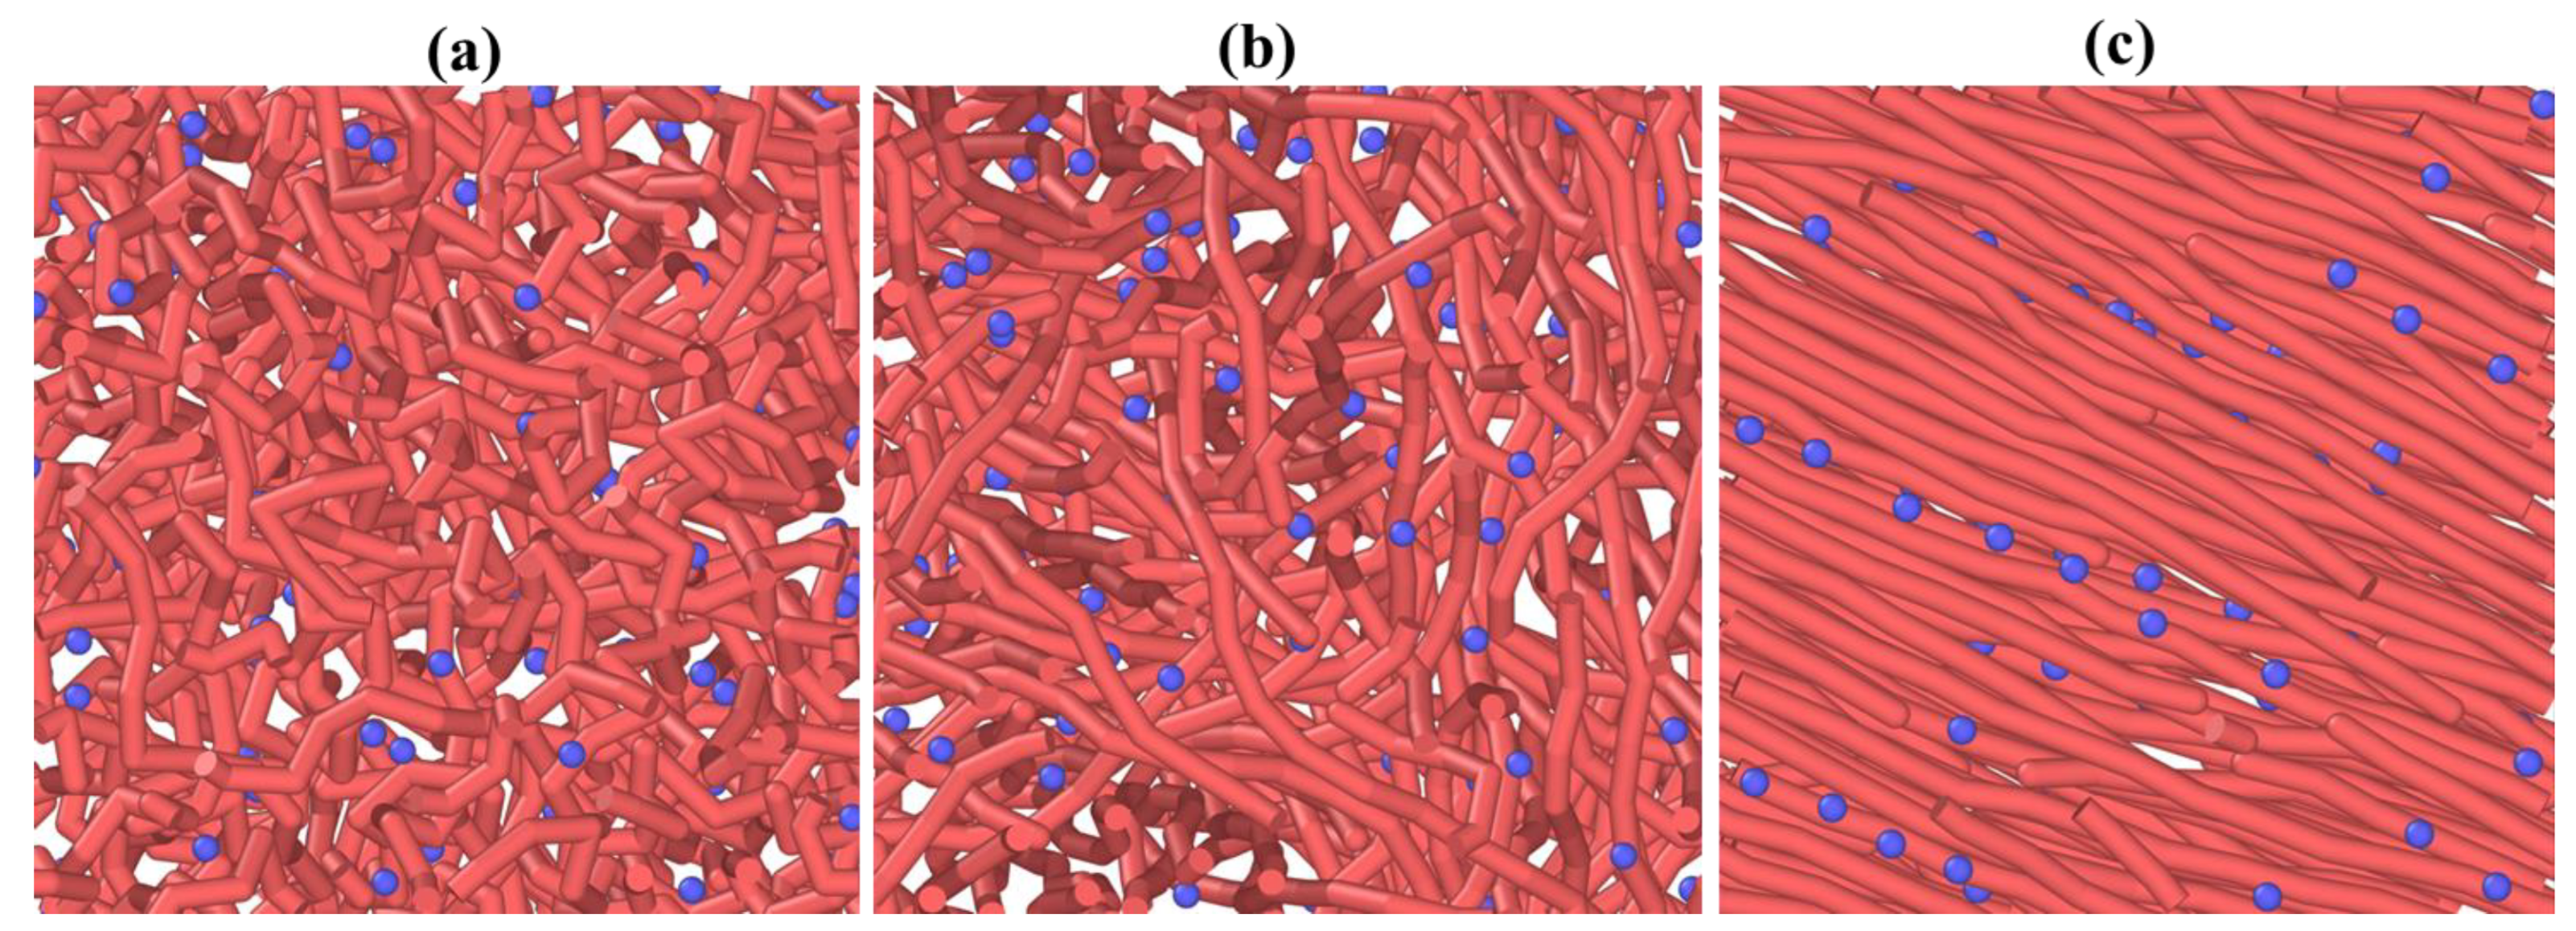
Figure 1. A 2D representation of systems consisting of polymer chains and NPs (a) kθ = 1, (b) kθ = 10, and (c) kθ = 40 at fNP = 0.06. Blue beads are NPs while worm-like radish structures represent the polymer chains.
Nanomaterials 13 01896 g001
Figure 2. The nematic order parameter ( S 2 ) versus kθ plot at fNP = 0. The transition from the amorphous state to a highly ordered semicrystalline state is obvious.
Nanomaterials 13 01896 g002
Figure 3. (a) The plot of volume of the system V against temperature T for different values of chain stiffness kθ at fNP = 0. (b) The corresponding variation of the glass transition temperature Tg versus kθ.
Nanomaterials 13 01896 g003
Figure 4. (a) Plot of the mean square displacement of the polymer <Δr2>P as a function of time at different values of kθ at fNP = 0 and T = 2. (b) the overall dependence of diffusion constant DP on kθ. The inset presents the slope varying from 0.5 (Rouse model prediction) to 1 (Einstein diffusion).
Nanomaterials 13 01896 g004
Figure 5. (a) At kθ = 40, system volume V variations with temperature T for different fNP. (b) The variation of Tg with fNP at kθ = 40. The inset shows the variation of Tg with fNP at kθ = 1, 5 and 10, respectively.
Nanomaterials 13 01896 g005
Figure 6. Plot of the fraction of monomers contacted with nanoparticles fcontact with fNP at kθ = 40. The inset shows the same with kθ = 1, 5 and 10 at T = 2.
Nanomaterials 13 01896 g006
Figure 7. The variation of mean square end-to-end distance (<R2>) with fNP at kθ = 40. The inset shows the dependence of <R2> with fNP at other values of kθ, i.e., kθ = 1, 5 and 10 at T = 2.
Nanomaterials 13 01896 g007
Figure 8. The log–log plot of the mean square displacement of the polymer in nanocomposite (fNP = 0.15) as a function of time at kθ = 1 and kθ = 40.
Nanomaterials 13 01896 g008
Disclaimer/Publisher’s Note: The statements, opinions and data contained in all publications are solely those of the individual author(s) and contributor(s) and not of MDPI and/or the editor(s). MDPI and/or the editor(s) disclaim responsibility for any injury to people or property resulting from any ideas, methods, instructions or products referred to in the content.