Article

Electrochemical Sensor Based on ZnFe2O4/RGO Nanocomposite for Ultrasensitive Detection of Hydrazine in Real Samples

by
Somayeh Tajik
1,
Mohammad Bagher Askari
2,
Sayed Ali Ahmadi
3,
Fraiba Garkani Nejad
4,
Zahra Dourandish
4,
Razieh Razavi
5,
Hadi Beitollahi
2,* and
Antonio Di Bartolomeo
6,*
1
Research Center of Tropical and Infectious Diseases, Kerman University of Medical Sciences, Kerman P.O. Box 76169-13555, Iran
2
Environment Department, Institute of Science and High Technology and Environmental Sciences, Graduate University of Advanced Technology, Kerman P.O. Box 76318-85356, Iran
3
Department of Chemistry, Kerman Branch, Islamic Azad University, Kerman P.O. Box 763151-31167, Iran
4
Department of Chemistry, Faculty of Science, Shahid Bahonar University of Kerman, Kerman P.O. Box 76169-13439, Iran
5
Department of Chemistry, Faculty of Science, University of Jiroft, Jiroft P.O. Box 78671-55311, Iran
6
Department of Physics “E.R. Caianaiello”, University of Salerno, 84084 Fisciano, Italy
*
Authors to whom correspondence should be addressed.
Nanomaterials 2022, 12(3), 491; https://doi.org/10.3390/nano12030491
Submission received: 25 December 2021 / Revised: 26 January 2022 / Accepted: 28 January 2022 / Published: 29 January 2022

Abstract

:
We have developed a highly sensitive sensor of ZnFe2O4/reduced graphene oxide (ZnFe2O4/RGO) nanocomposite for electrochemical detection of hydrazine, fabricated by a simple hydrothermal protocol. Subsequently, a screen-printed electrode (SPE) surface was modified with the proposed nanocomposite (ZnFe2O4/RGO/SPE), and revealed an admirable electrocatalytic capacity for hydrazine oxidation. The ZnFe2O4/RGO/SPE sensor could selectively determine micromolar hydrazine concentrations. The as-produced sensor demonstrated excellent ability to detect hydrazine due to the synergistic impacts of the unique electrocatalytic capacity of ZnFe2O4 plus the potent physicochemical features of RGO such as manifold catalytic sites, great area-normalized edge-plane structures, high conductivity, and large surface area. The hydrazine detection using differential pulse voltammetry exhibited a broad linear dynamic range (0.03–610.0 µM) with a low limit of detection (0.01 µM).

1. Introduction

Hydrazine (N2H4) is an agent with broad-spectrum applications such as reducing agents, emulsifiers, catalysts, antioxidants, and corrosion inhibitors, and as precursors to produce various explosives, dyestuffs, pesticides, herbicides, insecticides, and pharmaceutical derivatives. On the other hand, the excessive use of this agent can generate toxicity and irreversible cell damage, and develop complications such as brain and liver dysfunction, DNA damage, blood abnormalities, and irreversible neuronal deterioration. According to the Occupational Safety and Health Administration (OSHA) and the National Institute for Occupational Safety and Health (NIOSH), the hydrazine density in the air of the workplace should not exceed 0.03 mg/mL for 1 h exposure [1,2,3]. Accordingly, the hydrazine content needs to be accurately determined in clinical samples and in a cost-effective manner.
The hydrazine content has been previously detected by different techniques, including spectrophotometry [4], chemiluminescence [5] and gas chromatography [6]. Such techniques involve complex processes with relatively narrow linear ranges and low accuracy. Electrochemical methods are fast, highly sensitive, selective, cost-effective and enable portable devices [7,8,9,10,11,12,13,14]. Hence, we select these methods for hydrazine detection in the present study.
Nevertheless, the kinetics indicate that the electrochemical hydrazine oxidation is slow, and unmodified electrodes need fairly high overpotentials [15,16,17]. Various techniques have been applied in the attempt to minimize the problem of high overpotentials. Over the past two decades, many efforts have been made to further control the chemical behavior of electrodes through chemical modified electrodes (CMEs). An ideal CME should be reportedly produced according to three main factors, including admirable current response to target molecules, simple and cost-effective fabrication process, and high selectivity, sensitivity, and stability [18,19,20,21,22,23,24,25].
Screen printing is a method widely used for microelectronics to construct various electrochemically disposable sensing electrodes. Screen-printed electrodes (SPEs) are versatile, cost-effective, and simple analytical tools, suitable for miniaturization and useful for chemical electroanalysis [26,27,28,29,30]. Electrode surface modification has been recently performed for detection of target molecules using various nanomaterials. The modification of the SPE surface has been carried out exploiting different nanomaterials to promote the electrochemical behaviors [31,32,33,34,35].
Further attention has been given to the spinel ferrites (with a general molecular formula of MFe2O4, M=Co, Ni, Zn and Cd) owing to their strong physical, catalytic, chemical and magnetic activities. The synergistic impact of Fe and Zn in zinc ferrite (ZnFe2O4) enhances the redox process in electrochemistry, making ZnFe2O4 suitable for use in different devices such as solar cells, batteries and electrochemical sensors. ZnFe2O4 has high availability, low price, lower toxicity, green application, potent electrochemical response, and large surface area [36,37,38,39,40]. Moreover, incorporation of ZnFe2O4 in conductive carbon-based materials, such as reduced graphene oxide, is a way to reach an excellent electrochemical response. This nanostructure has also been used in various fields such as sensing, due to its unique properties such as large surface area, electron mobility at ambient temperature, admirable electrical conductivity, flexibility, and strong mechanical features [41,42,43,44,45].
The present work aimed to fabricate ZnFe2O4/RGO nanocomposite through a facile hydrothermal protocol to detect hydrazine ultra-sensitively in the water specimens. The synergic impact of metal nanoparticles plus graphene was expected to be effective in ZnFe2O4/RGO nanocomposite. The SPEs were selected to fabricate working electrodes owing to cost-effectiveness, reproducibility, simple production process, and flexibility. The proposed ZnFe2O4/RGO/SPE sensor was examined as well for its applicability to detect the hydrazine in the water specimens.

2. Materials and Methods

2.1. Chemicals and Equipment

The electrochemical measurements were performed by a PGSTAT 302N Autolab potentiostat/galvanostat analyzer (Eco-Chemie, Utrecht, The Netherlands). All test conditions were monitored by General Purpose Electrochemical System (GPES) software. A three-part DropSens SPE (DRP-110, Metrohm DropSens, Oviedo, Spain) included a graphite working electrode, a silver pseudo-reference electrode, and a graphite auxiliary electrode. The solution pH values were measured by a Metrohm 710 pH meter. X-ray diffraction analyses were performed with a Thermo Scientific device (ARL EQUINOX 3000, (Thermo, Waltham, MA, USA)). FE-SEM images were obtained using a Hitachi Model S-3700N (Hitachi, Tokyo, Japan). The TEM images were obtained using a Phillips EM 2085 machine (Philips, Amsterdam, The Netherlands).
All reagents possessed analytical grade and were from Merck (Darmstadt, Germany). Orthophosphoric acid and related salts were utilized to prepare all buffer solutions at the pH values (2.0 to 9.0).

2.2. Fabrication of ZnFe2O4/RGO Nanocomposite

The GO synthesis was performed by the modified Hummers’ method. Initially, ZnFe2(C2O4)3 was produced to fabricate ZnFe2O4 nanorods via a hydrothermal method. Thus, FeSO4·7H2O (0.556 g) and ZnSO4·7H2O (0.288 g) were dissolved in deionized water (15 mL) while stirring on a magnetic stirrer, followed by adding ethylene glycol (45 mL) containing H2C2O4 (3 mM). The obtained mixture was stirred for 10 min to give a yellow solution. Then, the resulting solution was transferred into a reactor (80 mL), heated to 120 °C for 24 h, cooled down to lab temperature, and centrifuged to collect yellow precipitate of ZnFe2(C2O4)3. The product was rinsed thoroughly with deionized water and ethanol and placed in a vacuum oven at 60 °C for 2 h for dehydration. The treatment of the achieved powder was performed by heating at 350 °C for 30 min to collect ZnFe2O4 nanorods with the ramping rate of 10 °C/min [46]. For the synthesis of ZnFe2O4-RGO, as mentioned in the synthesis of ZnFe2O4, 3 mg of GO was added to the precursors of the synthesis of ZnFe2(C2O4)3, namely FeSO4·7H2O (0.556 g) and ZnSO4·7H2O (0.288 g), and the precursors were then dissolved in 15 mL of deionized water with a magnetic stirrer. The other steps were the same as the synthesis of ZnFe2O4. It should be noted that in this step and in hydrothermal operation, GO is also converted to RGO.

2.3. Fabrication of Modified Electrode

A facile protocol was performed to cover a bare SPE by the ZnFe2O4/RGO nanocomposite. Specifically, 1 mg of ZnFe2O4/RGO nanocomposite was dispersed in 1 mL aqueous solution and ultra-sonicated for half an hour; then, 4 µL of the produced suspension was poured dropwise on the surface of SPE working electrode. Finally, the obtained solution was air-dried.

2.4. Real Sample Analysis

The real specimens included river, drinking, and tap water samples, which were filtered thoroughly before analysis and diluted with 0.1 M PBS with dilution factor of 1:4. Then different hydrazine concentrations were added to the specimens and analysis with standard addition method [9].

3. Results

3.1. Characterisation of the ZnFe2O4/RGO Nanocomposite

The XRD spectra were taken for the determination of the purity and crystallinity of as-produced nanomaterials, the results of which are shown in Figure S1a. According to this diffraction pattern, the peaks marked at angles of about 74°, 62°, 57°, 53.5°, 42°, 35° can be related to ZnFe2O4, which is in full compliance with JCPDS (10-22-22). A wide peak is also seen around the 25° angle, which belongs to RGO.
The TEM and SEM images were applied to explore the surface morphology and thicknesses of fabricated samples. The SEM images of ZnFe2O4-RGO (Figure S1b) show that ZnFe2O4 nanorods are uniformly placed on the surface of the reduced graphene oxide nanosheets. The TEM image of the ZnFe2O4-RGO (Figure S1c) also shows ZnFe2O4 nanorods dispersed on the surface of a highly transparent RGO nanosheet.

3.2. Electrochemical Responses of Hydrazine on the Surface of ZnFe2O4/RGO/SPE

The solution pH values influence the electrochemical responses of hydrazine (Equation (1)), highlighting the necessity for optimizing the solution pH to determine the electrocatalytic hydrazine oxidation, which was evaluated in 0.1 M PBS at various pH values (2.0 to 9.0) on the ZnFe2O4/RGO/SPE surface using differential pulse voltammetry. The results suggested a neutral pH value to achieve the best outcomes of hydrazine electrooxidation on the ZnFe2O4/RGO/SPE surface (Figure 1). Hence, the optimal pH value was selected to be 7.0 for this purpose in the next tests.
N2H4 + 2H2O → 2NH2OH + 2H+ + 2e
Figure 2 shows the cyclic voltammograms (CVs) recorded for electrooxidation of hydrazine (250.0 μM) on the surfaces of bare SPE, ZnFe2O4/SPE, RGO/SPE, and ZnFe2O4/RGO/SPE. The findings from the CVs confirmed the best hydrazine oxidation on the ZnFe2O4/RGO/SPE surface at 800 mV, about 200 mV more negative than that on the bare SPE, underlining a significant improvement in hydrazine oxidation signal via the ZnFe2O4/RGO nanocomposite. Moreover, ZnFe2O4/RGO/SPE in buffer solution showed no anodic or cathodic peak.

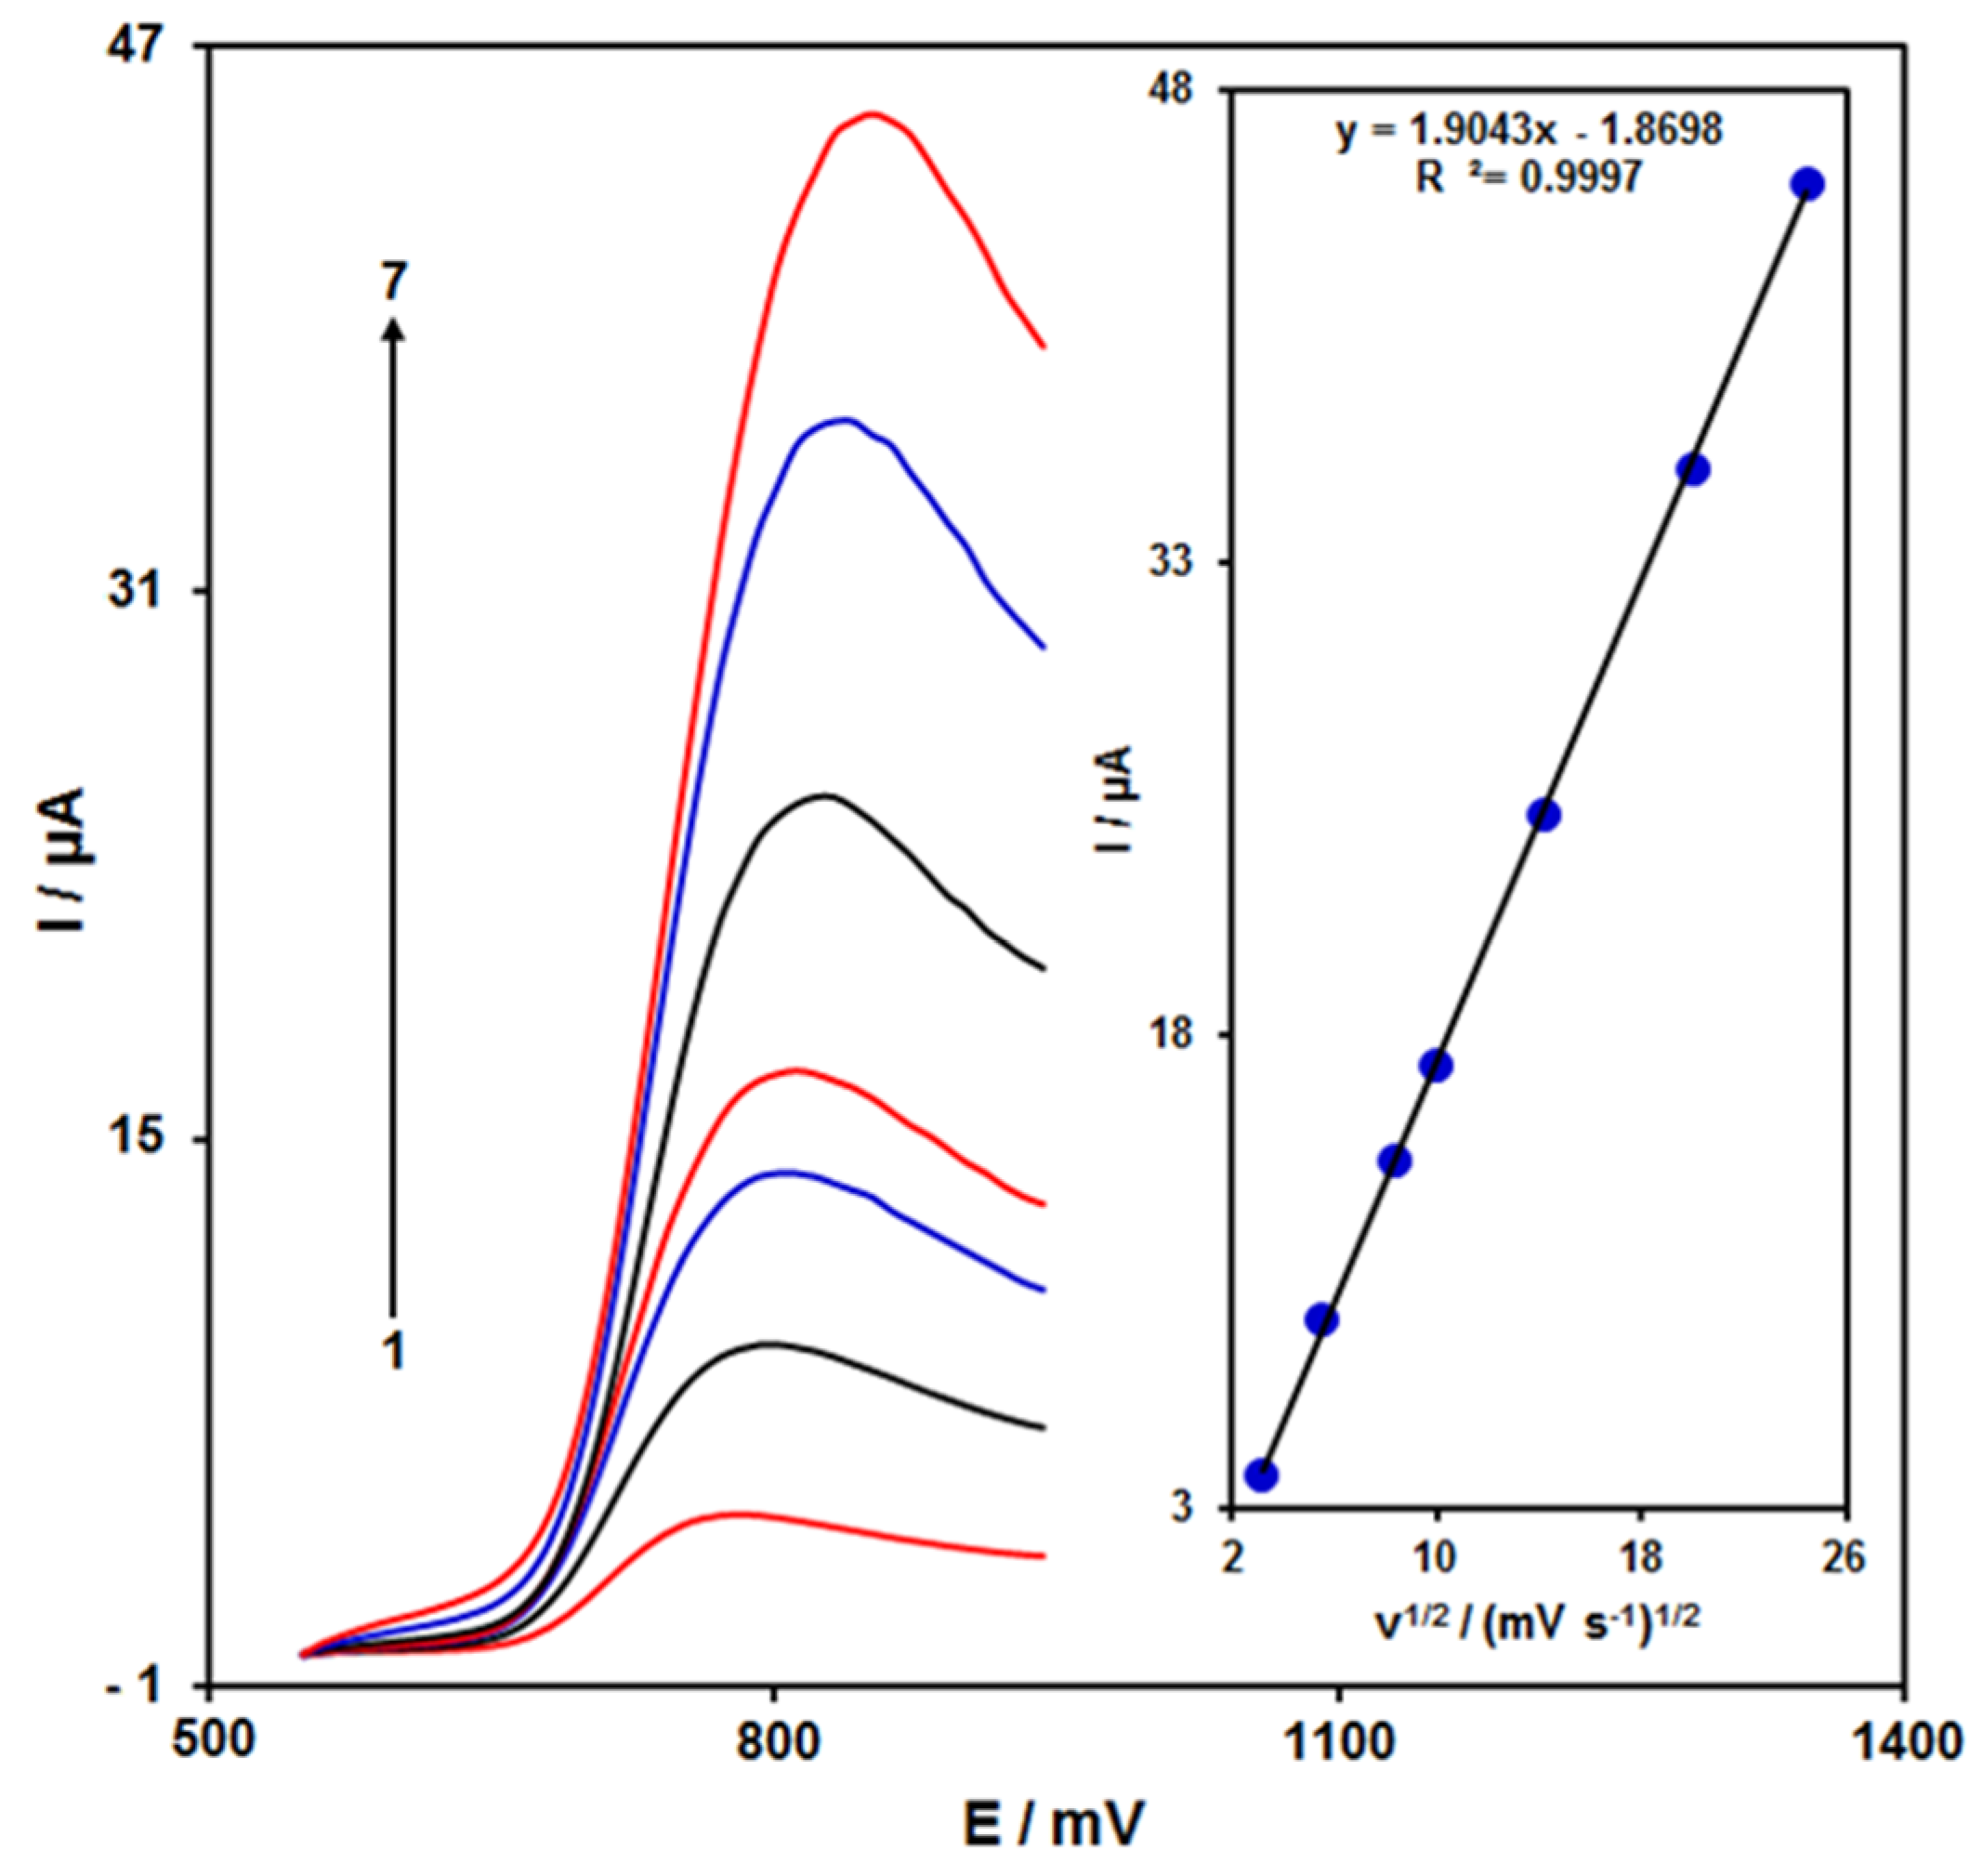
3.3. Results of Scan Rate Impact

Figure 3 shows the scan rate impact on the hydrazine oxidation current, the results of which indicated an increase in the peak current with increasing scan rate. The oxidation process followed the diffusion-limited reactions obtained from the linear dependence of the anodic peak current (Ip) on the square root of the scan rate (ν1/2, 10–600 mV/s).

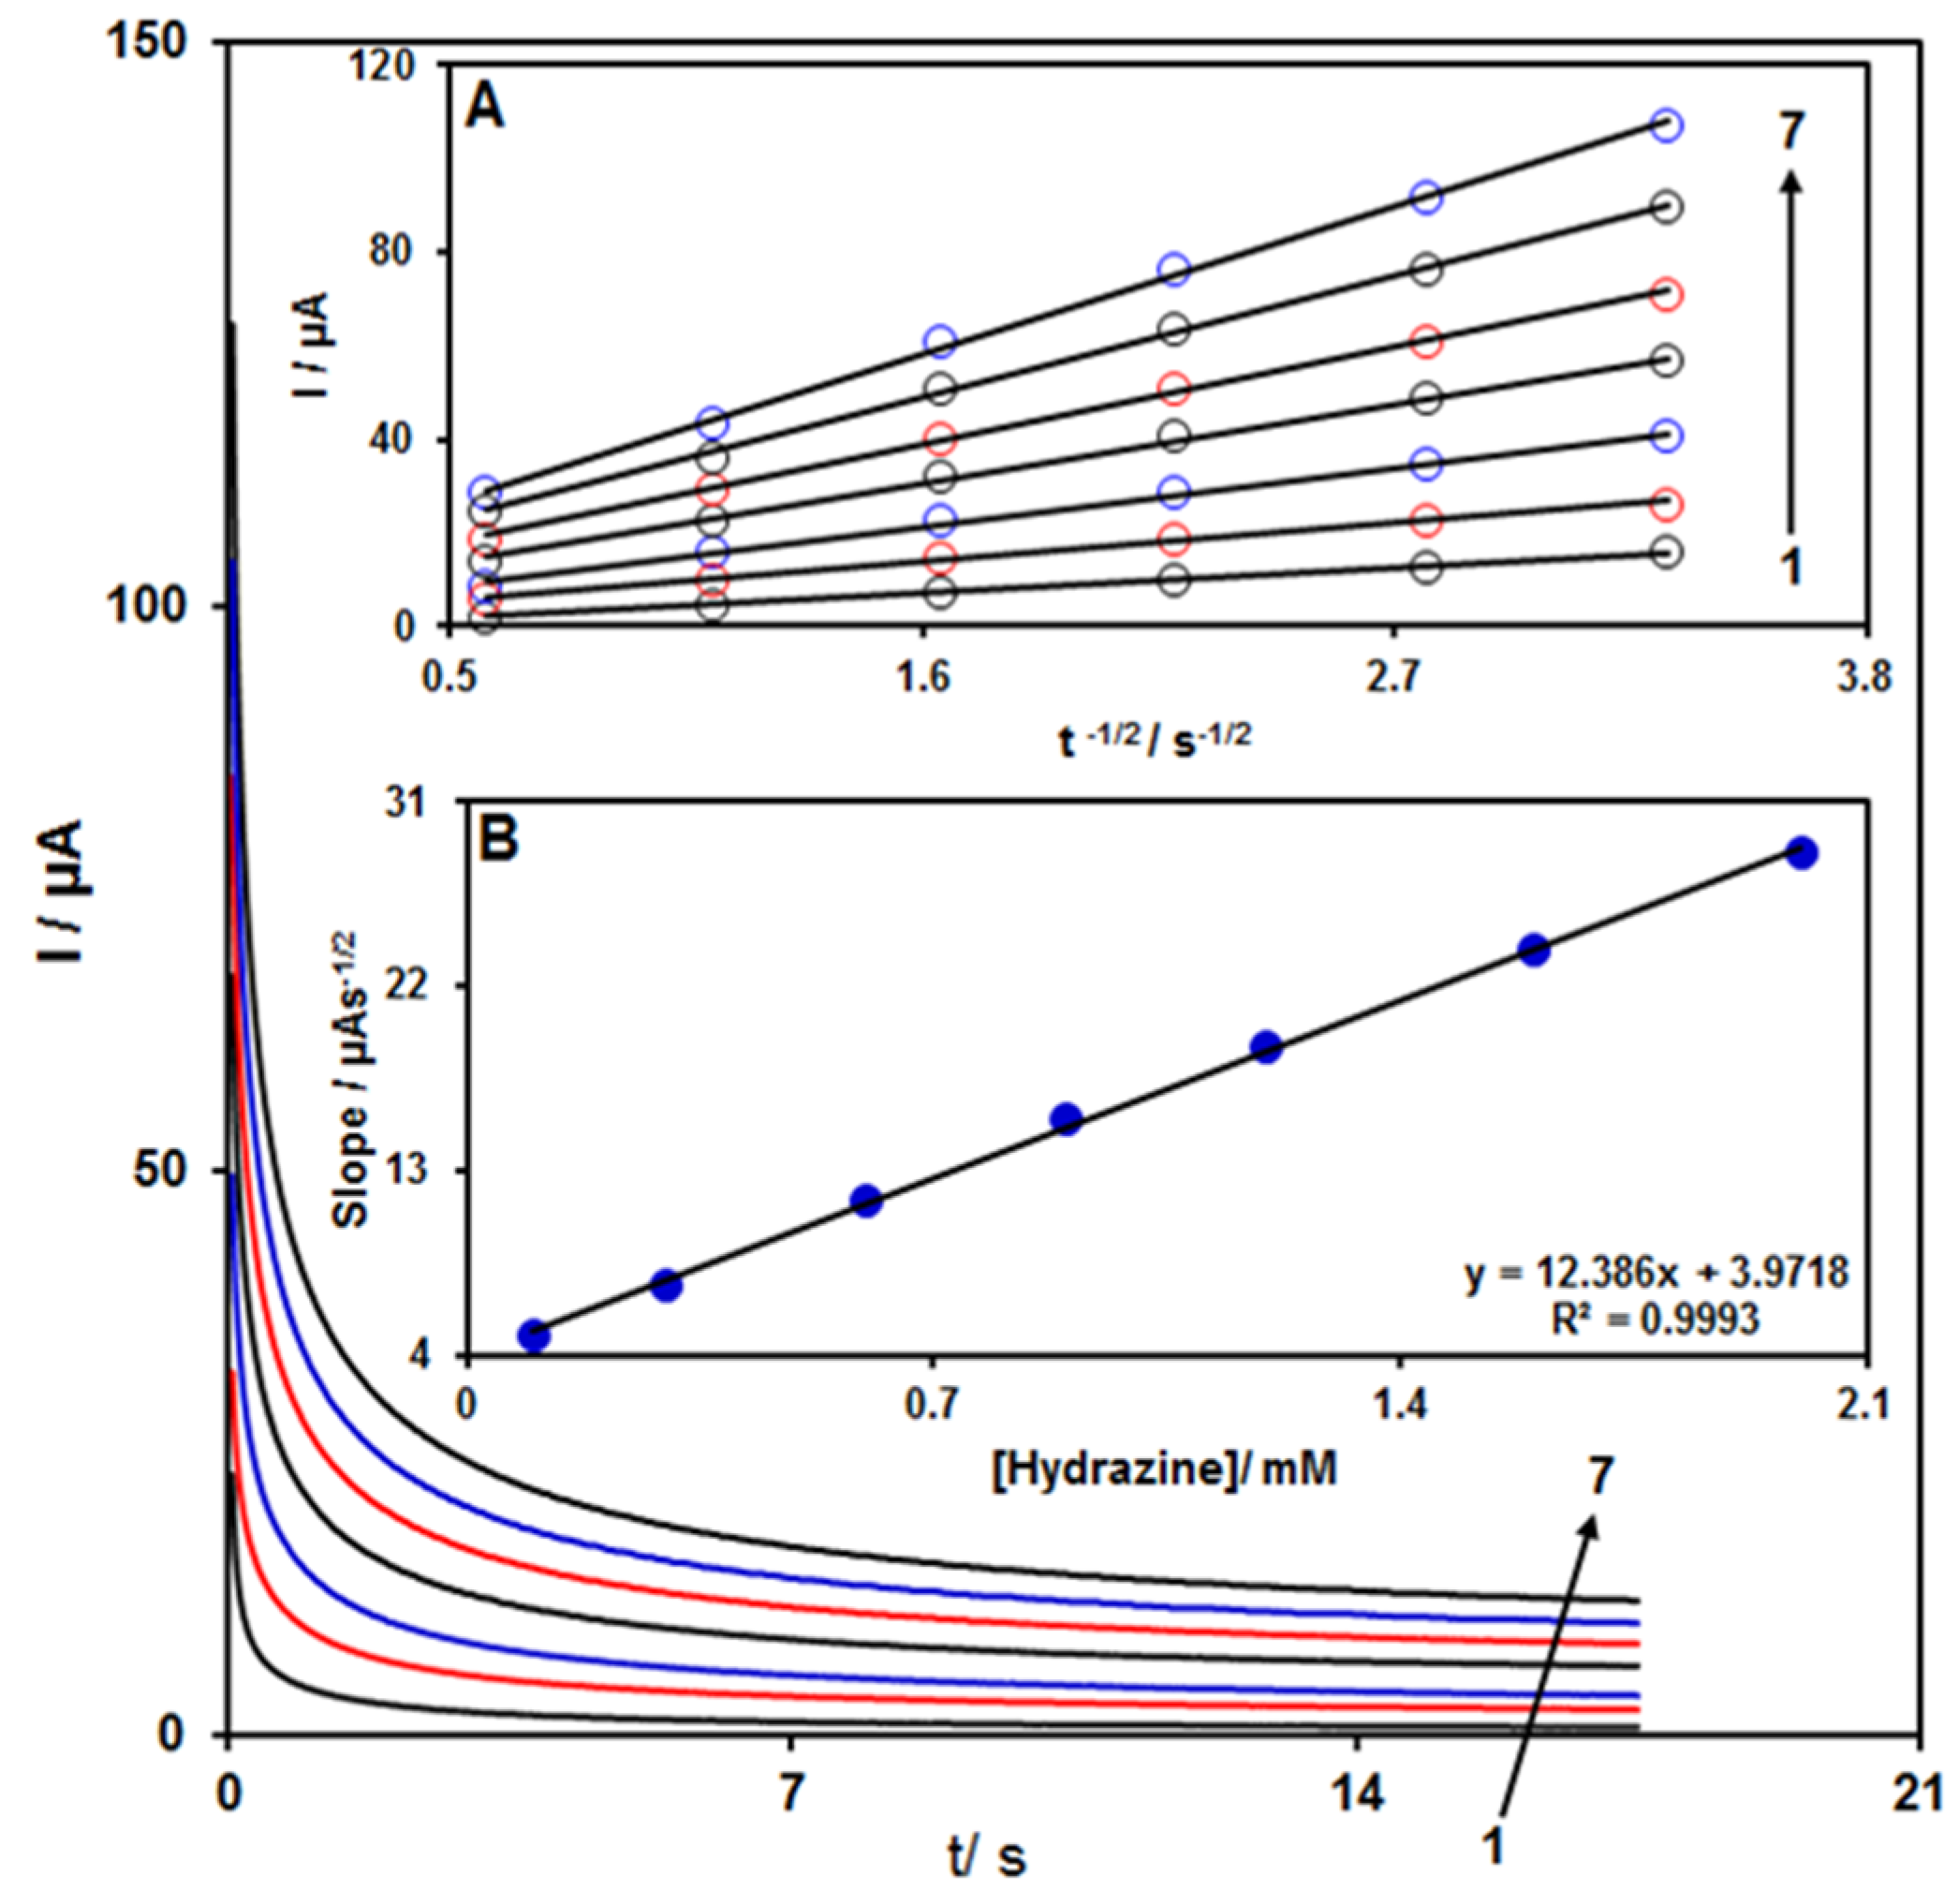
3.4. Chronoamperometric Measurements

Chronoamperometry was employed to evaluate the catalytic hydrazine oxidation on the modified electrode surface in the presence of different hydrazine concentrations on the working electrode set at the potential value of 850 mV (Figure 4). The hydrazine diffusion coefficient was also determined. According to previous findings, the electrochemical current of hydrazine under the mass transport-limited condition could be calculated using the Cottrell method (Equation (2)):
I = nFA D1/2 Cb π−1/2 t−1/2
In this equation, n is the number of electrons, F is the Faraday constant, A is the area of the electrode, while D and Cb stand for diffusion coefficient (cm2/s) and bulk concentration (mol/cm3), respectively. Inset A of Figure 4 shows the plot of I versus t−1/2 based on experiments for various hydrazine specimens. Inset B of Figure 4 displays the slope of the straight lines versus hydrazine content. The D value for hydrazine was calculated to be 1.31 × 10⁻⁵ cm2/s based on Cottrell equation and the obtained slopes. This value is comparable with the values reported in previous works (2.5 × 10⁻⁵ cm2/s [47] and 8.3 × 10⁻⁵ cm2/s [48]).

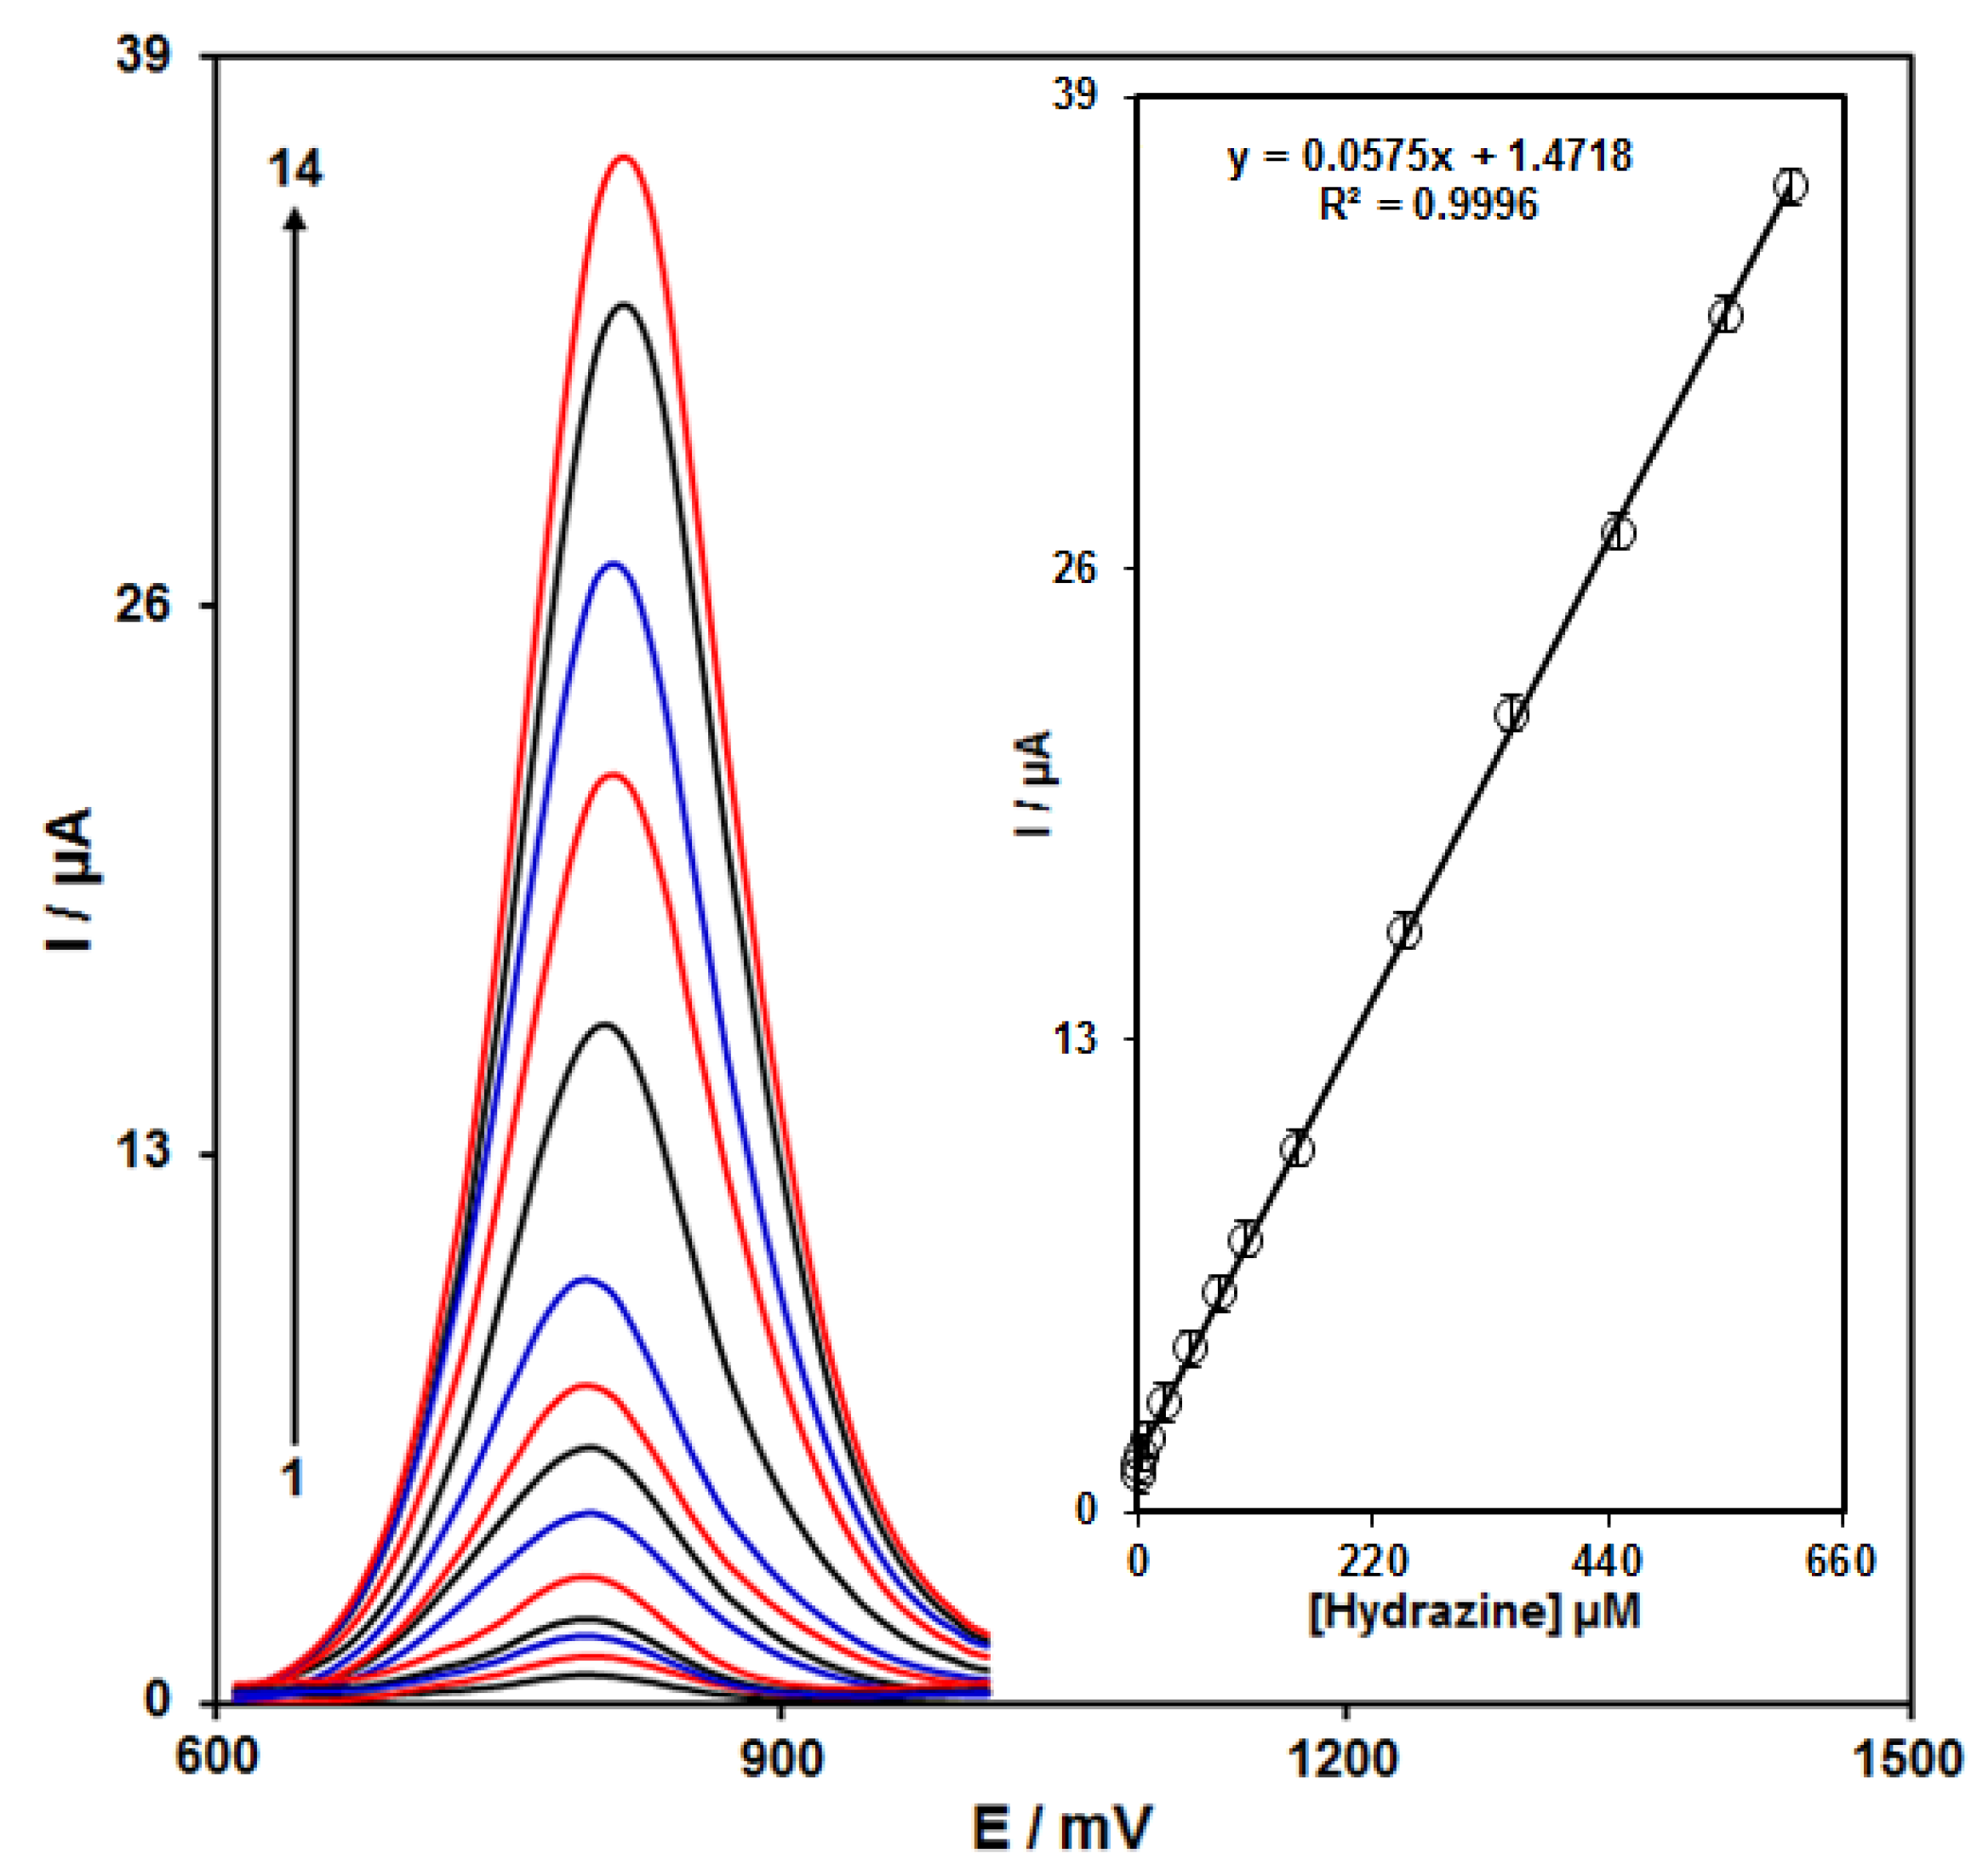
3.5. Calibration Curve and Limit of Detection

The peak currents of hydrazine electro-oxidation on the ZnFe2O4/RGO/SPE surface were used for the hydrazine detection. Hypersensitivity and appropriate analytical features are the advantages of differential pulse voltammetry (DPV); hence, different hydrazine concentrations in the ZnFe2O4/RGO/SPE and PBS (0.1 M) were used for DPV analysis as shown in Figure 5. The peak currents of hydrazine oxidation on the surface of ZnFe2O4/RGO/SPE depends linearly on hydrazine concentrations (0.03 to 610.0 μM). The linear equation was as y = 0.0575X + 1.4718, the correlation coefficient was estimated 0.9996, and the limit of detection (with three signal-to-noise ratio) was estimated at 0.01 µM using following equation:
Limit of detection = 3 sb/m
In the above equation, m is the slope of the calibration plot (0.0575 μA μM−1), and sb is the standard deviation of the blank response obtained from 20 replicate measurements of the blank solution. The LOD and linear range of hydrazine at ZnFe2O4/RGO/SPE presented in this work were compared with the reported modified electrodes and are shown in Table 1. As shown in Table 1, the prepared ZnFe2O4/RGO/SPE exhibited a lower LOD together with a wide linear dynamic range compared with previously reported works for the voltammetric determination of hydrazine.

3.6. Interference Studies

Interference studies were investigated to know how the results for the hydrazine analysis are affected by the presence of various inorganic ions and organic compounds. According to the used definition, the tolerance limit was defined as the ratio of the concentration of the interfering species to the hydrazine (50.0 μM), which led to a relative error of less than ±5.0%. The possible interference was investigated by the addition of various ions and biological compounds such as Mg2+, Na+, Ca2+, Cl, NO3 (200 fold excess), glucose, sucrose, ascorbic acid, uric acid, urea, L-cystine, and dopamine (50 fold excess) to PBS (pH 7.0) in the presence of 50.0 μM hydrazine. It was found that the addition of these interfering species has no remarkable effect on the DPV signal of hydrazine. These results indicate that the modified electrode has good selectivity for hydrazine determination.

3.7. Real Sample Analysis

The fabricated ZnFe2O4/RGO/SPE was used for the detection of hydrazine present in varied water specimens using the method of standard additions. The hydrazine concentration and recovery rate are shown in Table 2. An excellent recovery rate was found for the hydrazine, and the mean relative standard deviation (R.S.D. %) confirmed the reproducibility. The applicability of ZnFe2O4/RGO/SPE sensor was confirmed by sensitively detection of hydrazine concentrations in drinking, tap, and river water specimens in the presence of 0.1 M PBS.

4. Conclusions

We developed a new ZnFe2O4/RGO nanocomposite-modified SPE for hydrazine detection, the results of which showed a significant improvement of electrochemical sensitivity of hydrazine on the proposed electrode when compared to the bare SPE, due to rapid electron transfer and enhanced conductivity. The as-produced modified electrode was successfully applied for the hydrazine detection in real specimens because of the excellent selectivity and sensitivity of voltammetric responses, low limit of detection (0.01 µM), simple preparation, and surface regeneration.

Supplementary Materials

The following supporting information can be downloaded at: https://www.mdpi.com/article/10.3390/nano12030491/s1, Figure S1: XRD patterns (a), SEM images (b), and TEM images for ZnFe2O4-RGO (c).

Author Contributions

Conceptualization, S.T., H.B. and A.D.B.; methodology, M.B.A. and R.R.; software, S.A.A., F.G.N. and Z.D.; validation, H.B. and A.D.B.; formal analysis, S.T., M.B.A., S.A.A. and Z.D.; investigation, S.T., M.B.A., S.A.A., F.G.N. and Z.D.; resources, M.B.A., H.B. and A.D.B.; data curation, M.B.A., F.G.N. and R.R.; writing—original draft preparation, S.T.; writing—review and editing, H.B. and A.D.B.; visualization, S.A.A., F.G.N. and R.R.; supervision, S.T., H.B., A.D.B.; project administration, H.B.; funding acquisition, H.B. and A.D.B. All authors have read and agreed to the published version of the manuscript.

Funding

This research was funded by University of Salerno, grant number ORSA218189. The APC was funded by A.D.B and Kerman University of Medical Sciences, Kerman, Iran.

Institutional Review Board Statement

Not applicable.

Informed Consent Statement

Not applicable.

Data Availability Statement

The data presented in this study are available on request from the corresponding authors.

Conflicts of Interest

The authors declare no conflict of interest.

References

  1. Ameen, S.; Akhtar, M.S.; Shin, H.S. Hydrazine chemical sensing by modified electrode based on in situ electrochemically synthesized polyaniline/graphene composite thin film. Sens. Actuators B Chem. 2012, 173, 177–183. [Google Scholar] [CrossRef]
  2. Ameen, S.; Akhtar, M.S.; Shin, H.S. Highly sensitive hydrazine chemical sensor fabricated by modified electrode of vertically aligned zinc oxide nanorods. Talanta 2012, 100, 377–383. [Google Scholar] [CrossRef]
  3. Saengsookwaow, C.; Rangkupan, R.; Chailapakul, O.; Rodthongkum, N. Nitrogen-doped graphene–polyvinylpyrrolidone/gold nanoparticles modified electrode as a novel hydrazine sensor. Sens. Actuators B Chem. 2016, 227, 524–532. [Google Scholar] [CrossRef]
  4. Watt, G.W.; Chrisp, J.D. Spectrophotometric method for determination of hydrazine. Anal. Chem. 1952, 24, 2006–2008. [Google Scholar] [CrossRef]
  5. Lv, J.; Huang, J.; Zhang, Z. Determination of hydrazine by flow injection with chemiluminescence. Anal. Lett. 2001, 34, 1323–1330. [Google Scholar] [CrossRef]
  6. Timbrell, J.A.; Wright, J.M.; Smith, C.M. Determination of hydrazine metabolites of isoniazid in human urine by gas chromatography. J. Chromatogr. A 1977, 138, 165–172. [Google Scholar] [CrossRef]
  7. Karimi-Maleh, H.; Orooji, Y.; Karimi, F.; Alizadeh, M.; Baghayeri, M.; Rouhi, J.; Tajik, S.; Beitollahi, H.; Agarwal, S.; Gupta, V.K.; et al. A critical review on the use of potentiometric based biosensors for biomarkers detection. Biosens. Bioelectron. 2021, 184, 113252. [Google Scholar] [CrossRef]
  8. Ganjali, M.R.; Garkani-Nejad, F.; Tajik, S.; Beitollahi, H.; Pourbasheer, E.; Larijanii, B. Determination of salicylic acid by differential pulse voltammetry using ZnO/Al2O3 nanocomposite modified graphite screen printed electrode. Int. J. Electrochem. Sci. 2017, 12, 9972–9982. [Google Scholar] [CrossRef]
  9. Tajik, S.; Beitollahi, H.; Hosseinzadeh, R.; Aghaei Afshar, A.; Varma, R.S.; Won Jang, H.; Shokouhimehr, M. Electrochemical detection of hydrazine by carbon paste electrode modified with ferrocene derivatives, ionic liquid, and CoS2-carbon nanotube nanocomposite. ACS Omega 2021, 6, 4641–4648. [Google Scholar] [CrossRef]
  10. Zhu, X.; Lin, L.; Wu, R.; Zhu, Y.; Sheng, Y.; Nie, P.; Liu, P.; Xu, L.; Wen, Y. Portable wireless intelligent sensing of ultra-trace phytoregulator α-naphthalene acetic acid using self-assembled phosphorene/Ti3C2-MXene nanohybrid with high ambient stability on laser induced porous graphene as nanozyme flexible electrode. Biosens. Bioelectron. 2021, 179, 113062. [Google Scholar] [CrossRef]
  11. Garkani-Nejad, F.; Tajik, S.; Beitollahi, H.; Sheikhshoaie, I. Magnetic nanomaterials based electrochemical (bio) sensors for food analysis. Talanta 2021, 228, 122075. [Google Scholar] [CrossRef] [PubMed]
  12. Zhao, Z.; Sun, Y.; Li, P.; Zhang, W.; Lian, K.; Hu, J.; Chen, Y. Preparation and characterization of AuNPs/CNTs-ErGO elec-trochemical sensors for highly sensitive detection of hydrazine. Talanta 2016, 158, 283–291. [Google Scholar] [CrossRef] [PubMed] [Green Version]
  13. Tajik, S.; Beitollahi, H.; Garkani-Nejad, F.; Sheikhshoaie, I.; Sugih Nugraha, A.; Won Jang, H.; Yamauchi, Y.; Shokouhimehr, M. Performance of metal–organic frameworks in the electrochemical sensing of environmental pollutants. J. Mater. Chem. A 2021, 9, 8195–8220. [Google Scholar] [CrossRef]
  14. Ge, Y.; Liu, P.; Xu, L.; Qu, M.; Hao, W.; Liang, H.; Sheng, Y.; Zhu, Y.; Wen, Y. A portable wireless intelligent electrochemical sensor based on layer-by-layer sandwiched nanohybrid for terbutaline in meat products. Food Chem. 2022, 371, 131140. [Google Scholar] [CrossRef]
  15. Fang, B.; Zhang, C.; Zhang, W.; Wang, G. A novel hydrazine electrochemical sensor based on a carbon nanotube-wired ZnO nanoflower-modified electrode. Electrochim. Acta 2009, 55, 178–182. [Google Scholar] [CrossRef]
  16. Saeb, E.; Asadpour-Zeynali, K. Facile synthesis of TiO2@PANI@ Au nanocomposite as an electrochemical sensor for determination of hydrazine. Microchem. J. 2021, 160, 105603. [Google Scholar] [CrossRef]
  17. Pei, Y.; Hu, M.; Xia, Y.; Huang, W.; Li, Z.; Chen, S. Electrochemical preparation of Pt nanoparticles modified nanoporous gold electrode with highly rough surface for efficient determination of hydrazine. Sens. Actuators B Chem. 2020, 304, 127416. [Google Scholar] [CrossRef]
  18. Azimi, S.; Amiri, M.; Imanzadeh, H.; Bezaatpour, A. Fe3O4@SiO2-NH2/CoSB modified carbon paste electrode for sim-ultaneous detection of acetaminophen and chlorpheniramine. Adv. J. Chem. Sect. A 2021, 4, 152–164. [Google Scholar]
  19. Tahernejad-Javazmi, F.; Shabani-Nooshabadi, M.; Karimi-Maleh, H. Analysis of glutathione in the presence of aceta-minophen and tyrosine via an amplified electrode with MgO/SWCNTs as a sensor in the hemolyzed erythrocyte. Talanta 2018, 176, 208–213. [Google Scholar] [CrossRef]
  20. Charithra, M.M.; Manjunatha, J.G. Enhanced voltammetric detection of paracetamol by using carbon nanotube modified electrode as an electrochemical sensor. J. Electrochem. Sci. Eng. 2020, 10, 29–40. [Google Scholar] [CrossRef]
  21. Garkani-Nejad, F.; Beitollahi, H.; Tajik, S.; Jahani, S. La3+-doped Co3O4 nanoflowers modified graphite screen printed electrode for electrochemical sensing of vitamin B6. Anal. Bioanal. Chem. Res. 2019, 6, 69–79. [Google Scholar]
  22. Saghiri, S.; Ebrahimi, M.; Bozorgmehr, M.R. Electrochemical amplified sensor with MgO nanoparticle and ionic liquid: A powerful strategy for methyldopa analysis. Chem. Methodol. 2021, 5, 234–239. [Google Scholar]
  23. Garkani-Nejad, F.; Beitollahi, H.; Alizadeh, R. Sensitive determination of hydroxylamine on ZnO nanorods/graphene oxide nanosheets modified graphite screen printed electrode. Anal. Bioanal. Electrochem. 2017, 9, 134–144. [Google Scholar]
  24. Shamsi, A.; Ahour, F. Electrochemical sensing of thioridazine in human serum samples using modified glassy carbon electrode. Adv. J. Chem. Sect. A 2020, 4, 22–31. [Google Scholar]
  25. Pirozmand, M.; Nezhadali, A.; Payehghadr, M.; Saghatforoush, L. Ultratrace determination of cadmium ion in petro-chemical sample by a new modified carbon paste electrode as voltammetric sensor. Eurasian Chem. Commun. 2020, 2, 1021–1032. [Google Scholar]
  26. Aoboun, A.; Cherdhirunkorn, B.; Pechyen, C. Development of screen printed electrode using MWCNTs–TiO2 nanocomposite as a low-cost device for uric acid detection in urine. J. Mater. Sci. Mater. Electron. 2019, 30, 2403–2412. [Google Scholar] [CrossRef]
  27. Shehata, M.; Fekry, A.M.; Walcarius, A. Moxifloxacin hydrochloride electrochemical detection at gold nanoparticles modified screen-printed electrode. Sensors 2020, 20, 2797. [Google Scholar] [CrossRef]
  28. Kneževiæ, S.; Ognjanoviæ, M.; Nediæ, N.; Mariano, J.F.; Milanoviæ, Z.; Petkoviæ, B.; Stankoviæ, D. A single drop histamine sensor based on AuNPs/MnO2 modified screen-printed electrode. Microchem. J. 2020, 155, 104778. [Google Scholar] [CrossRef]
  29. Tajik, S.; Beitollahi, H.; Won Jang, H.; Shokouhimehr, M. A screen printed electrode modified with Fe3O4@polypyrrole-Pt core-shell nanoparticles for electrochemical detection of 6-mercaptopurine and 6-thioguanine. Talanta 2021, 232, 122379. [Google Scholar] [CrossRef]
  30. de Cássia Mendonça, J.; da Rocha, L.R.; Capelari, T.B.; Prete, M.C.; Angelis, P.N.; Segatelli, M.G.; Tarley, C.R.T. Design and performance of novel molecularly imprinted biomimetic adsorbent for preconcentration of prostate cancer bi-omarker coupled to electrochemical determination by using multi-walled carbon nanotubes/Nafion®/Ni(OH)2-modified screen-printed electrode. J. Electroanal. Chem. 2020, 878, 114582. [Google Scholar] [CrossRef]
  31. Chouiref, L.; Jaballah, S.; Erouel, M.; Moutia, N.; Hzez, W.; Ghiloufi, I.; El Mir, L. Development and electrical characteriza-tion of screen-printed electrode based on ZnO nanoparticles. J. Mater. Sci. Mater. Electron. 2020, 31, 13899–13908. [Google Scholar] [CrossRef]
  32. Abrishamkar, M.; Ehsani Tilami, S.; Hosseini Kaldozakh, S. Electrocatalytic oxidation of cefixime at the surface of modi-fied carbon paste electrode with synthesized nano zeolite. Adv. J. Chem. Sect. A 2020, 3, 767–776. [Google Scholar]
  33. Antuña-Jiménez, D.; González-García, M.B.; Hernández-Santos, D.; Fanjul-Bolado, P. Screen-printed electrodes modified with metal nanoparticles for small molecule sensing. Biosensors 2020, 10, 9. [Google Scholar] [CrossRef] [PubMed] [Green Version]
  34. Murtada, K.; Salghi, R.; Ríos, A.; Zougagh, M. A sensitive electrochemical sensor based on aluminium doped copper selenide nanoparticles-modified screen printed carbon electrode for determination of L-tyrosine in pharmaceutical samples. J. Electroanal. Chem. 2020, 874, 114466. [Google Scholar] [CrossRef]
  35. Prasad, P.; Sreedhar, N.Y. Effective SWCNTs/Nafion electrochemical sensor for detection of dicapthon pesticide in water and agricultural food samples. Chem. Methodol. 2018, 2, 277–290. [Google Scholar]
  36. Chinnapaiyan, S.; Chen, T.W.; Chen, S.M.; Alothman, Z.A.; Ali, M.A.; Wabaidur, S.M.; Chang, W.H. Ultrasonic-assisted preparation and characterization of magnetic ZnFe2O4/g-C3N4 nanomaterial and their applications towards electrocatalytic reduction of 4-nitrophenol. Ultrason. Sonochem. 2020, 68, 105071. [Google Scholar] [CrossRef]
  37. Motahharinia, M.; Zamani, H.A.; Karimi-Maleh, H. Electrochemical determination of doxorubicin in injection samples using paste electrode amplified with reduced graphene oxide/Fe3O4 nanocomposite and 1-Hexyl-3-methylimidazolium Hexafluorophosphate. Chem. Methodol. 2021, 5, 107–113. [Google Scholar]
  38. Sagayaraj, R.; Aravazhi, S.; Praveen, P.; Chandrasekaran, G. Correction to: Structural, morphological and magnetic characters of PVP coated ZnFe2O4 nanoparticles. J. Mater. Sci. Mater. Electron. 2018, 29, 17090–17091. [Google Scholar] [CrossRef] [Green Version]
  39. Reddy, I.N.; Manjunath, V.; Shim, J. Structural and optical properties, electrochemical impedance spectroscopy, and Mott–Schottky analysis of ZnFe2O4 nanoparticle-decorated V2O5 rectangular nanosheets for photoelectrochemical applications. J. Environ. Chem. Eng. 2021, 9, 106131. [Google Scholar] [CrossRef]
  40. Yang, B.; Wang, C.; Xiao, R.; Yu, H.; Wang, J.; Liu, H.; Xiao, J. High sensitivity and fast response sensor based on sputtering Au tuned ZnFe2O4-SE for low concentration NH3 detection. Mater. Chem. Phys. 2020, 239, 122302. [Google Scholar] [CrossRef]
  41. Rabiee, N.; Safarkhani, M.; Rabiee, M. Ultra-sensitive electrochemical on-line de-termination of Clarithromycin based on Poly (L-Aspartic acid)/graphite oxide/pristine graphene/glassy carbon electrode. Asian J. Nanosci. Mater. 2018, 1, 63–73. [Google Scholar]
  42. Wei, W.; Yang, S.; Hu, H.; Li, H.; Jiang, Z. Hierarchically grown ZnFe2O4-decorated polyaniline-coupled-graphene nanosheets as a novel electrocatalyst for selective detecting p-nitrophenol. Microchem. J. 2021, 160, 105777. [Google Scholar] [CrossRef]
  43. Tahernejad-Javazmi, F.; Shabani-Nooshabadi, M.; Karimi-Maleh, H. 3D reduced graphene oxide/FeNi3-ionic liquid nanocomposite modified sensor; an electrical synergic effect for development of tert-butylhydroquinone and folic acid sensor. Compos. Part B Eng. 2019, 172, 666–670. [Google Scholar] [CrossRef]
  44. Li, Z.; Cao, J.; Xia, Z.; Fan, M.; Wei, D.; Yang, H. Self-assembled ZnFe2O4 hollow spheres/GO hybrid anode with excellent electrochemical performance for lithium-ion batteries. J. Mater. Sci. Mater. Electron. 2020, 31, 1126–1134. [Google Scholar] [CrossRef]
  45. Vinodhkumar, G.; Ramya, R.; Vimalan, M.; Potheher, I.; Cyrac Peter, A. Reduced graphene oxide based on simultaneous detection of neurotransmitters. Prog. Chem. Biochem. Res. 2018, 1, 40–49. [Google Scholar] [CrossRef] [Green Version]
  46. Askari, M.B.; Salarizadeh, P.; Seifi, M.; Di Bartolomeo, A. ZnFe2O4 nanorods on reduced graphene oxide as advanced supercapacitor electrodes. J. Alloys Compd. 2021, 860, 158497. [Google Scholar] [CrossRef]
  47. Beitollahi, H.; Tajik, S.; Karimi Malehd, H.; Hosseinzadehe, R. Application of a 1-benzyl-4-ferrocenyl-1H-[1,2,3]-triazole/carbon nanotube modified glassy carbon electrode for Voltammetric determination of hydrazine in water samples. Appl. Organomet. Chem. 2013, 27, 444–450. [Google Scholar] [CrossRef]
  48. Soltaninejad, V.; Maleki, A.; Beitollahi, H.; Zare-Dorabei, R. Fabrication of a sensitive electrochemical sensor based on modified screen printed electrode for hydrazine analysis in water samples. Int. J. Environ. Anal. Chem. 2020. [Google Scholar] [CrossRef]
  49. Faisal, M.; Harraz, F.A.; Al-Salami, A.E.; Al-Sayari, S.A.; Al-Hajry, A.; Al-Assiri, M.S. Polythiophene/ZnO nanocompo-site-modified glassy carbon electrode as efficient electrochemical hydrazine sensor. Mater. Chem. Phys. 2018, 214, 126–134. [Google Scholar] [CrossRef]
  50. Srinidhi, G.; Sudalaimani, S.; Giribabu, K.; Basha, S.S.; Suresh, C. Amperometric determination of hydrazine using a CuS-ordered mesoporous carbon electrode. Microchim. Acta 2020, 187, 359. [Google Scholar] [CrossRef]
  51. Zhou, T.; Lu, P.; Zhang, Z.; Wang, Q.; Umar, A. Perforated Co3O4 nanoneedles assembled in chrysanthemum-like Co3O4 structures for ultra-high sensitive hydrazine chemical sensor. Sens. Actuators B Chem. 2016, 235, 457–465. [Google Scholar] [CrossRef]
Figure 1. Plot of Ip vs. pH obtained from DPVs of ZnFe2O4/RGO/SPE in a solution containing 250.0 μM of hydrazine in 0.1 M PBS with different pHs (2.0, 3.0, 4.0, 5.0, 6.0, 7.0, 8.0, and 9.0).
Nanomaterials 12 00491 g001
Figure 2. Cyclic voltammograms (CVs) recorded for electrooxidation of hydrazine. Curve a is the CV of bare SPE in 0.1 M PBS at the pH value of 7.0. Curves b–e are CVs at the surfaces of bare SPE, ZnFe2O4/SPE, RGO/SPE and ZnFe2O4/RGO/SPE in the presence of 0.1 M PBS at the pH value of 7.0 for the detection of hydrazine (250.0 μM). In all cases, the scan rate is 50 mV/s.
Nanomaterials 12 00491 g002
Figure 3. LSVs of ZnFe2O4/RGO/SPE in the presence of 0.1 M PBS at the pH value of 7.0 for detection of hydrazine (150.0 μM) at different scan rates, indicated by numbers 1–7 corresponding to 10, 30, 70, 100, 200, 400, and 600 mV/s. Inset: anodic peak current variation versus ν1/2.
Nanomaterials 12 00491 g003
Figure 4. Chronoamperograms for ZnFe2O4/ RGO/SPE in the presence of 0.1 M PBS at the pH value of 7.0 for detection of hydrazine at different concentrations, indicated by numbers 1–7 corresponding to 0.1, 0.3, 0.6, 0.9, 1.2, 1.6, and 2.0 mM of hydrazine. Insets: (A) Cottrell plot for chronoamperogram findings, (B) slope of the plot of straight lines versus hydrazine content.
Nanomaterials 12 00491 g004
Figure 5. DPVs of ZnFe2O4/RGO/SPE in the presence of 0.1 M PBS at the pH value of 7.0 for detection of hydrazine at different concentrations, indicated by numbers 1–14 corresponding to 0.03, 0.3, 3.0, 10.0, 25.0, 50.0, 75.0, 100.0, 150.0, 250.0, 350.0, 450.0, 550.0, and 610.0 µM of hydrazine. Inset: plot of peak current as a function of different hydrazine concentrations (0.03–610.0 µM).
Nanomaterials 12 00491 g005
Table 1. Comparison of the efficiency of the ZnFe2O4/RGO/SPE electrode with the literature modified electrodes for hydrazine determination.
Electrochemical SensorElectrochemical MethodLinear RangeLODRef.
Nitrogen-doped graphene -polyvinylpyrrolidone-gold nanoparticles/screen-printed carbon electrodeSquare wave voltammetry2–300 μM0.07 μM[3]
1-benzyl-4-ferrocenyl-1H-
[1,2,3]-triazole/carbon nanotube modified
glassy carbon electrode
Square wave voltammetry0.5–700.0 µM33.0 nM[47]
poly(vinyl
alcohol)/chitosan/TiO2/chlorophyll nanocomposite modified screen printed electrode
DPV0.45–350.0 μM0.015 μM[48]
polythiophene-ZnO nanocomposite/glassy carbon electrodeAmperometry0.5–48 μM0.207 μM[49]
Copper sulfide–ordered mesoporous carbon/glassy carbon electrodeAmperometry0.25–40 μM0.10 μM[50]
Chrysanthemum-like Co3O4/glassy carbon electrodeAmperometry50–1088 μM3.7 μM[51]
ZnFe2O4/RGO/SPEDPV0.03–610.0 µM0.01 μMThis work
Table 2. Recoveries for detection of hydrazine in water specimens in the presence of 0.1 M PBS. (n = 3).
SampleSpikedFoundRecovery (%)R.S.D. (%)
Drinking water0---
4.04.1102.51.7
6.05.896.73.3
8.08.3103.72.3
10.09.999.02.9
Tap water0---
5.04.998.02.2
8.08.1101.21.8
11.011.4103.63.5
14.013.999.22.1
River water0---
4.03.097.53.6
7.07.1101.42.1
10.09.898.02.9
13.013.5103.82.5
Publisher’s Note: MDPI stays neutral with regard to jurisdictional claims in published maps and institutional affiliations.

