
Determination of the Concentration of Silver Atoms in Hydrosol Nanoparticles


Abstract
1. Introduction
2. Materials and Methods
2.1. Chemicals and Materials
2.2. Synthesis Procedure
2.2.1. Photochemical Synthesis of Spherical Nanoparticles
2.2.2. Synthesis of Polyphosphate Stabilized Nanoparticles
2.2.3. Synthesis of Triangular Nanoplate
2.2.4. Synthesis of PVP-Stabilized Nanoparticles
2.3. Instrumentation
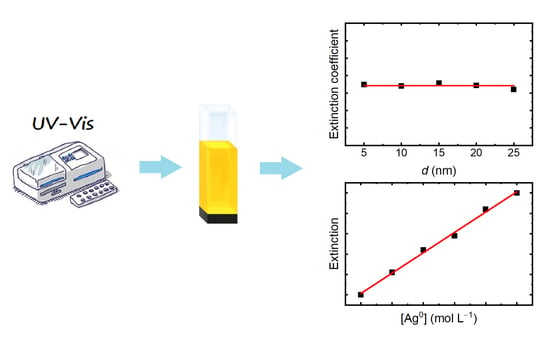
2.3.1. Optical Spectroscopy
2.3.2. ICP-MS
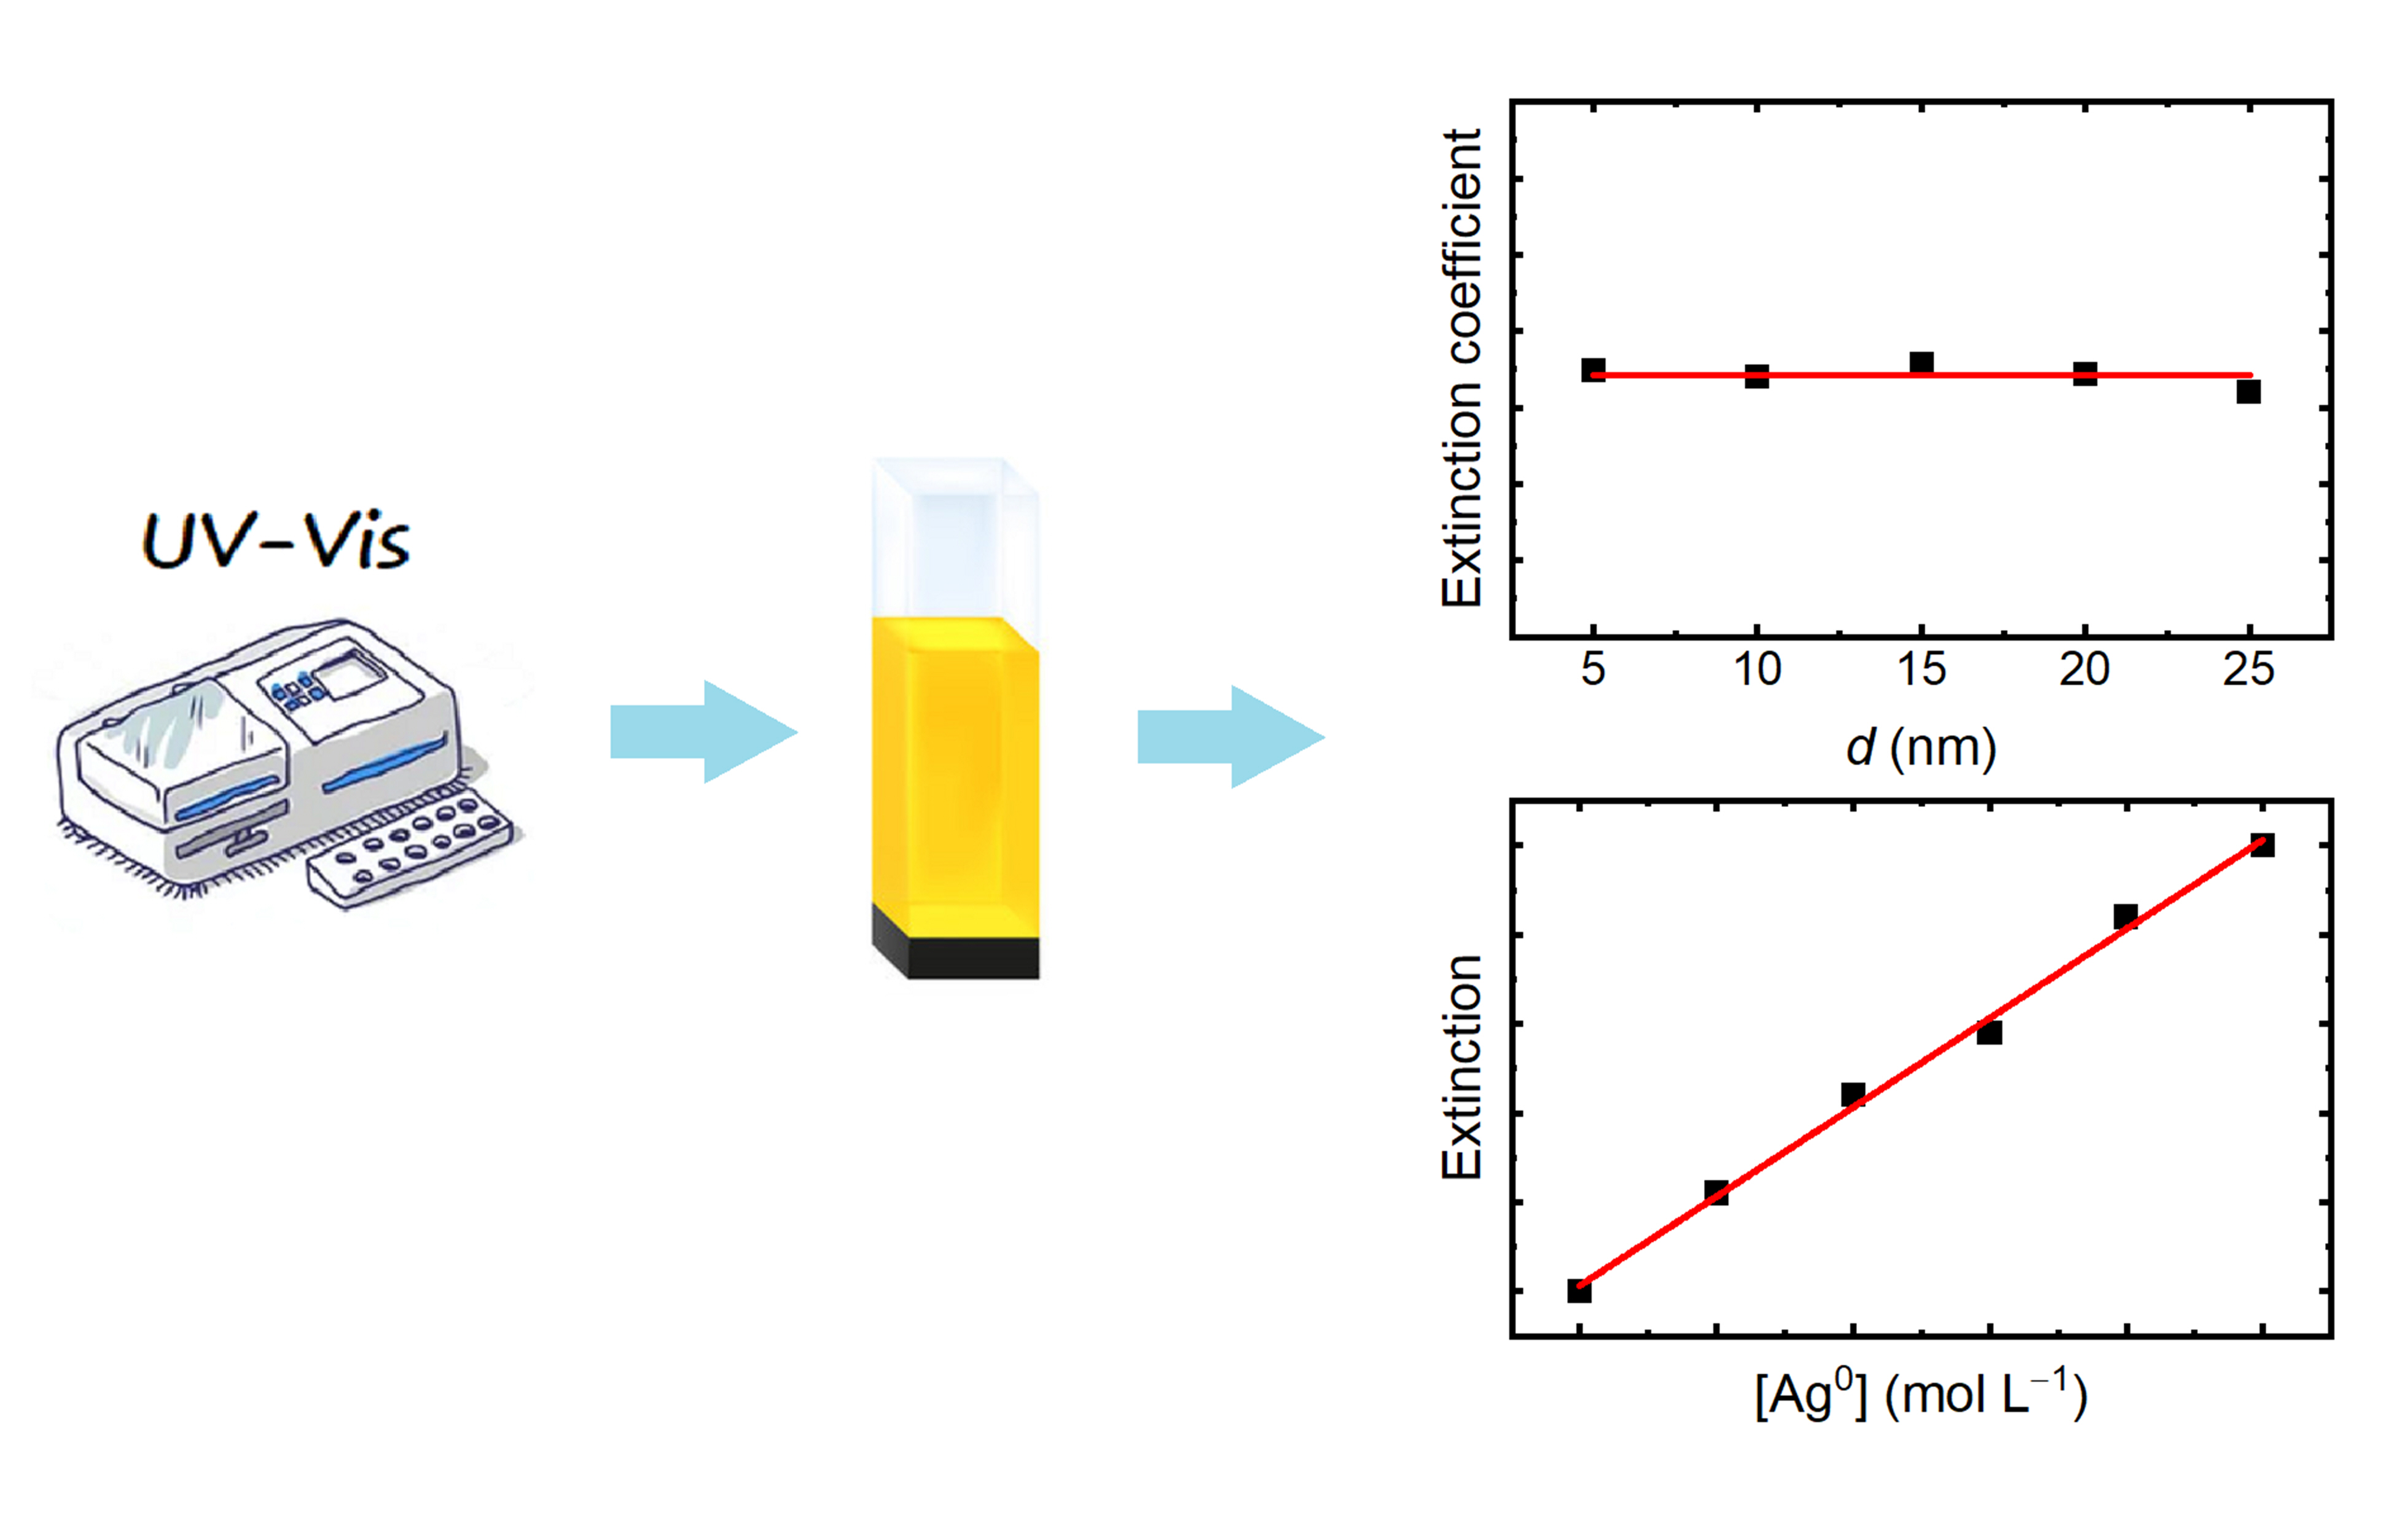
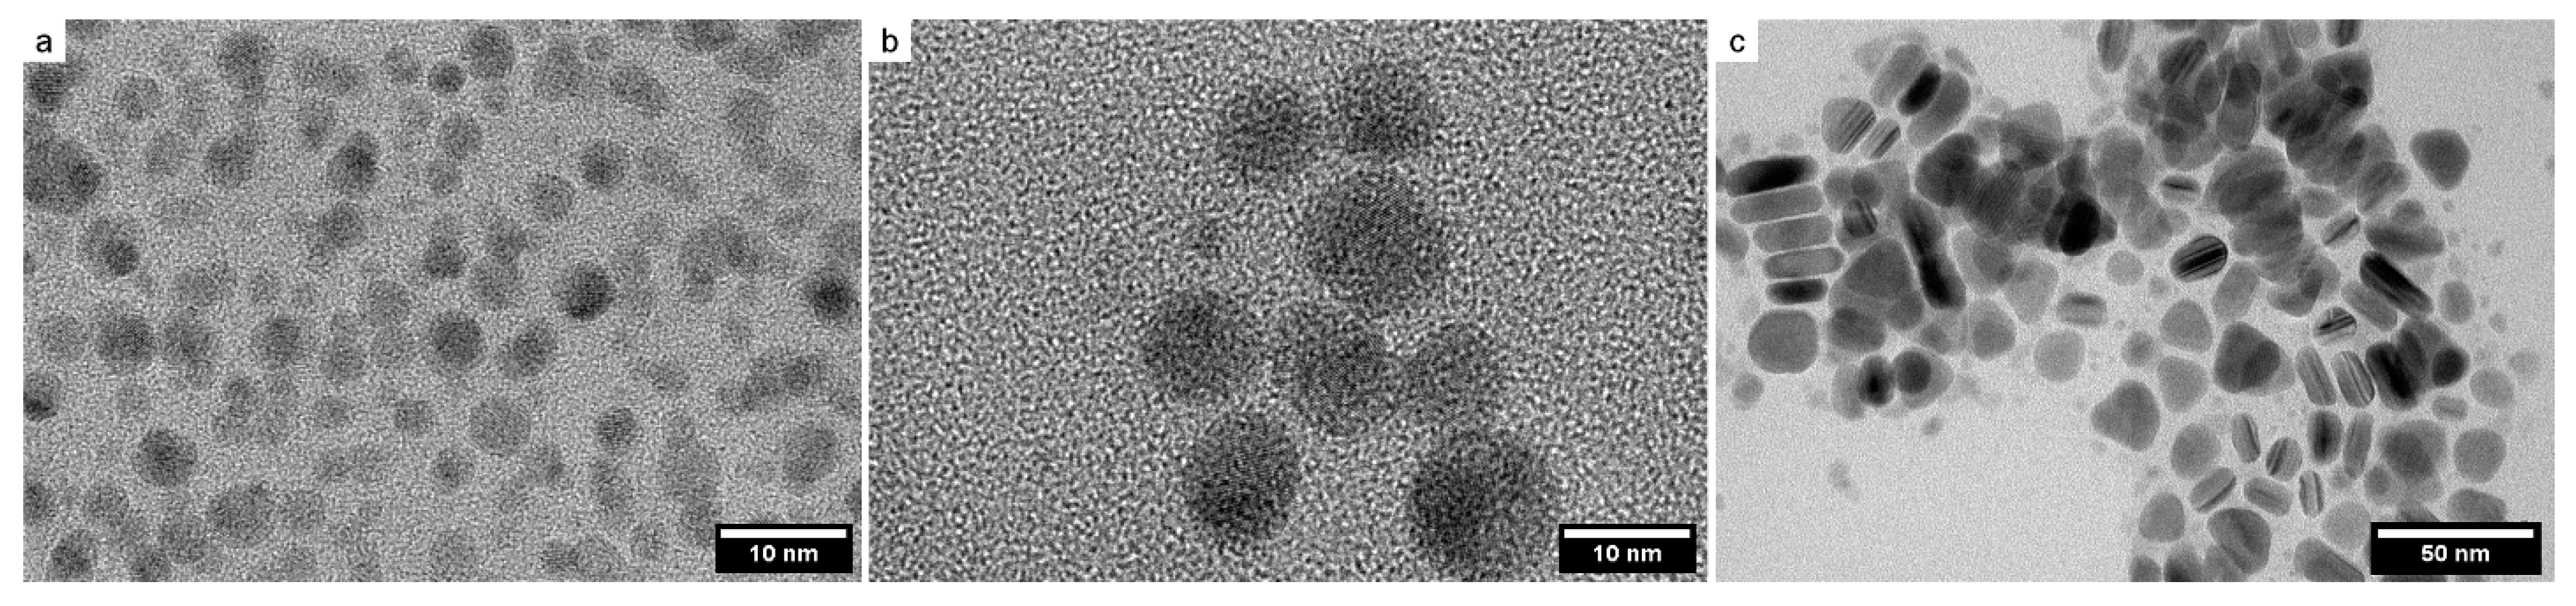
2.3.3. Microscopy
2.3.4. Dynamic Light Scattering
2.3.5. XRD
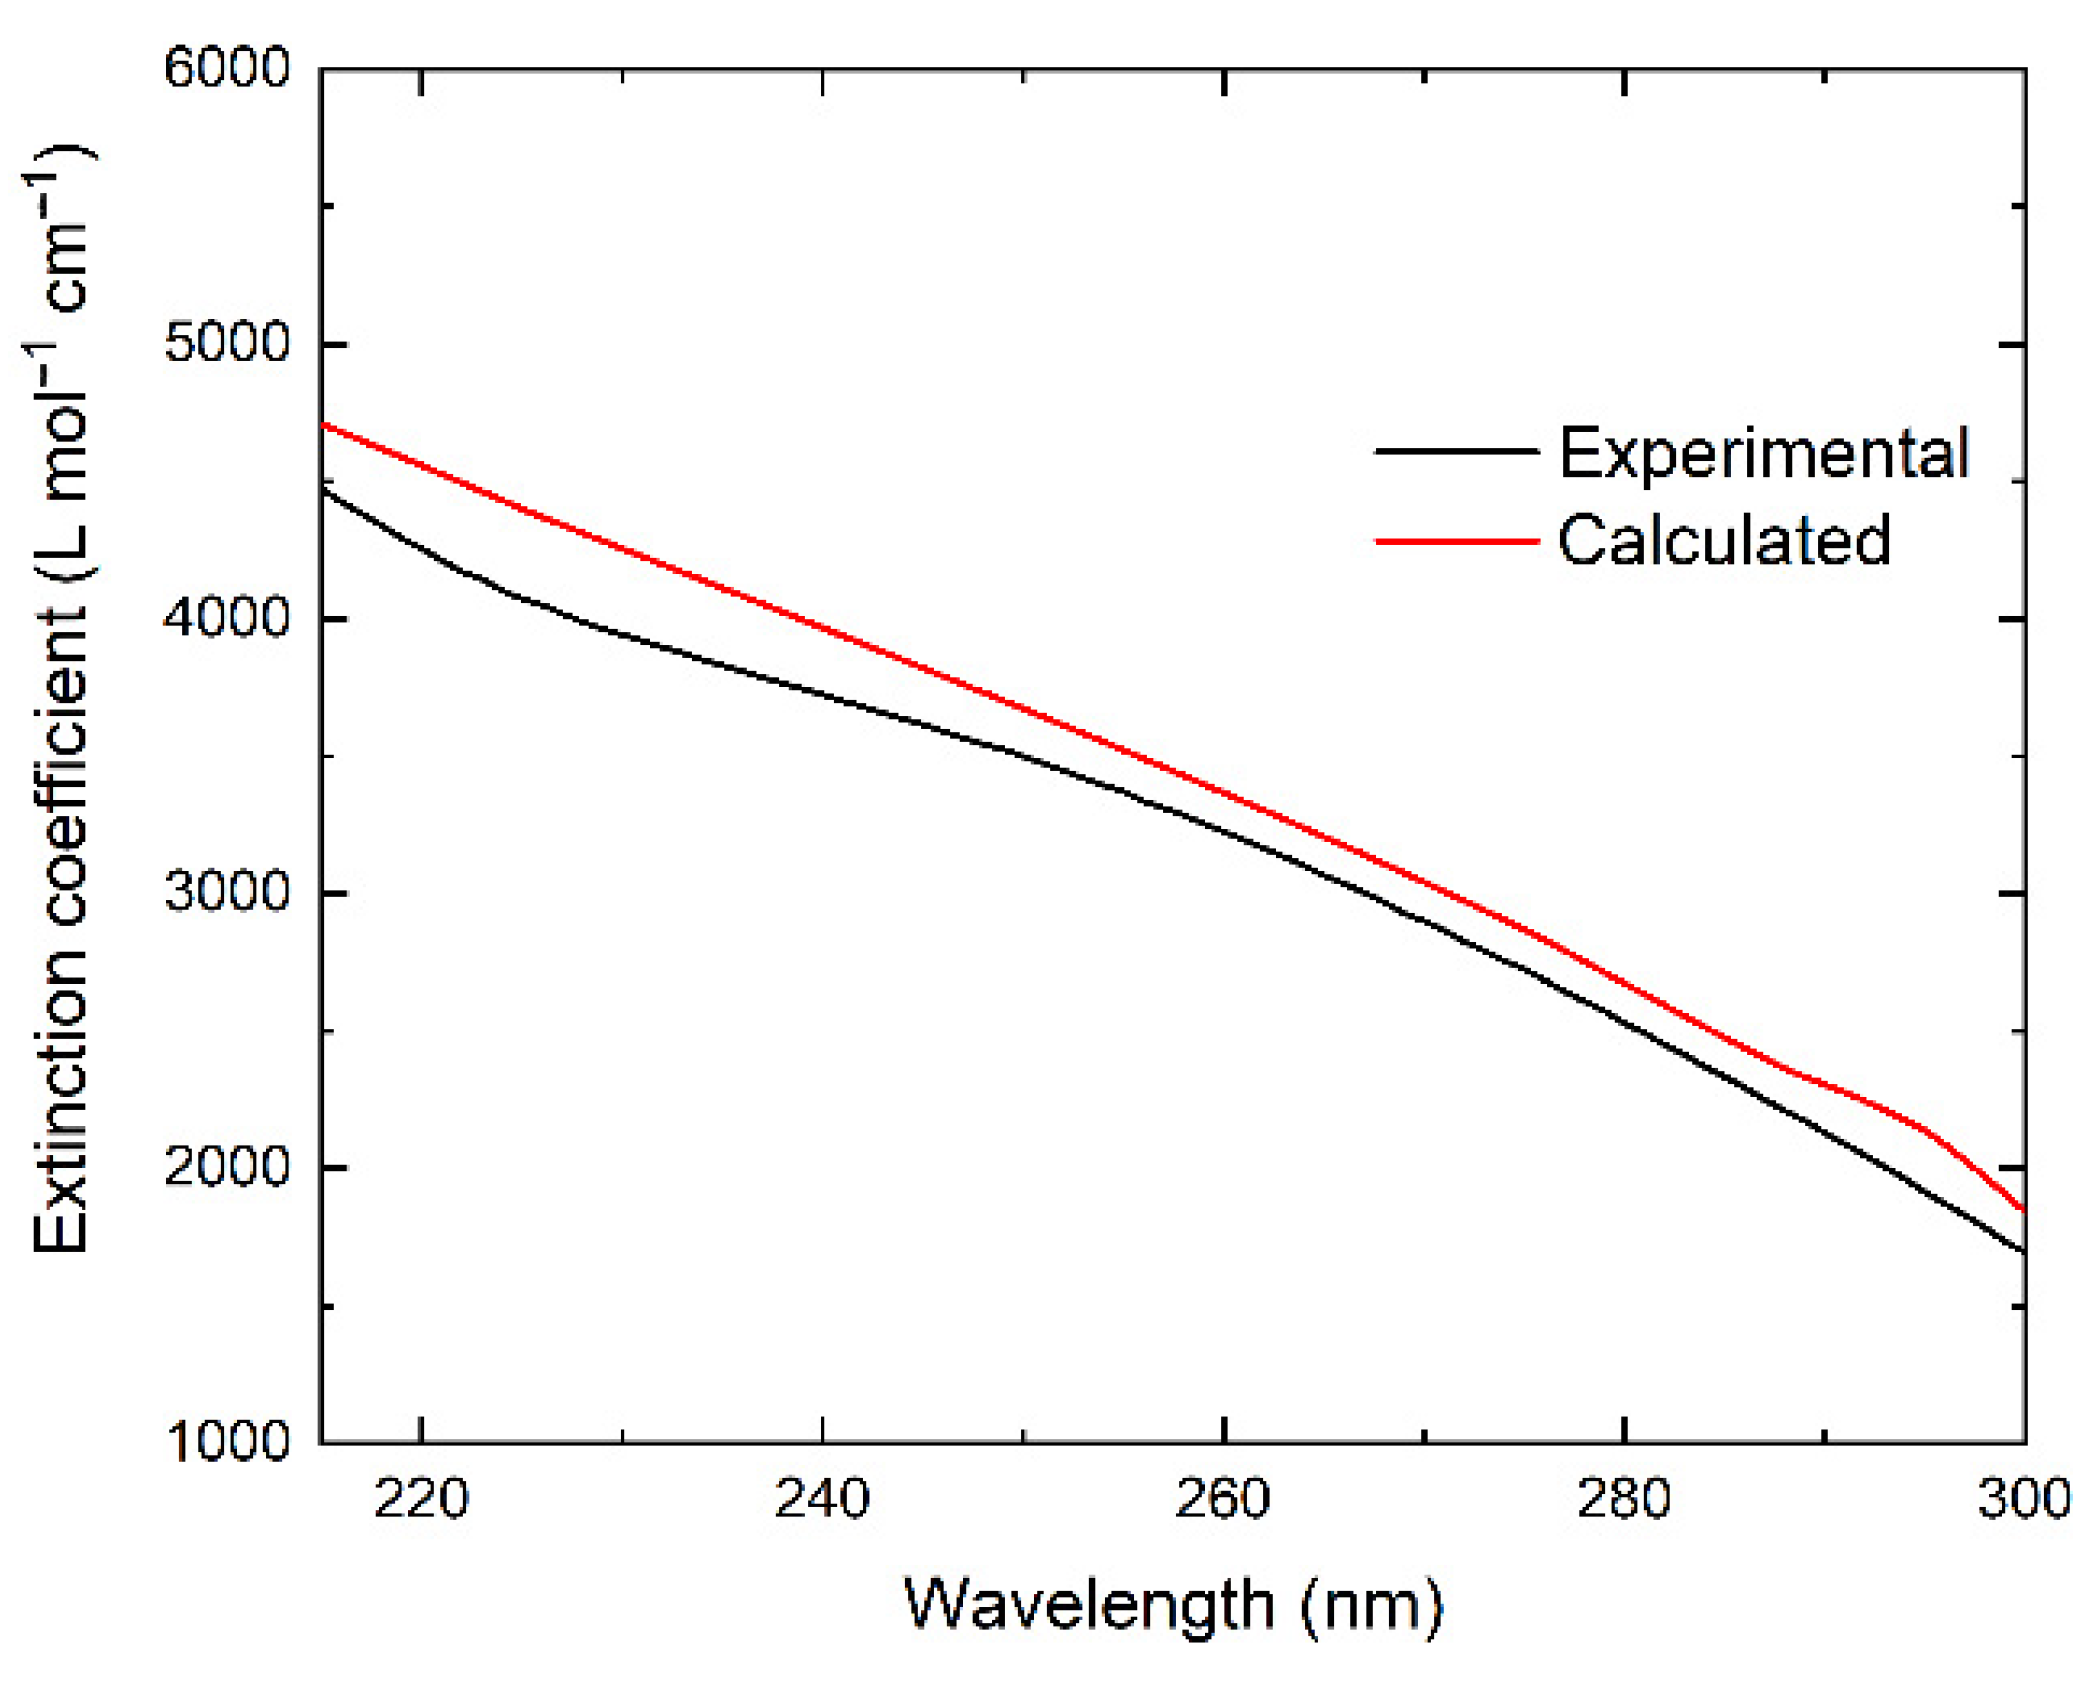
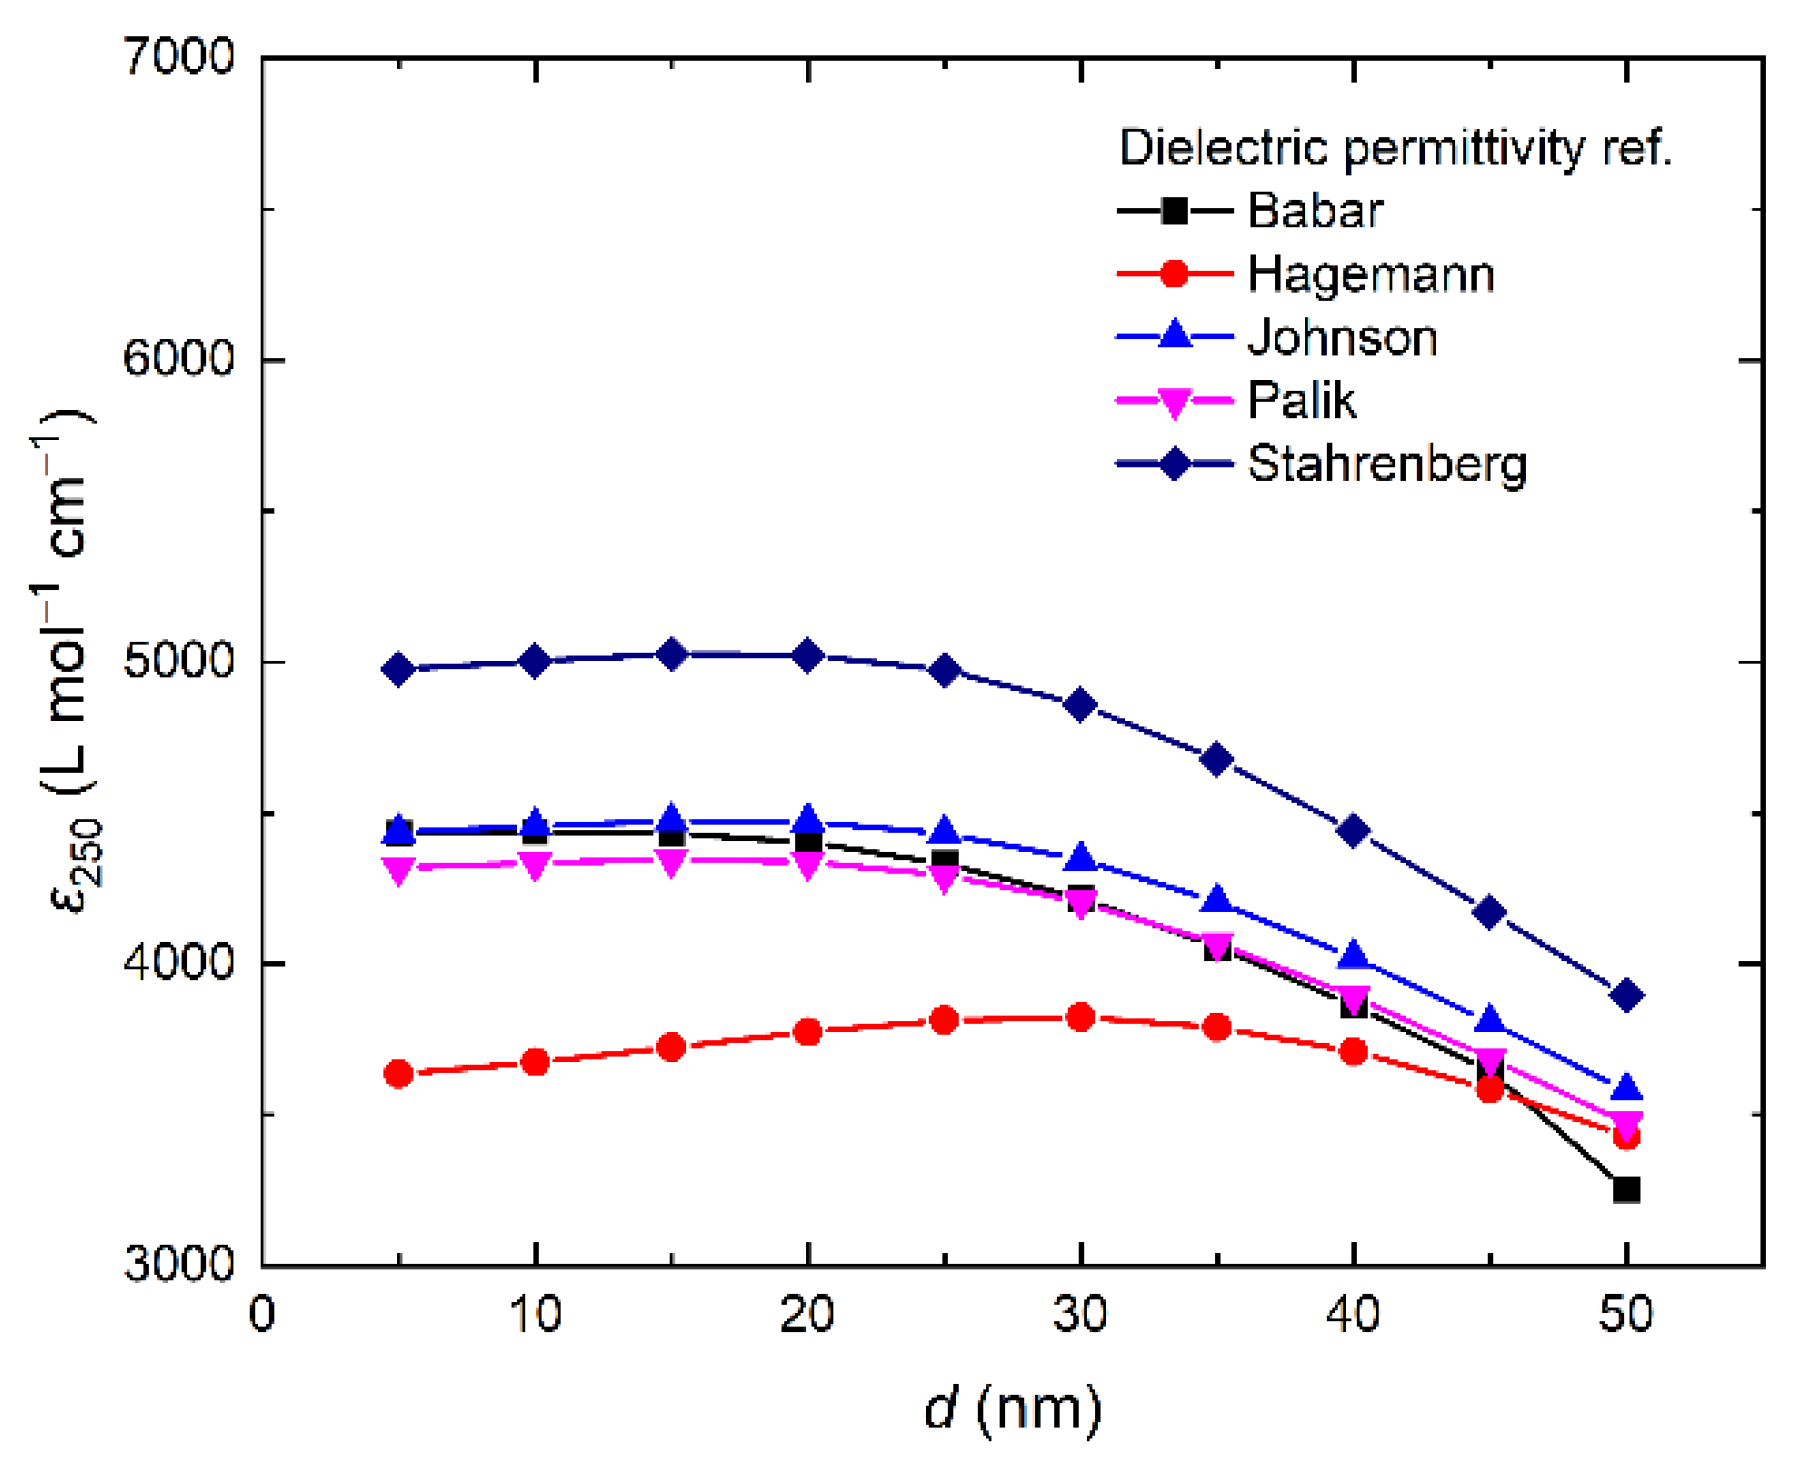
2.4. Theoretical Spectra Calculation
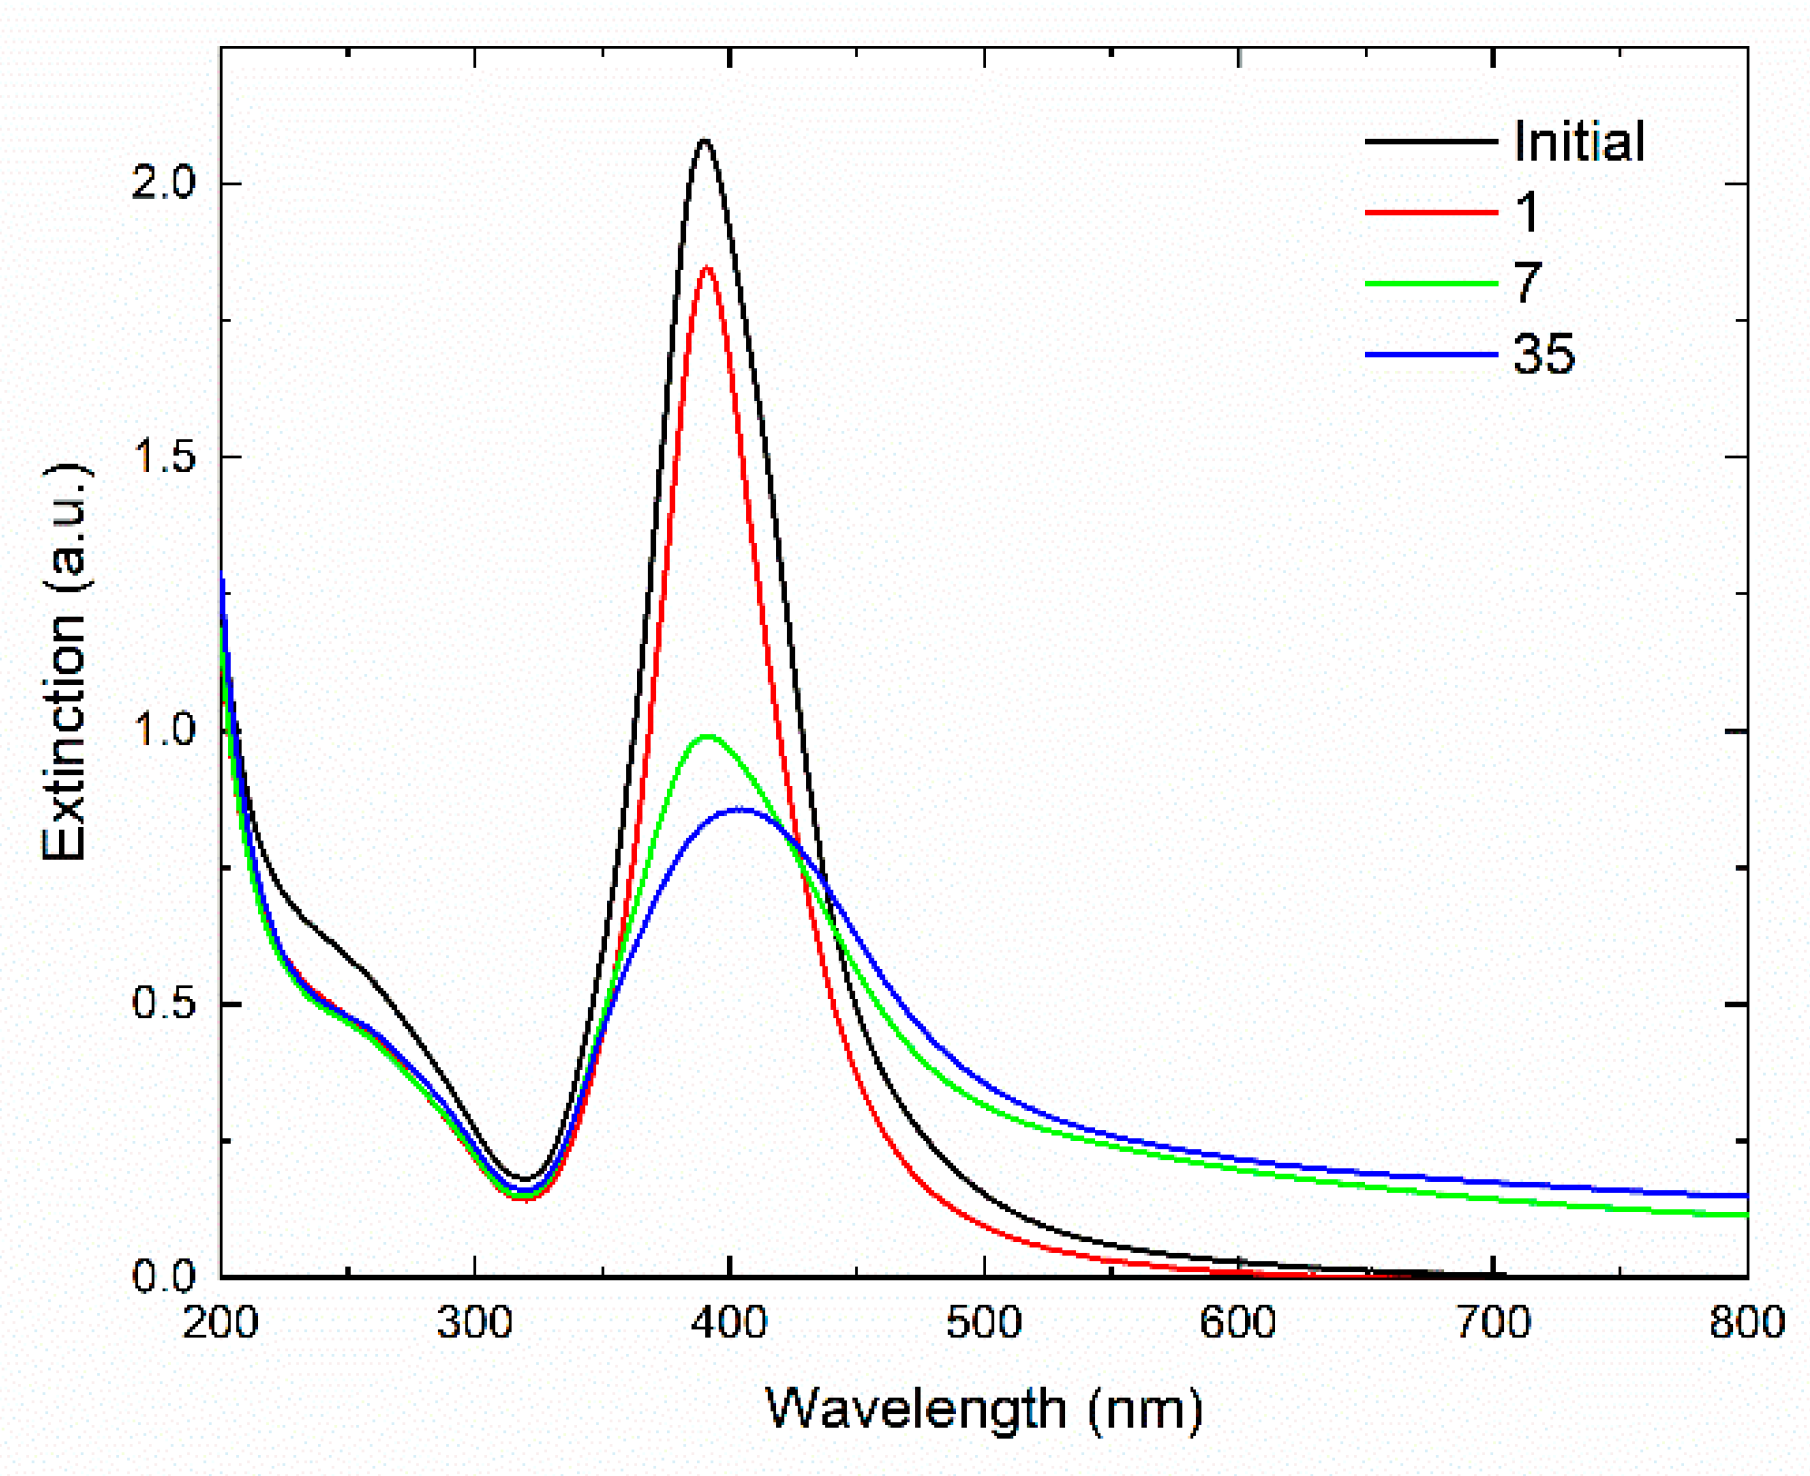
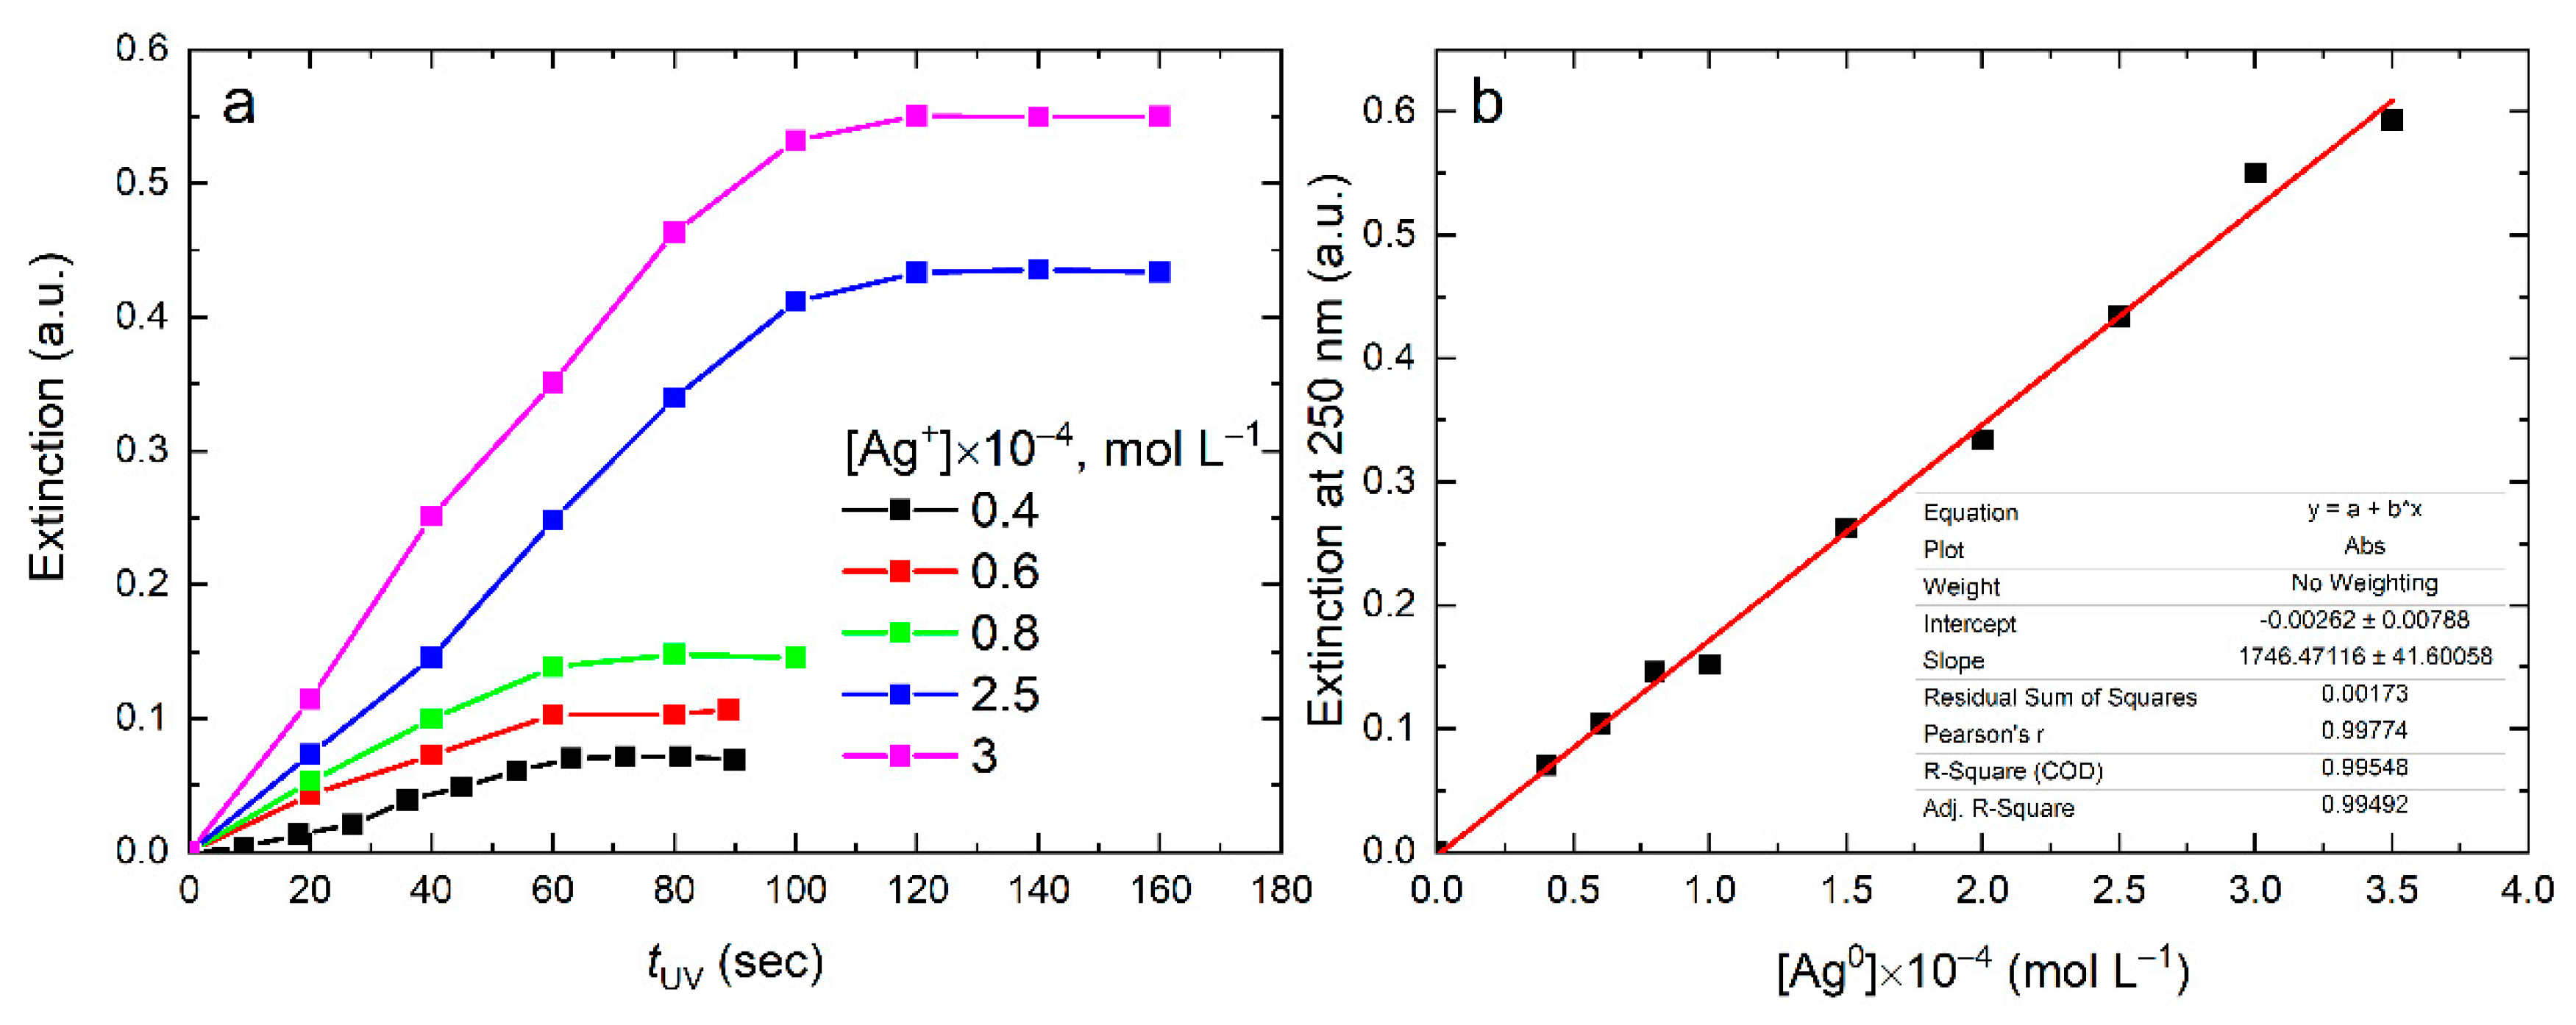
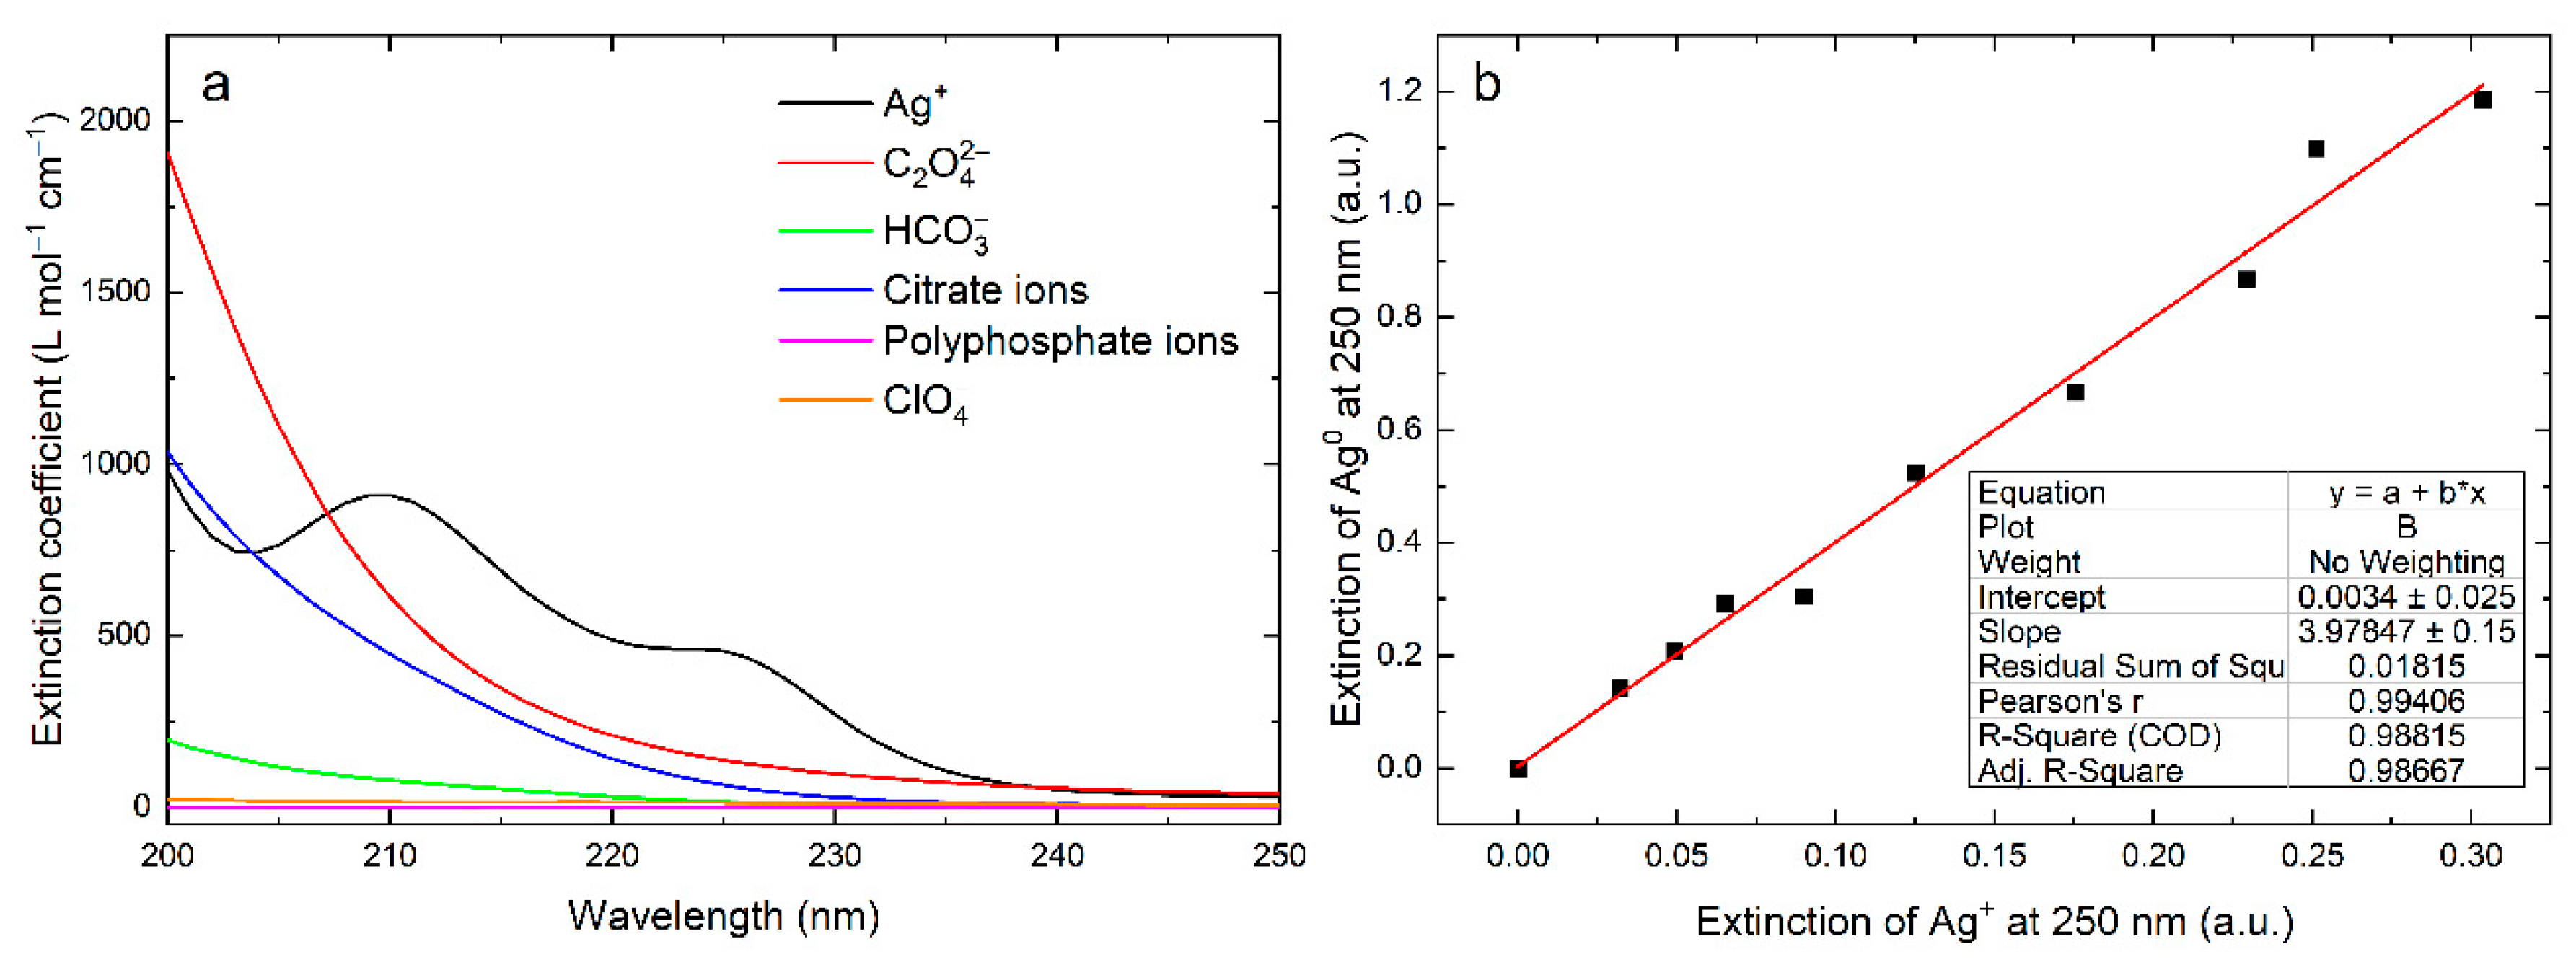
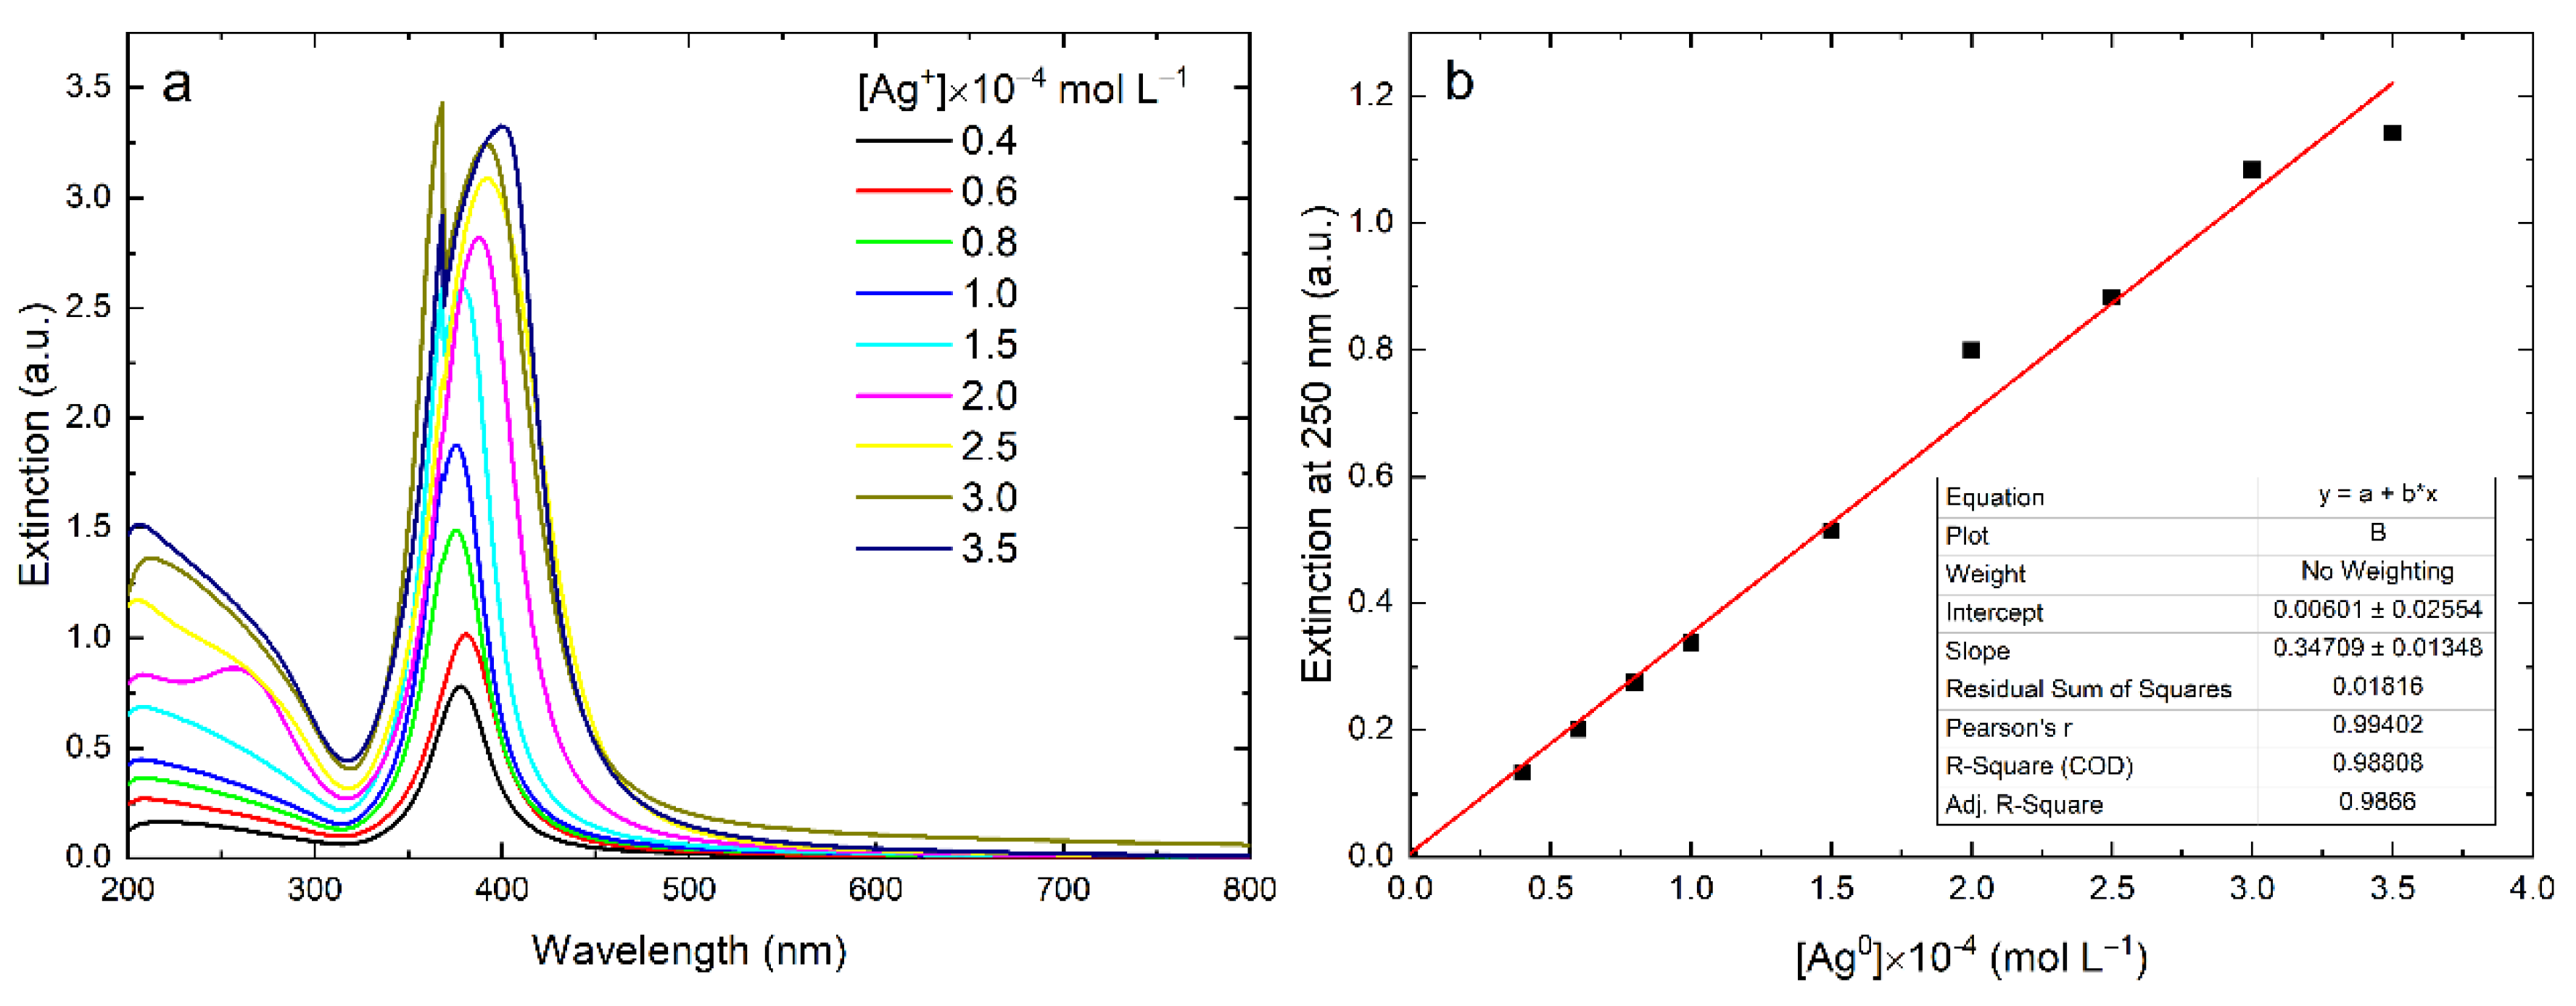
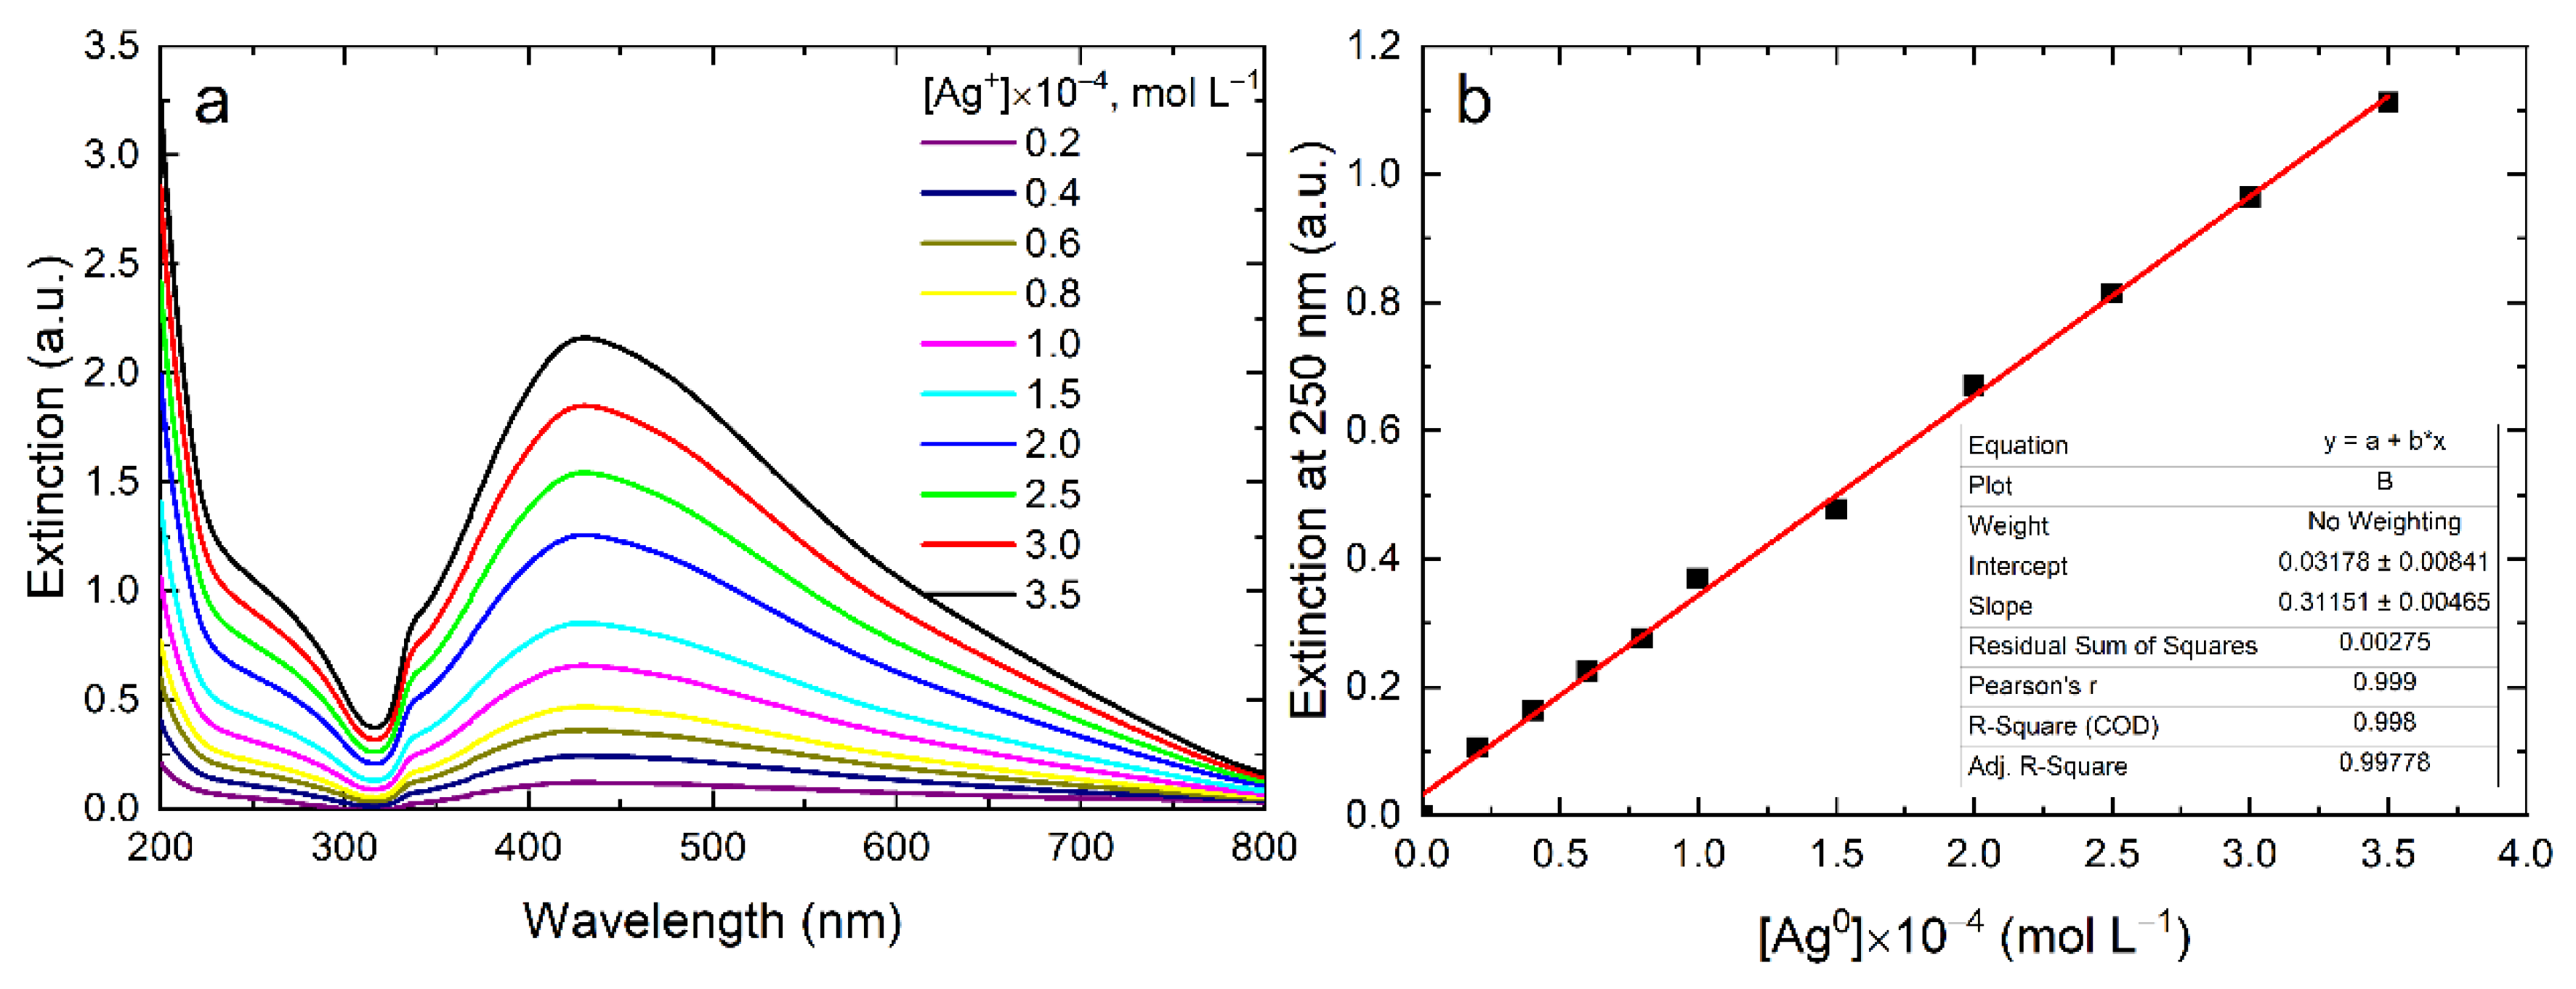
3. Results
4. Discussion
5. Conclusions
Supplementary Materials
Author Contributions
Funding
Data Availability Statement
Conflicts of Interest
References
- Piccinno, F.; Gottschalk, F.; Seeger, S.; Nowack, B. Industrial production quantities and uses of ten engineered nanomaterials in Europe and the world. J. Nanoparticle Res. 2012, 14, 1109. [Google Scholar] [CrossRef]
- Gunawan, C.; Marquis, C.P.; Amal, R.; Sotiriou, G.A.; Rice, S.A.; Harry, E.J. Widespread and Indiscriminate Nanosilver Use: Genuine Potential for Microbial Resistance. ACS Nano 2017, 11, 3438–3445. [Google Scholar] [CrossRef] [PubMed]
- Calderón-Jiménez, B.; Johnson, M.E.; Montoro Bustos, A.R.; Murphy, K.E.; Winchester, M.R.; Vega Baudrit, J.R. Silver Nanoparticles: Technological Advances, Societal Impacts, and Metrological Challenges. Front. Chem. 2017, 5, 6. [Google Scholar] [CrossRef] [PubMed]
- Kale, S.K.; Parishwad, G.V.; Husainy, A.S.N.; Patil, A.S. Emerging Agriculture Applications of Silver Nanoparticles. ES Food Agrofor. 2021, 3, 17–22. [Google Scholar] [CrossRef]
- Nedelcu, I.-A.; Ficai, A.; Sonmez, M.; Ficai, D.; Oprea, O.; Andronescu, E. Silver Based Materials for Biomedical Applications. Curr. Org. Chem. 2014, 18, 173–184. [Google Scholar] [CrossRef]
- Galatage, S.T.; Hebalkar, A.S.; Dhobale, S.V.; Mali, O.R.; Kumbhar, P.S.; Nikade, S.V.; Killedar, S.G. Silver Nanoparticles: Properties, Synthesis, Characterization, Applications and Future Trends. In Silver Micro-Nanoparticles—Properties, Synthesis, Characterization, and Applications; IntechOpen: London, UK, 2021. [Google Scholar]
- Marambio-Jones, C.; Hoek, E.M.V. A review of the antibacterial effects of silver nanomaterials and potential implications for human health and the environment. J. Nanoparticle Res. 2010, 12, 1531–1551. [Google Scholar] [CrossRef]
- Zhang, X.-F.; Liu, Z.-G.; Shen, W.; Gurunathan, S. Silver Nanoparticles: Synthesis, Characterization, Properties, Applications, and Therapeutic Approaches. Int. J. Mol. Sci. 2016, 17, 1534. [Google Scholar] [CrossRef]
- Ershov, V.; Tarasova, N.; Abkhalimov, E.; Safonov, A.; Sorokin, V.; Ershov, B. Photochemical Synthesis of Silver Hydrosol Stabilized by Carbonate Ions and Study of Its Bactericidal Impact on Escherichia coli: Direct and Indirect Effects. Int. J. Mol. Sci. 2022, 23, 949. [Google Scholar] [CrossRef]
- Gottschalk, F.; Sun, T.; Nowack, B. Environmental concentrations of engineered nanomaterials: Review of modeling and analytical studies. Environ. Pollut. 2013, 181, 287–300. [Google Scholar] [CrossRef]
- Abramenko, N.B.; Demidova, T.B.; Abkhalimov, E.V.; Ershov, B.G.; Krysanov, E.Y.; Kustov, L.M. Ecotoxicity of different-shaped silver nanoparticles: Case of zebrafish embryos. J. Hazard. Mater. 2018, 347, 89–94. [Google Scholar] [CrossRef]
- Scopus. Available online: https://www.scopus.com/search/form.uri?display=basic#basic (accessed on 26 August 2022).
- Nanotechnology Products Database|NPD. Available online: https://product.statnano.com/ (accessed on 26 August 2022).
- Lee, J.-S.; Lytton-Jean, A.K.R.; Hurst, S.J.; Mirkin, C.A. Silver Nanoparticle−Oligonucleotide Conjugates Based on DNA with Triple Cyclic Disulfide Moieties. Nano Lett. 2007, 7, 2112–2115. [Google Scholar] [CrossRef] [PubMed]
- Aslan, K.; Holley, P.; Geddes, C.D. Metal-enhanced fluorescence from silver nanoparticle-deposited polycarbonate substrates. J. Mater. Chem. 2006, 16, 2846–2852. [Google Scholar] [CrossRef]
- Haiss, W.; Thanh, N.T.K.; Aveyard, J.; Fernig, D.G. Determination of Size and Concentration of Gold Nanoparticles from UV−Vis Spectra. Anal. Chem. 2007, 79, 4215–4221. [Google Scholar] [CrossRef] [PubMed]
- Free, P.; Paramelle, D.; Bosman, M.; Hobley, J.; Fernig, D.G. Synthesis of Silver Nanoparticles with Monovalently Functionalized Self-Assembled Monolayers. Aust. J. Chem. 2012, 65, 275–282. [Google Scholar] [CrossRef]
- Skewis, L.R.; Reinhard, B.M. Control of Colloid Surface Chemistry through Matrix Confinement: Facile Preparation of Stable Antibody Functionalized Silver Nanoparticles. ACS Appl. Mater. Interfaces 2010, 2, 35–40. [Google Scholar] [CrossRef] [PubMed][Green Version]
- Mirjalili, M.; Yaghmaei, N.; Mirjalili, M. Antibacterial properties of nano silver finish cellulose fabric. J. Nanostructure Chem. 2013, 3, 43. [Google Scholar] [CrossRef]
- Creighton, J.A.; Eadon, D.G. Ultraviolet–visible absorption spectra of the colloidal metallic elements. J. Chem. Soc. Faraday Trans. 1991, 87, 3881–3891. [Google Scholar] [CrossRef]
- Bohren, C.F.; Huffman, D.R. Absorption and Scattering of Light by Small Particles; WILEY-VCH: Weinheim, Germany, 1998; ISBN 9780471293408. [Google Scholar]
- Kreibig, U.; Vollmer, M. Optical Properties of Metal Clusters; Springer Series in Materials Science; Springer: Berlin/Heidelberg, Germany, 1995; Volume 25, ISBN 978-3-642-08191-0. [Google Scholar]
- Charlé, K.-P.; Frank, F.; Schulze, W. The Optical Properties of Silver Microcrystallites in Dependence on Size and the Influence of the Matrix Environment. Ber. Bunsenges. Phys. Chem. 1984, 88, 350–354. [Google Scholar] [CrossRef]
- Link, S.; El-Sayed, M.A. Spectral Properties and Relaxation Dynamics of Surface Plasmon Electronic Oscillations in Gold and Silver Nanodots and Nanorods. J. Phys. Chem. B 1999, 103, 8410–8426. [Google Scholar] [CrossRef]
- Petit, C.; Lixon, P.; Pileni, M.P. In situ synthesis of silver nanocluster in AOT reverse micelles. J. Phys. Chem. 1993, 97, 12974–12983. [Google Scholar] [CrossRef]
- Mulvaney, P.; Giersig, M.; Henglein, A. Electrochemistry of multilayer colloids: Preparation and absorption spectrum of gold-coated silver particles. J. Phys. Chem. 1993, 97, 7061–7064. [Google Scholar] [CrossRef]
- Link, S.; Wang, Z.L.; El-Sayed, M.A. Alloy Formation of Gold−Silver Nanoparticles and the Dependence of the Plasmon Absorption on Their Composition. J. Phys. Chem. B 1999, 103, 3529–3533. [Google Scholar] [CrossRef]
- Evanoff, D.D.; Chumanov, G. Size-Controlled Synthesis of Nanoparticles. 2. Measurement of Extinction, Scattering, and Absorption Cross Sections. J. Phys. Chem. B 2004, 108, 13957–13962. [Google Scholar] [CrossRef]
- Zook, J.M.; Long, S.E.; Cleveland, D.; Geronimo, C.L.A.; MacCuspie, R.I. Measuring silver nanoparticle dissolution in complex biological and environmental matrices using UV–visible absorbance. Anal. Bioanal. Chem. 2011, 401, 1993–2002. [Google Scholar] [CrossRef]
- Navarro, J.R.G.; Werts, M.H.V. Resonant light scattering spectroscopy of gold, silver and gold–silver alloy nanoparticles and optical detection in microfluidic channels. Analyst 2012, 138, 583–592. [Google Scholar] [CrossRef] [PubMed]
- Santillán, J.M.J.; Videla, F.A.; Fernández van Raap, M.B.; Muraca, D.; Scaffardi, L.B.; Schinca, D.C. Influence of size-corrected bound-electron contribution on nanometric silver dielectric function. Sizing through optical extinction spectroscopy. J. Phys. D. Appl. Phys. 2013, 46, 435301. [Google Scholar] [CrossRef]
- Paramelle, D.; Sadovoy, A.; Gorelik, S.; Free, P.; Hobley, J.; Fernig, D.G. A rapid method to estimate the concentration of citrate capped silver nanoparticles from UV-visible light spectra. Analyst 2014, 139, 4855–4861. [Google Scholar] [CrossRef]
- Ershov, V.; Tarasova, N.; Ershov, B. Evolution of Electronic State and Properties of Silver Nanoparticles during Their Formation in Aqueous Solution. Int. J. Mol. Sci. 2021, 22, 10673. [Google Scholar] [CrossRef]
- Abkhalimov, E.V.; Ershov, V.A.; Ershov, B.G. “Pure” silver hydrosol: Nanoparticles and stabilizing carbonate ions. J. Nanoparticle Res. 2019, 21, 93. [Google Scholar] [CrossRef]
- Abkhalimov, E.V.; Ershov, V.A.; Ershov, B.G. An aqueous colloidal silver solution stabilized with carbonate ions. Colloid J. 2017, 79, 735–739. [Google Scholar] [CrossRef]
- Métraux, G.S.; Mirkin, C.A. Rapid Thermal Synthesis of Silver Nanoprisms with Chemically Tailorable Thickness. Adv. Mater. 2005, 17, 412–415. [Google Scholar] [CrossRef]
- Laven, P. MiePlot (v.4.6.21). 2021. Available online: http://www.philiplaven.com/mieplot.htm (accessed on 26 August 2022).
- Babar, S.; Weaver, J.H. Optical constants of Cu, Ag, and Au revisited. Appl. Opt. 2015, 54, 477–481. [Google Scholar] [CrossRef]
- Hagemann, H.-J.; Gudat, W.; Kunz, C. Optical constants from the far infrared to the x-ray region: Mg, Al, Cu, Ag, Au, Bi, C, and Al2O3. J. Opt. Soc. Am. 1975, 65, 742–744. [Google Scholar] [CrossRef]
- Johnson, P.B.; Christy, R.W. Optical Constants of the Noble Metals. Phys. Rev. B 1972, 6, 4370–4379. [Google Scholar] [CrossRef]
- Palik, E.D. Handbook of Optical Constants of Solids; Elsevier: Amsterdam, The Netherlands, 1985; Volume 1, ISBN 9780080547213. [Google Scholar]
- Stahrenberg, K.; Herrmann, T.; Wilmers, K.; Esser, N.; Richter, W.; Lee, M.J.G. Optical properties of copper and silver in the energy range 2.5–9.0 eV. Phys. Rev. B 2001, 64, 115111. [Google Scholar] [CrossRef]
- International Association for the Properties of Water and Steam. Available online: http://www.iapws.org/ (accessed on 26 January 2022).
- Segelstein, D.J. The Complex Refractive Index of Water; University of Missouri-Kansas City: Kansas City, MO, USA, 1981. [Google Scholar]
- Wardman, P. Reduction Potentials of One-Electron Couples Involving Free Radicals in Aqueous Solution. J. Phys. Chem. Ref. Data 1989, 18, 1637–1755. [Google Scholar] [CrossRef]
- Buxton, G.V.; Greenstock, C.L.; Helman, W.P.; Ross, A.B. Critical Review of rate constants for reactions of hydrated electrons, hydrogen atoms and hydroxyl radicals (·OH/·O− in Aqueous Solution. J. Phys. Chem. Ref. Data 1988, 17, 513–886. [Google Scholar] [CrossRef]
- Ali, I.; Imkan; Ullah, S.; Ahmed, F.; Yasmeen, S.; Imran, M.; Althagafi, I.I.; Shah, M.R. Synthesis and characterization of triazole stabilized silver nanoparticles as colorimetric probe for mercury. Colloids Surf. A Physicochem. Eng. Asp. 2021, 629, 127419. [Google Scholar] [CrossRef]
- Soto, K.M.; Quezada-Cervantes, C.T.; Hernández-Iturriaga, M.; Luna-Bárcenas, G.; Vazquez-Duhalt, R.; Mendoza, S. Fruit peels waste for the green synthesis of silver nanoparticles with antimicrobial activity against foodborne pathogens. LWT 2019, 103, 293–300. [Google Scholar] [CrossRef]
- Zozulya, G.; Kuntyi, O.; Mnykh, R.; Kytsya, A.; Bazylyak, L. Synthesis of silver nanoparticles by sonogalvanic replacement on aluminium powder in sodium polyacrylate solutions. Ultrason. Sonochem. 2022, 84, 105951. [Google Scholar] [CrossRef]
- Mirajkar, S.; Rathod, P.; Pawar, B.; Penna, S.; Dalvi, S. γ-Irradiated Chitosan Mediates Enhanced Synthesis and Antimicrobial Properties of Chitosan–Silver (Ag) Nanocomposites. ACS Omega 2021, 6, 34812–34822. [Google Scholar] [CrossRef]
- Muhammad, S.P.; Shah, M.R.; Ullah, R.; Ahmad, I.; Ali, K. Synthesis and Characterization of Functionalized Silver Nanoparticles for Selective Screening of Mercury (II) Ions. Arab. J. Sci. Eng. 2022, 47, 7135–7145. [Google Scholar] [CrossRef]
- Zheng, M.; Wang, C.; Wang, Y.; Wei, W.; Ma, S.; Sun, X.; He, J. Green synthesis of carbon dots functionalized silver nanoparticles for the colorimetric detection of phoxim. Talanta 2018, 185, 309–315. [Google Scholar] [CrossRef] [PubMed]


| Type of NPs | Surfactant | dTEM (nm) | dDLS (nm) | ζ-Potential (mV) |
|---|---|---|---|---|
| Sphere | Carbonate | 9.9 ± 1.3 | 12.2 ± 1.8 | –68.3 |
| Sphere | Polyphosphate | 4.3 ± 0.7 | 6.5 ± 1.3 | –56.8 |
| TNP | Citrate | 22.8 ± 4.7; 9.8 ± 1.2 | - | –63.9 |
| Sample | d-Spacing (Å)/Miller Indices (hkl) | Lattice Parameter (nm) | |||
|---|---|---|---|---|---|
| 111 | 200 | 220 | 311 | ||
| Standard Ag * | 2.35 | 2.04 | 1.443 | 1.23 | 4.079 |
| Polyphosphate | 2.49 | 2.11 | - | - | 4.266 |
| Carbonate | 2.35 | 2.06 | 1.44 | 1.23 | 4.085 |
| TNP | 2.50 | 2.02 | 1.44 | 1.24 | 4.184 |
| Type of NPs | Surfactant | [Ag] × 10–4, mol L−1 | Extinction at 250 nm | ε, L mole−1 cm−1 | d, nm | Ref. |
|---|---|---|---|---|---|---|
| Sphere | HCO3– | 0.4–3.0 | 0.07–0.6 * | 3493 ± 83 | 8–12 | This work |
| Sphere | NaPp | 0.4–3.5 | 0.13–1.14 | 3471 ± 135 | 4.3 ± 0.7 | This work |
| TNP | Citrate | 0.2–3.5 | 0.1–1.1 | 3115 ± 47 | Length 30; Thickness 8 | This work |
| Sphere | Benzotriazole | 0.5 | 0.15 | 3000 | 40–50 | [47] |
| Sphere | Grape seed extract | 1 | 0.375 | 3750 ** | 3–14 | [48] |
| Quasi-spherical | PANa | 2 | 0.754 | 3770 ** | 4–25 | [49] |
| Sphere | Chitosane | 1.47 | 0.25 * | 3400 | 13–20 | [50] |
| Sphere | N-(3,5-bis (trifluoromethyl) phenyl)-2-(4-chlorophenyl) hydrazine carbothioamide (ThAm) | 0.38 | 0.13 | 3420 | 11 | [51] |
| Sphere | At carbon dots | 1.15 | 0.38 | 3300 | 7 nm | [52] |
| [Ag], µg L−1 | Measured by ICP-MS (ppb) | Calculated by UV–Vis (ppb) | Error (%) |
|---|---|---|---|
| 50 | 61 | 70 | 14.4 |
| 100 | 113 | 126 | 11.8 |
| 500 | 525 | 500 | 4.7 |
| 1000 | 987 | 1051 | 6.5 |
| 5000 | 5170 | 5030 | 2.7 |
| 10,000 | 10,464 | 10,142 | 3.1 |
Publisher’s Note: MDPI stays neutral with regard to jurisdictional claims in published maps and institutional affiliations. |
© 2022 by the authors. Licensee MDPI, Basel, Switzerland. This article is an open access article distributed under the terms and conditions of the Creative Commons Attribution (CC BY) license (https://creativecommons.org/licenses/by/4.0/).
Share and Cite
Abkhalimov, E.; Ershov, V.; Ershov, B. Determination of the Concentration of Silver Atoms in Hydrosol Nanoparticles. Nanomaterials 2022, 12, 3091. https://doi.org/10.3390/nano12183091
Abkhalimov E, Ershov V, Ershov B. Determination of the Concentration of Silver Atoms in Hydrosol Nanoparticles. Nanomaterials. 2022; 12(18):3091. https://doi.org/10.3390/nano12183091
Chicago/Turabian StyleAbkhalimov, Evgeny, Vadim Ershov, and Boris Ershov. 2022. "Determination of the Concentration of Silver Atoms in Hydrosol Nanoparticles" Nanomaterials 12, no. 18: 3091. https://doi.org/10.3390/nano12183091
APA StyleAbkhalimov, E., Ershov, V., & Ershov, B. (2022). Determination of the Concentration of Silver Atoms in Hydrosol Nanoparticles. Nanomaterials, 12(18), 3091. https://doi.org/10.3390/nano12183091