
Low-Cost, High-Yield ZnO Nanostars Synthesis for Pseudocapacitor Applications


 ,
, 
 , and
, and 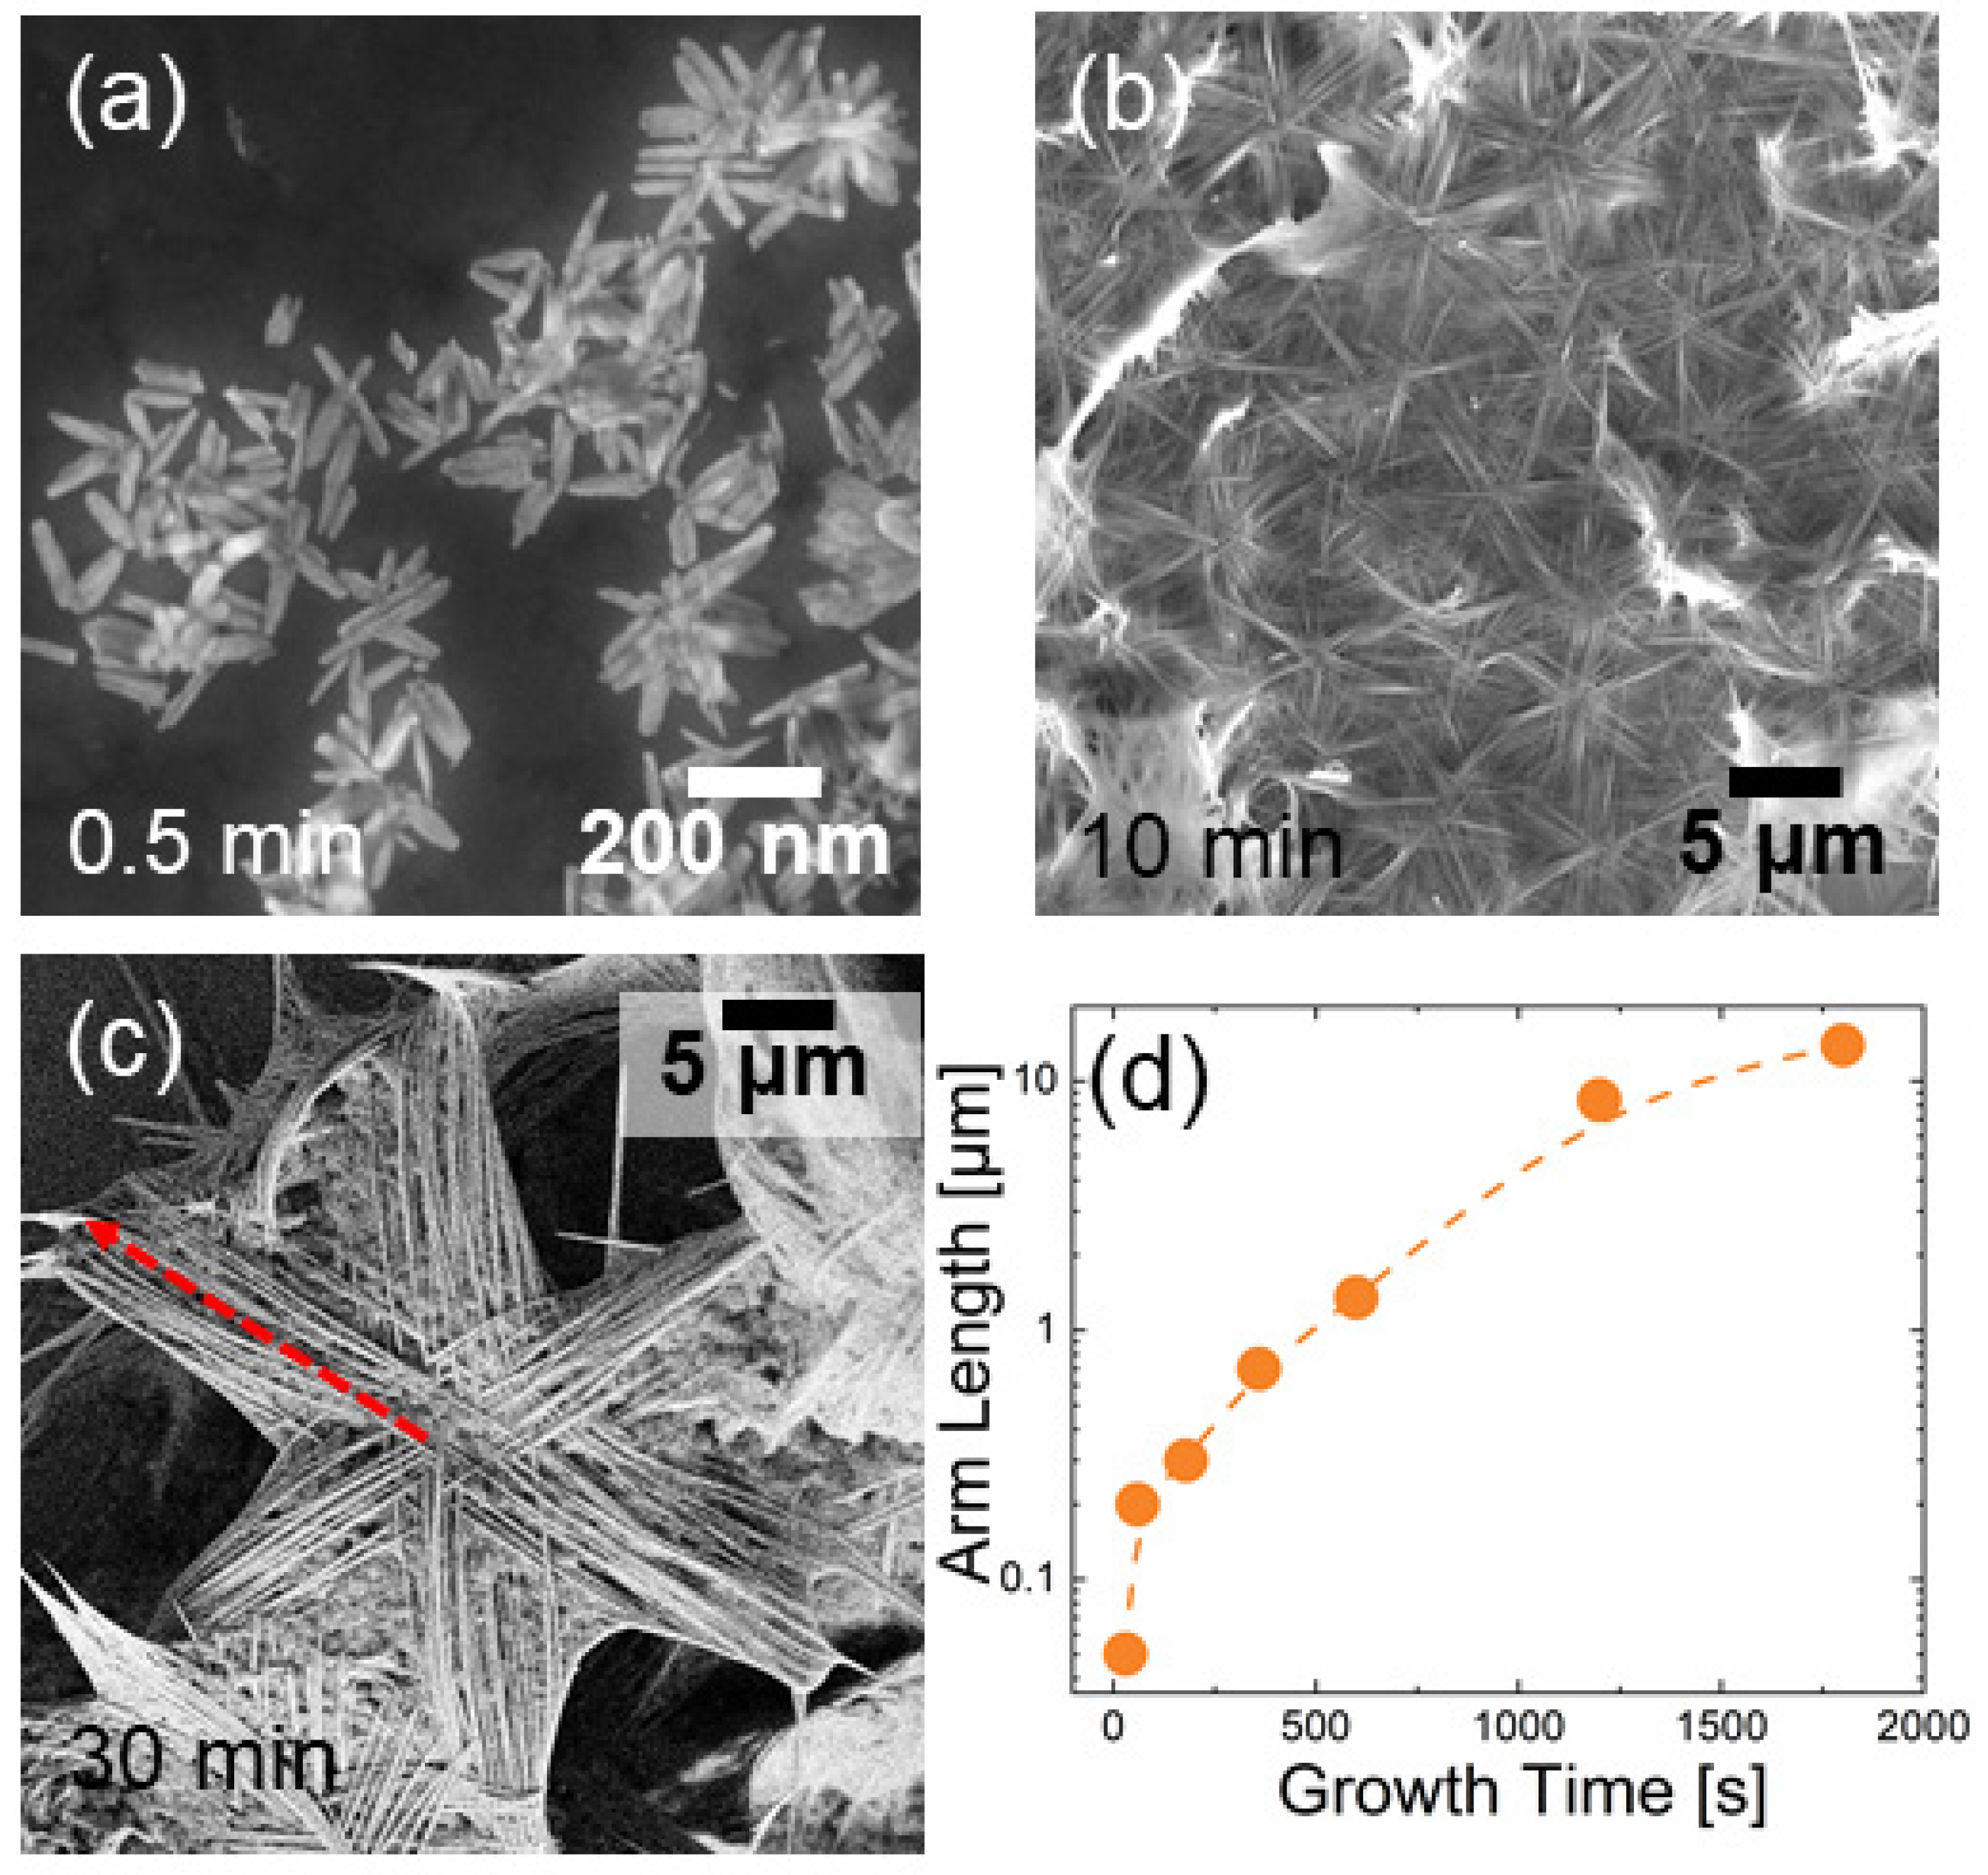
Abstract
:1. Introduction
2. Materials and Methods
2.1. Synthesis of ZnO Nanostars
2.2. Characterization
3. Results and Discussion
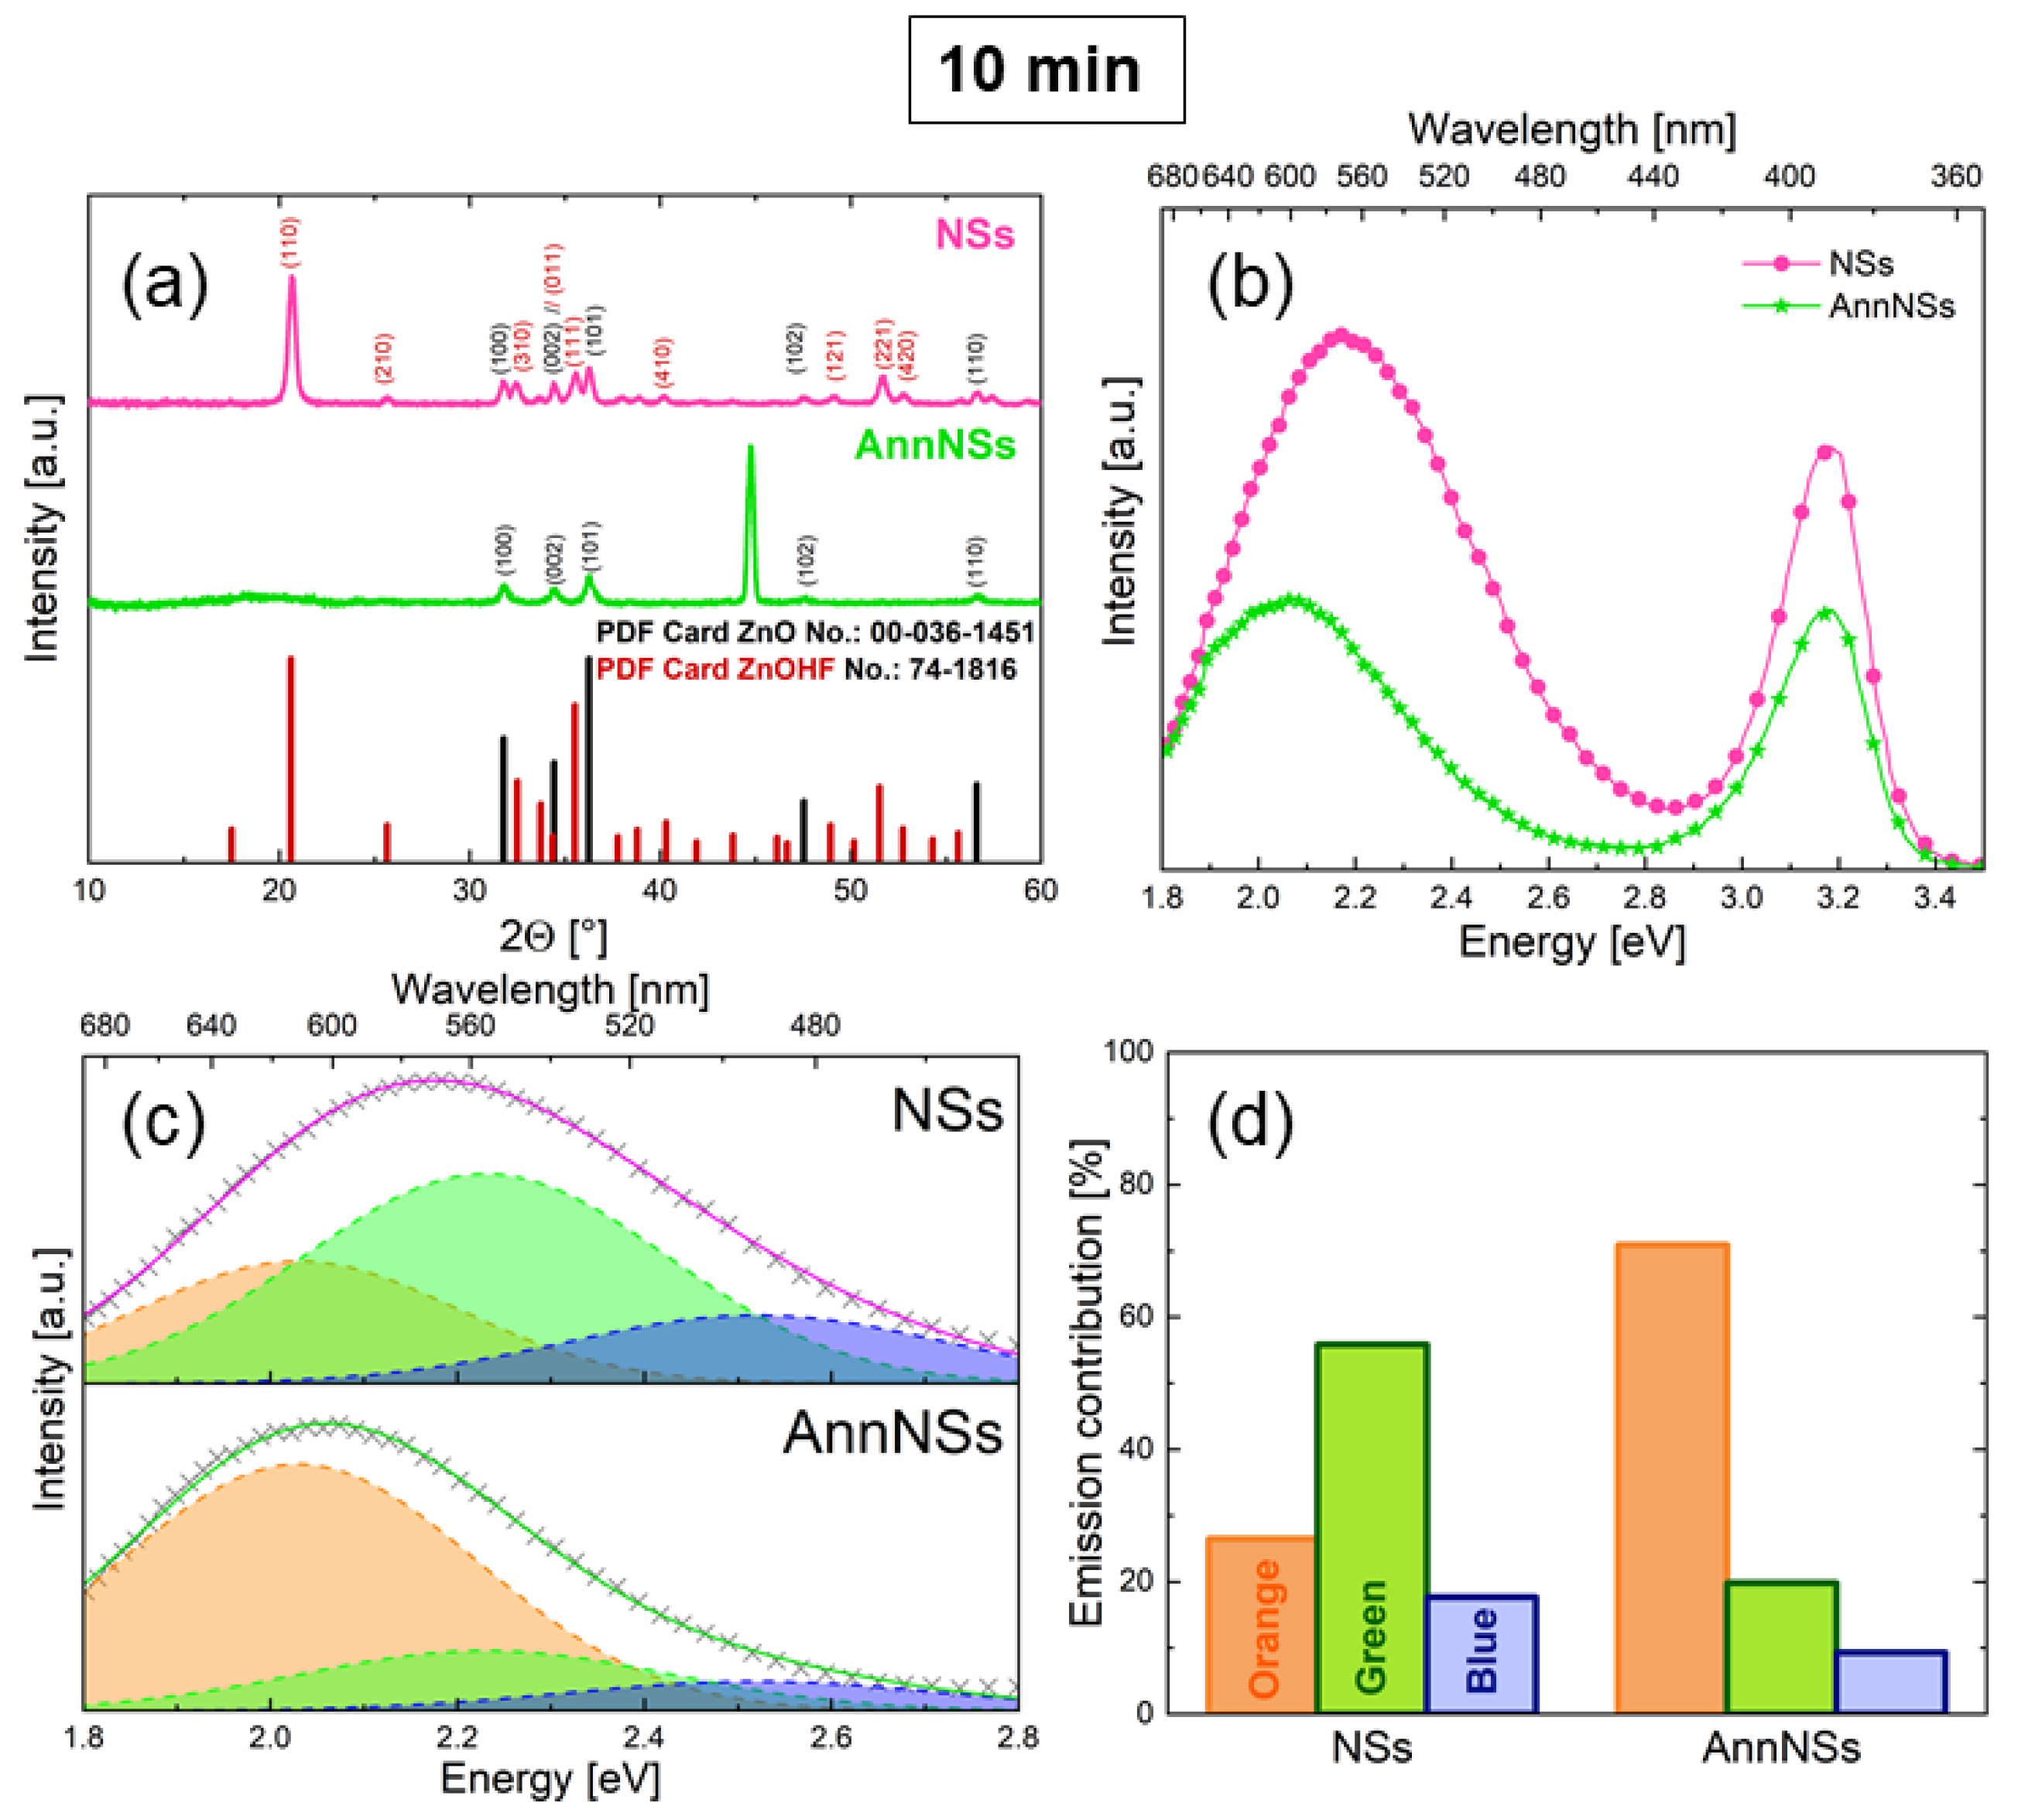
3.1. Material Characterization
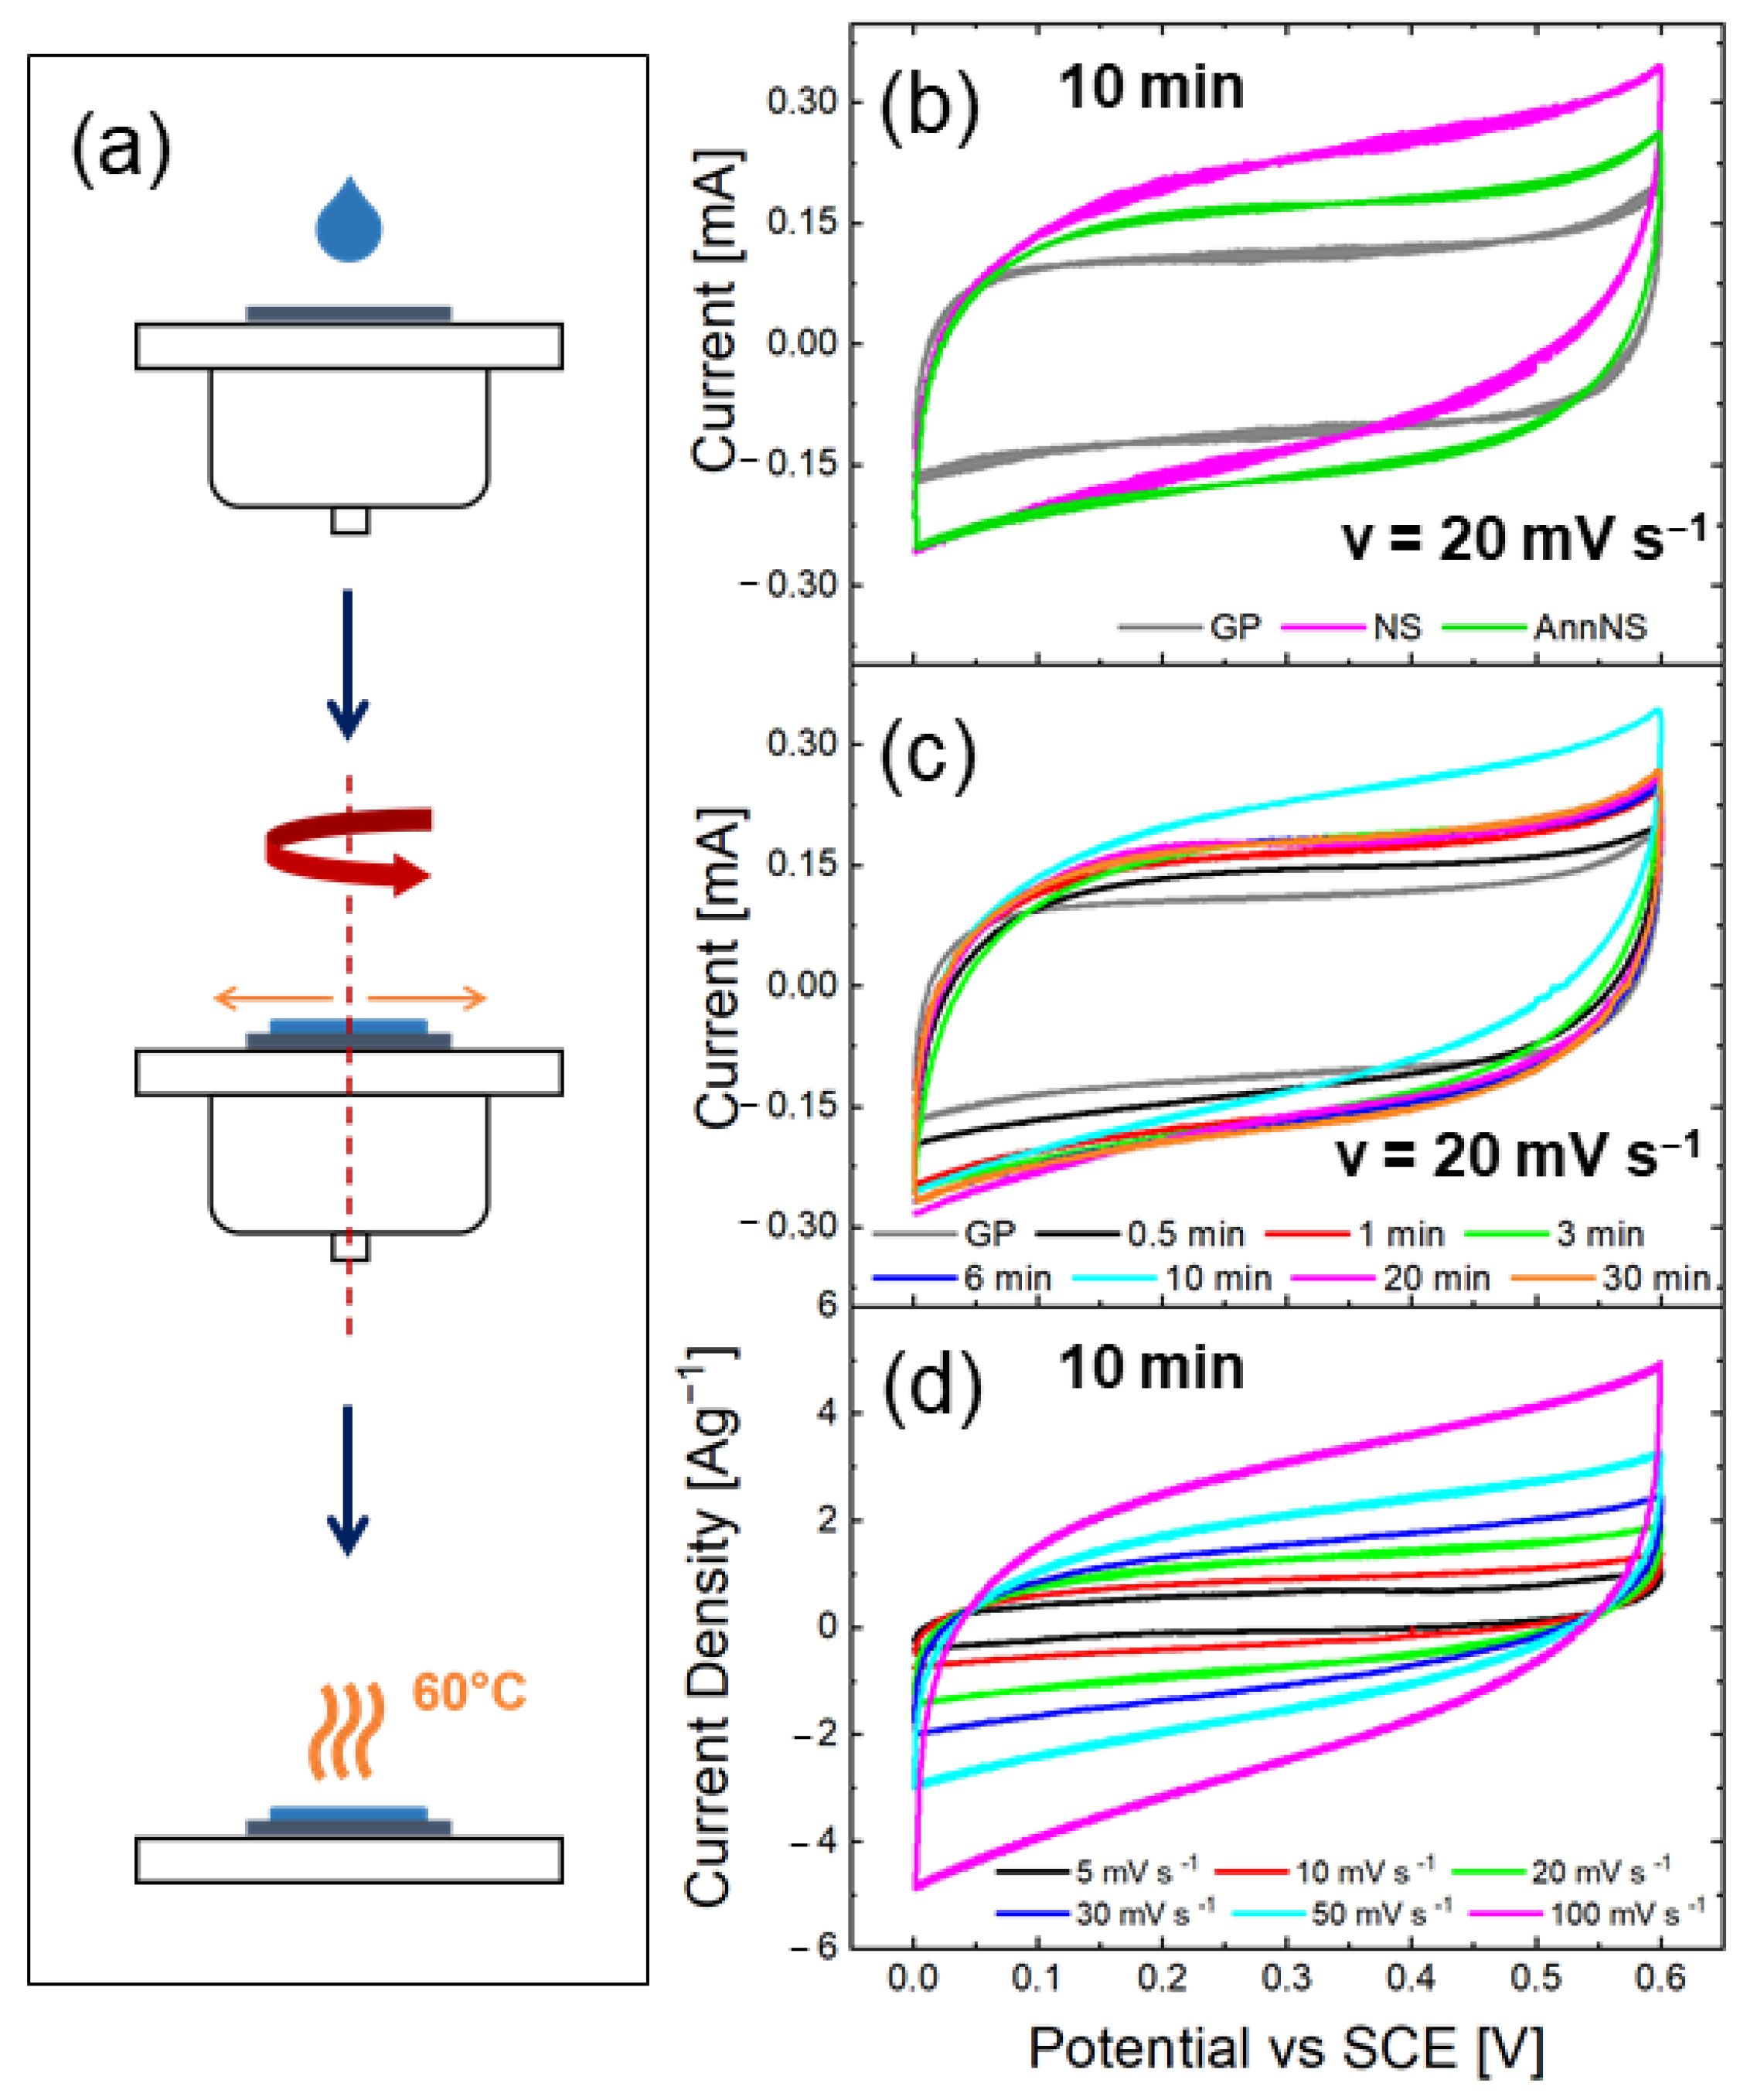
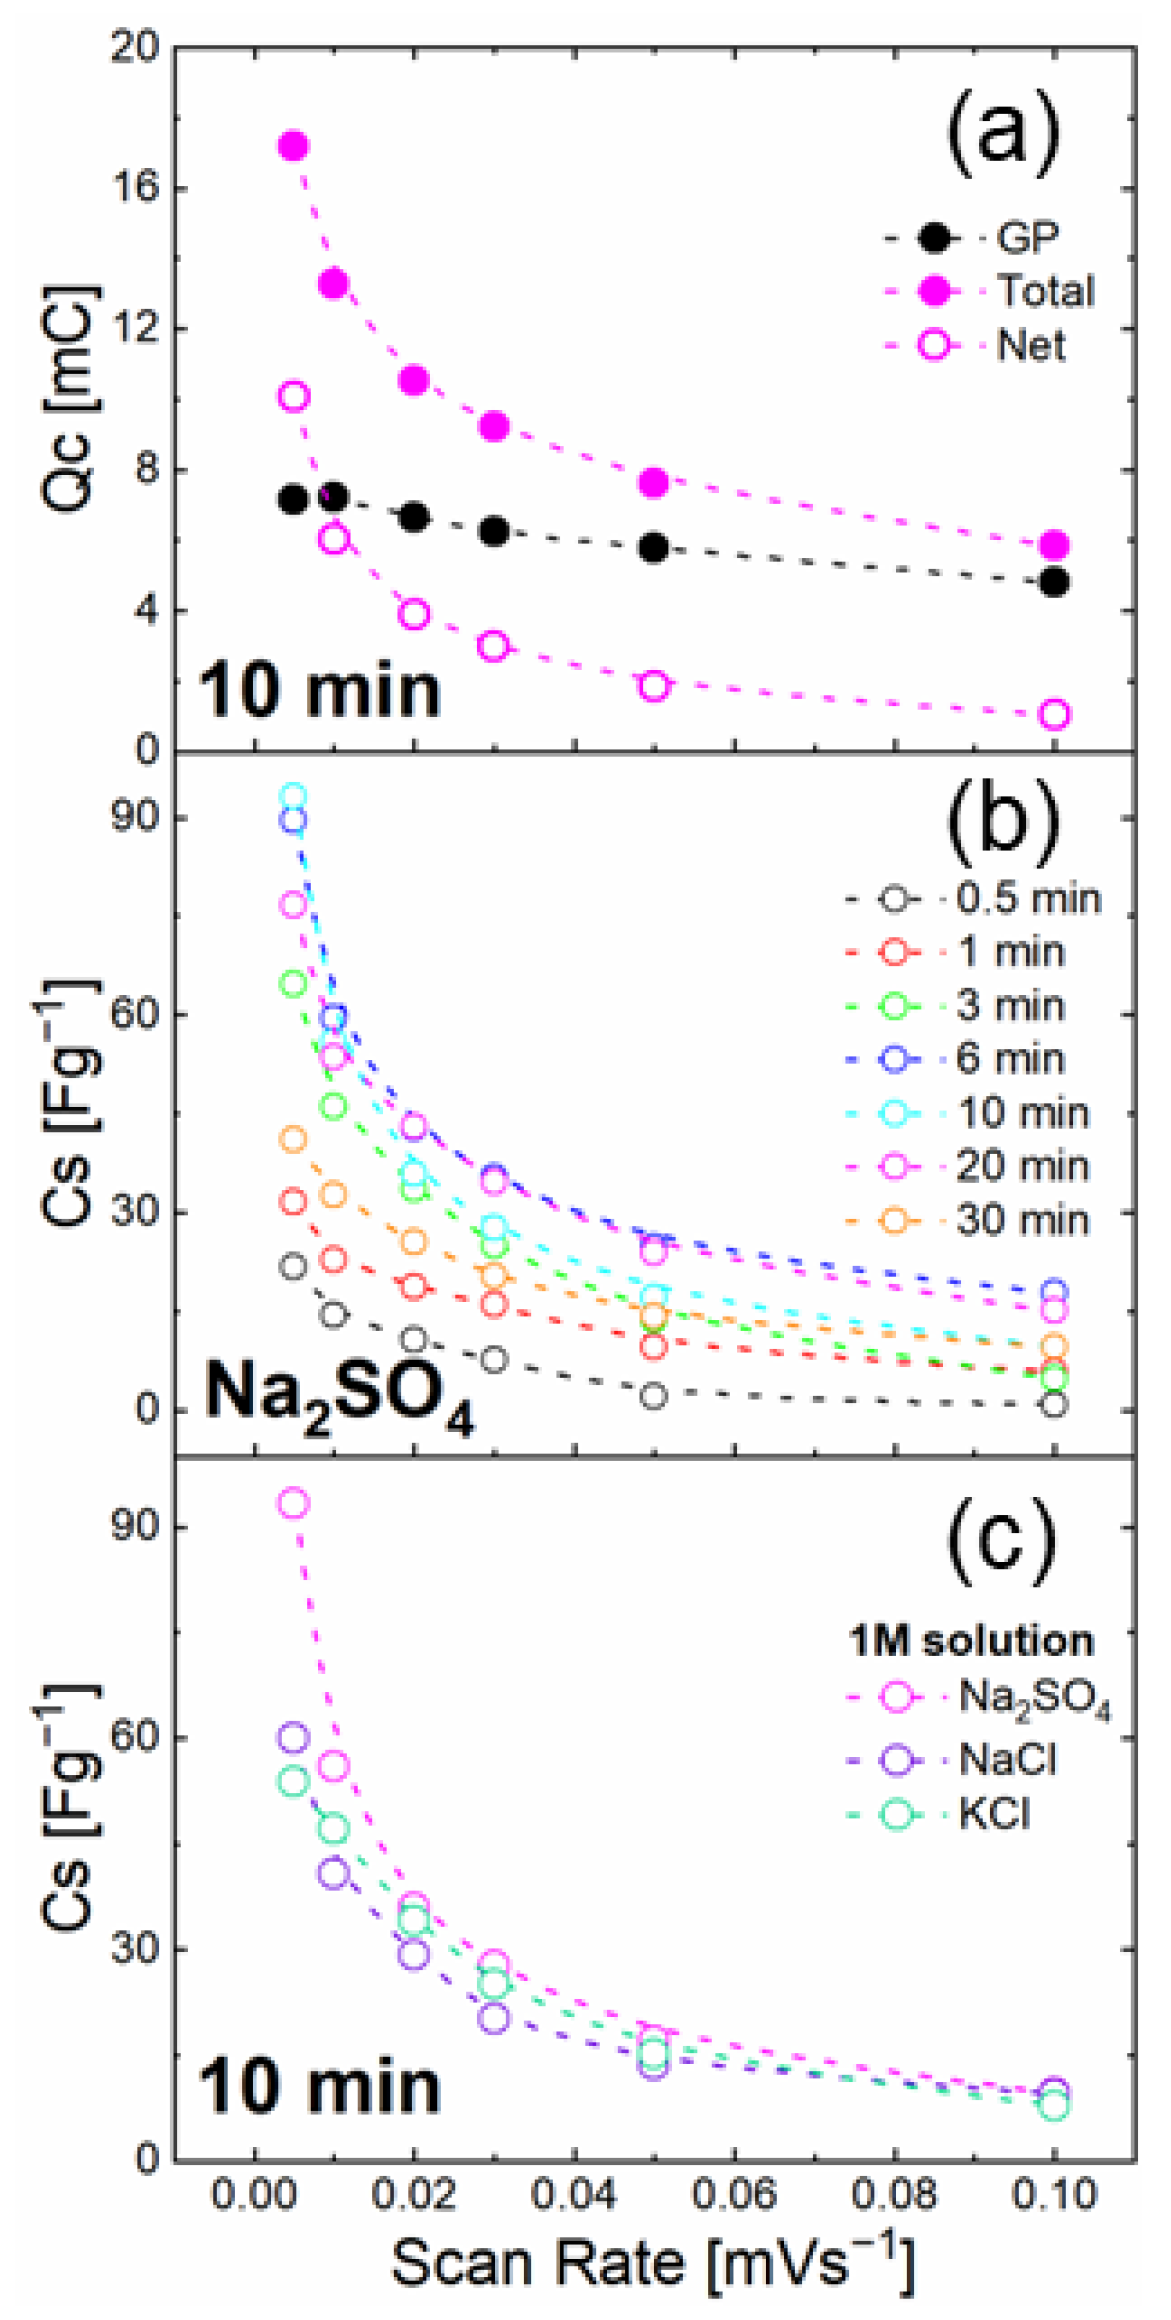
3.2. Electrochemical Measurements
4. Conclusions
Supplementary Materials
Author Contributions
Funding
Institutional Review Board Statement
Informed Consent Statement
Data Availability Statement
Acknowledgments
Conflicts of Interest
References
- IEA. Electricity. 2020. Available online: www.iea.org (accessed on 1 June 2022).
- Abas, N.; Kalair, A.; Khan, N. Review of Fossil Fuels and Future Energy Technologies. Futures 2015, 69, 31–49. [Google Scholar] [CrossRef]
- Electricity-Market-Report-January-2022. Available online: www.iea.org (accessed on 1 June 2022).
- Schmidt, O.; Hawkes, A.; Gambhir, A.; Staffell, I. The Future Cost of Electrical Energy Storage Based on Experience Rates. Nat. Energy 2017, 2, 17110. [Google Scholar] [CrossRef]
- Höök, M.; Tang, X. Depletion of Fossil Fuels and Anthropogenic Climate Change—A Review. Energy Policy 2013, 52, 797–809. [Google Scholar] [CrossRef] [Green Version]
- Etacheri, V.; Marom, R.; Elazari, R.; Salitra, G.; Aurbach, D. Challenges in the Development of Advanced Li-Ion Batteries: A Review. Energy Environ. Sci. 2011, 4, 3243–3262. [Google Scholar] [CrossRef]
- Kim, T.; Song, W.; Son, D.Y.; Ono, L.K.; Qi, Y. Lithium-Ion Batteries: Outlook on Present, Future, and Hybridized Technologies. J. Mater. Chem. A 2019, 7, 2942–2964. [Google Scholar] [CrossRef]
- Vangari, M.; Pryor, T.; Jiang, L. Supercapacitors: Review of Materials and Fabrication Methods. J. Energy Eng. 2013, 139, 72–79. [Google Scholar] [CrossRef]
- Sharma, P.; Bhatti, T.S. A Review on Electrochemical Double-Layer Capacitors. Energy Convers. Manag. 2010, 51, 2901–2912. [Google Scholar] [CrossRef]
- Banerjee, S.; De, B.; Sinha, P.; Cherusseri, J.; Kar, K.K. Applications of Supercapacitors; Springer: Cham, Switzerland, 2020; Volume 300. [Google Scholar] [CrossRef]
- Kim, B.K.; Sy, S.; Yu, A.; Zhang, J. Electrochemical Supercapacitors for Energy Storage and Conversion. In Handbook of Clean Energy Systems; Yan, J., Ed.; John Wiley & Sons: Hoboken, NJ, USA, 2015. [Google Scholar] [CrossRef]
- Najib, S.; Erdem, E. Current Progress Achieved in Novel Materials for Supercapacitor Electrodes: Mini Review. Nanoscale Adv. 2019, 1, 2817–2827. [Google Scholar] [CrossRef] [Green Version]
- Fleischmann, S.; Mitchell, J.B.; Wang, R.; Zhan, C.; Jiang, D.E.; Presser, V.; Augustyn, V. Pseudocapacitance: From Fundamental Understanding to High Power Energy Storage Materials. Chem. Rev. 2020, 120, 6738–6782. [Google Scholar] [CrossRef]
- Dunn, B.; Kamath, H.; Tarascon, J.M. Electrical Energy Storage for the Grid: A Battery of Choices. Science 2011, 334, 928–935. [Google Scholar] [CrossRef] [Green Version]
- Jiang, Y.; Liu, J. Definitions of Pseudocapacitive Materials: A Brief Review. Energy Environ. Mater. 2019, 2, 30–37. [Google Scholar] [CrossRef] [Green Version]
- Yu, Z.; Tetard, L.; Zhai, L.; Thomas, J. Supercapacitor Electrode Materials: Nanostructures from 0 to 3 Dimensions. Energy Environ. Sci. 2015, 8, 702–730. [Google Scholar] [CrossRef] [Green Version]
- Yi, C.-Q.; Zou, J.-P.; Yang, H.-Z.; Leng, X. Recent Advances in Pseudocapacitor Electrode Materials: Transition Metal Oxides and Nitrides. Trans. Nonferrous Met. Soc. China 2018, 28, 1980–2001. (In English) [Google Scholar] [CrossRef]
- Wang, L.; Zhang, G.; Liu, Q.; Duan, H. Recent Progress in Zn-Based Anodes for Advanced Lithium Ion Batteries. Mater. Chem. Front. 2018, 2, 1414–1435. [Google Scholar] [CrossRef]
- Ridhuan, N.S.; Abdul Razak, K.; Lockman, Z.; Abdul Aziz, A. Structural and Morphology of ZnO Nanorods Synthesized Using ZnO Seeded Growth Hydrothermal Method and Its Properties as UV Sensing. PLoS ONE 2012, 7, e50405. [Google Scholar] [CrossRef]
- Özgür, Ü.; Alivov, Y.I.; Liu, C.; Teke, A.; Reshchikov, M.A.; Doǧan, S.; Avrutin, V.; Cho, S.-J.; Morkoҫ, H. A Comprehensive Review of ZnO Materials and Devices. J. Appl. Phys. 2005, 98, 041301. [Google Scholar] [CrossRef] [Green Version]
- Klingshirn, C. ZnO: From Basics towards Applications. Phys. Status Solidi Basic Res. 2007, 244, 3027–3073. [Google Scholar] [CrossRef]
- Kong, X.Y.; Wang, Z.L. Spontaneous Polarization-Induced Nanohelixes, Nanosprings, and Nanorings of Piezoelectric Nanobelts. Nano Lett. 2003, 3, 1625–1631. [Google Scholar] [CrossRef] [Green Version]
- Chang, P.C.; Fan, Z.; Wang, D.; Tseng, W.Y.; Chiou, W.A.; Hong, J.; Lu, J.G. ZnO Nanowires Synthesized by Vapor Trapping CVD Method. Chem. Mater. 2004, 16, 5133–5137. [Google Scholar] [CrossRef]
- Li, Y.; Cheng, G.S.; Zhang, L.D. Fabrication of Highly Ordered ZnO Nanowire Arrays in Anodic Alumina Membranes. J. Mater. Res. 2000, 15, 2305–2308. [Google Scholar] [CrossRef] [Green Version]
- Kamalasanan, M.N.; Chandra, S. Sol-Gel Synthesis of ZnO Thin Films. Thin Solid Films 1996, 288, 112–115. [Google Scholar] [CrossRef]
- Strano, V.; Greco, M.G.; Ciliberto, E.; Mirabella, S. Zno Microflowers Grown by Chemical Bath Deposition: A Low-Cost Approach for Massive Production of Functional Nanostructures. Chemosensors 2019, 7, 62. [Google Scholar] [CrossRef] [Green Version]
- Hodes, G. Semiconductor and Ceramic Nanoparticle Films Deposited by Chemical Bath Deposition. Phys. Chem. Chem. Phys. 2007, 9, 2181–2196. [Google Scholar] [CrossRef] [PubMed]
- Liao, F.; Huang, Y.; Ge, J.; Zheng, W.; Tedsree, K.; Collier, P.; Hong, X.; Tsang, S.C. Morphology-Dependent Interactions of ZnO with Cu Nanoparticles at the Materials’ Interface in Selective Hydrogenation of CO2 to CH3OH. Angew. Chem. Int. Ed. 2011, 50, 2162–2165. [Google Scholar] [CrossRef] [PubMed]
- Najib, S.; Bakan, F.; Abdullayeva, N.; Bahariqushchi, R.; Kasap, S.; Franzò, G.; Sankir, M.; Demirci Sankir, N.; Mirabella, S.; Erdem, E. Tailoring Morphology to Control Defect Structures in ZnO Electrodes for High-Performance Supercapacitor Devices. Nanoscale 2020, 12, 16162–16172. [Google Scholar] [CrossRef] [PubMed]
- Jayachandiran, J.; Yesuraj, J.; Arivanandhan, M.; Raja, A.; Suthanthiraraj, S.A.; Jayavel, R.; Nedumaran, D. Synthesis and Electrochemical Studies of RGO/ZnO Nanocomposite for Supercapacitor Application. J. Inorg. Organomet. Polym. Mater. 2018, 28, 2046–2055. [Google Scholar] [CrossRef]
- Luo, Q.; Xu, P.; Qiu, Y.; Cheng, Z.; Chang, X.; Fan, H. Synthesis of ZnO Tetrapods for High-Performance Supercapacitor Applications. Mater. Lett. 2017, 198, 192–195. [Google Scholar] [CrossRef]
- Guo, Y.; Chang, B.; Wen, T.; Zhao, C.; Yin, H.; Zhou, Y.; Wang, Y.; Yang, B.; Zhang, S. One-Pot Synthesis of Graphene/Zinc Oxide by Microwave Irradiation with Enhanced Supercapacitor Performance. RSC Adv. 2016, 6, 19394–19403. [Google Scholar] [CrossRef]
- Kim, J.H.; Lee, Y.S.; Sharma, A.K.; Liu, C.G. Polypyrrole/Carbon Composite Electrode for High-Power Electrochemical Capacitors. Electrochim. Acta 2006, 52, 1727–1732. [Google Scholar] [CrossRef]
- Strano, V.; Smecca, E.; Depauw, V.; Trompoukis, C.; Alberti, A.; Reitano, R.; Crupi, I.; Gordon, I.; Mirabella, S. Low-Cost High-Haze Films Based on ZnO Nanorods for Light Scattering in Thin c-Si Solar Cells. Appl. Phys. Lett. 2015, 106, 3–9. [Google Scholar] [CrossRef]
- Schneider, C.A.; Rasband, W.S.; Eliceiri, K.W. NIH Image to ImageJ: 25 Years of Image Analysis. Nat. Methods 2012, 9, 671–675. [Google Scholar] [CrossRef] [PubMed]
- Bruno, L.; Strano, V.; Scuderi, M.; Franzò, G.; Priolo, F.; Mirabella, S. Localized Energy Band Bending in ZnO Nanorods Decorated with Au Nanoparticles. Nanomaterials 2021, 11, 2718. [Google Scholar] [CrossRef] [PubMed]
- Yang, H.; Teng, F.; Gu, W.; Liu, Z.; Zhao, Y.; Zhang, A.; Liu, Z.; Teng, Y. A Simple Post-Synthesis Conversion Approach to Zn(OH)F and the Effects of Fluorine and Hydroxyl on the Photodegradation Properties of Dye Wastewater. J. Hazard. Mater. 2017, 333, 250–258. [Google Scholar] [CrossRef] [PubMed] [Green Version]
- Seehra, M.S.; Geddam, U.K.; Schwegler-Berry, D.; Stefaniak, A.B. Detection and Quantification of 2H and 3R Phases in Commercial Graphene-Based Materials. Carbon 2015, 95, 818–823. [Google Scholar] [CrossRef] [PubMed] [Green Version]
- Barbagiovanni, E.G.; Reitano, R.; Franzò, G.; Strano, V.; Terrasi, A.; Mirabella, S. Radiative Mechanism and Surface Modification of Four Visible Deep Level Defect States in ZnO Nanorods. Nanoscale 2016, 8, 995–1006. [Google Scholar] [CrossRef] [PubMed]
- Dai, M.; Xu, F.; Lu, Y.; Lui, Y.; Xie, Y. Synthesis of Submicron Rhombic ZnO Rods via ZnOHF Intermediate using Electrodeposition Route. Appl. Surf. Sci. 2011, 257, 3586–3591. [Google Scholar] [CrossRef]
- Tian, H.; Li, Y.; Zhang, J.; Ma, Y.; Wang, Y.; Wang, Y.; Li, Y. High Pressure Induced Phase Transformation through Continuous Topology Evolution in Zinc Hydroxyfluoride Synthesized via a Hydrothermal Strategy. J. Alloys Compd. 2017, 726, 132–138. [Google Scholar] [CrossRef]
- Komarneri, S.; Bruno, M.; Mariani, E. Synthesis of ZnO with and without Microwaves. Mater. Res. Bull. 2000, 35, 1843–1847. [Google Scholar] [CrossRef]
- Guo, Y.; Liu, N.; Sun, T.; Cui, H.; Wang, J.; Wang, M.; Wang, M.; Tang, Y. Rational Structural Design of ZnOHF Nanotube-Assembled Microsphere Adsorbents for High-Efficient Pb2+ removal. CrystEngComm 2020, 22, 7543–7548. [Google Scholar] [CrossRef]
- Zubieta, L.; Bonert, R. Characterization of Double-Layer Capacitors for Power Electronics Applications. IEEE Trans. Ind. Appl. 2000, 36, 199–205. [Google Scholar] [CrossRef] [Green Version]
- González, A.; Goikolea, E.; Barrena, J.A.; Mysyk, R. Review on Supercapacitors: Technologies and Materials. Renew. Sustain. Energy Rev. 2016, 58, 1189–1206. [Google Scholar] [CrossRef]
- Tielrooij, K.J.; Garcia-Araez, N.; Bonn, M.; Bakker, H.J. Cooperativity in Ion Hydration. Science 2010, 328, 1006–1009. [Google Scholar] [CrossRef]
- Wang, J.; Polleux, J.; Lim, J.; Dunn, B. Pseudocapacitive Contributions to Electrochemical Energy Storage in TiO2 (Anatase) Nanoparticles. J. Phys. Chem. C 2007, 111, 14925–14931. [Google Scholar] [CrossRef]
- Lindstrom, H.; So, S.; Solbrand, A.; Hjelm, J.; Hagfeldt, A.; Lindquist, S. Li Ion Insertion in TiO2 (Anatase), Voltammetry on Nanoporous Films.Pdf. J. Phys. Chem. B 1997, 2, 7717–7722. [Google Scholar] [CrossRef]
- Bard, A.J.; Faulkner, L.R.; White, H. Electrochemical Methods: Fundamentals and Applications; John Wiley: New York, NY, USA, 2004; Volume 677, pp. 368–375. [Google Scholar]


Publisher’s Note: MDPI stays neutral with regard to jurisdictional claims in published maps and institutional affiliations. |
© 2022 by the authors. Licensee MDPI, Basel, Switzerland. This article is an open access article distributed under the terms and conditions of the Creative Commons Attribution (CC BY) license (https://creativecommons.org/licenses/by/4.0/).
Share and Cite
Di Mari, G.M.; Mineo, G.; Franzò, G.; Mirabella, S.; Bruno, E.; Strano, V. Low-Cost, High-Yield ZnO Nanostars Synthesis for Pseudocapacitor Applications. Nanomaterials 2022, 12, 2588. https://doi.org/10.3390/nano12152588
Di Mari GM, Mineo G, Franzò G, Mirabella S, Bruno E, Strano V. Low-Cost, High-Yield ZnO Nanostars Synthesis for Pseudocapacitor Applications. Nanomaterials. 2022; 12(15):2588. https://doi.org/10.3390/nano12152588
Chicago/Turabian StyleDi Mari, Gisella Maria, Giacometta Mineo, Giorgia Franzò, Salvatore Mirabella, Elena Bruno, and Vincenzina Strano. 2022. "Low-Cost, High-Yield ZnO Nanostars Synthesis for Pseudocapacitor Applications" Nanomaterials 12, no. 15: 2588. https://doi.org/10.3390/nano12152588
APA StyleDi Mari, G. M., Mineo, G., Franzò, G., Mirabella, S., Bruno, E., & Strano, V. (2022). Low-Cost, High-Yield ZnO Nanostars Synthesis for Pseudocapacitor Applications. Nanomaterials, 12(15), 2588. https://doi.org/10.3390/nano12152588