
Structural Study of Nano-Clay and Its Effectiveness in Radiation Protection against X-rays


Abstract

1. Introduction
2. Experimental
- (i)
- Transmitted without changing direction [44].
- (ii)
- Transmitted by changing direction (at an angle) or diffused. The dissemination can be carried out without loss of energy (elastic scattering, it is at the origin of X-ray diffraction by crystals [42]) or with loss of energy (part of the energy is given up to an electron), and it is called inelastic diffusion which is at the origin of the Compton effect [45].
- (iii)
- Absorbed by atoms: under the action of incident radiation, an electron from an atom in the sample can be ejected from the electronic layer it occupied, which is the photoelectric effect, with the ejected electron being called a photoelectron. An electron from a higher layer can replace the ejected electron. This electronic jump is accompanied by an X-ray called fluorescence radiation [43,45].
3. Result and Discussion
3.1. Structural Study
- (i)
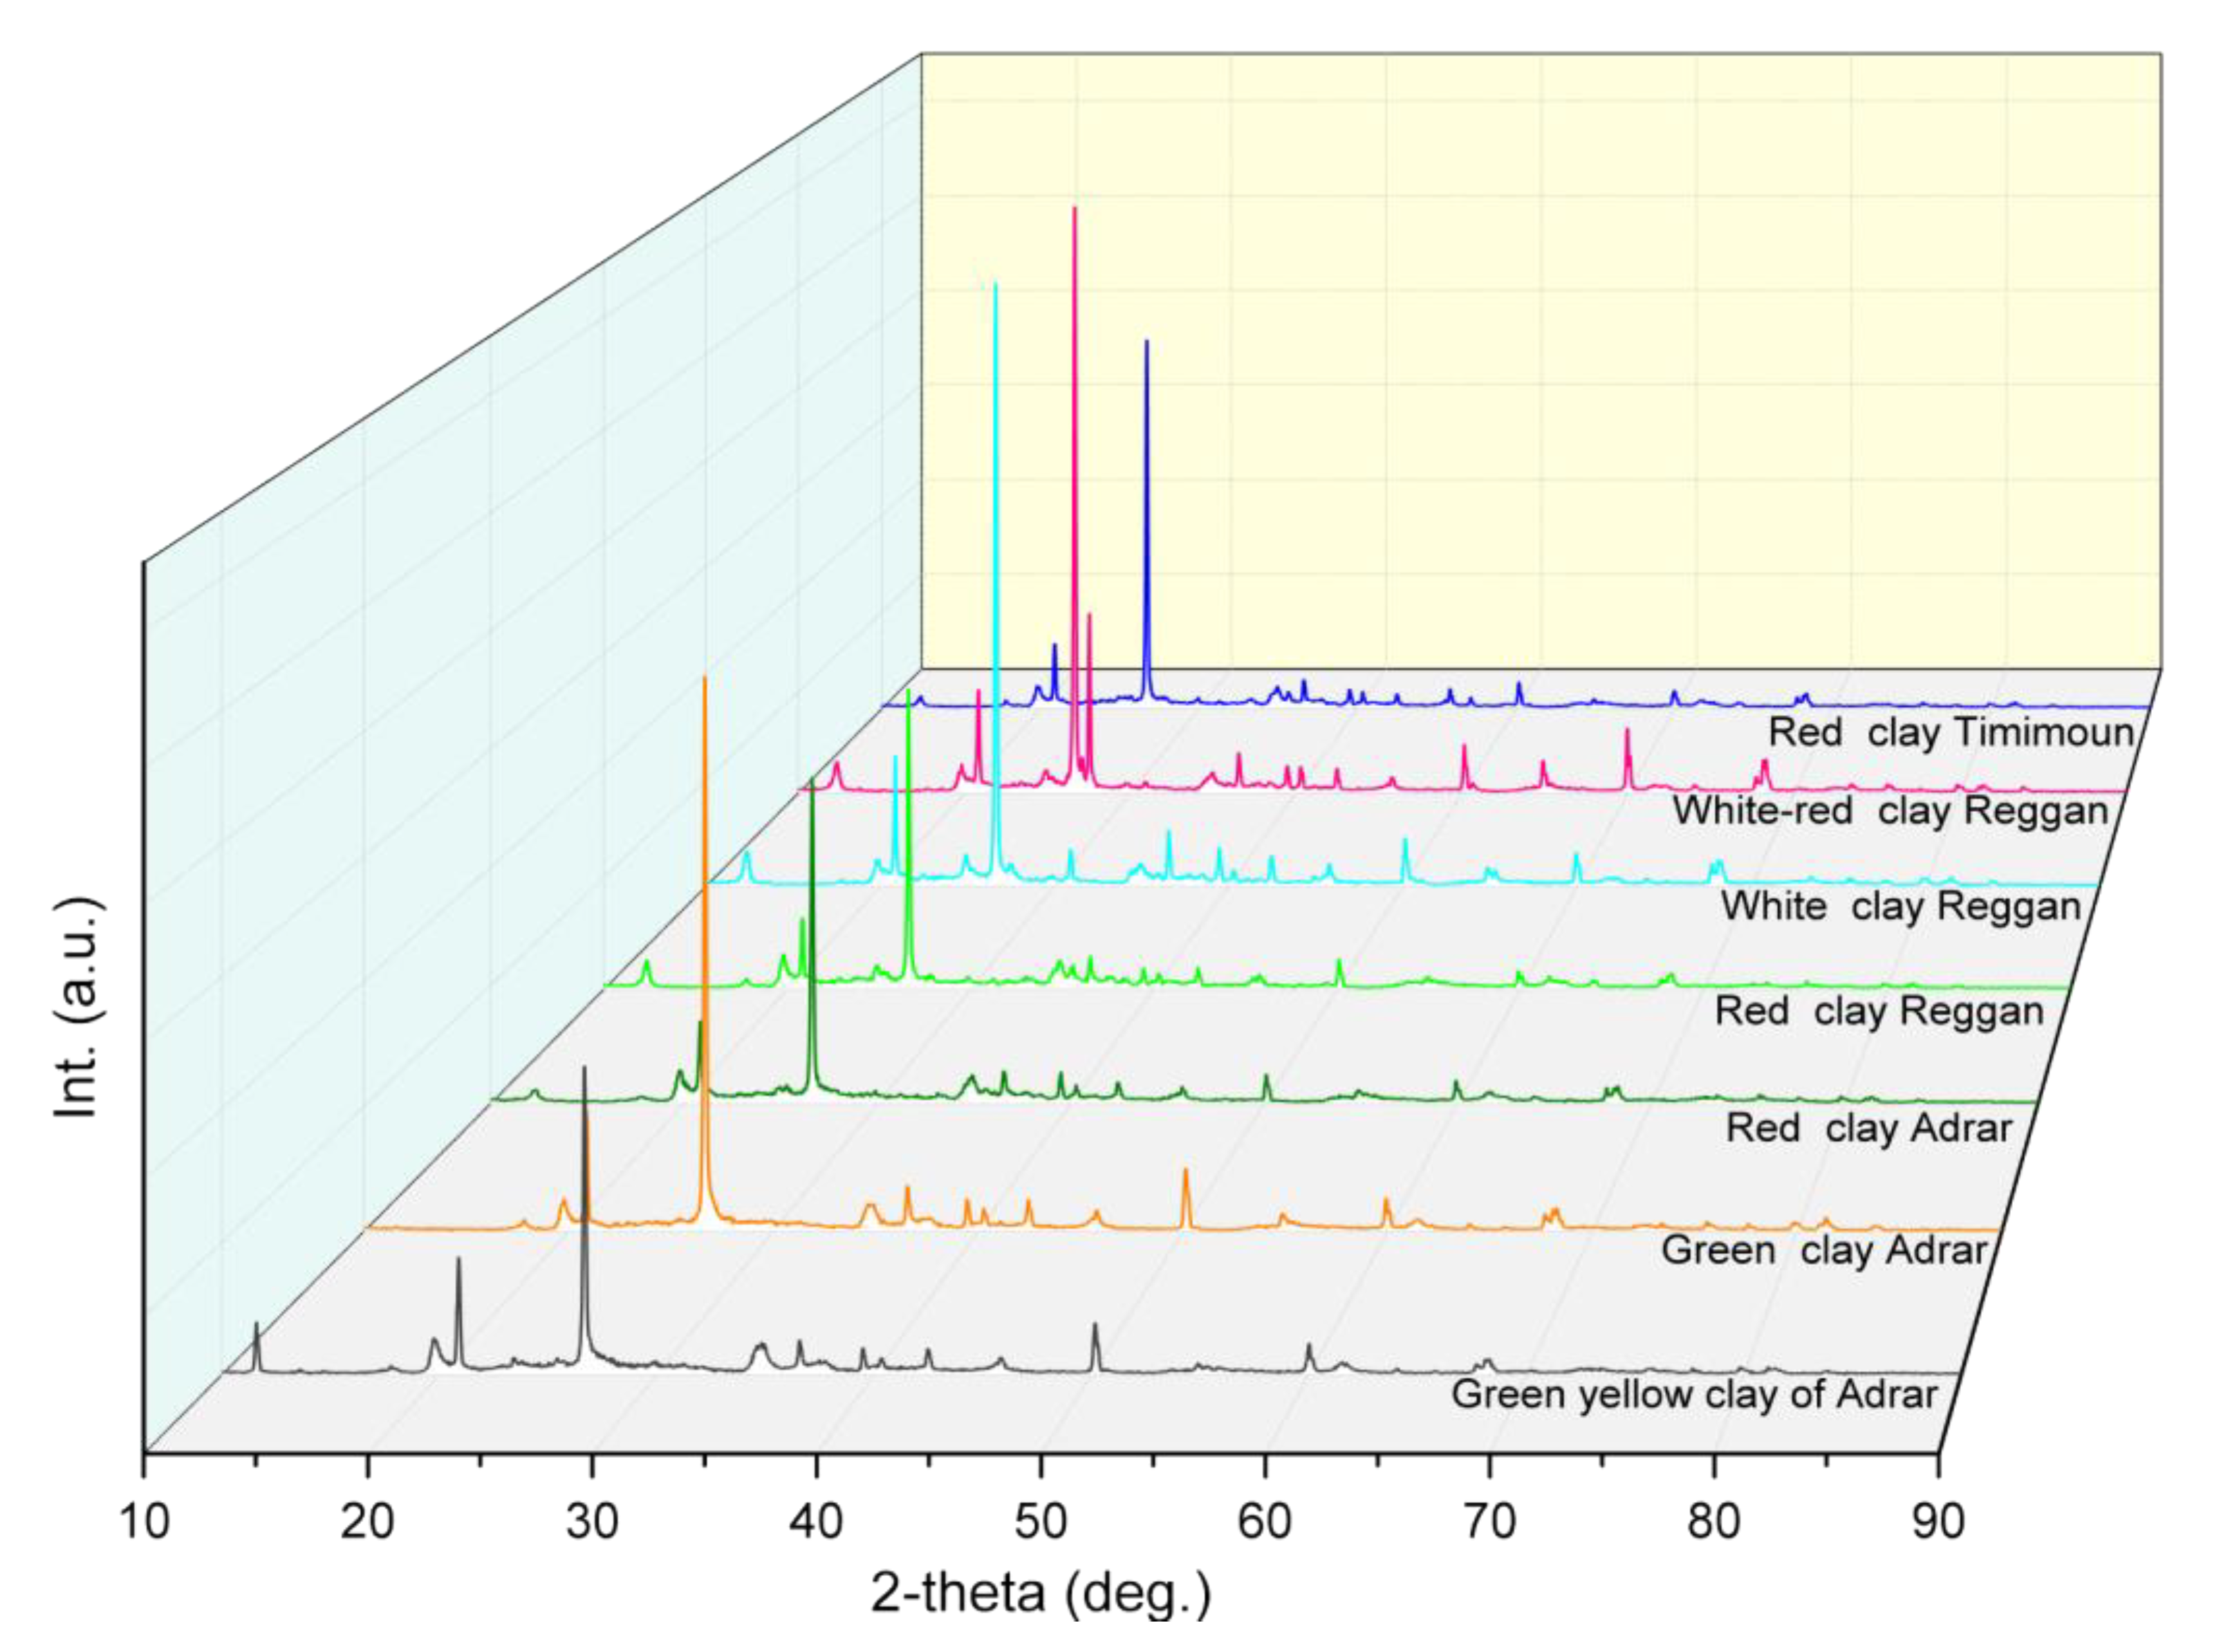
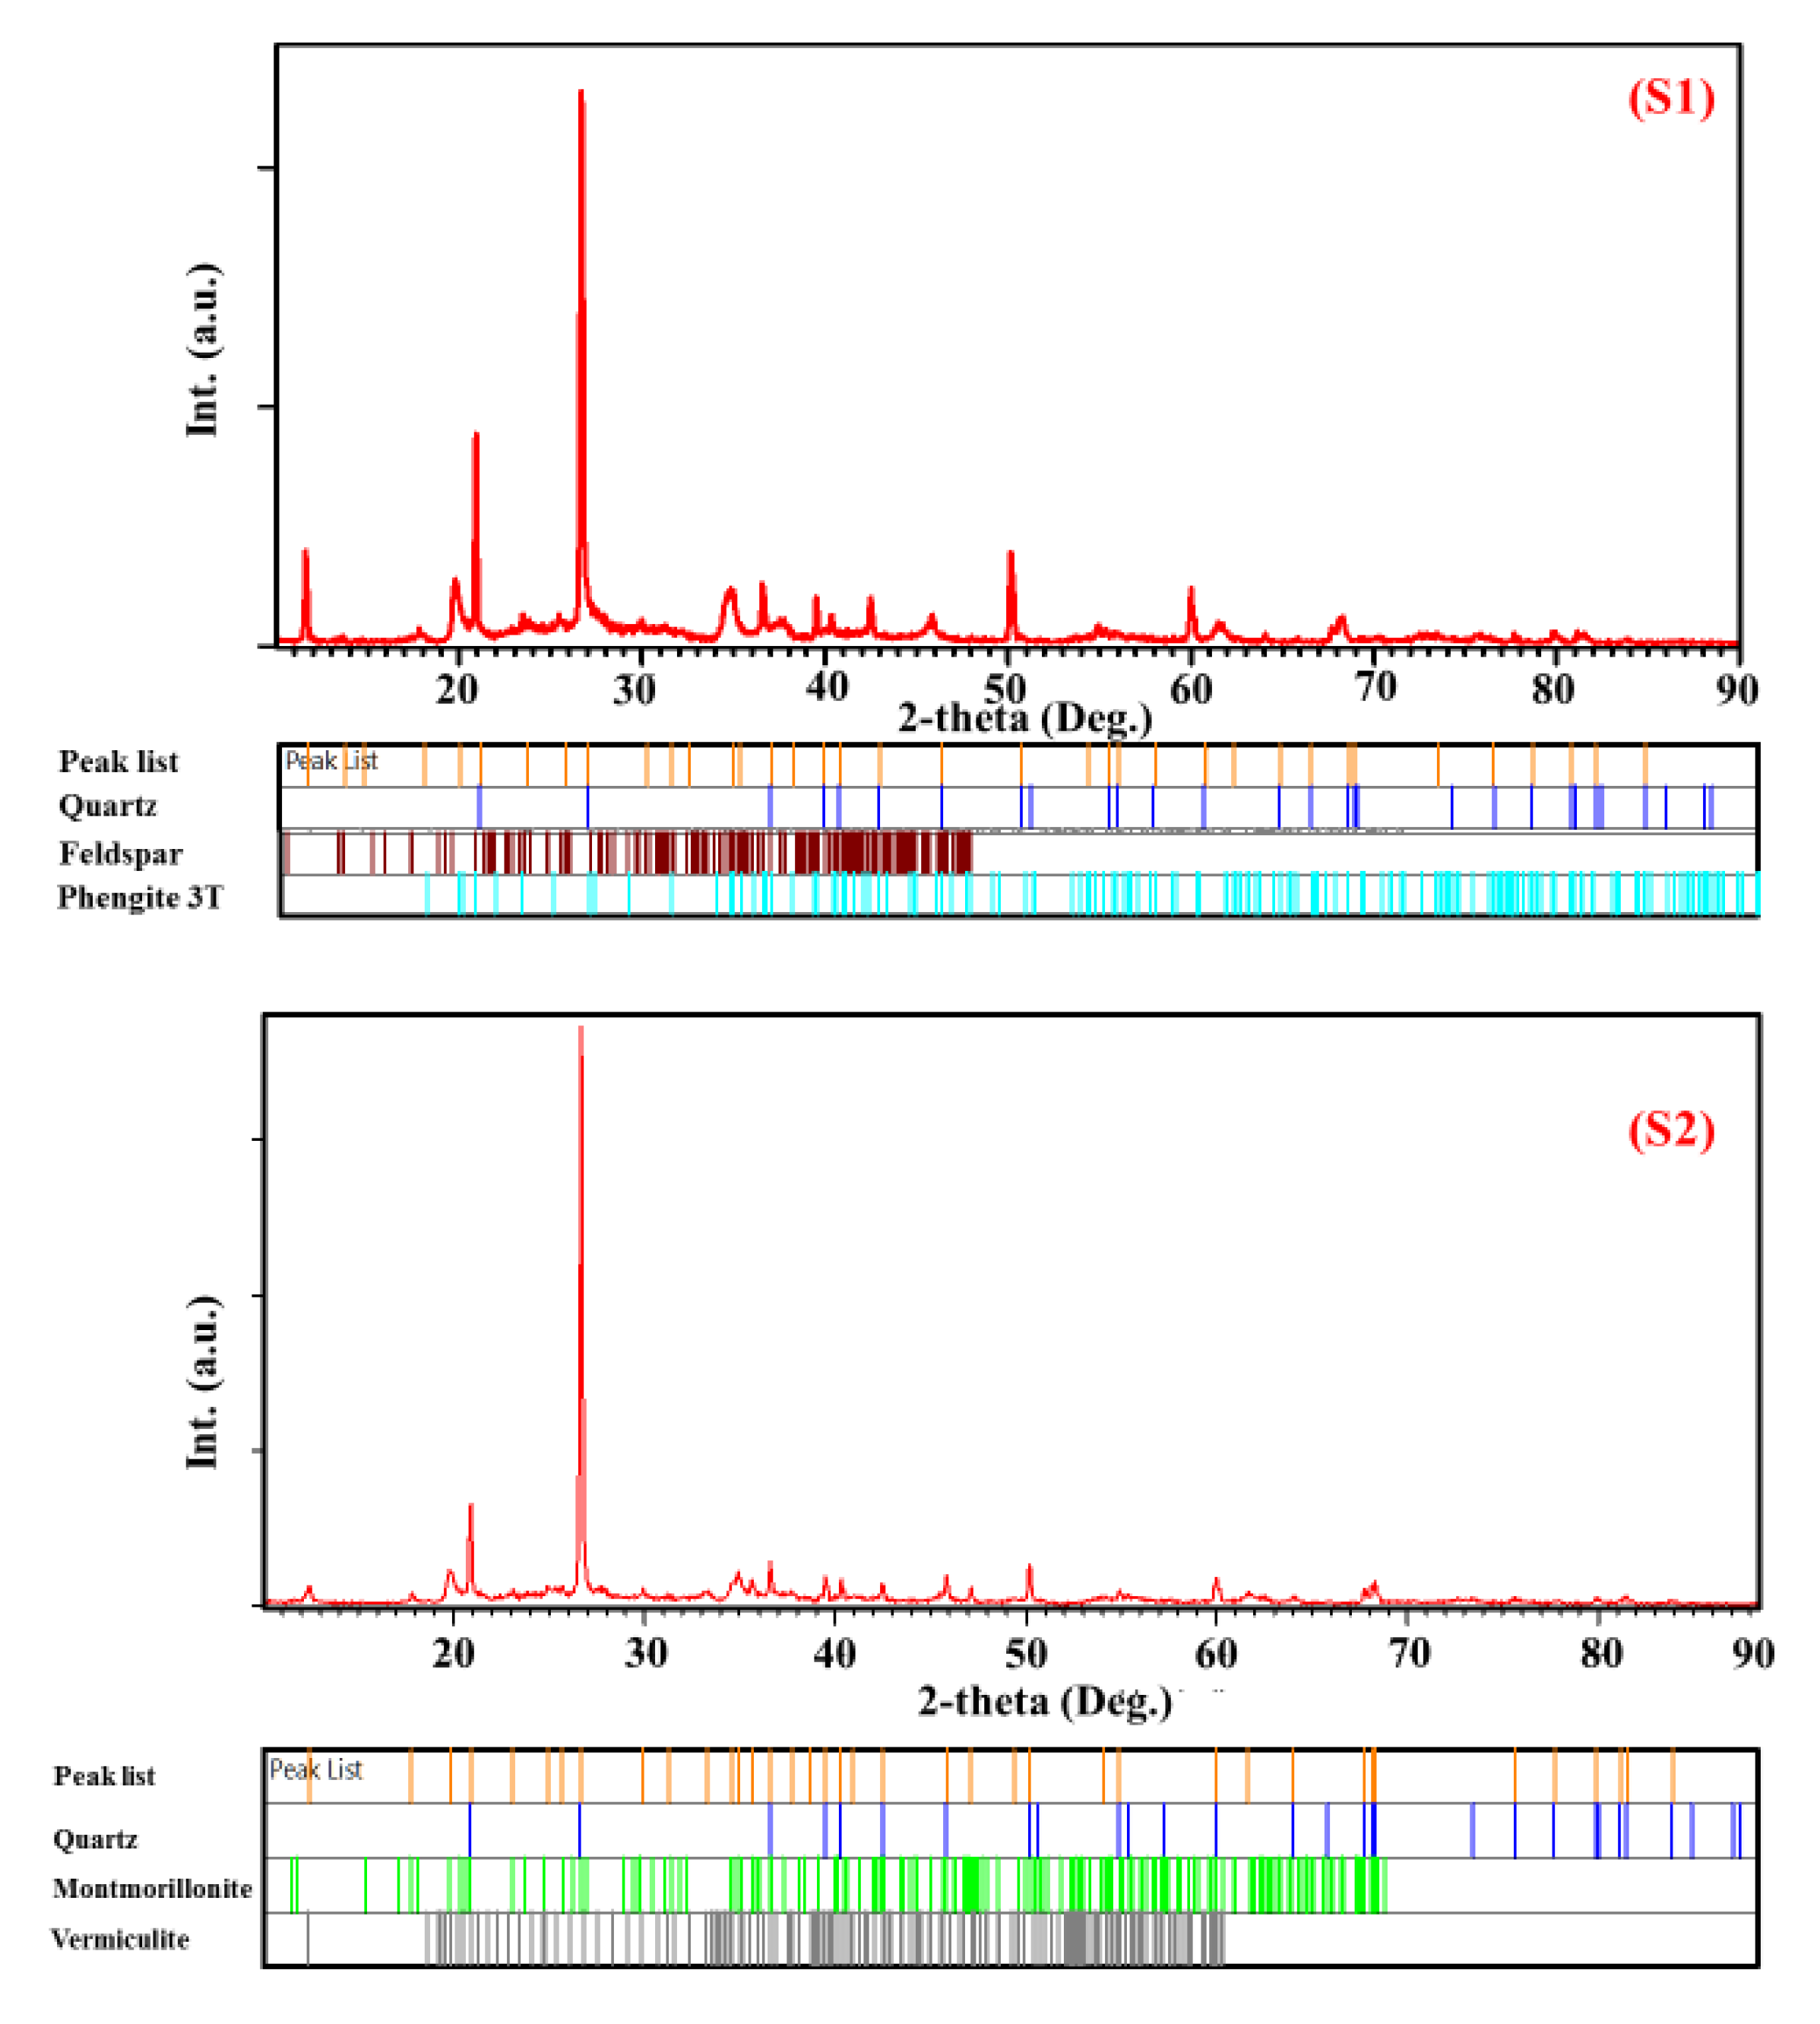
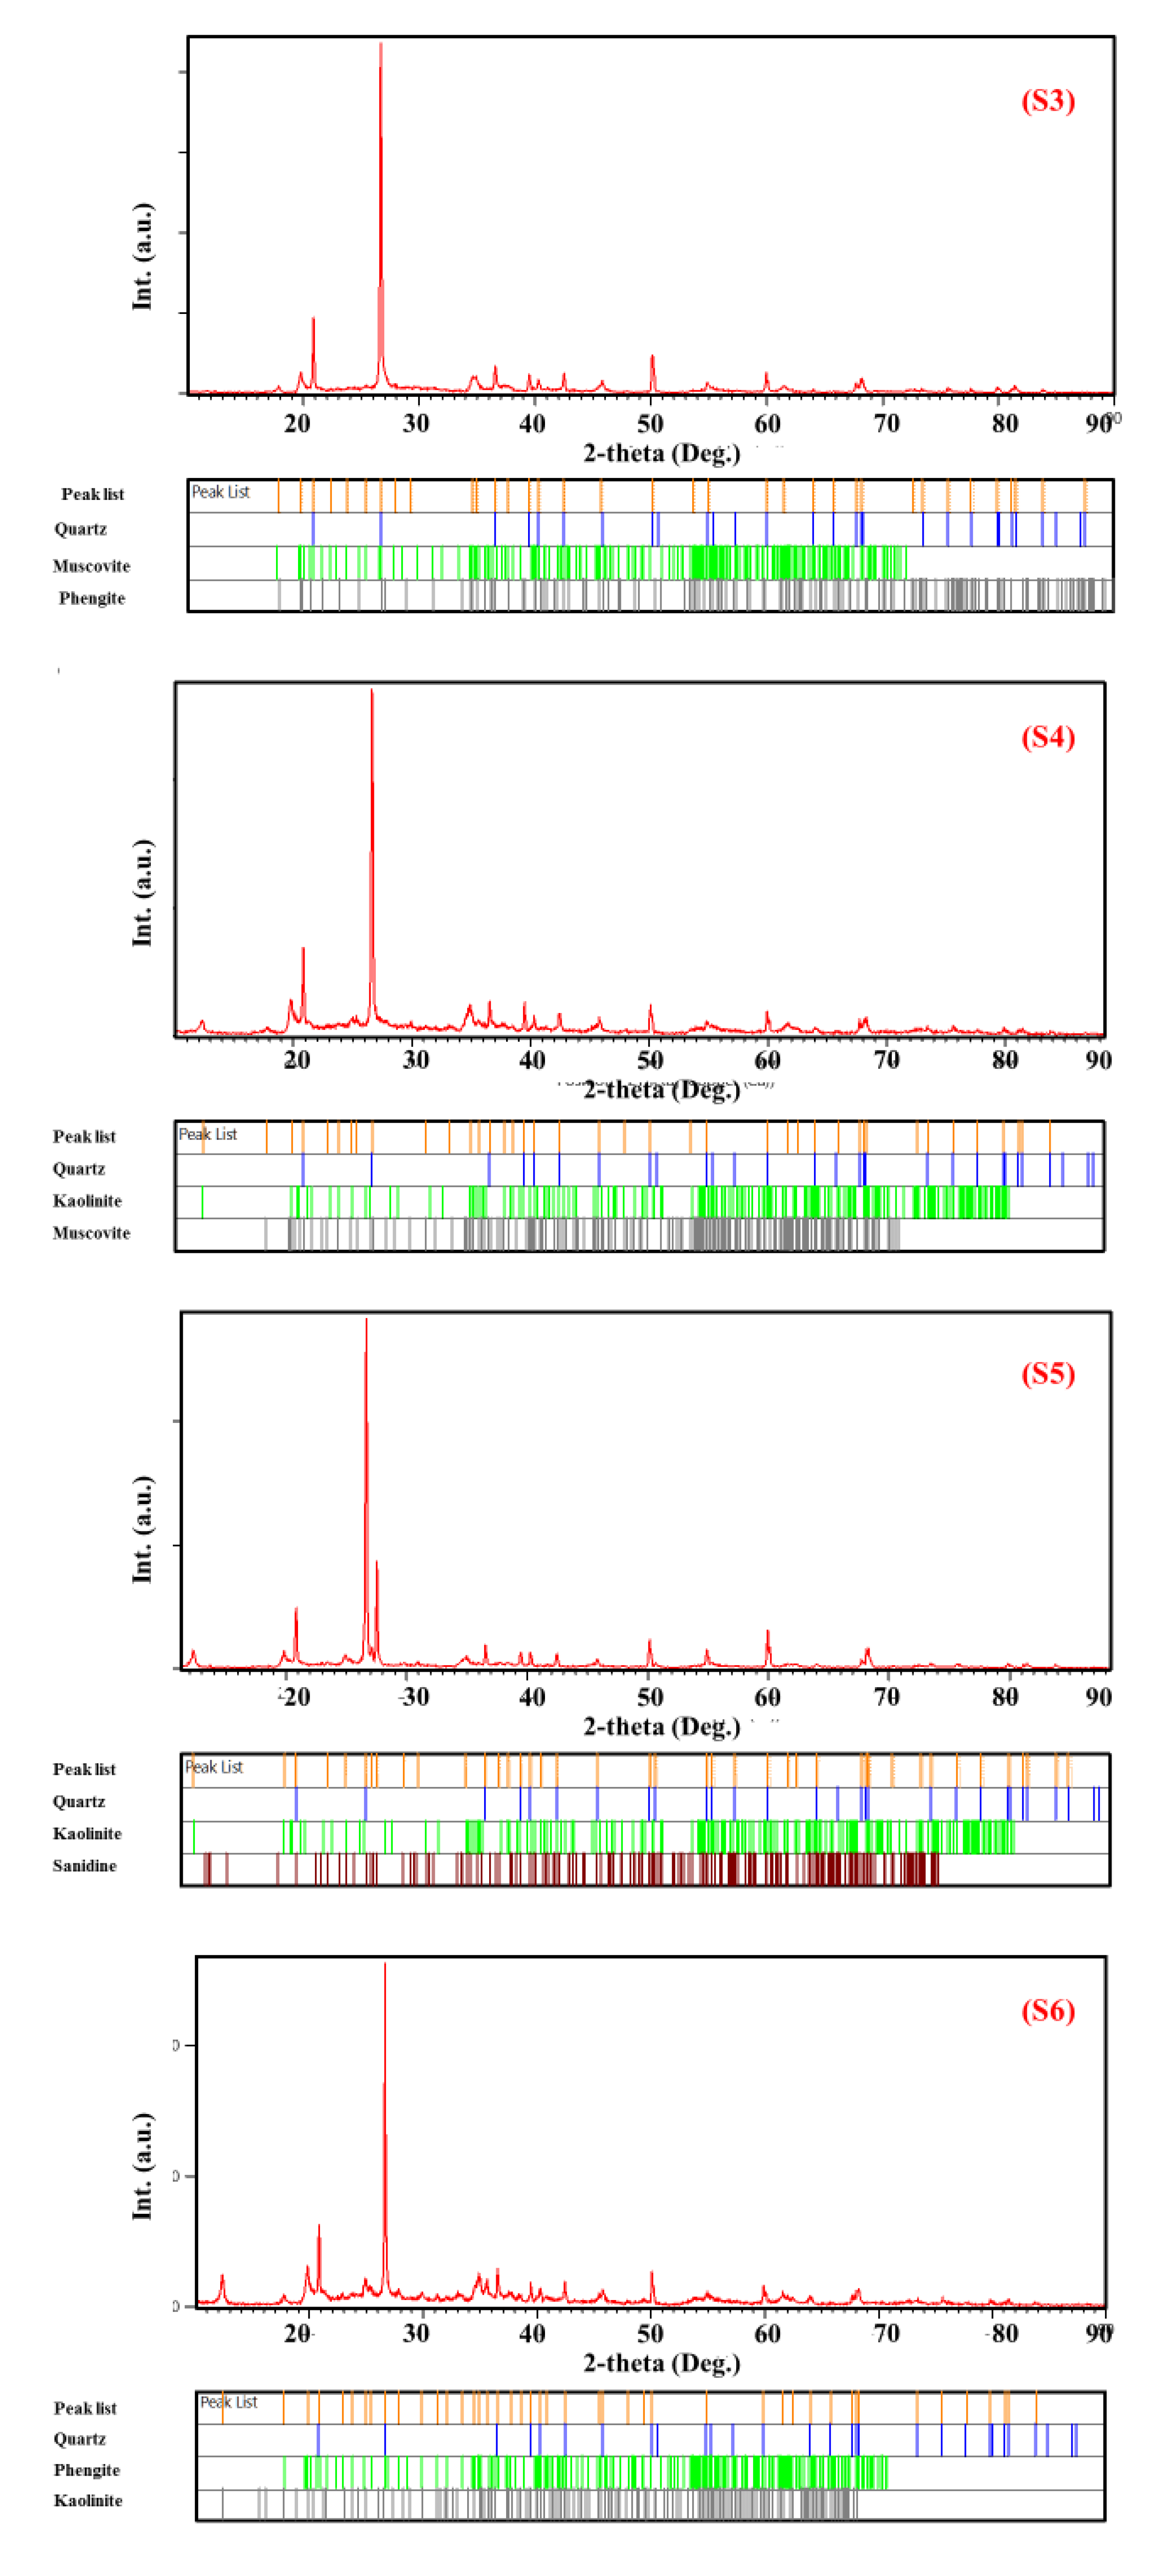
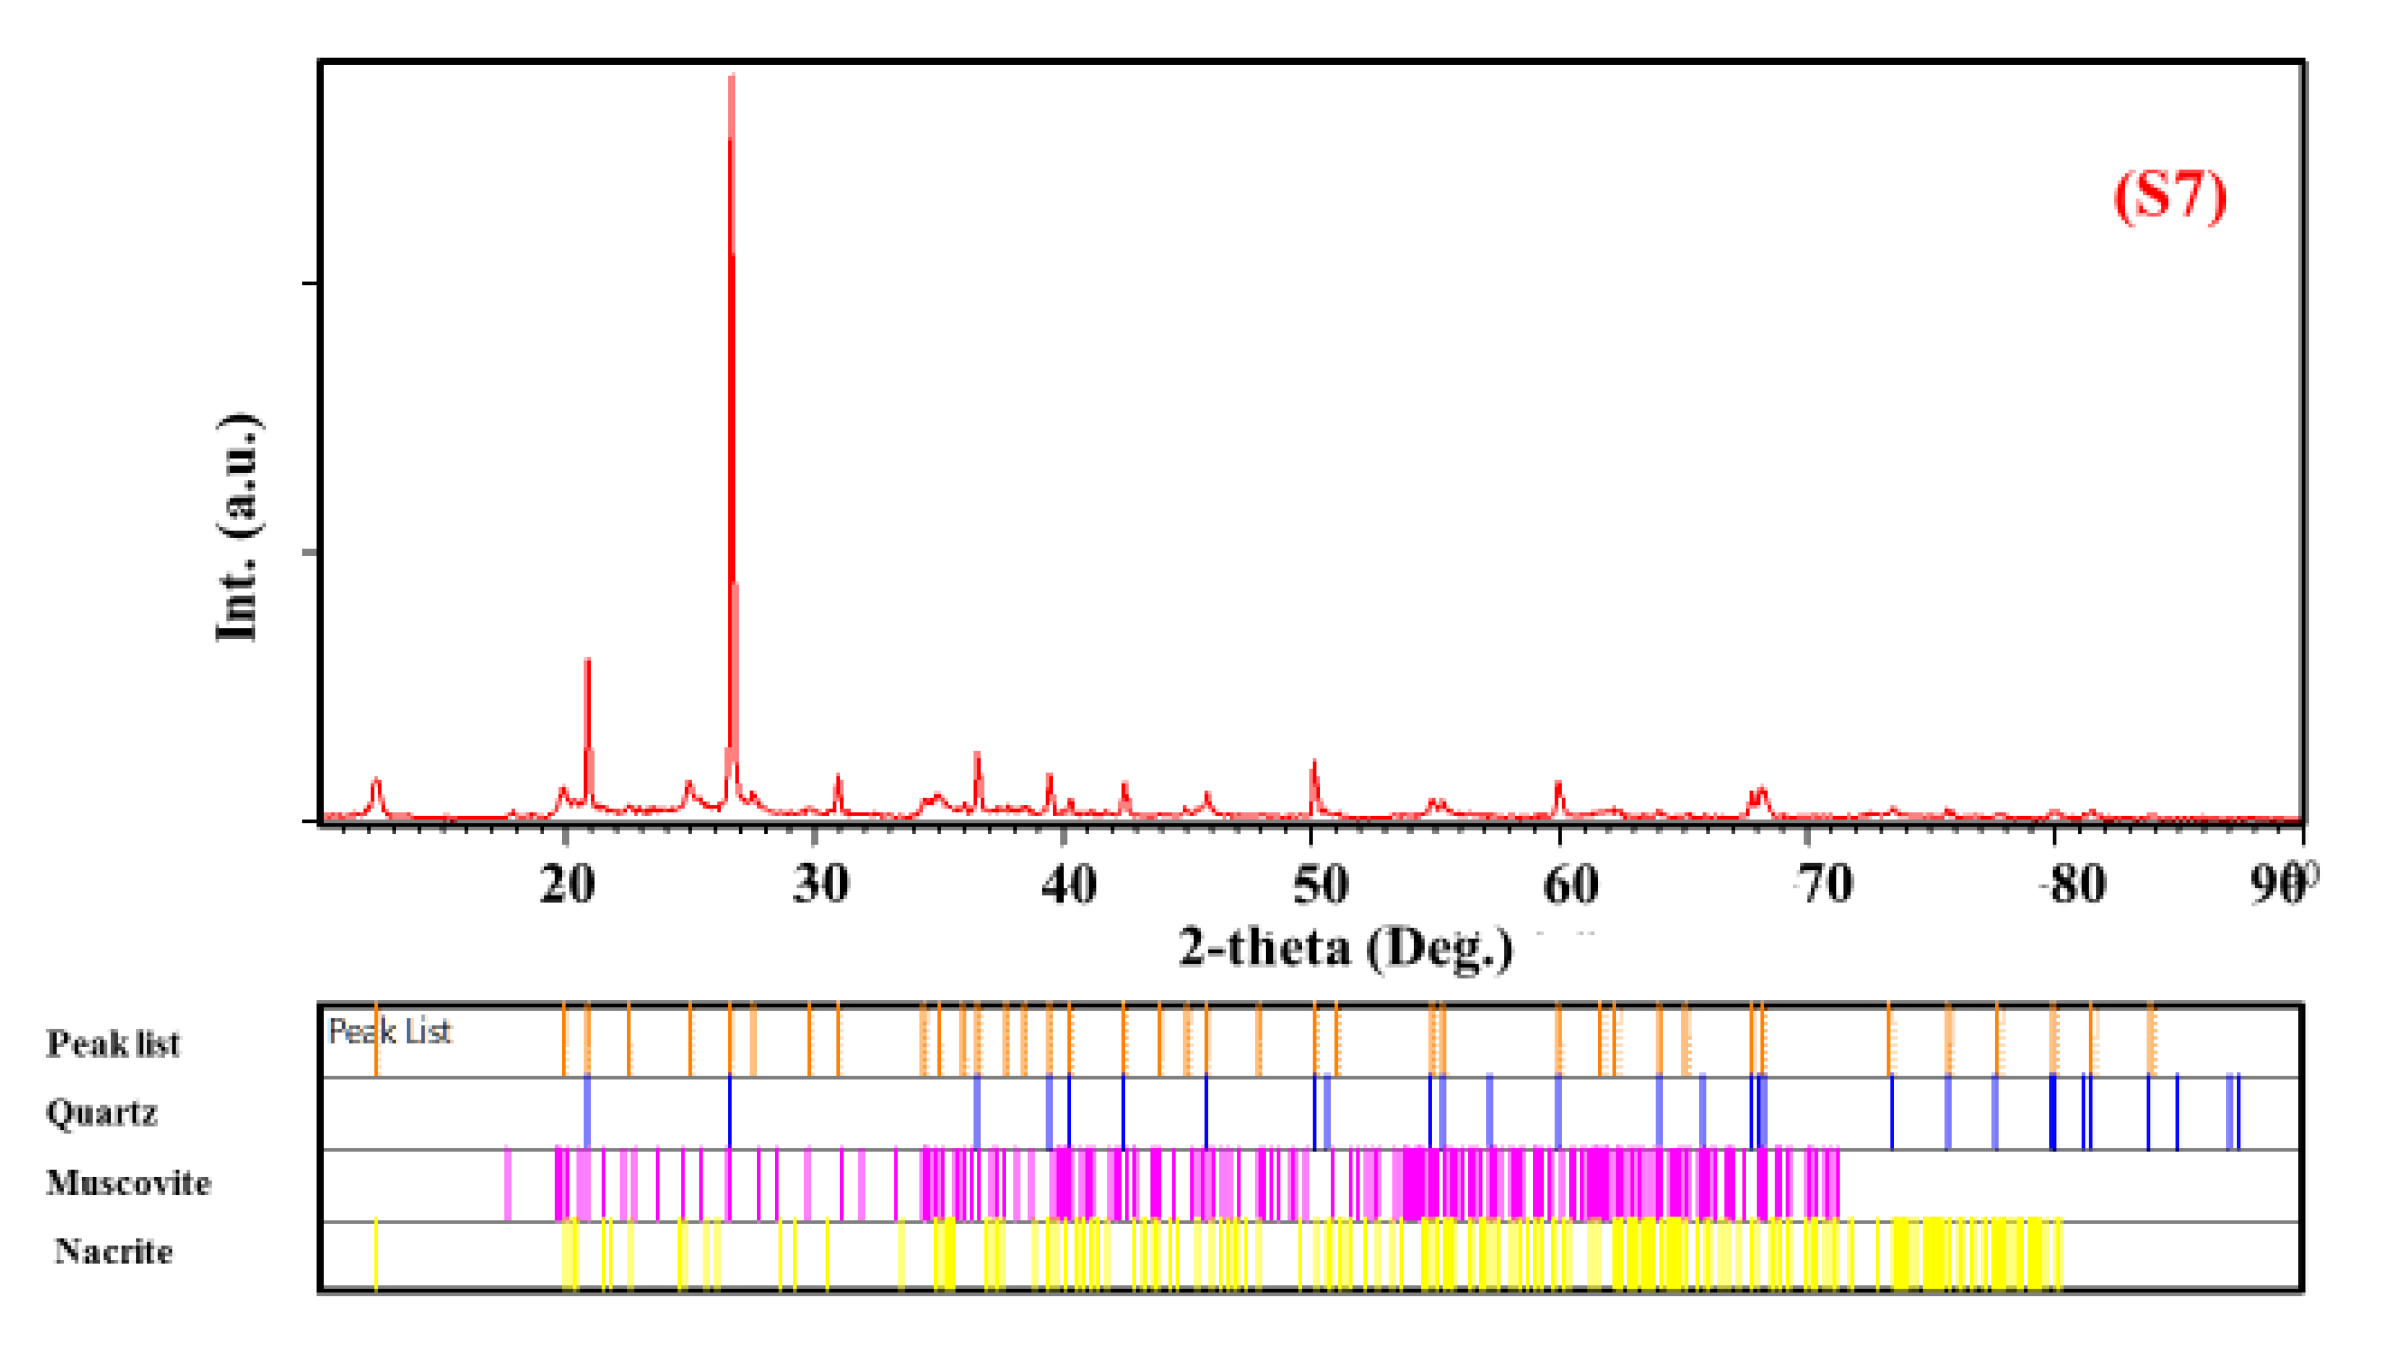
- The diffraction patterns displayed numerous peaks corresponding to different crystalline phases in each sample, where the most intense were present in (S6), (S5), and (S2).
- (ii)
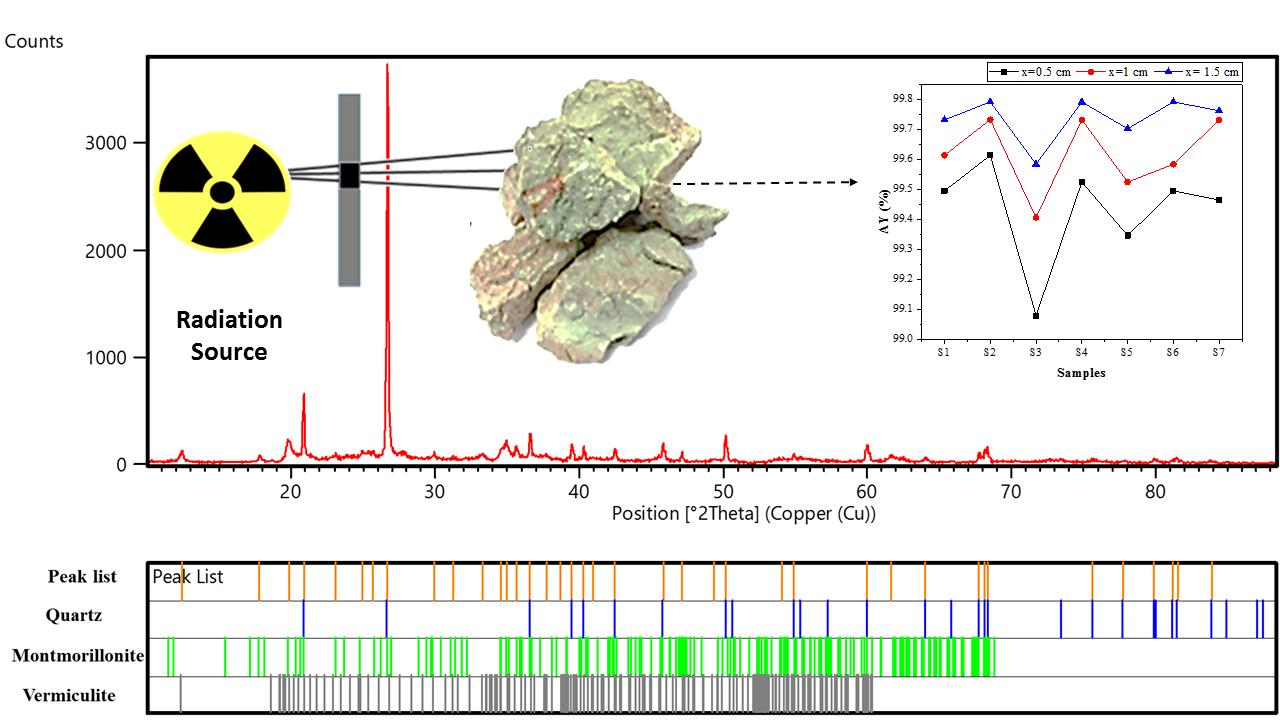
- There was the presence of the same peak in all samples (2θ = 26.68°) but its intensity changed, which corresponded to the quartz phase (Figure 2).
- (iii)
- There was the presence of new peaks in samples (S6) (2θ = 27.54°) and (S1) (2θ = 11.60°) which were absent in the remaining samples.
- (iv)
- The peak located at (2θ = 12.33°) disappeared from sample (S2), while it was present in the remaining samples.


- -
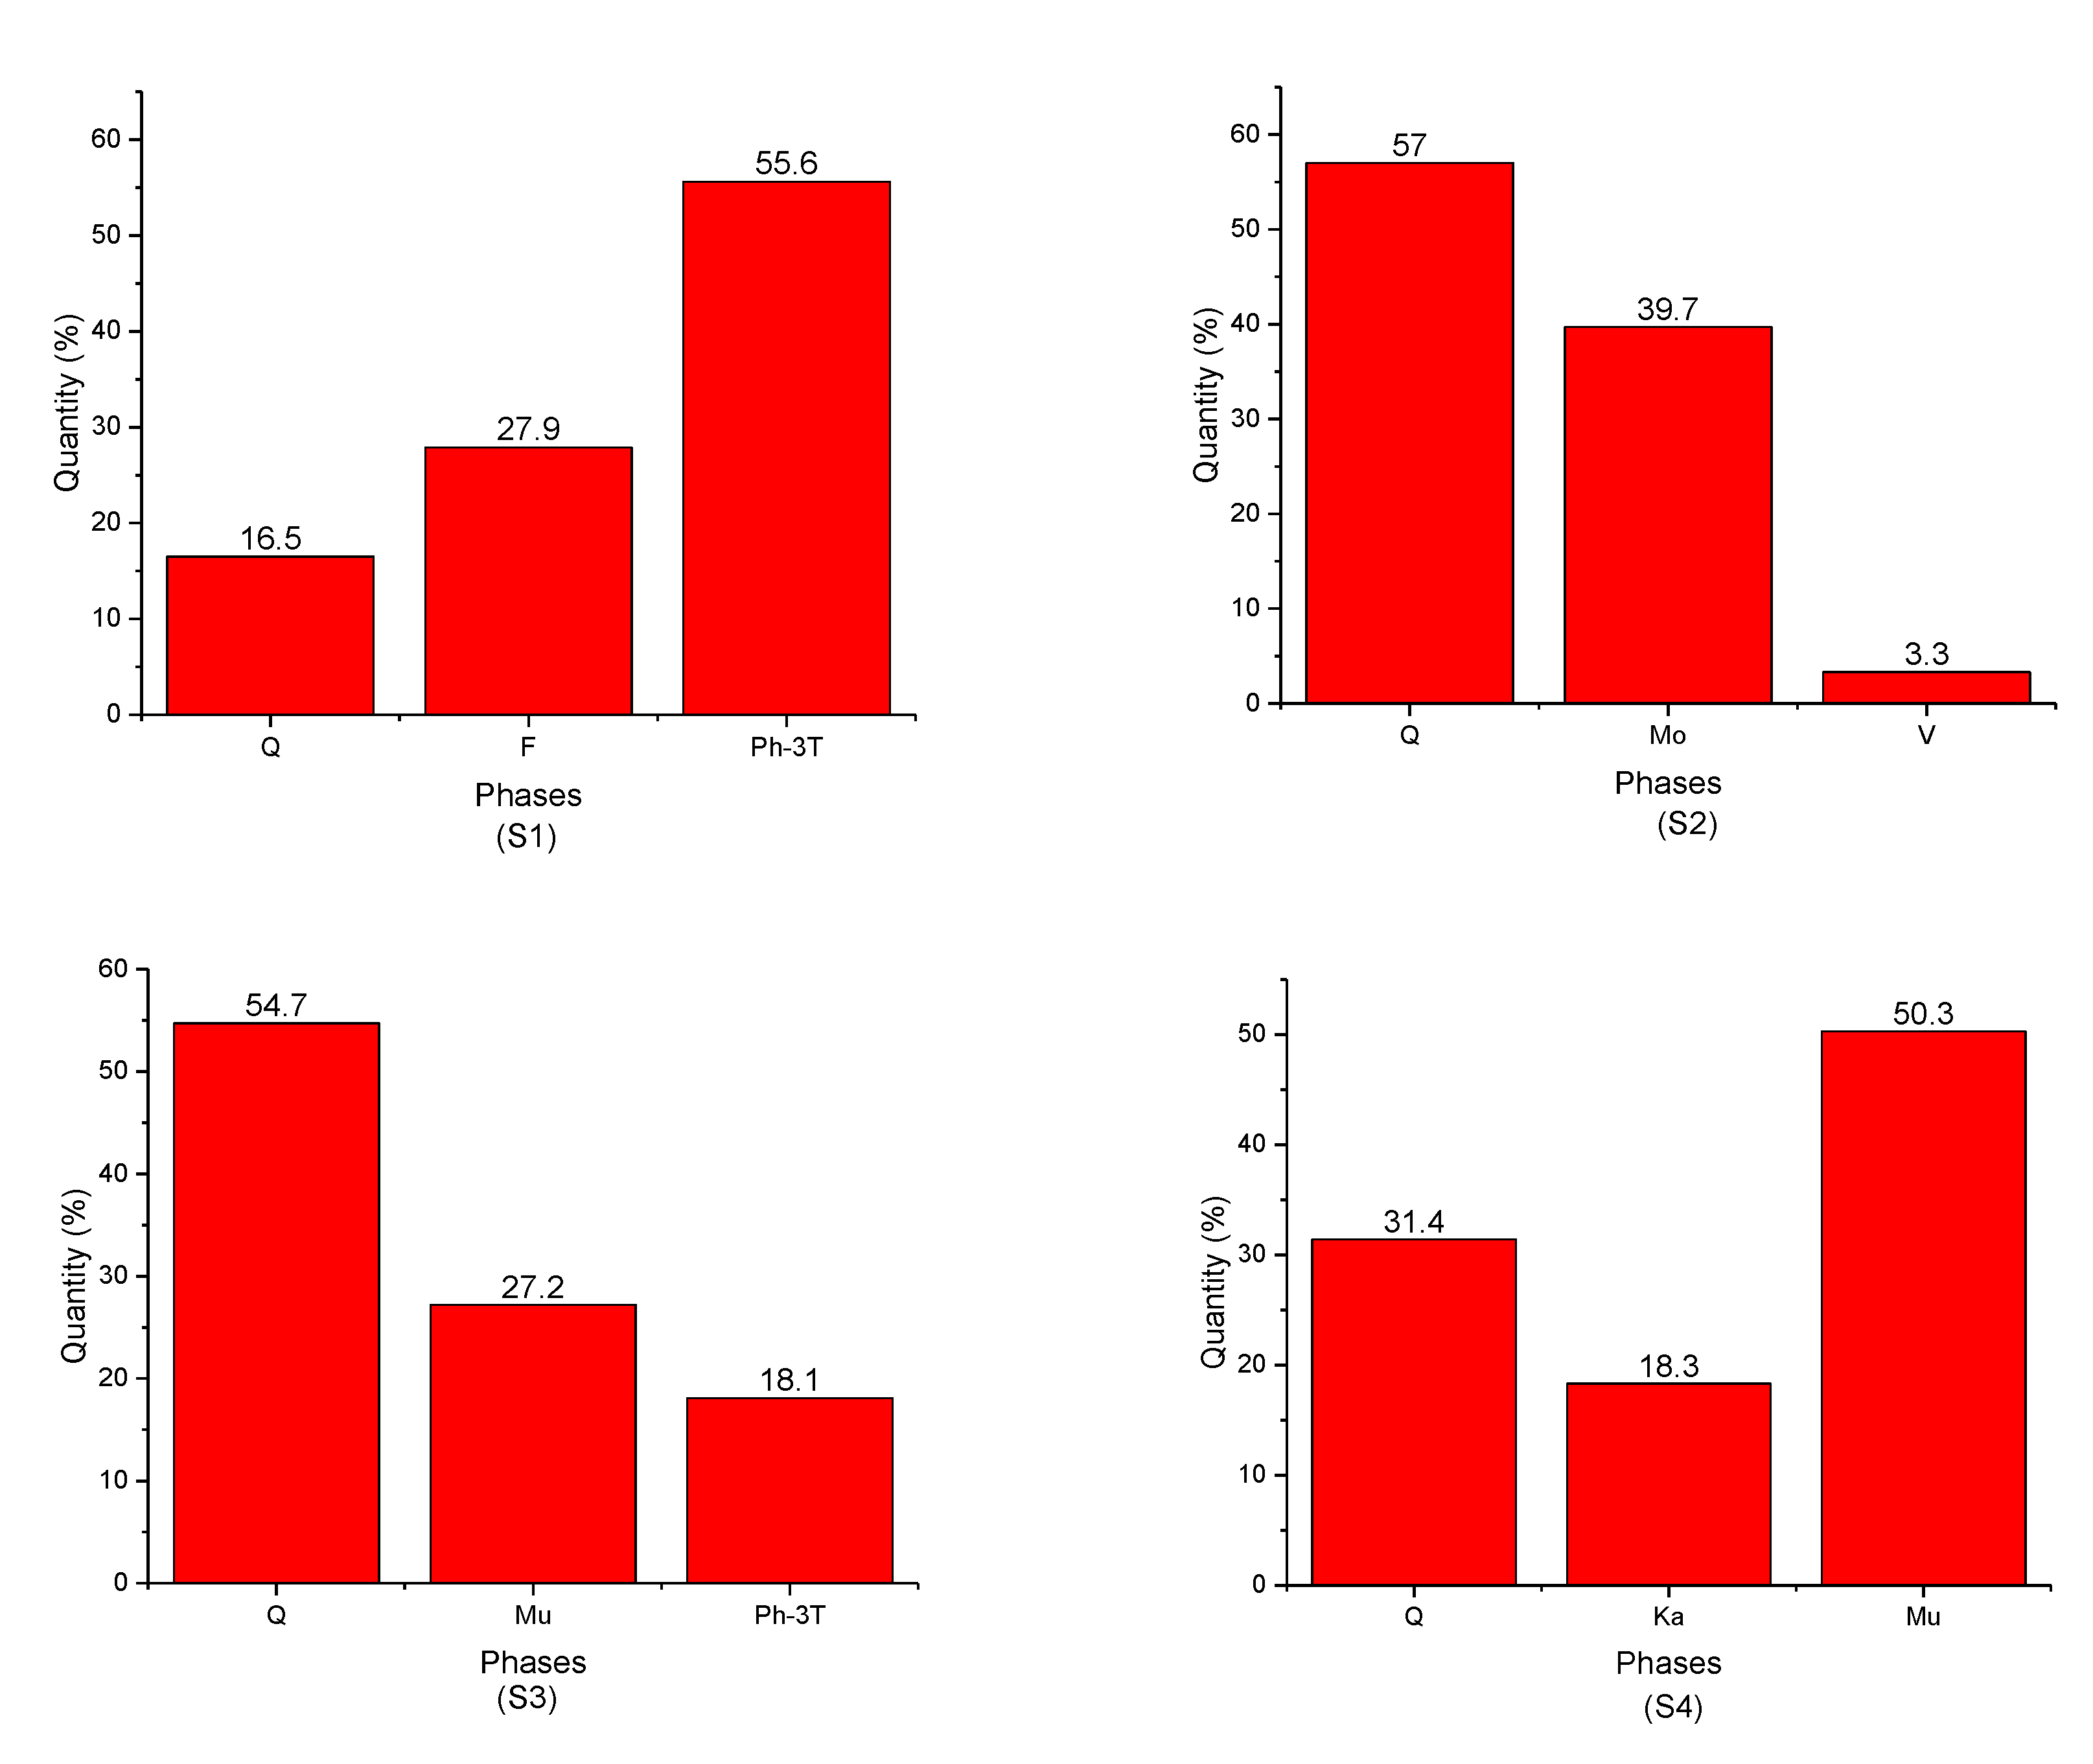
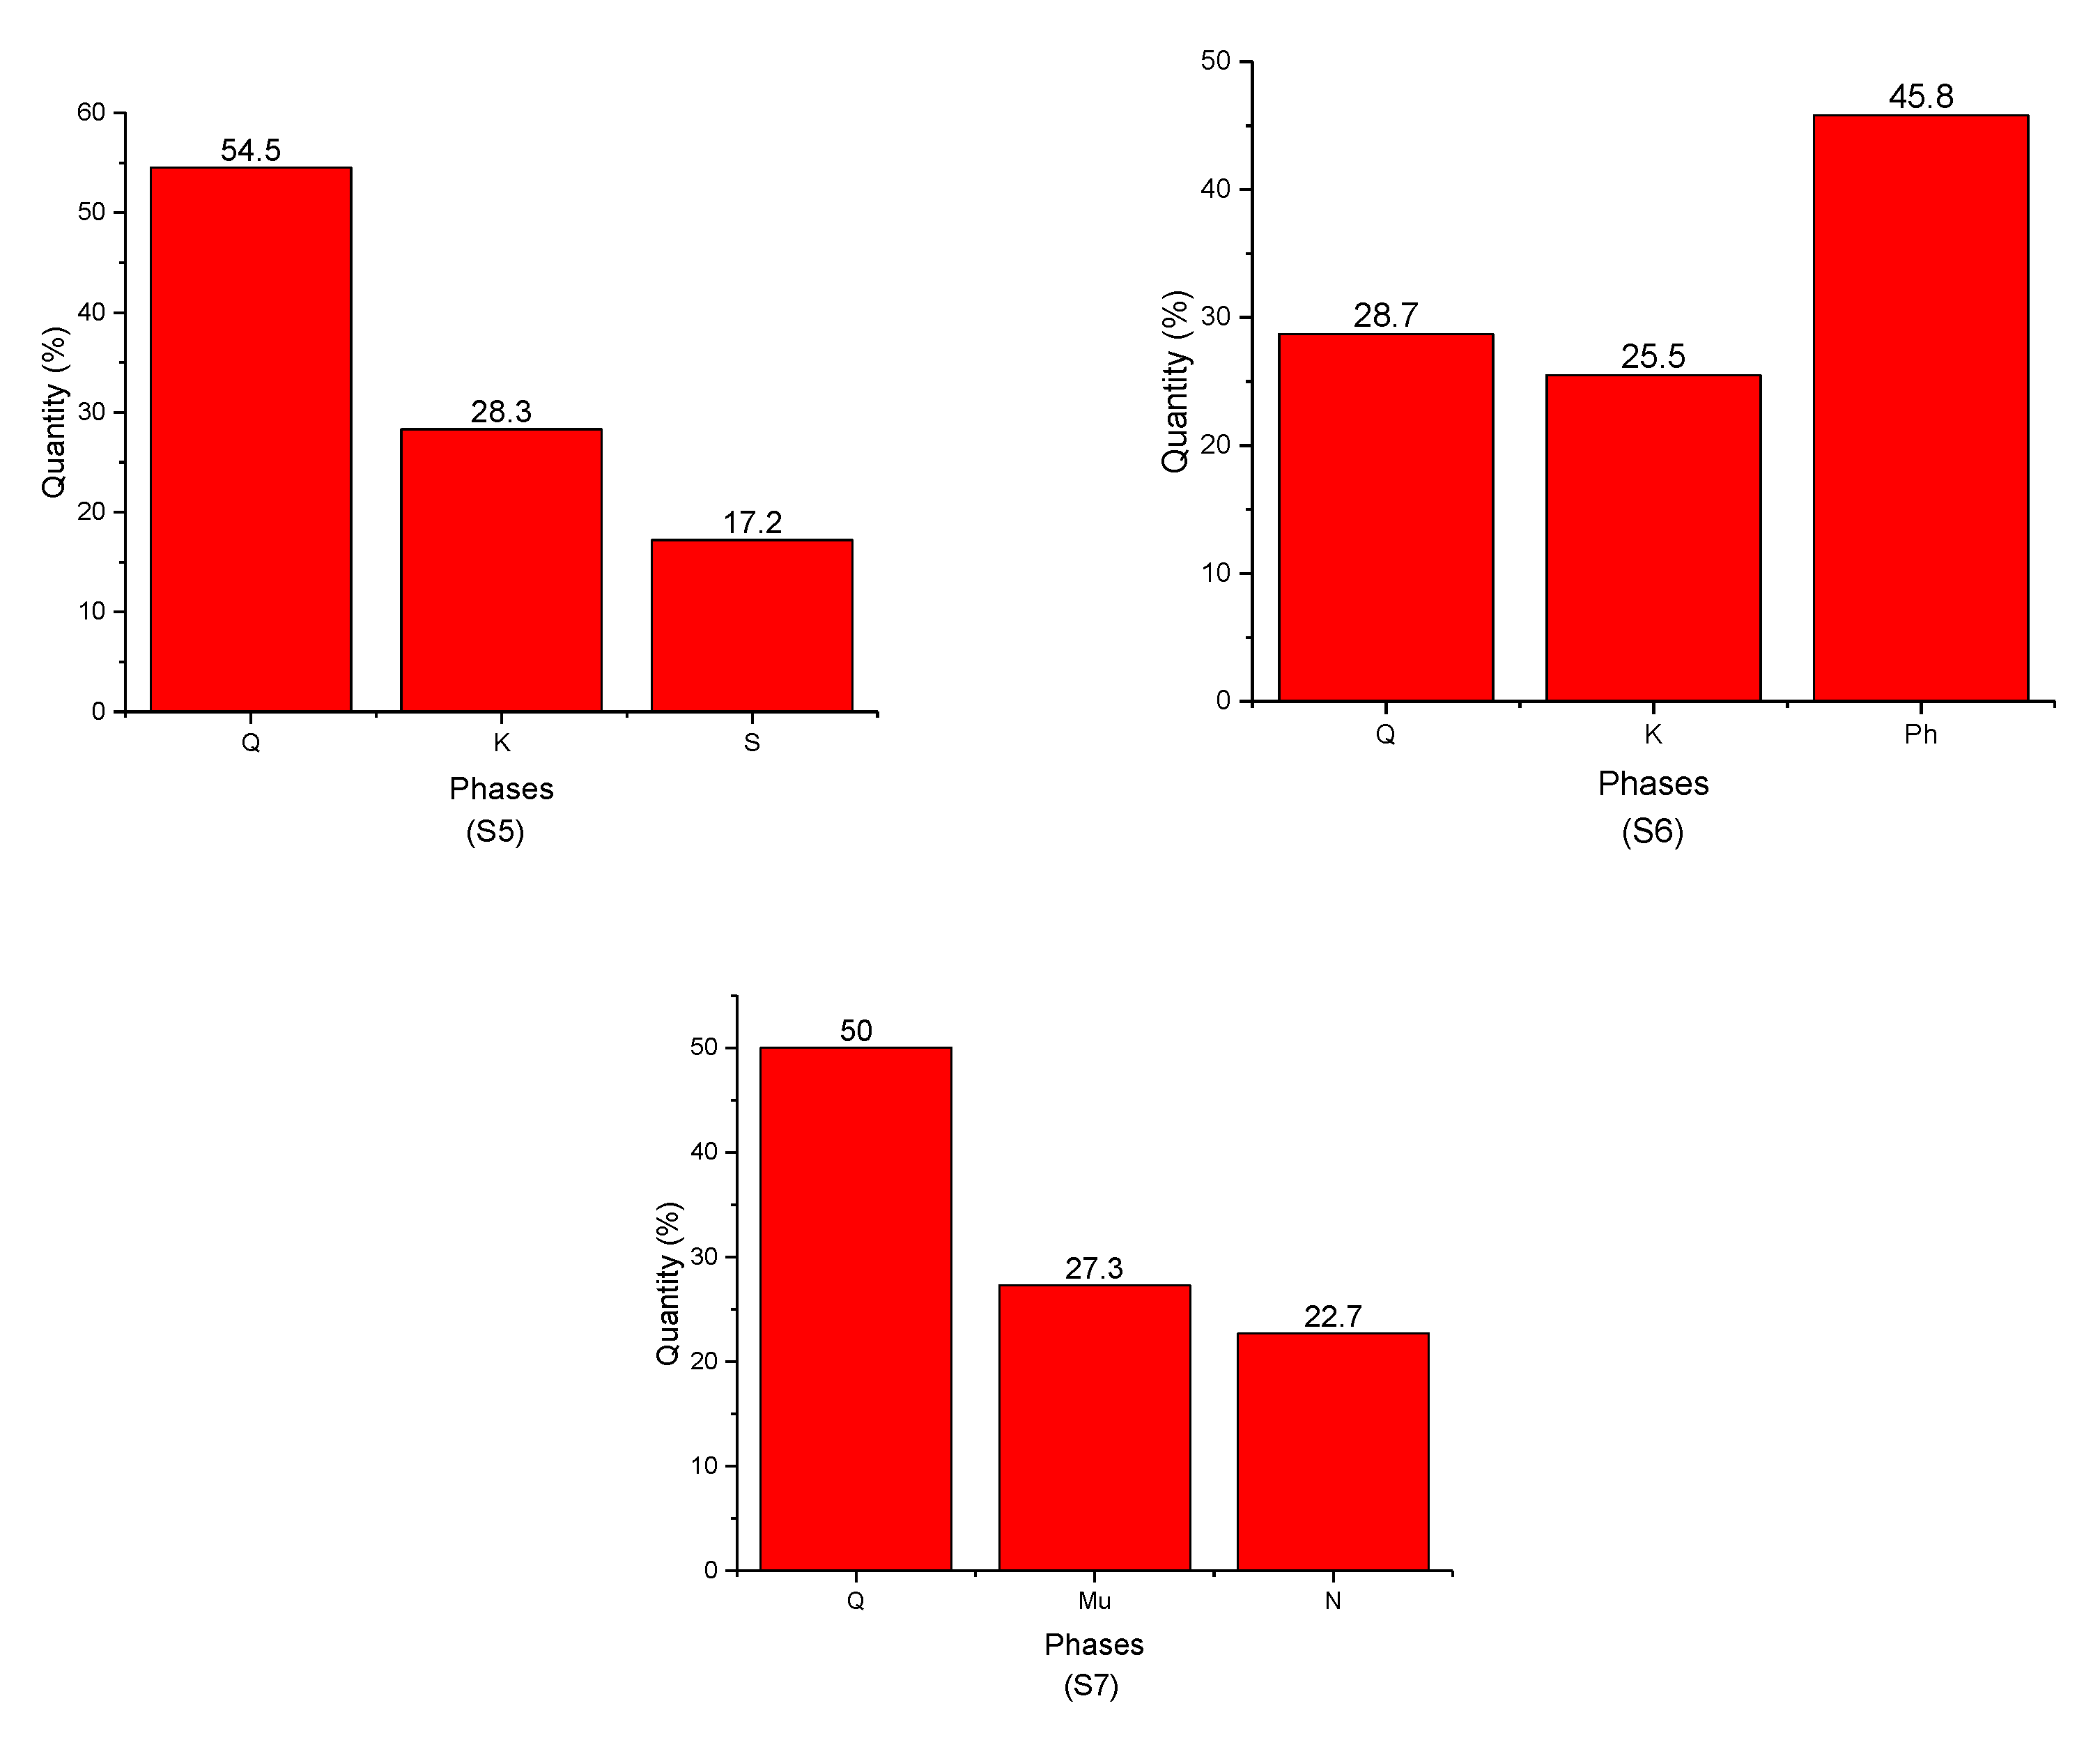
- Quartz was present in all samples with different percentages;
- -
- Ph-3T was present in (S1) and (S3);
- -
- Mu was found in (S3), (S4), and (S7);
- -
- K was present in (S4), (S5), and (S6);
- -
- F was found only in (S1);
- -
- Mo and V were found in (S2);
- -
- S, N, and Ph were present in (S5), (S6), and (S7), respectively.
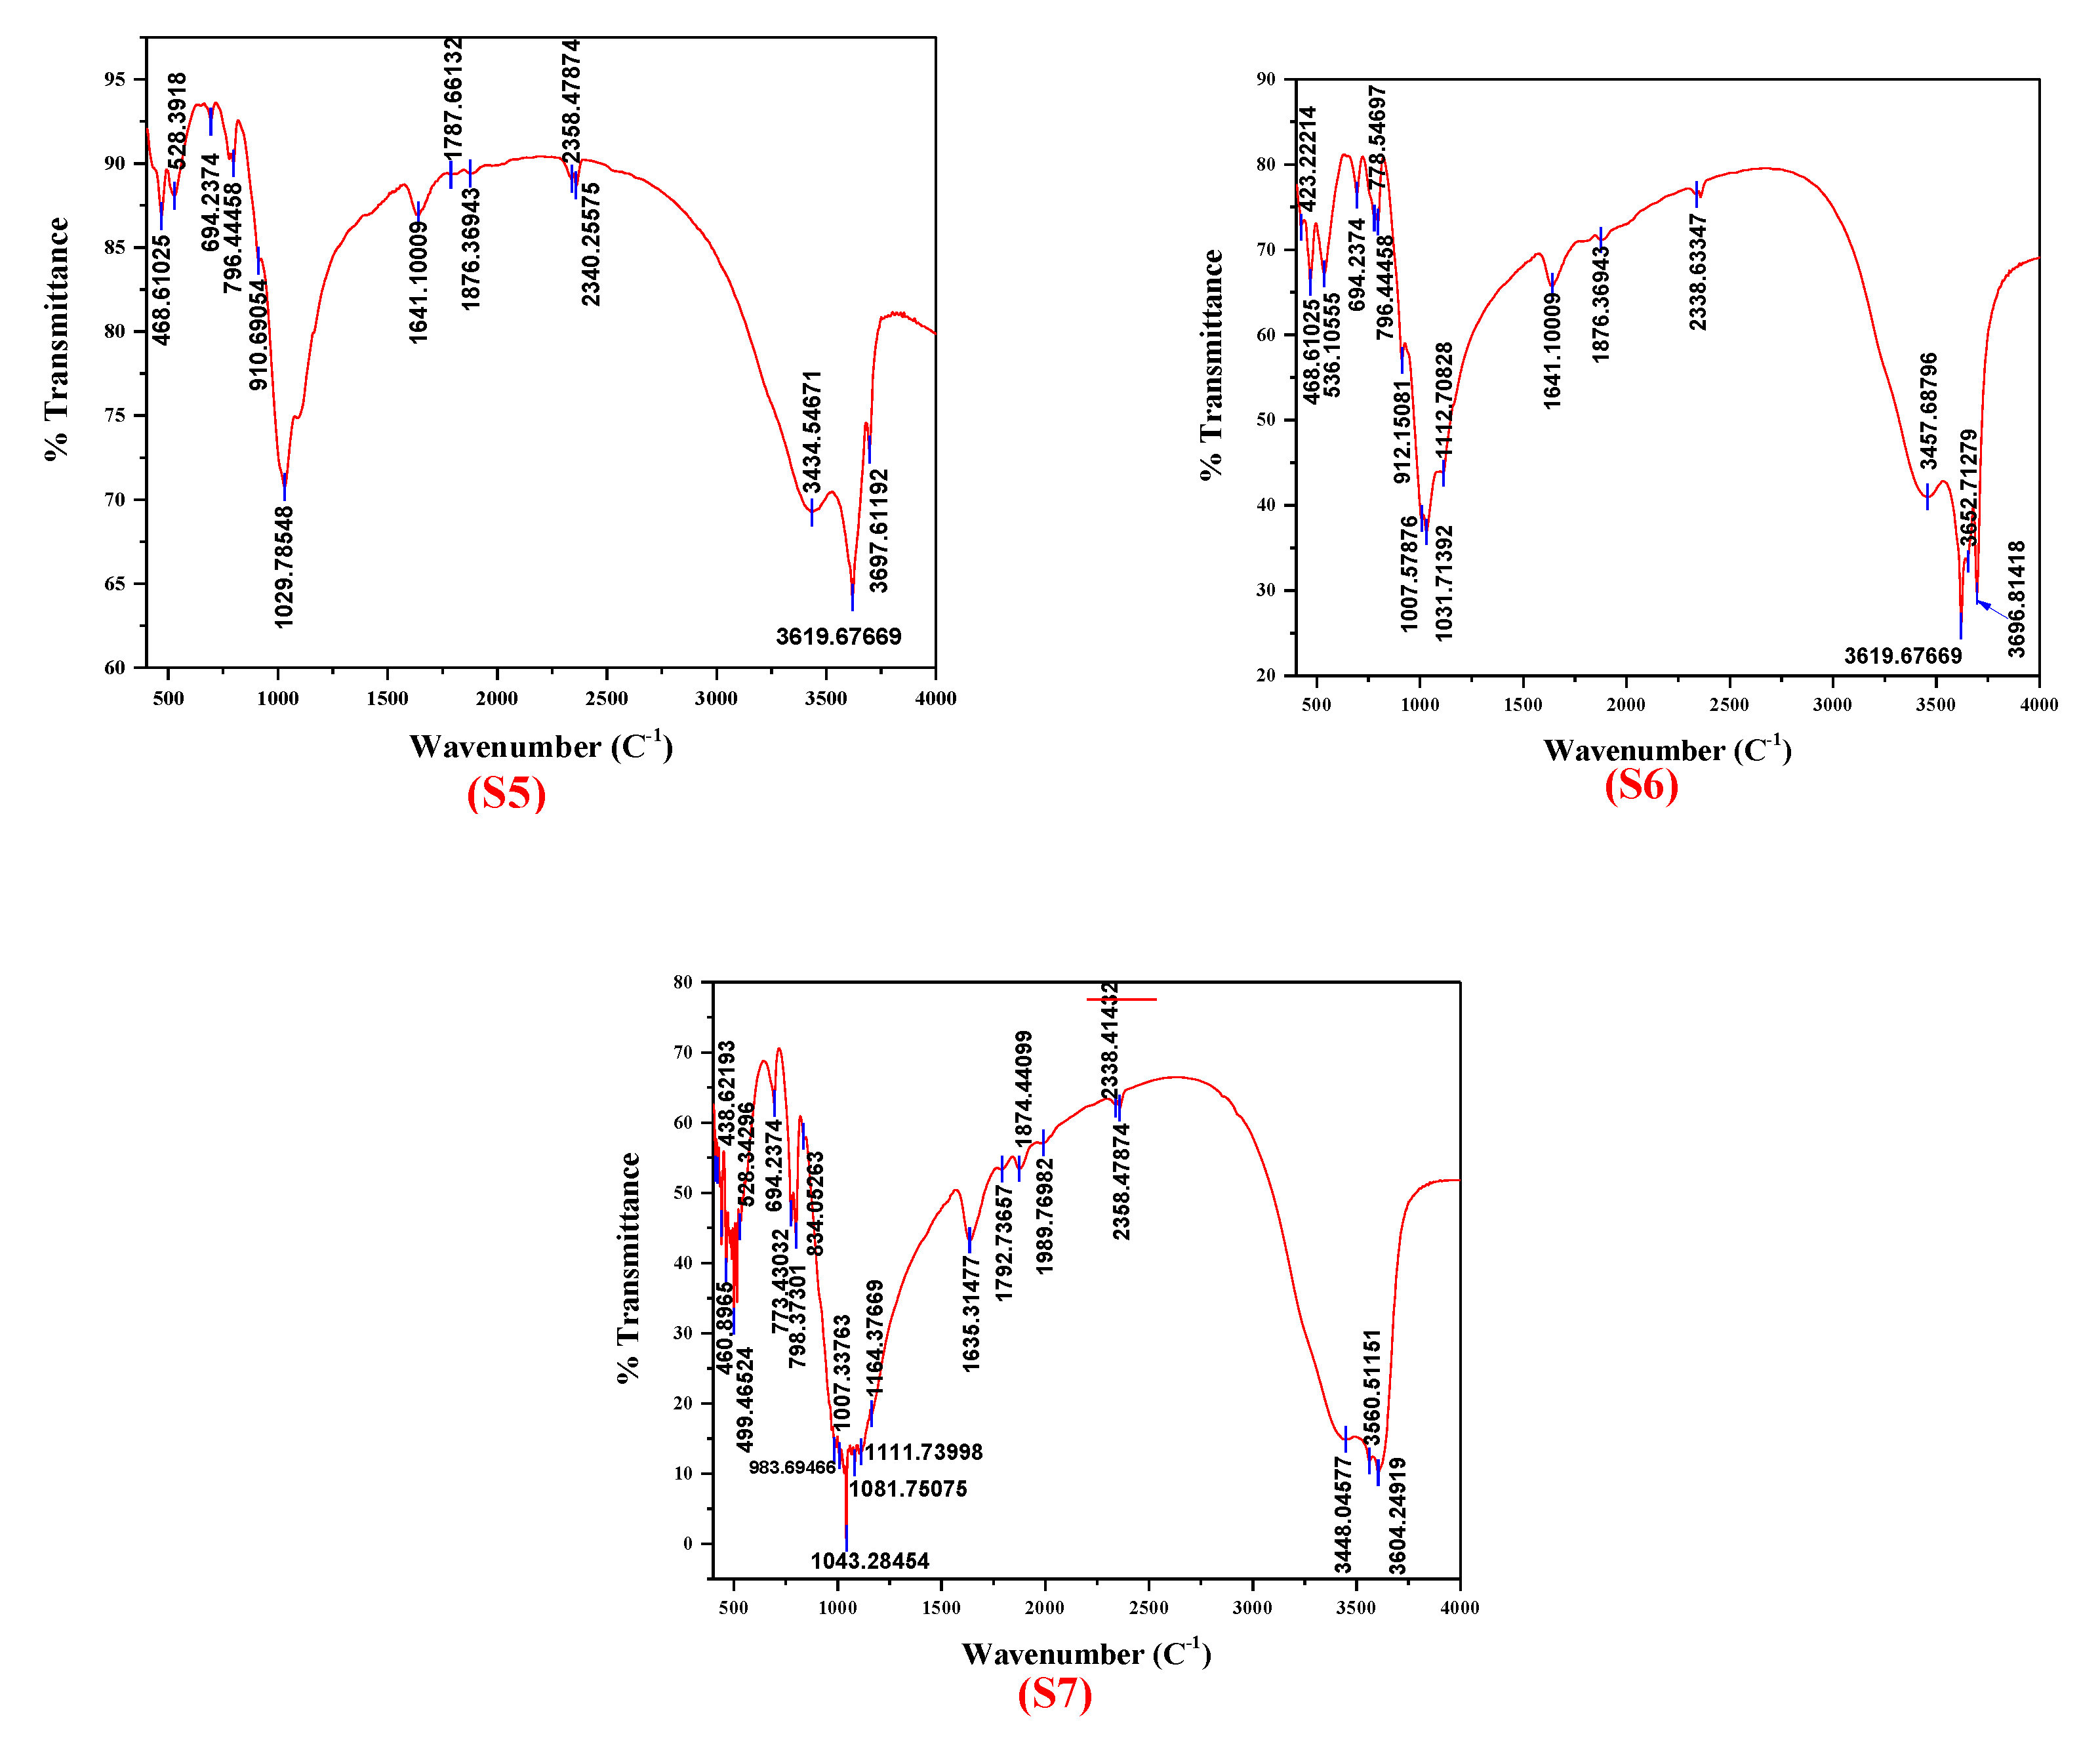
3.2. FTIR Analysis
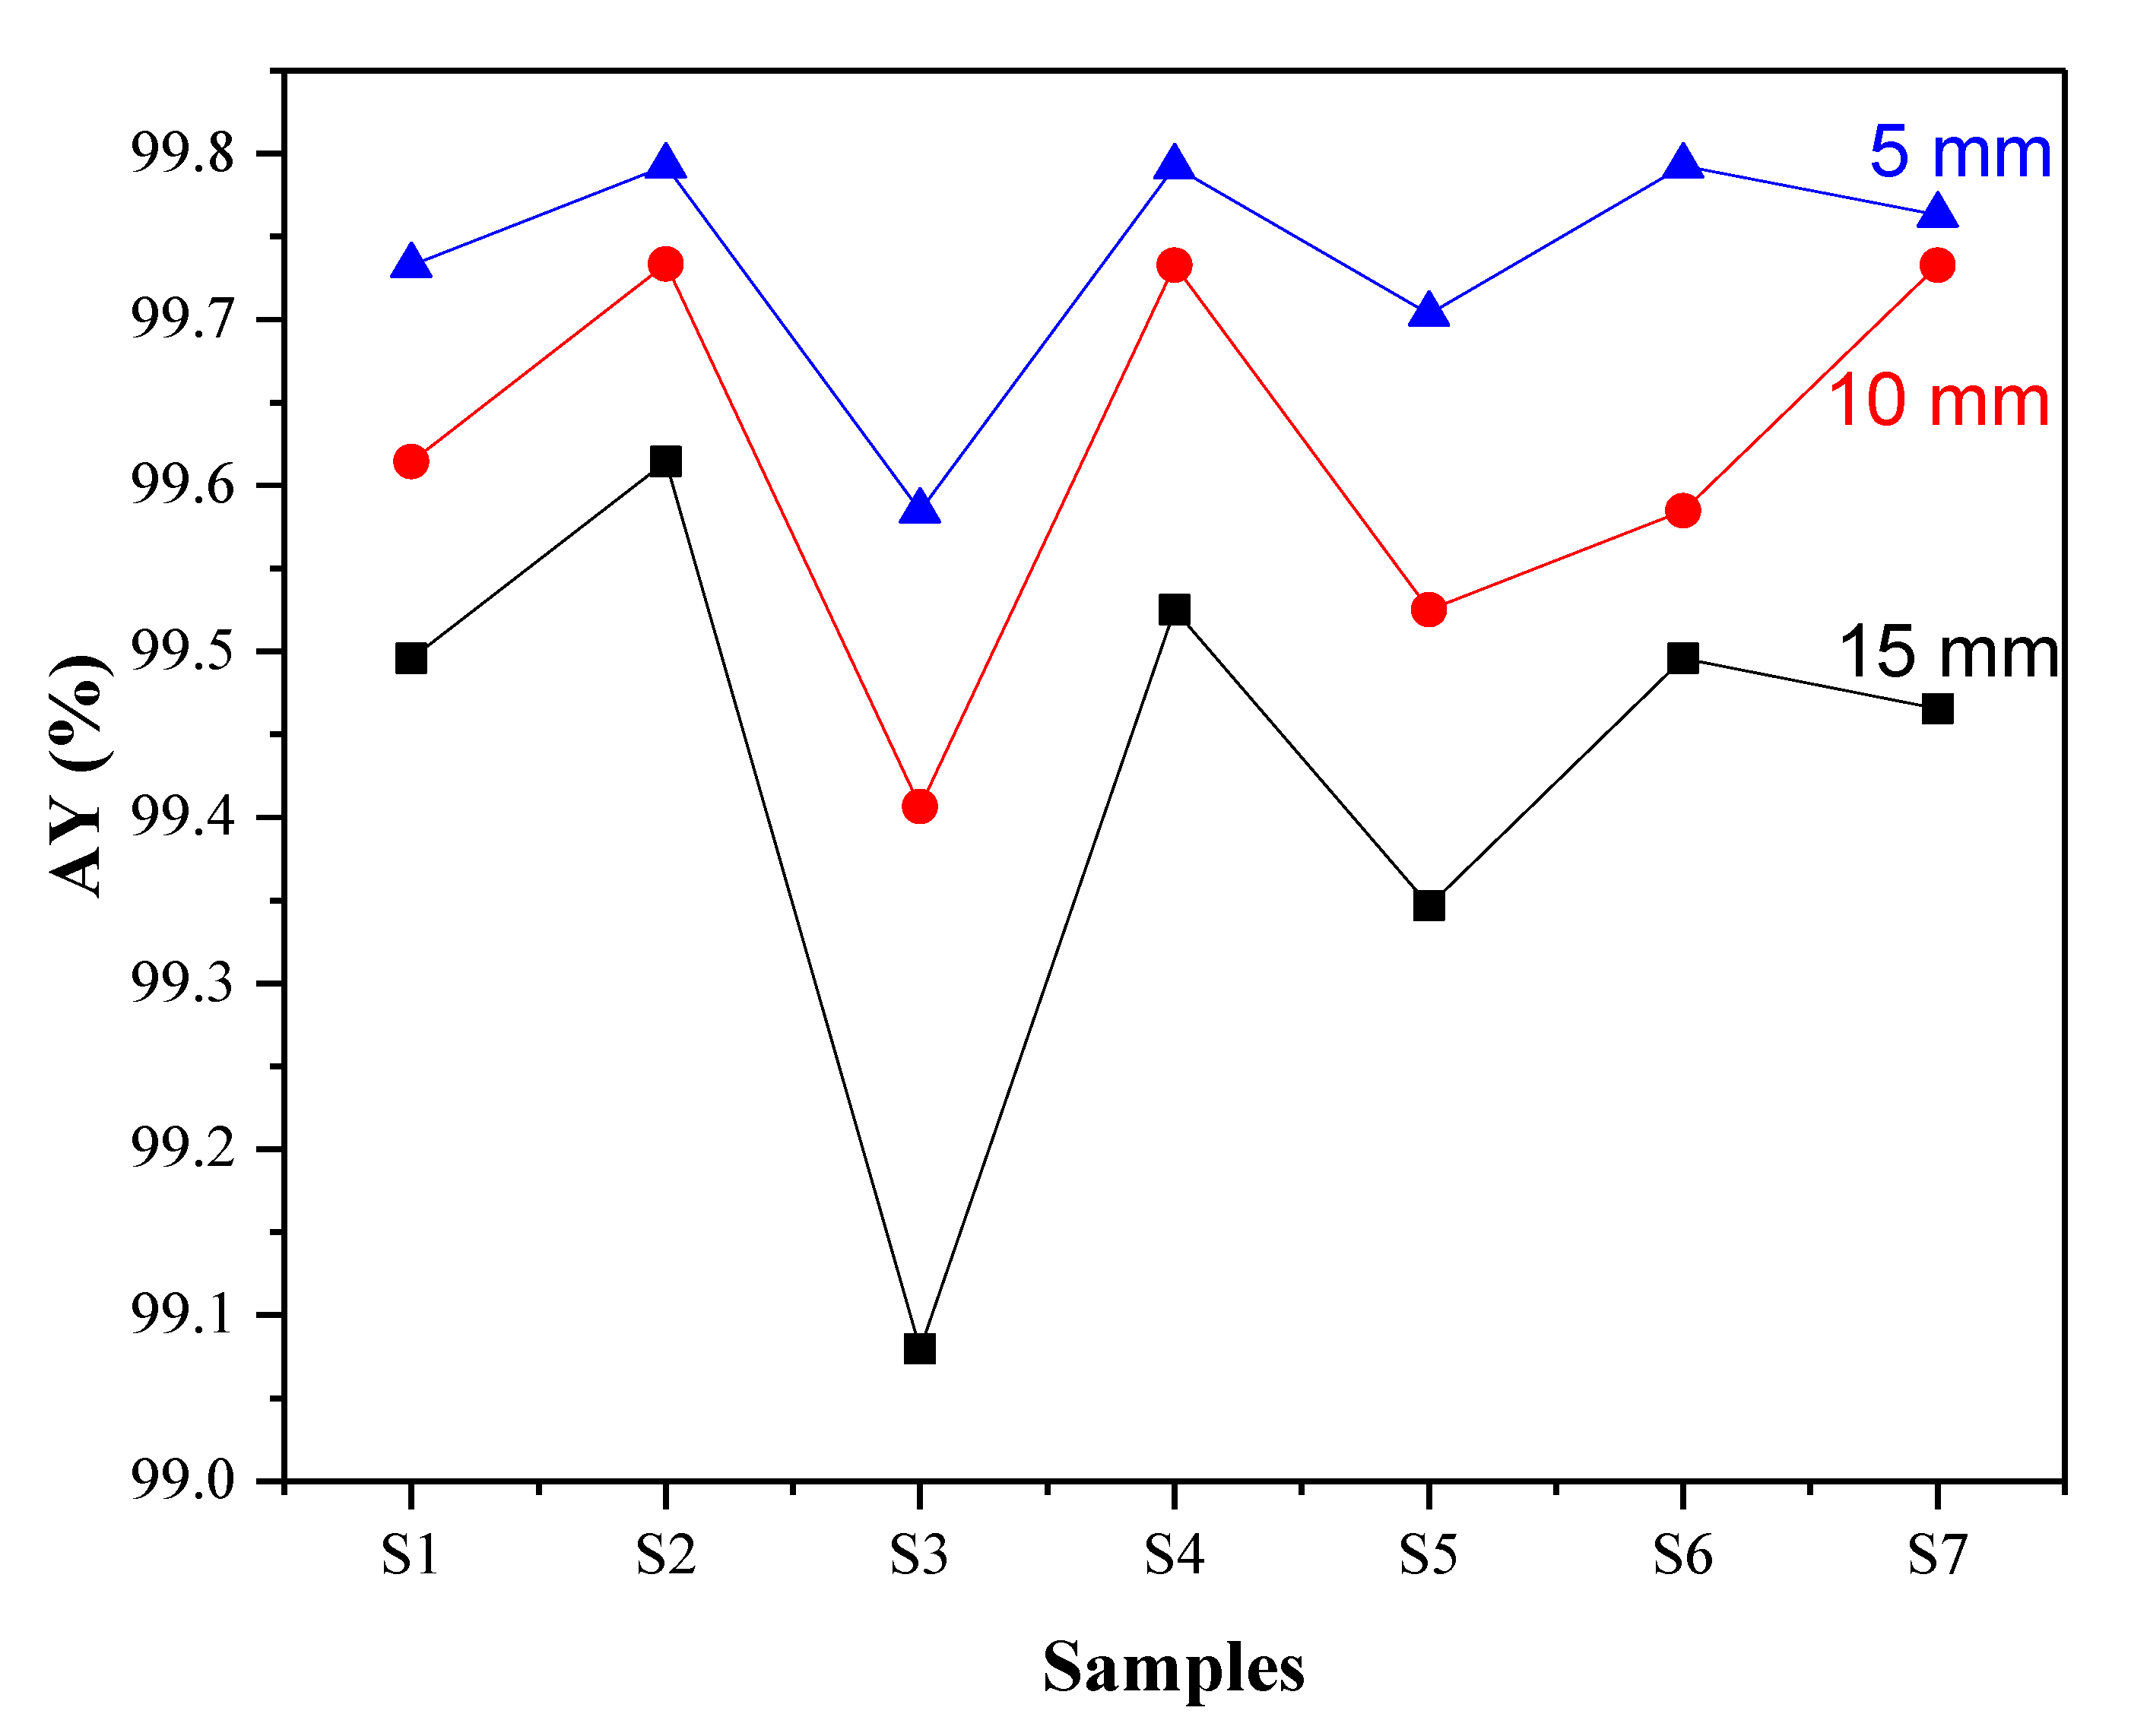
3.3. Effect of Radiation Protection (Shielding)
4. Conclusions
- -
- XRD analysis showed that the studied and extracted clays from different regions of Adrar in Algeria could be classified as nanomaterials because the estimated crystallite size was found to be less than 100 nm, e.g., up to 3 nm for the feldspar phase.
- -
- The samples consisted of several phases, but the quartz phase was present irrespective of the nature of the clay with varying proportions. The vermiculite had the smallest ratio (3.3%), and the montmorillonite (30.7%) phase was found only in the sample green clay—Adrar.
- -
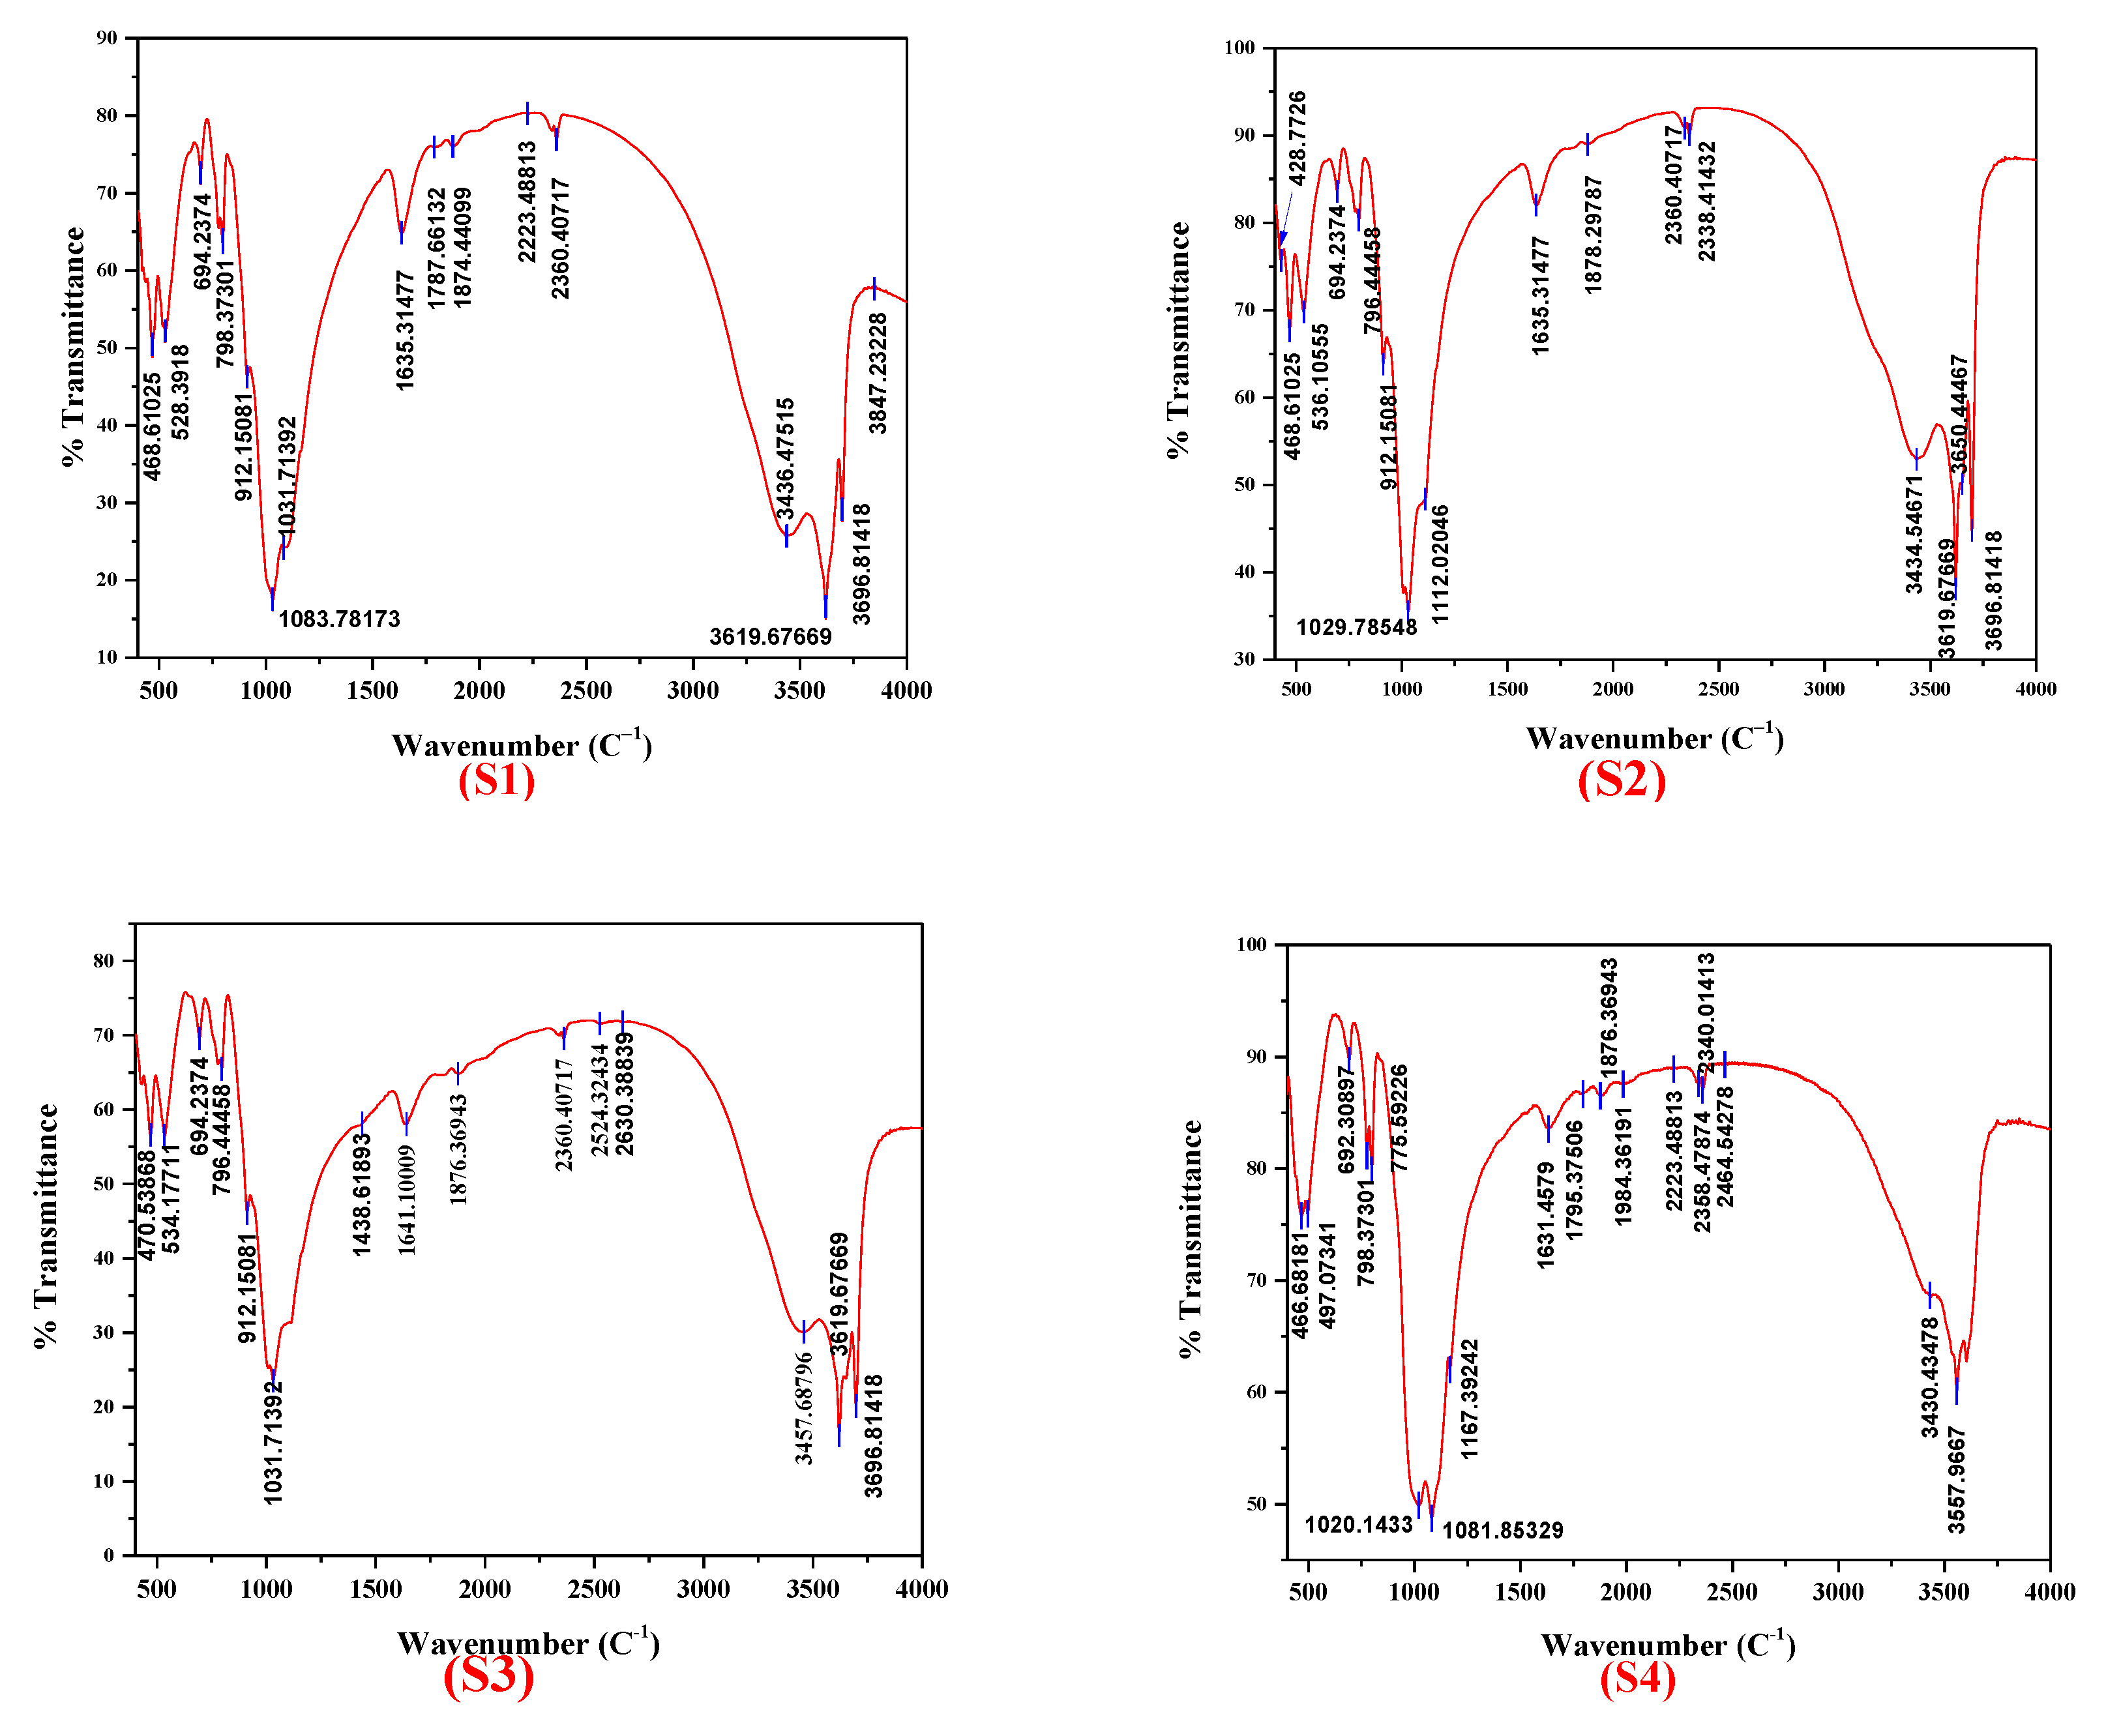
- FTIR bands appearing in two well-defined spectral regions originated from OH and SiO4 vibrations for all clay samples. FTIR confirmed the phases already observed by XRD analysis but also revealed new phases such as biotite (band ~3557 cm−1) for the samples red clay—Reggan and red clay—Timimoune as well as kaolinite (band ~466 cm−1) for the samples green clay—Adrar, red clay—Adrar, and white clay—Reggan.
- -
- The mass absorption coefficient (µ/ρ) and radiative attenuation ratio (RA) were found to be mainly affected by the nature, quantity of atoms, and thickness of the clay samples. The highest shielding values were obtained for sample green clay—Adrar, reaching 99.79% and 243.43 cm2/g for (RA) and (µ/ρ), respectively. This may be due to the vermiculite phase.
Author Contributions
Funding
Institutional Review Board Statement
Informed Consent Statement
Data Availability Statement
Conflicts of Interest
References
- Budoff, M.J.; Achenbach, S.; Hecht, H.S.; Narula, J. (Eds.) Atlas of Cardiovascular Computed Tomography; Springer: Berlin/Heidelberg, Germany, 2018. [Google Scholar]
- Stabin, M.G. (Ed.) Radiation Protection and Dosimetry; Springer: New York, NY, USA, 2007. [Google Scholar]
- Hassan, Y.A.; Chaplin, R.A. (Eds.) Nuclear Energy Materials and Reactors—Volume I; EOLSS Publications: Oxford, UK, 2010. [Google Scholar]
- Zhao, T.; Zhang, S.-X. X-ray Image Enhancement Based on Nonsubsampled Shearlet Transform and Gradient Domain Guided Filtering. Sensors 2022, 22, 4074. [Google Scholar] [CrossRef] [PubMed]
- Thalhammer, S.; Hörner, A.; Küß, M.; Eberle, S.; Pantle, F.; Wixforth, A.; Nagel, W. GaN Heterostructures as Innovative X-ray Imaging Sensors—Change of Paradigm. Micromachines 2022, 13, 147. [Google Scholar] [CrossRef] [PubMed]
- Parkman, T.; Nevrkla, M.; Jančárek, A.; Turňová, J.; Pánek, D.; Vrbová, M. Table-Top Water-Window Microscope Using a Capillary Discharge Plasma Source with Spatial Resolution 75 nm. Appl. Sci. 2020, 10, 6373. [Google Scholar] [CrossRef]
- Hassan, T.; Shafay, M.; Akçay, S.; Khan, S.; Bennamoun, M.; Damiani, E.; Werghi, N. Meta-Transfer Learning Driven Tensor-Shot Detector for the Autonomous Localization and Recognition of Concealed Baggage Threats. Sensors 2020, 20, 6450. [Google Scholar] [CrossRef]
- Schmoeller, M.; Stadter, C.; Kick, M.K.; Geiger, C.; Zaeh, M.F. A Novel Approach to the Holistic 3D Characterization of Weld Seams—Paving the Way for Deep Learning-Based Process Monitoring. Materials 2021, 14, 6928. [Google Scholar] [CrossRef]
- Singh, S.; Sajwan, M.; Singh, D. COVID-19 Chest X-Rays Classification Using Deep Learning. In Computational Intelligence and Applications for Pandemics and Healthcare; IGI Global: Hershey, PA, USA, 2022; pp. 25–39. [Google Scholar]
- Abramova, E.; Popova, N.; Artemiev, G.; Zharkova, V.; Zakharova, E.; Safonov, A. Characteristics and rates of microbial processes in clays of different mineral and elemental composition in relation to safety prediction for ESB clay materials. Appl. Sci. 2022, 12, 1843. [Google Scholar] [CrossRef]
- Yu, J. Nuclear physics. In Fundamental Principles of Nuclear Engineering; Springer: Singapore, 2022; pp. 543–576. [Google Scholar]
- Abergel, R.; Aris, J.; Bolch, W.E.; Dewji, S.A.; Golden, A.; Hooper, D.A.; Margot, D.; Menker, C.G.; Paunesku, T.; Schaue, D.; et al. The Enduring Legacy of Marie Curie: Impacts of Radium in 21st Century Radiological and Medical Sciences. Int. J. Radiat. Biol. 2022, 98, 267–275. [Google Scholar] [CrossRef]
- Bartley, P. The Home Front: 1914–1918. In Women’s Activism in Twentieth-Century Britain; Palgrave Macmillan: Cham, Switzerland, 2022; pp. 37–61. [Google Scholar]
- Yu, J. Radiation Protection. In Fundamental Principles of Nuclear Engineering; Springer: Singapore, 2022; pp. 673–699. [Google Scholar]
- Walencik-Łata, A.; Szkliniarz, K.; Kisiel, J.; Polaczek-Grelik, K.; Jędrzejczak, K.; Kasztelan, M.; Szabelski, J.; Orzechowski, J.; Tokarski, P.; Marszał, W.; et al. Characteristics of Natural Background Radiation in the GIG Experimental Mine ‘Barbara’, Poland. Energies 2022, 15, 685. [Google Scholar] [CrossRef]
- An, K.; Kim, C.; Cho, K.H.; Bae, S.; Cha, B.K.; Kang, K.T. Spectral response tuning of organic photodetectors using strong microcavity effects for medical X-ray detector application. Org. Electron. 2022, 100, 106384. [Google Scholar] [CrossRef]
- Muralidharan, N.; Gupta, S.; Prusty, M.R.; Tripathy, R.K. Detection of COVID19 from X-ray images using multiscale Deep Convolutional Neural Network. Appl. Soft Comput. 2022, 119, 108610. [Google Scholar] [CrossRef]
- Yang, Z.; Liu, Z.; Zhu, J.; Xu, J.; Pu, Y.; Bao, Y. Green synthesis and characterization of gold nanoparticles from Pholiota adiposa and their anticancer effects on hepatic carcinoma. Drug Deliv. 2022, 29, 997–1006. [Google Scholar] [CrossRef] [PubMed]
- He, D.; Zhang, N.; Iqbal, A.; Ma, Y.; Lu, X.; Qiao, Z.A.; Yu, J.H.; Xu, H.; Wang, W.; Zhao, R.; et al. Multispectral electromagnetic shielding using ultra-thin metal-metal oxide decorated hybrid nanofiber membranes. Commun. Mater. 2021, 2, 101. [Google Scholar] [CrossRef]
- Sugita, Y.; Kikuchi, H.; Hoshino, E. Backfill Material Characteristics Using the Bentonite/Excavated Rock Mixture in the Horonobe Underground Research Laboratory Project (Contract Research); Japan Atomic Energy Agency: Ibaraki, Japan, 2021. [Google Scholar]
- Sayyed, M.I.; Elsafi, M.; Almuqrin, A.H.; Cornish, K.; Elkhatib, A.M. Novel Shielding Mortars for Radiation Source Transportation and Storage. Sustainability 2022, 14, 1248. [Google Scholar] [CrossRef]
- Sayyed, M.I.; Albarzan, B.; Almuqrin, A.H.; El-Khatib, A.M.; Kumar, A.; Tishkevich, D.I.; Elsafi, M. Experimental and theoretical study of radiation shielding features of CaO-K2O-Na2O-P2O5 glass systems. Materials 2021, 14, 3772. [Google Scholar] [CrossRef]
- Sayyed, M.I.; Askin, A.; Zaid, M.H.M.; Olukotun, S.F.; Khandaker, M.U.; Tishkevich, D.I.; Bradley, D.A. Radiation shielding and mechanical properties of Bi2O3–Na2O–TiO2–ZnO–TeO2 glass system. Radiat. Phys. Chem. 2021, 186, 109556. [Google Scholar] [CrossRef]
- Thibeault, S.A.; Kang, J.H.; Sauti, G.; Park, C.; Fay, C.C.; King, G.C. Nanomaterials for radiation shielding. MRS Bull. 2015, 40, 836–841. [Google Scholar] [CrossRef]
- Bagheri, K.; Razavi, S.M.; Ahmadi, S.J.; Kosari, M.; Abolghasemi, H. Thermal resistance, tensile properties, and gamma radiation shielding performance of unsaturated polyester/nanoclay/PbO composites. Radiat. Phys. Chem. 2018, 146, 5–10. [Google Scholar] [CrossRef]
- Ban, R.; Chen, X.; Yang, X.; Wang, J.; Pan, Z.; Song, Y. Strength and electrical resistivity characteristic of carbonating reactive MgO-mixed red clay under different water contents. Arab. J. Geosci. 2022, 15, 657. [Google Scholar] [CrossRef]
- Ammar, L.B.; Fakhfakh, S.; Jbara, O.; Rondot, S. Effect of nanoclay concentration level on the electrical properties of polypropylene under electron irradiation in a SEM. J. Microsc. 2017, 265, 322–334. [Google Scholar] [CrossRef]
- Zhu, Y.; Iroh, J.O.; Rajagopolan, R.; Aykanat, A.; Vaia, R. Optimizing the Synthesis and Thermal Properties of Conducting Polymer–Montmorillonite Clay Nanocomposites. Energies 2022, 15, 1291. [Google Scholar] [CrossRef]
- Jafari Horastani, S.; Karevan, M.; Ghane, M. Structural, thermal, and viscoelastic response of nanoclay reinforced polylactic acid/thermoplastic polyurethane shape-memory nanocomposites of low transition temperature. Polym. Adv. Technol. 2022, 5727, 1–16. [Google Scholar] [CrossRef]
- Song, Y.; Wang, J.Q.; Chen, X.J.; Yu, S.Z.; Ban, R.L.; Yang, X.; Zhang, X.; Han, Y. Study the effects of dry-wet cycles and cadmium pollution on the mechanical properties and microstructure of red clay. Environ. Pollut. 2022, 302, 119037. [Google Scholar] [CrossRef] [PubMed]
- Rafiee, R.; Shahzadi, R. Mechanical properties of nanoclay and nanoclay reinforced polymers: A review. Polym. Compos. 2019, 40, 431–445. [Google Scholar] [CrossRef]
- Vajglová, Z.; Simakova, I.L.; Eränen, K.; Mäki-Arvela, P.; Kumar, N.; Peurla, M.; Tolvanen, S.; Efimov, A.; Hupa, L.; Peltonen, J.; et al. The physicochemical and catalytic properties of clay extrudates in cyclization of citronellal. Appl. Catal. A Gen. 2022, 629, 118426. [Google Scholar] [CrossRef]
- Agafonov, A.V.; Kudryakova, N.O.; Ramenskaya, L.M.; Grishina, E.P. The confinement and anion type effect on the physicochemical properties of ionic liquid/halloysite nanoclay ionogels. Arab. J. Chem. 2020, 13, 9090–9104. [Google Scholar] [CrossRef]
- Gomes, C.; Rautureau, M.; Poustis, J.; Gomes, J. Benefits and Risks of Clays and Clay Minerals to Human Health from Ancestral to Current Times: A Synoptic Overview. Clays Clay Miner. 2022, 69, 612–632. [Google Scholar] [CrossRef]
- Xu, H. People’s Livelihood of the City. In The Earliest China; Springer: Singapore, 2022; pp. 201–214. [Google Scholar]
- Selvan, B.K.; Thiyagarajan, K.; Das, S.; Jaya, N.; Jabasingh, S.A.; Saravanan, P.; Rajasimman, M.; Vasseghian, Y. Synthesis and characterization of nano zerovalent iron-kaolin clay (nZVI-Kaol) composite polyethersulfone (PES) membrane for the efficacious As2O3 removal from potable water samples. Chemosphere 2022, 288, 132405. [Google Scholar] [CrossRef]
- Momeni, M.; Bayat, M.; Ajalloeian, R. Laboratory investigation on the effects of pH-induced changes on geotechnical characteristics of clay soil. Geomech. Geoeng. 2022, 17, 188–196. [Google Scholar] [CrossRef]
- Almurayshid, M.; Alssalim, Y.; Aksouh, F.; Almsalam, R.; ALQahtani, M.; Sayyed, M.I.; Almasoud, F. Development of new lead-free composite materials as potential radiation shields. Materials 2021, 14, 4957. [Google Scholar] [CrossRef]
- Monzen, H.; Kanno, I.; Fujimoto, T.; Hiraoka, M. Estimation of the shielding ability of a tungsten functional paper for diagnostic X-rays and gamma rays. J. Appl. Clin. Med. Phys. 2017, 18, 325–329. [Google Scholar] [CrossRef]
- Hashemi, S.A.; Mousavi, S.M.; Faghihi, R.; Arjmand, M.; Rahsepar, M.; Bahrani, S.; Lai, C.W. Superior X-ray radiation shielding effectiveness of biocompatible polyaniline reinforced with hybrid graphene oxide-iron tungsten nitride flakes. Polymers 2020, 12, 1407. [Google Scholar] [CrossRef] [PubMed]
- Bortolotti, M.; Lutterotti, L.; Pepponi, G. Combining XRD and XRF analysis in one Rietveld-like fitting. Powder Diffr. 2017, 32, S225–S230. [Google Scholar] [CrossRef]
- Mould, R.F. William David Coolidge (1873–1975). Biography with special reference to X-ray tubes. Biul. Pol. Tow. Onkol. Nowotwory 2017, 2, 345–352. [Google Scholar] [CrossRef]
- Li, J.Q.; Xie, X.Y.; Li, S.H.; Zhang, Q.H. Reliable potential and spatial size of virtual cathode obtained by an emissive probe with accurate filament temperature in a vacuum. Vacuum 2022, 200, 111013. [Google Scholar] [CrossRef]
- Langland, O.E.; Langlais, R.P.; Preece, J.W. Principles of Dental Imaging; Lippincott Williams & Wilkins: Philadelphia, PA, USA, 2002. [Google Scholar]
- Hau-Riege, S.P. High-Intensity X-rays-Interaction with Matter: Processes in Plasmas, Clusters, Molecules and Solids; John Wiley & Sons: Hoboken, NJ, USA, 2012. [Google Scholar]
- Laperche, V.; Metayer, C.; Gaschaud, J.; Wavrer, P.; Quiniou, T. On the Influence and Correction of Water Content on pXRF Analysis of Lateritic Nickel Ore Deposits in the Context of Open Pit Mines of New-Caledonia. Minerals 2022, 12, 415. [Google Scholar] [CrossRef]
- Wang, D.; Wu, S.; Zhou, M.; Zhao, J.; Li, G.; Wang, K.; Lin, L. Application of multi-wavelength dual-position absorption spectrum to improve the accuracy of leukocyte spectral quantitative analysis based on “M + N” theory. Spectrochim. Acta Part A Mol. Biomol. Spectrosc. 2022, 276, 121199. [Google Scholar] [CrossRef]
- Zahran, H.Y.; Mohammed, M.I.; Alqahtani, M.S.; Reben, M.; Algarni, H.; Umar, A.; Albargi, H.B.; Yahia, I.S.; Abdel-wahab, M.S.; Ibrahim, M.A. Radiation attenuation properties of the quaternary semiconducting compounds Cu2CoGe [S, Se, Te] 4. Results Phys. 2022, 37, 105488. [Google Scholar] [CrossRef]
- Ding, B.; Zhang, L.; Liu, J. Study on Shielding and Radiation Resistance of Basalt Fiber to Gamma Ray. Materials 2022, 15, 2522. [Google Scholar] [CrossRef]
- Sakher, E.; Loudjani, N.; Benchiheub, M.; Belkahla, S.; Bououdina, M. Microstructure Characterization of Nanocrystalline Ni₅₀Ti₅₀ Alloy Prepared via Mechanical Alloying Method Using the Rietveld Refinement Method Applied to the X-ray Diffraction. Nanosyst. Nanomater. Nanotechnol. 2017, 15, 401–416. [Google Scholar]
- Zhao, N.; Ju, F.; Song, Q.; Pan, H.; Ling, H. A simple empirical model for phenanthrene adsorption on soil clay minerals. J. Hazard. Mater. 2022, 429, 127849. [Google Scholar] [CrossRef]
- Warcholinski, B.; Gilewicz, A.; Lupicka, O.; Kuprin, A.S.; Tolmachova, G.N.; Ovcharenko, V.D.; Chizhik, S.A. Structure of CrON coatings formed in vacuum arc plasma fluxes. Surf. Coat. Technol. 2017, 309, 920–930. [Google Scholar] [CrossRef]
- Warcholinski, B.; Gilewicz, A.; Kuprin, A.S.; Tolmachova, G.N.; Ovcharenko, V.D.; Kuznetsova, T.A.; Chizhik, S.A. Mechanical properties of Cr-ON coatings deposited by cathodic arc evaporation. Vacuum 2018, 156, 97–107. [Google Scholar] [CrossRef]
- Khandelwal, S.; Rhee, K.Y. Evaluation of pozzolanic activity, heterogeneous nucleation, and microstructure of cement composites with modified bentonite clays. Constr. Build. Mater. 2022, 323, 126617. [Google Scholar] [CrossRef]
- Costa, L.M.; Almeida, N.G.; Houmard, M.; Cetlin, P.R.; Silva, G.J.; Aguilar, M.T. Influence of the addition of amorphous and crystalline silica on the structural properties of metakaolin-based geopolymers. Appl. Clay Sci. 2021, 215, 106312. [Google Scholar] [CrossRef]
- Zunino, F.; Scrivener, K. Microstructural developments of limestone calcined clay cement (LC3) pastes after long-term (3 years) hydration. Cem. Concr. Res. 2022, 153, 106693. [Google Scholar] [CrossRef]
- Zunino, F.; Scrivener, K. Oxidation of pyrite (FeS2) and troilite (FeS) impurities in kaolinitic clays after calcination. Mater. Struct. 2022, 55, 9. [Google Scholar] [CrossRef]
- TAM da Cruz, T.A.; Geraldo, R.H.; Costa, A.R.; Maciel, K.R.; Gonçalves, J.P.; Camarini, G. Microstructural and mineralogical compositions of metakaolin-lime-recycled gypsum plaster ternary systems. J. Build. Eng. 2022, 47, 103770. [Google Scholar]
- Sakher, E.; Loudjani, N.; Benchiheub, M.; Bououdina, M. Influence of milling time on structural and microstructural parameters of Ni50Ti50 prepared by mechanical alloying using Rietveld analysis. J. Nanomater. 2018, 2018, 11. [Google Scholar] [CrossRef]
- Wang, H.; Xiang, J.; Wen, X.; Du, X.; Wang, Y.; Du, Z.; Cheng, X.; Wang, S. Multifunctional Skin-inspired Resilient MXene-embedded Nanocomposite Hydrogels for Wireless Wearable Electronics. Compos. Part A Appl. Sci. Manuf. 2022, 155, 106835. [Google Scholar] [CrossRef]
- Jozanikohan, G.; Abarghooei, M.N. The Fourier transform infrared spectroscopy (FTIR) analysis for the clay mineralogy studies in a clastic reservoir. J. Pet. Explor. Prod. Technol. 2022, 2022, 1–4. [Google Scholar] [CrossRef]
- Toscano, G.; Maceratesi, V.; Leoni, E.; Stipa, P.; Laudadio, E.; Sabbatini, S. FTIR spectroscopy for determination of the raw materials used in wood pellet production. Fuel 2022, 313, 123017. [Google Scholar] [CrossRef]
- Diana, R.; Caruso, U.; Gentile, F.S.; Di Costanzo, L.; Musto, P.; Panunzi, B. Structural feature of thermo-induced fluorochromism in a 1D zinc coordination polymer. A cross-analysis by PL and FTIR spectroscopy, and DFT formalism. Dye. Pigment. 2022, 202, 110247. [Google Scholar] [CrossRef]
- Pärnpuu, S.; Astover, A.; Tõnutare, T.; Penu, P.; Kauer, K. Soil organic matter qualification with FTIR spectroscopy under different soil types in Estonia. Geoderma Reg. 2022, 28, e00483. [Google Scholar] [CrossRef]
- Valášková, M.; Klika, Z.; Vlček, J.; Matějová, L.; Martaus, A.; Topinková, M.; Palkova, H.; Madejová, J. Metakaolin-Based Geopolymers: Influence of Metakaolins on Quantitative Phase Composition and Mechanical Properties. Available online: https://ssrn.com/abstract=4060028 (accessed on 22 June 2022).
- Wickramasuriya, A.I.; Chandima Wickramasinghe Arachchige, R.; Kottegoda, I.R. Characterization and Modification of Clay for Removal of Drinking Water Hardness. Mater. Sci. Res. India 2021, 18, 318–331. [Google Scholar] [CrossRef]
- Platov, Y.T.; Platova, R.A.; Molodkina, P.G. Using Decomposition of IR Spectra to Analyze Structural-Phase Transformations of Kaolinite. J. Appl. Spectrosc. 2021, 87, 1029–1036. [Google Scholar] [CrossRef]
- Bih, N.L.; Mahamat, A.A.; Chinweze, C.; Ayeni, O.; Bidossèssi, H.J.; Onwualu, P.A.; Boakye, E.E. The Effect of Bone Ash on the Physio-Chemical and Mechanical Properties of Clay Ceramic Bricks. Buildings 2022, 12, 336. [Google Scholar] [CrossRef]
- Bismayer, U.; Srilomsak, S.; Treekamol, Y.; Tanthanuch, W.; Suriyatham, K. Artefacts from Ban Chiang, Thailand: Pottery with hematite-red geometric patterns. Z. Krist.—Cryst. Mater. 2020, 235, 559–568. [Google Scholar] [CrossRef]
- Djomgoue, P.; Njopwouo, D. FT-IR spectroscopy applied for surface clays characterization. J. Surf. Eng. Mater. Adv. Technol. 2013, 3, 275. [Google Scholar] [CrossRef]
- Jovanovski, G.; Makreski, P. Minerals from Macedonia. XXX. Complementary use of vibrational spectroscopy and X-ray powder diffraction for spectra-structural study of some cyclo-, phyllo-and tectosilicate minerals. A review. Maced. J. Chem. Chem. Eng. 2016, 35, 125–155. [Google Scholar] [CrossRef]
- Kotwaliwale, N.; Weckler, P.R.; Brusewitz, G.H. X-ray attenuation coefficients using polychromatic X-ray imaging of pecan components. Biosyst. Eng. 2006, 94, 199–206. [Google Scholar] [CrossRef]
- Ekinci, N.; Mahmoud, K.A.; Sarıtaş, S.; Aygün, B.; Hessien, M.M.; Bilici, I.; Rammah, Y.S. Development of Tincal based polypropylene polymeric materials for radiation shielding applications: Experimental, theoretical, and Monte Carlo investigations. Mater. Sci. Semicond. Process. 2022, 146, 106696. [Google Scholar] [CrossRef]
- Akbulut, S.; Sehhatigdiri, A.; Eroglu, H.; Çelik, S. A research on the radiation shielding effects of clay, silica fume and cement samples. Radiat. Phys. Chem. 2015, 117, 88–92. [Google Scholar] [CrossRef]
- Kubissa, W.; Glinicki, M.A.; Dąbrowski, M. Permeability testing of radiation shielding concrete manufactured at industrial scale. Mater. Struct. 2018, 51, 1–5. [Google Scholar] [CrossRef]
- Vagheian, M.; Sardari, D.; Saramad, S.; Ochbelagh, D.R. Experimental and theoretical investigation into X-ray shielding properties of thin lead films. Int. J. Radiat. Res. 2020, 18, 263–274. [Google Scholar]
- Kim, S.-C. Improving the X-ray Shielding Performance of Tungsten Thin-Film Plates Manufactured Using the Rolling Technology. Appl. Sci. 2021, 11, 9111. [Google Scholar] [CrossRef]
- Manjunatha, H.C.; Seenappa, L.; Chandrika, B.M.; Sridhar, K.N.; Hanumantharayappa, C. Gamma, X-ray and neutron shielding parameters for the Al-based glassy alloys. Appl. Radiat. Isot. 2018, 139, 187–194. [Google Scholar] [CrossRef]
- Dong, M.; Xue, X.; Liu, S.; Yang, H.; Li, Z.; Sayyed, M.I.; Agaret, O. Using iron concentrate in Liaoning Province, China, to prepare material for X-Ray shielding. J. Clean. Prod. 2019, 210, 653–659. [Google Scholar] [CrossRef]
- Fujisaki, K.; Tadano, S.; Todoh, M.; Giri, B. Effect of Skin and Subcutaneous Tissue on X-Ray Strain Measurement of Ti Implant. In Proceedings of the World Congress on Medical Physics and Biomedical Engineering, Munich, Germany, 7–12 September 2009; Springer: Berlin/Heidelberg, Germany, 2009. [Google Scholar]
- Öztürk, O.; Karaburç, S.N.; Saydan, M.; Keskin, U.S. High rate X-ray radiation shielding ability of cement-based composites incorporating strontium sulfate (SrSO4) minerals. Kerntechnik 2022, 87, 115–124. [Google Scholar] [CrossRef]
- Manjunatha, H.C.; Sathish, K.V.; Seenappa, L.; Gupta, D.; Raj, S.A.C. A study of X-ray, gamma and neutron shielding parameters in Si-alloys. Radiat. Phys. Chem. 2019, 165, 108414. [Google Scholar] [CrossRef]
- Tsustumi, K.; Obashi, M.; Sawada, M. Absorption Coefficients of Fine Structures of X-ray Absorption Spectra at Various Absorber Thickness. J. Phys. Soc. Jpn. 1958, 13, 43–50. [Google Scholar] [CrossRef]
- Gülbiçim, H.; Tufan, M.Ç.; Türkan, M.N. The investigation of vermiculite as an alternating shielding material for gamma rays. Radiat. Phys. Chem. 2017, 130, 112–117. [Google Scholar] [CrossRef]


| Samples | Code | Color | Dimensions (mm) | Weight (g) | |||
|---|---|---|---|---|---|---|---|
| Natural Samples | Synthesized Samples | ||||||
| 5 mm | X1 = 5 mm | X2 = 10 mm | X3 = 15 mm | ||||
| Clay of Adrar | S1 | Green-Yellow | Length = 30 Width = 25 Thickness: X1 = 5 X2 = 10 X3 = 15 | 7.23 | 12.48 | 17.10 | 30.33 |
| S2 | Green | 5.48 | 15.41 | 24.70 | 31.10 | ||
| S3 | Red | / | 9.70 | 18.41 | 30.17 | ||
| Clay of Reggan | S4 | Red | 7.80 | 11.75 | 19.06 | 24.50 | |
| S5 | White | / | 14.34 | 20.80 | 31.67 | ||
| S6 | White-Red | 7.15 | 13.11 | 21.54 | 33.14 | ||
| Clay of Timimoune | S7 | Red | 7.87 | 10.35 | 18.19 | 28.90 | |
| Phases | Chemical Formula | Crystal System | Space Group | Cell Parameters (a, b, c) in Å; (α, β, γ) in ° | Volume (Å3) | |
|---|---|---|---|---|---|---|
| Q | Si3.00O6.00 | Hexagonal | P 31 2 1 | a = 4.9160; b = 4.9160; c = 5.4090 | α = 90; β = 90; γ = 120 | 113.21 |
| Fr | Ca0.80Sr3.20Si8.00Al8.00O32.00 | Triclinic | P-1 | a = 8.3670; b = 9.1170; c = 9.2910 | α = 89.57; β = 82.75; γ = 83.38 | 698.37 |
| Ph | K1.90Na0.10Al9.12Mg0.80Fe1.12Si12.96O47.84F0.16H7.84 | Monoclinic | C 1 2/c 1 | a = 5.2230; b = 9.0620; c = 20.0440 | α = 90; β = 95.74; γ = 90.00 | 938.93 |
| Phe-3T | K3.00Al5.36Mg1.92Si10.72O36.00H6.00 | Hexagonal | P 31 1 2 | a = 5.2140; b = 5.2140; c = 29.7380 | α = 90; β = 90; γ = 120 | 700.14 |
| Mo | Al4.00Si8.00O24.00Ca1.00 | Triclinic | P 1 | a = 5.1800; b = 8.9800; c = 15.0000 | α = 90; β = 90; γ = 90 | 697.75 |
| V | Mg13.64Si11.44Al4.56O48.00 | Monoclinic | C 1 2/c 1 | a = 5.3490; b= 9.2550; c = 28.7217 | α = 90; β = 93.5290; γ = 90 | 1419.17 |
| Mu | K2.91Na0.68Ca0.04Al11.01Fe0.12Mg0.09Si12.51Ti0.08O48.00 | Monoclinic | C 1 2/c 1 | a = 5.1910; b = 9.0050; c = 20.1170 | α = 90; β = 95.7730; γ = 90 | 933.43 |
| K | Al2.00Si2.00O9.00H4.00 | Triclinic | P 1 | a = 5.1520; b = 5.1540; c = 7.3910 | α = 74.954; β = 84.22; γ = 60.20 | 164.37 |
| S | K4.00Si12.00Al4.00O32.00 | Monoclinic | C 1 2/m 1 | a = 8.6060; b = 13.0170; c = 7.1850 | α = 90; β = 115.97; γ = 90 | 736.84 |
| N | Al8.00Si8.00O36.00H16.00 | Monoclinic | C 1 c 1 | a = 8.9100 b = 5.1440; c = 14.5930 | α = 90; β = 100.50; γ = 90 | 657.94 |
| Sample | Phases | Cell Parameters (a, b, c) in Å; (α, β, γ) in ° | Volume (Å3) | Crystallite Size (nm) | Microstrain (%) | |
|---|---|---|---|---|---|---|
| S1 | Q | a = 4.9157; b = 4.9157; c = 5.4097 | α = 90; β = 90; γ = 120 | 113.21 | 83.5 | 0.121 |
| F | a = 8.7663; b = 9.0274; c = 9.4109 | α = 89.51; β = 82.32; γ = 83.14 | 732.78 | 3.0 | 7.611 | |
| Ph-3T | a = 5.2568; b = 5.2568; c = 31.1166 | α = 90; β = 90; γ = 120 | 744.68 | 3.2 | 7.109 | |
| S2 | Q | a = 4.9162; b = 4.9162; c = 5.4065 | α = 90; β = 90; γ = 120 | 113.16 | 73.6 | 0.178 |
| Mo | a = 5.2544; b = 8.94925; c =14.9868 | α = 90; β = 90; γ = 90 | 704.73 | 516.7 | 4.422 | |
| V | a = 5.36634; b = 9.16184; c = 28.7061 | α = 90; β = 93.73347; γ = 90 | 1408.36 | 132.9 | 0.262 | |
| S3 | Q | a = 4.91733; b = 4.91733; c = 5.4093 | α = 90; β = 90; γ = 120 | 113.27 | 94.2 | 0.128 |
| Mu | a = 5.23369; b = 9.04311; c = 20.0579 | α = 90; β = 95.57645; γ = 90 | 944.83 | 18.7 | 1.142 | |
| Ph-3T | a = 5.2037; b = 5.2037; c = 29.6038 | α = 90; β = 90; γ = 120 | 694.23 | 10.1 | 1.682 | |
| S4 | Q | a = 4.9149; b = 4.9149; c = 5.4065 | α= 90; β = 90; γ = 120 | 113.10 | 101.4 | 0.131 |
| K | a = 5.1465; b = 5.2105; c = 7.4517 | α = 74.887; β = 84.49; γ = 60.07 | 167.05 | 9.6 | 2.215 | |
| Mu | a = 5.2120; b = 9.0133; c = 20.0607 | α = 90; β = 95.98; γ = 90 | 937.26 | 7.2 | 2.116 | |
| S5 | Q | a = 4.91522; b = 4.9152; c = 5.4052 | α = 90; β = 90; γ = 120 | 113.09 | 115.8 | 0.093 |
| K | a = 5.16362; b = 5.1861; c = 7.4264 | α = 74.92; β = 84.37; γ = 60.07 | 166.29 | 13.4 | 1.748 | |
| S | a = 8.6968; b = 12.9754; c = 7.1882 | α = 90; β = 115.6405; γ = 90 | 731.27 | 21.0 | 0.972 | |
| S6 | Q | a = 4.9149; b = 4.9149; c = 5.4067 | α = 90; β = 90; γ = 120 | 113.11 | 130.8 | 0.077 |
| K | a = 5.1409; b = 5.1759; c = 7.4345 | α = 74.88; β = 84.30; γ = 60.18 | 165.58 | 12.9 | 1.534 | |
| Ph | a =5.2182; b = 9.0297; c = 20.0673 | α = 90; β = 96.034; γ = 90 | 940.30 | 10.3 | 1.332 | |
| S7 | Q | a = 4.9139; b = 4.9139; c = 5.4078 | α = 90; β = 90; γ = 120 | 113.08 | 118.3 | 0.085 |
| Mu | a = 5.2337; b = 8.9646; c = 20.1286 | α = 90; β = 95.36; γ = 90 | 940.26 | 11.2 | 1.223 | |
| N | a = 8.9685; b = 5.1728; c = 14.4872 | α = 90; β = 98.19908; γ = 90 | 665.23 | 11.9 | 1.874 | |
| Wavenumber (cm−1) | Assignment |
|---|---|
| 470.1493 | Si–O bending, Si–O–Fe stretching |
| 530.5970 | Si–O bending, Si–O–Al stretching |
| 700.7463 | Si–O stretching, Si–O–Al stretching |
| 786.5672 | Si–O stretching, Si–O–Al stretching, (Al, Mg)–O–H, Si–O–(Mg, Al) stretching |
| 908.2090 | Al2OH, AL–O–H vibrations |
| 1035.0748 | Si–O–Si, Si–O stretching |
| 1111.9403 | Si–O stretching(out-of-plane) |
| 1629.1045 | H–O–H stretching |
| 2355.9702 | Atmospheric CO2 |
| 3432.0896 | Adsorbed water vibrations (H–O–H) |
| 3624.6269 | Inner OH groups, lying between the sheets of tetrahedral and octahedral units |
| 3696.2687 | Surface hydroxyls |
| Thickness | Samples | ||||||
|---|---|---|---|---|---|---|---|
| S1 | S2 | S3 | S4 | S5 | S6 | S7 | |
| Natural clays (V = 3.0 × 2.5 × 0.5 = 3.75 × 10 mm) | |||||||
| Thickness x = 5 mm | |||||||
| RA (%) | 99.52 | 99.38 | / | 99.61 | / | 99.44 | 99.55 |
| µ/ρ (cm2/g) | 217.39 | 218.05 | / | 248.27 | / | 184.93 | 212.96 |
| Synthetized clays | |||||||
| Thickness x = 5 mm | |||||||
| µ/ρ (cm2/g) | 248.98 | 263.89 | 174.79 | 309.01 | 167.12 | 237.02 | 323.06 |
| Thickness x = 10 mm | |||||||
| µ ρ (cm2/g) | 237.81 | 243.43 | 143.31 | 308.31 | 167.07 | 228.45 | 283.13 |
| Thickness x = 15 mm | |||||||
| µ/ρ (cm2/g) | 193.75 | 214.27 | 87.45 | 280.91 | 158.69 | 175.37 | 229.39 |
Publisher’s Note: MDPI stays neutral with regard to jurisdictional claims in published maps and institutional affiliations. |
© 2022 by the authors. Licensee MDPI, Basel, Switzerland. This article is an open access article distributed under the terms and conditions of the Creative Commons Attribution (CC BY) license (https://creativecommons.org/licenses/by/4.0/).
Share and Cite
Sakher, E.; Smili, B.; Bououdina, M.; Bellucci, S. Structural Study of Nano-Clay and Its Effectiveness in Radiation Protection against X-rays. Nanomaterials 2022, 12, 2332. https://doi.org/10.3390/nano12142332
Sakher E, Smili B, Bououdina M, Bellucci S. Structural Study of Nano-Clay and Its Effectiveness in Radiation Protection against X-rays. Nanomaterials. 2022; 12(14):2332. https://doi.org/10.3390/nano12142332
Chicago/Turabian StyleSakher, Elfahem, Billel Smili, Mohamed Bououdina, and Stefano Bellucci. 2022. "Structural Study of Nano-Clay and Its Effectiveness in Radiation Protection against X-rays" Nanomaterials 12, no. 14: 2332. https://doi.org/10.3390/nano12142332
APA StyleSakher, E., Smili, B., Bououdina, M., & Bellucci, S. (2022). Structural Study of Nano-Clay and Its Effectiveness in Radiation Protection against X-rays. Nanomaterials, 12(14), 2332. https://doi.org/10.3390/nano12142332