Article

Microwave-Assisted Solvothermal Synthesis of Mo-Doped TiO2 with Exceptional Textural Properties and Superior Adsorption Kinetics

by
Yahia H. Ahmad
1,
Aymen S. Abu Hatab
1,2,
Assem T. Mohamed
1,
Mohammed S. Al-Kuwari
3,
Amina S. Aljaber
1 and
Siham Y. Al-Qaradawi
1,*
1
Department of Chemistry and Earth Sciences, College of Arts and Sciences, Qatar University, Doha 2713, Qatar
2
Department of Chemistry, Faculty of Science, Universiti Putra Malaysia UPM, Serdang 43400, Selangor, Malaysia
3
Ministry of Municipality and Environment, Doha 7634, Qatar
*
Author to whom correspondence should be addressed.
Nanomaterials 2022, 12(12), 2051; https://doi.org/10.3390/nano12122051
Submission received: 22 May 2022 / Revised: 6 June 2022 / Accepted: 6 June 2022 / Published: 15 June 2022

Abstract

:
Assigned to their outstanding physicochemical properties, TiO2-based materials have been studied in various applications. Herein, TiO2 doped with different Mo contents (Mo-TiO2) was synthesized via a microwave-assisted solvothermal approach. This was achieved using titanium (IV) butoxide and molybdenum (III) chloride as a precursor and dodecylamine as a surface directing agent. The uniform effective heating delivered by microwave heating reduced the reaction time to less than 30 min, representing several orders of magnitude lower than conventional heating methods. The average particle size ranged between 9.7 and 27.5 nm and it decreased with increasing the Mo content. Furthermore, Mo-TiO2 revealed mesoporous architectures with a high surface area ranging between 170 and 260 m2 g−1, which is superior compared to previously reported Mo-doped TiO2. The performance of Mo-TiO2 was evaluated towards the adsorption of Rhodamine B (RhB). In contrast to TiO2, which revealed negligible adsorption for RhB, Mo-doped samples depicted rapid adsorption for RhB, with a rate that increased with the increase in Mo content. Additionally, Mo-TiO2 expressed enhanced adsorption kinetics for RhB compared to state-of-the-art adsorbents. The introduced synthesis procedure holds a grand promise for the versatile synthesis of metal-doped TiO2 nanostructures with outstanding physicochemical properties.

1. Introduction

Extensive industrial activities are usually accompanied by the release of a wide range of hazardous materials that cause severe environmental pollution. In this context, different technologies have been removing these contaminants and mitigating their harmful effects on humans and ecosystems. Examples of these technologies are solvent extraction, chemical precipitation, coagulation, flocculation, membrane filtration, electrochemical oxidation, and photo-degradation. Among them, adsorption triggered great interest as an environmentally friendly technology that is credible for remediation of different types of pollutants. Compared to other techniques, adsorption has many advantages: ease of operation, environmental-friendliness, low operation cost, low energy input, and absence of toxic residues [1,2]. An ideal adsorbent should have enhanced physicochemical properties such as a high surface area, high adsorption capacity, and an enhanced chemical stability over a wide range of pH [3].
Over the last decades, TiO2 has been employed in a wide range of applications due to its unique merits such as high resistance to photo-corrosion, biocompatibility, remarkable chemical and thermal stabilities, non-toxicity, and low cost [4,5]. These applications extend from heterogeneous catalysis to energy storage, gas sensing, biomedical applications, food industry, and cosmetics [6,7,8,9,10,11,12,13]. TiO2 can be regarded as an ideal adsorbent owing to its non-toxic nature and its stability over a wide range of pH [14]. Accordingly, it was dedicated as an adsorbent for a wide variety of materials such as metal ions [15], dyes [16], gaseous molecules [17], and other organic compounds [18]. The physicochemical properties of TiO2 and its function as well can be tuned by several approaches. Among them, doping was adopted to control the electronic and the chemical properties of TiO2. In this context, different types of dopants were investigated to tolerate the properties of TiO2, such as metals, i.e., Fe, Mn, V, Cr, Cu, etc., and nonmetals, i.e., N, F, S, C, and P. Metal-doping has several merits such as low cost, ease of control, and a stable doped structure [19]. Doping of TiO2 with Mo triggered great interest, which aroused the radius of Mo5+ (0.61 Å) and Mo6+ (0.59 Å) and which are similar to that of Ti4+ (0.605 Å). This means that Mo5+/Mo6+ can effectively substitute Ti4+ in its lattice structure with low lattice distortion [20]. Doping of TiO2 with Mo cannot only influence the surface properties, but also affect the electronic and the optical properties and the material.
Several approaches have investigated the synthesis of Mo-doped TiO2, such as sol-gel, hydrothermal, spray pyrolysis, and magnetron sputtering [21,22,23,24]. For instance, Feng et al. studied the synthesis of Mo-doped TiO2 via a one-pot hydrothermal method at 473 K using dihydroxybis (ammonium lactato) titanium (IV) and ammonium heptamolybdate tetrahydrate as metals precursors [25]. The photocatalytic performance of the prepared materials was investigated for photocatalytic reduction of CO2 to methane. Similarly, Esposito et al. demonstrated the synthesis of Mo-doped TiO2 via a reverse micelle sol-gel approach using titanium butoxide and ammonium heptamolybdate tetrahydrate as metals precursors, cyclohexane as an oil phase, and polyoxyethylene (20) oleyl ether and Brij O20 as surfactants [26]. Their results exhibited that at Mo concentrations ≥ 2.5%, all phases of TiO2 coexist, i.e., anatase, rutile, and brookite. In addition, they found that the bandgap energy decreased with increasing the Mo content up to 7.5%, however, it increased at higher concentrations (10%) owing to the Moss−Burstein effect [26]. Compared to classical heating methods, microwave-assisted synthesis is characterized by several attractive features such as the absence of direct contact between the reactants and the energy source, which afford lower energy inputs, high heating rates, faster kinetics, better reaction yield, better control on the reaction parameters, and more reproducibility of products which are usually characterized by narrow particle size distribution [27,28]. It was investigated for the synthesis of a wide variety of compounds such as metals, alloys, metal oxides, and hybrid materials [29]. Notwithstanding, the synthesis of TiO2 and TiO2 composites via microwave-assisted routes has been frequently investigated [30,31,32], however, the fabrication of metal-doped TiO2 by microwave-assisted technique was rarely investigated [33,34]. In particular, microwave-assisted synthesis of Mo-TiO2 was not emphasized in the reported literature.
In the present study, we demonstrated the synthesis of Mo-doped TiO2 via a microwave-assisted solvothermal route. This was achieved via employment of titanium (IV) butoxide and molybdenum (III) chloride as precursors and dodecylamine as a surface directing agent. The atomic ratio of Mo in samples ranges between 0.9% and 3.1%. The morphological and the spectral properties of the as-prepared samples were examined by SEM-EDX, TEM, N2 physisorption, PXRD, XPS, and Raman spectroscopy. Besides, their performance as adsorbents for the uptake of Rhodamine B (RhB) from aqueous solutions was examined. It is noteworthy stating that the investigated synthesis procedure afforded Mo-doped TiO2 samples with superb specific surface area, which is at least two times greater than literature-reported values for Mo-TiO2. Besides, the adsorption kinetics is remarkably high compared to previously reported adsorbents. This can open the avenue toward the application of this developed synthesis procedure for manufacturing of a wide variety of TiO2-based materials with remarkable textural properties and outstanding catalytic activity.

2. Materials and Methods

2.1. Materials

Titanium (IV) butoxide (97%), molybdenum (III) chloride (99.95%), dodecylamine (98%), and ethanol (99.7%) were purchased from (Sigma-Aldrich Co., St. Louis, MO, USA). Isopropanol and hydrochloric acid (37%) were purchased from VWR Chemicals Co ((VWR International S.A.S., Fontenay-Sous-Bois, France). All chemicals were utilized as received without further purification.

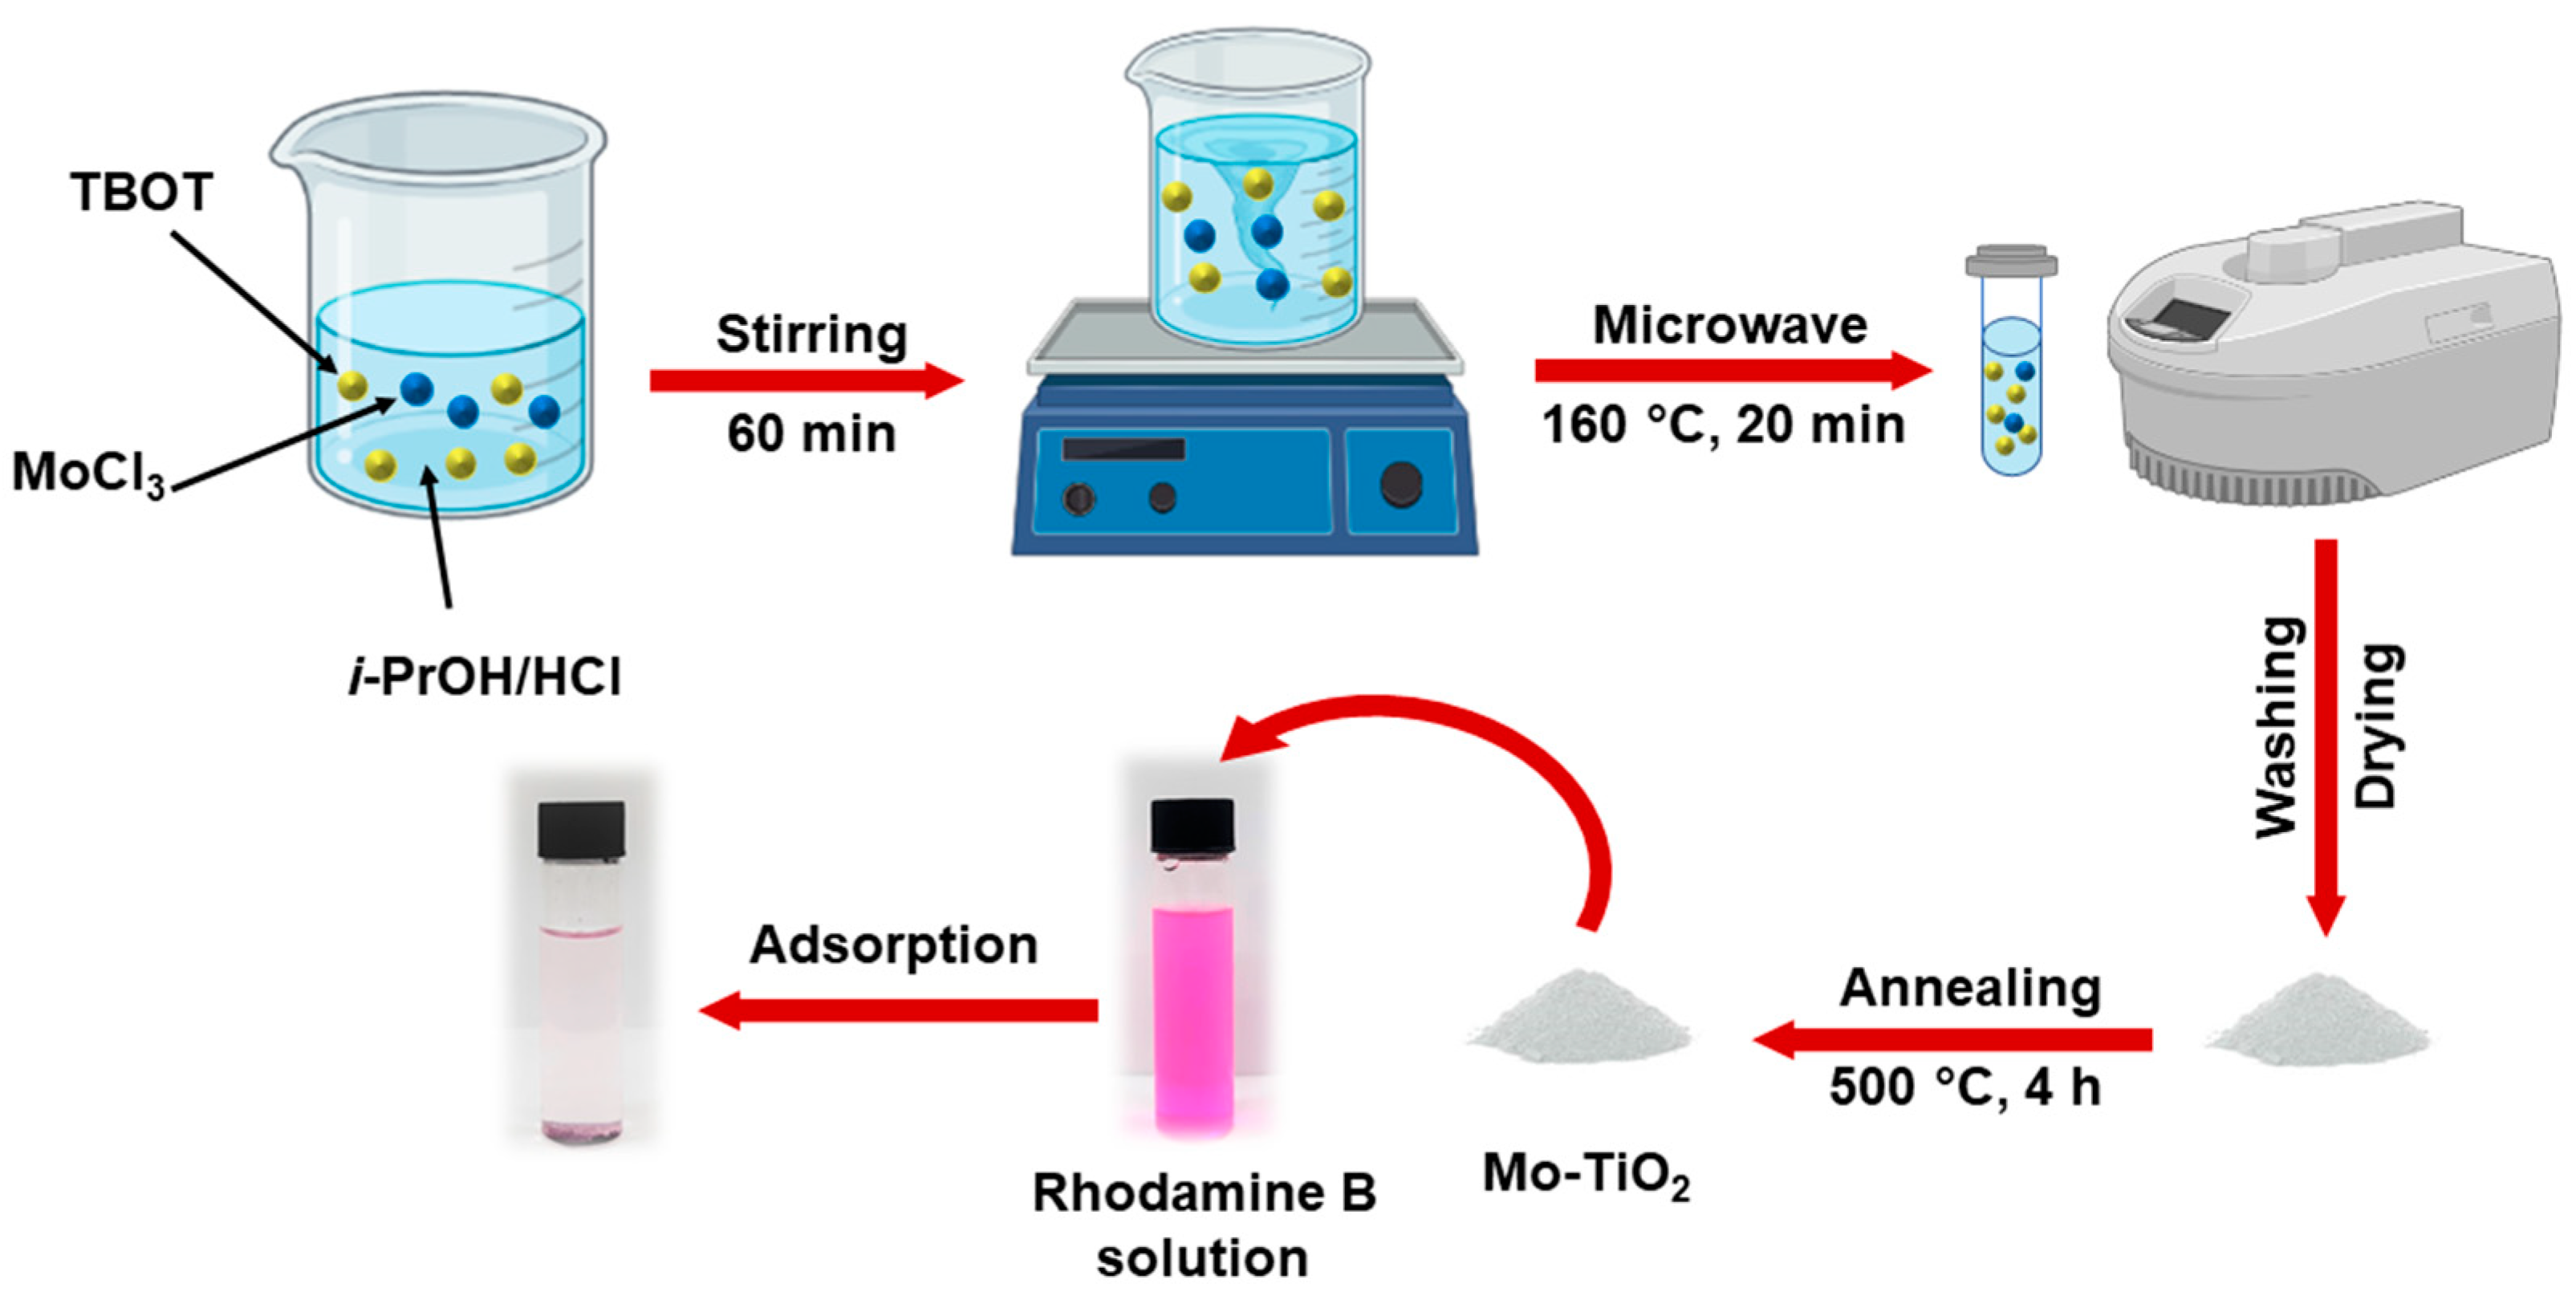
2.2. Materials Synthesis

Synthesis of Mo-Doped TiO2 (Mo-TiO2) Nanoparticles

Mo-TiO2 was synthesized by a microwave-assisted procedure (Scheme 1). In a typical synthesis, 5 mL of titanium (IV) butoxide was added to 30 mL isopropanol containing 5 mL 20% HCl under stirring. To the previous mixture, different amounts of MoCl3 were added to the solution with continuous stirring followed by the addition of 0.6 g of dodecylamine and stirring for a further 30 min. The mixture was placed into a microwave reactor (Anton Paar, Monowave 300 (Anton Paar GmbH, Graz, Austria), operating at a frequency of 2.45 GHz with a maximum power generation of 600 W. The reaction was allowed to react for 30 min at 160 °C. After natural cooling, the as-formed product was collected after several cycles of washing with absolute ethanol/centrifugation at 10,000 rpm. Finally, the product was dried in a vacuum overnight at 60 °C followed by calcination in air at 500 °C, 4 h using a ramping rate of 1 C min−1. The Mo contents were determined by energy-dispersive X-ray (EDX), they were found to be 0.00, 0.92, 1.45, 2.23, and 3.09 atomic%, and they were designated as TiO2, Mo-TiO2-0.9, Mo-TiO2-1.5, Mo-TiO2-2.2, and Mo-TiO2-3.1, respectively.

2.3. Characterization

The morphology of the as-synthesized materials was examined via transmission electron microscopy (TEM) via Tecnai TF20 microscope (FEI Company, Eindhoven, Netherlands) at an operating voltage of 200 kV. The crystal structure was examined by X-ray diffraction (XRD) via an X’Pert Phillips diffractometer (Phillips-PANalytical, Almelo, Netherlands) equipped with Cu-kα radiation (λ = 1.54059 Å). The electronic structures and oxidation states were investigated by X-ray photoelectron spectroscopy (XPS) with Axis Ultra DLD XPS (Kratos, Manchester, UK) equipped with a monochromatic Al-Kα radiation source (1486.6 eV). All binding energies were corrected against standard C 1 s peak, i.e., 284.6 eV. The textural properties were examined via N2 sorption experiments at liquid nitrogen temperature (77 K) using the Brunauer–Emmett–Teller (BET) method.
The zeta-potentials (ζ-potential) measurements were carried out using Zetasizer Nano ZSP instrument (Malvern Instruments Ltd., Worcestershire, UK) based on the electrophoretic mobility by applying Smoluchowski’s approximation. For each measurement, 5 milligrams of the sample were dispersed into 10 mL deionized water and sonicated for 10 min. After that, the pH value was adjusted by the addition of NaOH/HCl, and the steady state value was recorded.

2.4. Adsorption Activity

The performance of prepared materials as adsorbents was investigated towards the uptake of rhodamine B (RhB) as a model contaminant from aqueous solutions using the batch technique. In adsorption experiments, the amount of adsorbent was firstly fixed at 100 mg of the adsorbent in 100 mL of the dye solution, and the dye concentration was set at 10 ppm. Afterward, an adsorption study was performed at different concentrations between 15 ppm and 70 ppm. The adsorption process was studied at 20 °C. The concentration of RhB at different times was estimated from the calibration curves by measuring absorbance at λmax = 554 nm, and the amount of adsorbed RhB (qt) was calculated as a function of time using the equation:
q t = V ( C o C t ) m
where V is the volume of the RhB solution in liters, m is the mass of adsorbent in grams, and Co and Ct are the initial and equilibrium concentrations of RhB at time t, respectively.

3. Results and Discussion

3.1. Synthesis of TiO2 and Mo-TiO2

TiO2 and Mo-TiO2 (of different Mo contents) were synthesized via microwave-assisted solvothermal method using titanium butoxide and MoCl3 as metals precursors, 2-propanol as a solvent, and dodecyl amine as a structure-directing agent. Intuitively, the synthesis of a material with a high surface area and inter/intraparticle porosity can be achieved by utilizing a hard or soft template during the preparation step. Different types of soft templates were employed for the synthesis of mesoporous TiO2-based materials such as nonionic surfactants such as Pluronic P123 [35] and Triton X-100 [36], in addition to ionic surfactants such as cetyl trimethyl ammonium bromide [37]. However, the employment of soft templates for the preparation of metal-doped TiO2 was not explored enough.
The formation model of Mo-TiO2 can be represented by Scheme 2. Firstly, TBOT and MoCl3 are partially hydrolyzed by the acid to form oxide and/or hydroxide monomers, which may agglomerate in the form of small aggregates. The presence of surfactant molecules effectively disperses these aggregates by affording a cage-like environment that limits further nucleation and growth [38]. These small aggregates are assembled through electrostatic attraction between surfactant molecules and the formed nanoparticles. Induced by the rapid and high heating rate delivered by microwave irradiation, these nanoparticles undergo collisional growth and result in the formation of Mo-doped TiO2. Upon calcination, the surfactant molecules decompose and form porous structures with a high surface area (Scheme 2).

3.2. Morphology

Figure 1 demonstrates the TEM images of as-prepared samples. Un-doped TiO2 is present as agglomerations of randomly-shaped nanoparticles. Mo-doped TiO2 depicted a greater extent of distortion in the shape with increasing the Mo content. This may be raised from decrease in the solubility of Mo in the TiO2 lattice, which resulted in the positioning of Mo species on the nanocrystallites or at the grain boundaries. Impressively, samples exhibit narrow particle size distributions, confirming the uniformity and the homogeneity of the nucleation and the growth processes throughout the reaction medium endowed by microwave irradiation. The calculated average particle sizes of samples are 27.5, 18.2, 13.5, 11.6, and 9.7 nm in the case of TiO2, Mo-TiO2-0.9, Mo-TiO2-1.5, Mo-TiO2-2.2, and Mo-TiO2-3.1, respectively, which reveals a decrease in the particle size with increasing the Mo-content, which is consistent with the previous studies. This may be attributed to the presence of Mo, which retards the crystal growth of TiO2 during the synthesis and is consistent with previous studies [25].
Figure 2 represents the TEM images and selected area electron diffraction (SAED) of TiO2-Mo-3.1 nanoparticles. The high-magnification TEM image (Figure 2a) showed clear lattice fringes. The SAED pattern demonstrates clear rings corresponding to the different planes of anatase structure and confirming the crystalline nature of the material. The HRTEM image (Figure 2c) showed lattice fringes with a d-spacing of 0.348 nm, which can be assigned to (101) plane of tetragonal anatase structure. The decrease in the value of d-spacing of Mo-TiO2 compared to the value of pure anatase (0.352 nm) can be attributed to the lattice distortion originated from substitution of Ti4+ with Mo5+/6+ (Figure S1).

3.3. Textural Properties

Figure 3 reveals the N2 adsorption–desorption isotherms and the corresponding pore size distributions of the investigated materials. All as-prepared materials exhibit a type IV isotherm with a hysteresis loop H5, which indicates the presence of opened and blocked pores [39]. The pore size distribution is remarkably an average radius ranging between 3.0 and 8.0 nm, implying the mesoporosity of the samples. It is noticeable that the capillary condensation took place over a wide range of P/P°, starting from 0.2 to 1.0. This affirms the non-uniformity of the pore sizes and the wide pore size distribution. The estimated values of surface area, pore volume, and pore size of studied samples are shown in Table 1. It is evident that the increase of Mo atomic ratio led to a remarkable increase in the surface area, which can be attributed to the decrease in the particle size observed from TEM analysis. The estimated values of surface areas and porosities are superior to previously reported values for Mo-TiO2 samples synthesized by other methods (Table 2), confirming the preferential textural properties delivered by the current approach.

3.4. XRD Analysis

Typically, TiO2 can exists in different forms i.e., anatase, rutile, brookite, and amorphous TiO2. Based on the preparation conditions, it can exist in a pure phase or a mixture of two or more phases. While rutile is stable at high temperatures, anatase is often the predominant phase upon preparation from solutions containing Ti precursor. XRD spectra were analyzed to investigate the crystalline structure of as-prepared nanomaterials. The XRD patterns of TiO2 and different compositions of Mo-TiO2 are manifested in Figure 4. Similar diffraction patterns were obtained for pure TiO2 and Mo-TiO2 samples with an absence of any diffractions ascribed to crystalline molybdenum oxides. This affirms either the complete integration of Mo in the crystal lattice of TiO2 or the amorphous nature of MoOx species or their high dispersion, which hindered their XRD detection [26]. So far, the presence of molybdate species should be studied by Raman spectroscopy. The diffraction peaks at 2θ = 25.3°,37.8°, 48.1°, 53.9°, 55.1°, 62.7°, 68.8°, and 75.0° can be assigned to (101), (004), (200), (105), (211), (204), (116), and (215) planes of the anatase TiO2 (JCPDS Card No. 21-1272), respectively [40]. The diffraction peaks observed at 27.5°, 36.1°, and 69.0° can be indexed to the rutile phase (110), (101), and (301) planes, respectively (JCPDS Card No. 21–1276). The diffraction peak at 30.8° can be attributed to the (121) plane of brookite (JCPDS Card No. 29–1360). It should be noted that the intensities of rutile and brookite peaks remarkably diminish with increasing the Mo content, and the anatase became the predominant phase. The main peak (101) decreases and gets broader with increasing the Mo content, which can be attributed to a decrease in the crystalline nature of TiO2 and an increase in the lattice strain encountered by the size mismatching between Ti4+ and Mo5+/Mo6+ [21,41].
Figure 4. XRD spectra of studied nanomaterials.
Nanomaterials 12 02051 g004
Table 2. Summary of some previous studies demonstrating the synthesis of Mo-doped TiO2.
Preparation MethodMetals PrecursorsReaction ConditionsMo Ratio (%)Specific Surface Area m2 g−1 (Pore Volume cm3 g−1)Reference
Reverse micelle micro-emulsion sol-gel methodTitanium butoxide & ammonium heptamolybdate tetrahydratepolyoxyethylene (20) oleyl ether (Brij O20) surfactants are dispersed in cyclohexane
at 50 °C, then Ti precursor then emulsion broken by 2-propanol, dry, calcine at 500 °C, 2 h.
0 (TiO2)
1%
5%
10%
71 (0.091)
76 (0.112)
74 (0.141)
96 (0.137)
[42]
One-pot hydrothermal methoddihydroxy bis (ammonium lactato) titanium (IV) & ammonium heptamolybdate tetrahydrateaqueous medium 200 °C, 12 h, 8 °C/min.0 (TiO2)
0.1%
0.3%
0.5%
119 (0.32)
140 (0.38)
145 (0.40)
143 (0.36)
[25]
Sol-gel techniqueTitanium butoxide & molybdenum pentachlorideEthanol/acetylacetone/HCl sol is formed, left for 48 h, dry at 80 °C, then calcine at 450 °C--[43]
Hydrothermal methodTiO2 powder & ammonium heptamolybdate tetrahydrate10 M NaOH, 180 °C/24 h
Calcination 500 °C/1 h
0 (TiO2)
3%
5%
10%
112
156
168
172
[44]
Evaporation Induced Self AssemblyTitanium butoxide & ammonium heptamolybdate tetrahydrateEthanol/HNO3, rotary evaporator/17 h, calcine at 300 °C/1 h, then calcine at 400 °C0 (TiO2)
1%
2%
3%
144
151
161
163
[45]
Hydrothermal methodtitanium tetra-isopropoxide & molybdenum pentachlorideIsopropanol/H2O, hydrothermal 150 °C/20 h, calcine 500 °C/4 h0 (TiO2)
0.02%
0.08%
129
127
124
[46]
Reverse micelle sol-gel synthesisTitanium butoxide & ammonium heptamolybdate tetrahydratePolyoxyethylene, oleyl ether, Brij O20 surfactants, cyclohexane/H2O, then emulsion broken by 2-propanol, calcine at 500 °C/2 h0 (TiO2)
0.83%
3.2%
5.8%
7.7%
9.75%
71
42
92
74
65
96
[26]
Microwave-assisted solvothermal methodTitanium butoxide & molybdenum (III) chlorideDodecylamine surfactant, isopropanol/20% HCl, 160 °C, 30 min.0 (TiO2)
0.9%
1.5%
2.2%
3.1%
91.7 (0.35)
173.7 (0.62)
191.7 (0.36)
206.6 (0.33)
256.6 (0.41)
This work
The crystallite sizes were calculated for all samples based on (101) diffraction peak using the Scherrer equation:
L = k λ β c o s θ
where L is the crystallite size, k is constant (0.9), λ is the wavelength of X-ray radiation, and β is the full width at the half maximum of the peak. It can be observed that the crystallite size decreases with increasing the Mo content (Table 1). This can be explained on the basis that Mo slightly restrains the crystal growth, which is consistent with the previous studies [47]. This was explained on the basis that the existence of Mo into the lattice of TiO2 can constitute point defects that act as heterogeneous nucleation sites and hinder crystal growth [48]. The lattice strain, ε , was also evaluated from XRD data using the equation [21]:
ε = β c o s θ 4
It is noticeable that the lattice strain increasing with the increase of the Mo content (Table 1). This can be assigned to the lattice deformation induced by the difference in the size between Ti4+ and Mo5+/6+ [49], and is denoted as dopant-induced lattice strain [50].

3.5. Electronic Structure

The oxidation states of constituent elements were examined by XPS. The XPS survey spectra affirm the presence of Ti, O, and Mo in all Mo-doped samples (Figure S2). Figure 5a demonstrated the high-resolution spectrum of the Ti 2p core level. It reveals two peaks at about 464.7 eV and 458.7 eV, which can be indexed to the Ti 2p1/2 and Ti 2p3/2 of Ti4+ (TiO2), respectively. The small peak at 460.5 eV can be attributed to the Ti3+ present in the lattice of TiO2 [28]. The existence of Ti3+ species can be attributed to two main reasons. Firstly, the high temperature and pressures induced by microwave irradiation induce the formation of Ti3+ [51], which is evident from its existence in the pure TiO2 sample. In addition, Mo-doping enhances the conversion of Ti4+ to Ti3+ through intervalence charge transfer (IVCT) in which a charge compensation mechanism takes place via reduction of the more stable Ti4+ to the less stable Ti3+ together with oxidation of Mo5+ to the more stable Mo6+ [52].
The Mo 3d core level spectrum exhibited two peaks at approximately 232.8 and 235.9 eV, which are assigned to 3d5/2 and 3d3/2, respectively (Figure 5b). Deconvolution of spectra of Mo 3d show two peaks at 232.4 and 233.3 assigned to Mo5+ and Mo6+, respectively. Deconvolution of the O 1 s spectral region revealed the existence of three distinguishable peaks (Figure 5c). The first at 529.7 eV can be assigned to the lattice oxygen [53]. The other peak at 530.7 eV can be attributed to the oxygen at the oxygen-deficient regions [26], whereas the third peak at approximately 532.2 eV can be indexed to the surface hydroxyls and adsorbed oxygen species [54]. The binding energies of Ti2p1/2 and Ti2p3/2 are shifted to higher values with the insertion of Mo into the TiO2 lattice (Figure S3). This can be attributed to the higher electronegativity of Mo compared to Ti. So far, the substitution of Ti with Mo5+/6+ leads to a decrease in the electron density of Ti, and it shifts its binding energies to higher values [53,54]. More detailed XPS data are given in Figures S3–S8.
Undoubtedly, the XPS analysis represents an indication to the surface composition of materials, and it can be a referent to the differences between the bulk and the surface concentrations. The Mo concentrations obtained from XPS measurements revealed a surface enrichment with Mo species, which may be attributed showing the formation of surface polymolybdates, especially at a higher Mo loading (see Table 1) [26].

3.6. Raman Spectroscopy

Raman spectra of the studied TiO2-based nanomaterials are demonstrated in Figure 6a. The Raman modes Eg, B1g, and A1g aroused from symmetric stretching of O–Ti–O, symmetric bending of O–Ti–O, and anti-symmetric bending of O–Ti–O vibrations, respectively [55]. All spectra reveal the Raman modes of anatase at 147 (Eg), 199 (Eg), 399 (B1g), 519 (A1g), and 639 (Eg) cm−1. The low-intensity peak at approximately 235 cm−1 can be attributed to two-phonon scattering aroused from the rutile phase [56]. It is noteworthy that MoO3 species have characteristic Raman peaks at 290, 667, 819, and 995 cm−1 [57]; intriguingly, doped-TiO2 samples revealed the Raman peaks of anatase, however, with a remarkable reduction in the peak intensities owing to the doping of anatase with Mo, which is consistent with previous studies [23]. At a higher Mo content, i.e., more than 3.1 at.% Mo-doped TiO2 samples revealed two additional peaks: one at approximately 845 cm−1 can be indexed to Mo–O–Mo vibration, and the peak at 960 cm−1 can be attributed to Mo = O stretching in octahedrally coordinated Mo species such as Mo7O246+ and Mo8O204- (see Figure S9) [58]. These results implied that excess molybdenum species (strong Lewis acids) are available at the surface of Mo-TiO2 species, owing to the limited solubility of Mo in TiO2 [57].

3.7. Zeta-Potential Measurements

The electrophoretic mobility of samples was investigated by measuring the ζ-potential in water at different pH values between 2 and 10. Results are indicated in Figure 6b. Bare TiO2 depicted a point of zero charge at pH~5.7. The incorporation of Mo into the TiO2 lattice remarkably shifts the PZC towards lower pH values, confirming the increase in the surface acidity at higher Mo concentrations. This can be explained on the basis that the surface of nanoparticles is enriched with Mo+5/+6 species, which have high Lewis acidity [42]. The shift in the ζ-potential towards negative values over a wide pH range can be attributed to the enrichment of the surface with Mo species. This is consistent with the XPS results, which revealed an increased Mo/Ti atomic ratio at the surface compared to the value estimated by EDX analysis.

3.8. Adsorption Study

The activity of the investigated materials were tested as adsorbents for the RhB as a model contaminant. RhB is a highly water-soluble cationic red dye of the xanthene group. It is widely used as a coloring agent in the textile industry and as a fluorescent tracer. It has depicted carcinogenicity, neurotoxicity, and chronic toxicity toward both humans and animals [59,60]. The adsorption efficiency was evaluated by measuring the change in the absorbance of a RhB solution at a wavelength of 554 nm as a function of time. The adsorption of RhB was studied to investigate the impact of Mo-doping on the adsorbability (Figure 7a). In the presence of pure TiO2, RhB showed a negligible adsorption with time. This can imply a weak interaction between TiO2 and the dye. However, the adsorption capacity significantly increased with increasing the Mo content, and it followed the order TiO2-Mo-3.1 > TiO2-Mo-2.2 > TiO2-Mo-1.5 > TiO2-Mo-0.9 > TiO2. This can be explained based on the zeta-potential of TiO2 and Mo-TiO2 samples, which is shifted toward more negative values with increasing the Mo-content. This can enhance the electrostatic attraction between the cationic RhB molecules and the negatively charged surface of the adsorbent. In addition, the increase in the surface area caused by increasing the concentration of Mo can also afford more surface active sites, which enhance the adsorption process.
The adsorption of different concentrations of RhB (ranging between 15 and 70 mg L−1) as a function of contact time on TiO2-Mo-3.1 is presented in Figure 7b. At all initial concentrations, the rate of adsorption of RhB is fast at the beginning of the adsorption process, however, it gradually decreased at higher contact times until it reached a steady state. This can be attributed to the partial decrease in the concentration of the RhB, which is regarded as the driving force to further adsorption, in addition to the decrease in the number of available active sites [61]. The required time to reach equilibrium increased from 5 to 120 min when the initial RhB concentration increased from 1 to 40 mg/L. It should be noted that the time required to reach equilibrium increases with increasing the initial concentration of RhB. Similarly, the adsorption capacity increased from 15 mg/g to 60 mg/g, when the initial concentration of RhB increased from 15 to 70 ppm. This can be explained on the basis of the higher concentration of RhB representing a high driving force for the diffusion of RhB molecules, which accelerate the mass transfer of RhB from the bulk of the solution to the active sites of the adsorbent, especially those located at the inner surface.
At the early stages of the adsorption process, a large number of surface active sites are not occupied, and they are available for the adsorption process. So far, the adsorption process is rapid at the beginning of adsorption. After that, the adsorption process is retarded owing to the decrease in the number of un-occupied sites available for adsorption. During this stage, a small part of the RhB molecules can overcome the diffusion and penetrate inside the pores. At higher contact times exceeding 2 h, no significant changes were observed in the RhB uptake, which indicates that the equilibration time is approximately 2 h. Figure 7c exhibits the removal efficiency of RhB as a function of the initial concentration. It affirms the enhanced adsorption ability of Mo-TiO2, which maintains high removal efficiency even at relatively high RhB concentrations, i.e., 79.3% at initial concentration of 70 mg L−1 (see Figure 7c).

3.8.1. Adsorption Isotherms

The adsorption data was analyzed in order to select the most suitable isotherm equation representing the current adsorption process. This was selected based on the values of the regression coefficient (R2) of their linear relations. The tested isotherms are:
The Langmuir isotherm can be represented by the equation:
C e q e = 1 K q m a x + C e q m a x
where, Ce (mg/L) is the equilibrium concentration of the adsorbent into the liquid, qe is the equilibrium adsorption capacity (mg/g), qmax is the maximum monolayer coverage capacity of adsorbent (mg/g), and K is the Langmuir adsorption constant (L/mg).
The Freundlich isotherm is given as:
l o g q e = l o g K F + 1 n l o g C e
where KF is a constant related to the sorption capacity and n is a constant representing the favorability of the sorption system.
The Temkin isotherm can be represented by the formula:
q e = B l n A T + B l n C e
B = R T b T
where, bT is the Temkin isotherm constant (J mol−1), R is the universal gas constant (8.314 J K−1 mol−1), T is the absolute temperature (K), AT is the Temkin isotherm equilibrium binding constant (L g−1), and B is the constant related to heat of adsorption.
The Dubinin–Radushkevich (D-R) isotherm can be expressed as:
ln q e = ln q s β ε 2
ε = R T ( 1 + 1 C e )
where qs is the theoretical isotherm saturation capacity (mg g−1); β is the D-R isotherm constant with a dimension of energy, and ε is the Polanyi potential
The adsorption data was applied to the four isotherms (Figure 8) and the calculated constants are presented in Table 3. According to values of obtained regression coefficients, the Langmuir isotherm is the best model describing the adsorption data. The calculated maximum monolayer coverage capacity from the Langmuir isotherm was 69.01 mg g−1.

3.8.2. Adsorption Kinetics

The adsorption mechanism and kinetics were studied by fitting of the experimental adsorption data to two kinetic models, i.e., pseudo-first order and pseudo-second order models. The fitness of both models was determined based on their R2 values of their correlation coefficients of their linear forms. The pseudo first-order kinetic model can be expressed as:
log ( q e q t ) = log q e k 1 t 2.303
where k1 represents the rate constant of the pseudo first-order adsorption (min−1). The linear form of pseudo second-order kinetic model can be presented by the equation:
t q t = 1 k 2 q e 2 + ( 1 q e ) t
where k2 represents the rate constant of the pseudo second-order adsorption (g mg−1 min−1). The plots representing the model are presented in Figure 9 and the calculated kinetic parameters are given in Table 4. At all concentrations, the calculated correlation coefficient (R2) for the pseudo second-order was much higher than obtained from the pseudo first-order. In addition, the values of q e estimated by the pseud-second order model is much closer to the experimental values compared to the pseudo-first order model. This implies more fitness delivered by the pseudo second-order model.
Based on the zeta-potential measurements, Mo-TiO2 exhibits a negative charge at pH 7, while Rh.B. has a positive charge at the same pH. Based on this, the adsorption process is induced by electrostatic interactions between the negative charges of Mo-TiO2 and the positive charge of Rh.B. Following this step, the adsorbed species undergo intra-particle diffusion through the pores to the internal surface. Finally, the adsorbent–adsorbate equilibrium is established at the interfacial region. It is noteworthy mentioning that the TiO2-Mo-3.1 sample expressed enhanced adsorption kinetics compared to other state-of-the-art adsorbents available in literature. This is evident by comparing the adsorption performance previously reported state-of-the-art and other commercial adsorbents (Table 5 and Figure S10).
The adsorption kinetics particle diffusion model was studied in order to get more insights on the adsorption mechanism and the rate-determining step. Generally, it postulates three steps for the adsorption process, which are the external mass transport, intra-particle diffusion, and adsorption at the interior surface site. The overall rate of adsorption may be controlled by one of the steps or a combination of more steps [62]. The rate-determining step (r.d.s.) is investigated by the plot of qt vs. t1/2. If one straight line passes through the origin results, this means that the intra-particle diffusion is the r.d.s. However, if multi-straight lines arise and none of them pass through the origin, this means that the intra-particle diffusion is not the only r.d.s. and a combination of many steps are involved in the adsorption [61]. Results imply that intra-particle diffusion is not the only controlling step and many steps are involved in the adsorption (Figure 10).

4. Conclusions

Nanosized crystalline TiO2 and Mo-doped TiO2 of different Mo contents were synthesized via a microwave-assisted solvothermal approach. X-ray diffraction revealed that well-crystalline structures, where anatase is the prevailing phase with the abundance of rutile as a minor component, decreases with increasing the Mo content. The crystallite size decreases with increasing the concentration of Mo, which is accompanied by an increase in the strain owing to the lattice distortion originating from the size difference between Ti4+ and Mo5+/6+. XPS study depicted that molybdenum exists in two oxidation states, i.e., Mo6+ as a main component and Mo5+ as a minor, while titanium is present as Ti4+ with a minority of Ti3+ species. The performance of investigated materials as adsorbents for RhB from aqueous solutions was studied. Results revealed that contrary to un-doped TiO2, which showed negligible adsorbability, adsorption is enhanced upon increasing the Mo content. The adsorption data was fitted to different isotherms and kinetic models, and it was found to best fit the Langmuir adsorption isotherm and the pseudo-second order model. Despite the complexity of the adsorption process, which can be influenced by many factors, the Mo-content was found to be the dominant parameter, where its increase led to an increase in the negativity of the ζ-potential and so far enhances the adsorption of cationic RhB species. For clarity, the introduced materials demonstrated outstanding textural properties and enhanced performance as adsorbents. This may open the avenue toward synthesis of analogous TiO2-based nanomaterials that can be employed in environmental remediation.

Supplementary Materials

The following supporting information can be downloaded at: https://www.mdpi.com/article/10.3390/nano12122051/s1, Figure S1: High resolution TEM images of (a) TiO2, (b) TiO2-Mo-0.9, (c) TiO2-Mo-1.5, and (d) TiO2-Mo-2.2; Figure S2: XPS survey spectra of TiO2 and Mo-TiO2; Figure S3: High-resolution XPS spectra of Ti 2p region in all samples; Figure S4: XPS deconvolution of Ti 2p core level in (a) TiO2, (b) TiO2-Mo-0.9, (c) TiO2-Mo-1.5, and (d) TiO2-Mo-2.2; Figure S5: High-resolution XPS spectra of Mo 3d region in studied samples; Figure S6: XPS deconvolution of Mo 3d core level in (a) TiO2-Mo-0.9, (b) TiO2-Mo-1.5, and (c) TiO2-Mo-2.2; Figure S7: High-resolution XPS spectra of O 1s region in investigated samples; Figure S8: XPS deconvolution of O 1s core level in (a) TiO2, (b) TiO2-Mo-0.9, (c) TiO2-Mo-1.5, and (d) TiO2-Mo-2.2; Figure S9: Raman spectrum of TiO2-Mo-3.9; Figure S10: Effect of contact time on the adsorption of Rh.B. for TiO2-Mo-3.1 compared to commercial adsorbents (Co = 10 mg L−1, temperature = 298K).

Author Contributions

Conceptualization, Y.H.A.; writing–original draft, A.S.A.H.; data curation and methodology, A.T.M.; methodology and formal analysis, M.S.A.-K.; funding acquisition and conceptualization, A.S.A.; supervision and resources, S.Y.A.-Q.; project administration and validation. All authors have read and agreed to the published version of the manuscript.

Funding

NPRP Grant no. NPRP 12S-0304-190218 from the Qatar National Research Fund (a member of the Qatar Foundation). The statements made herein are solely the responsibility of the authors.

Acknowledgments

The authors acknowledge the technical support of Central Laboratories Unit (CLU), Center for Advanced Materials (CAM), and Gas Processing Center (GPC), Qatar University, Doha, Qatar.

Conflicts of Interest

The authors declare no conflict of interest.

References

  1. Ghasemi, Z.; Seif, A.; Ahmadi, T.S.; Zargar, B.; Rashidi, F.; Rouzbahani, G.M. Thermodynamic and kinetic studies for the adsorption of Hg(II) by nano-TiO2 from aqueous solution. Adv. Powder Technol. 2012, 23, 148–156. [Google Scholar] [CrossRef]
  2. Rafatullah, M.; Sulaiman, O.; Hashim, R.; Ahmad, A. Adsorption of methylene blue on low-cost adsorbents: A review. J. Hazard. Mater. 2010, 177, 70–80. [Google Scholar] [CrossRef] [PubMed]
  3. Ahmaruzzaman, M. Adsorption of phenolic compounds on low-cost adsorbents: A review. Adv. Colloid Interface Sci. 2008, 143, 48–67. [Google Scholar] [CrossRef] [PubMed]
  4. Devi, L.G.; Murthy, B.N.; Kumar, S.G. Photocatalytic activity of V5+, Mo6+ and Th4+ doped polycrystalline TiO2 for the degradation of chlorpyrifos under UV/solar light. J. Mol. Catal. A Chem. 2009, 308, 174–181. [Google Scholar] [CrossRef]
  5. Zhu, J.; Chen, F.; Zhang, J.; Chen, H.; Anpo, M. Fe3+-TiO2 photocatalysts prepared by combining sol–gel method with hydrothermal treatment and their characterization. J. Photochem. Photobiol. A Chem. 2006, 180, 196–204. [Google Scholar] [CrossRef]
  6. Lu, B.; Ma, B.; Deng, X.; Wu, B.; Wu, Z.; Luo, J.; Wang, X.; Chen, G. Dual stabilized architecture of hollow Si@ TiO2@C nanospheres as anode of high-performance Li-ion battery. Chem. Eng. J. 2018, 351, 269–279. [Google Scholar] [CrossRef]
  7. Pazhamalai, P.; Krishnamoorthy, K.; Mariappan, V.K.; Kim, S.-J. Blue TiO2 nanosheets as a high-performance electrode material for supercapacitors. J. Colloid Interface Sci. 2019, 536, 62–70. [Google Scholar] [CrossRef]
  8. Galstyan, V.; Ponzoni, A.; Kholmanov, I.; Natile, M.M.; Comini, E.; Nematov, S.; Sberveglieri, G. Reduced graphene oxide–TiO2 nanotube composite: Comprehensive study for gas-sensing applications. ACS Appl. Nano Mater. 2018, 1, 7098–7105. [Google Scholar] [CrossRef]
  9. Zhu, Z.; Cai, H.; Sun, D.-W. Titanium dioxide (TiO2) photocatalysis technology for nonthermal inactivation of microorganisms in foods. Trends Food Sci. Technol. 2018, 75, 23–35. [Google Scholar] [CrossRef]
  10. Dréno, B.; Alexis, A.; Chuberre, B.; Marinovich, M. Safety of titanium dioxide nanoparticles in cosmetics. J. Eur. Acad. Dermatol. Venereol. 2019, 33, 34–46. [Google Scholar] [CrossRef] [Green Version]
  11. Ahmad, Y.H.; Mohamed, A.T.; Sliem, M.H.; Abdullah, A.M.; Al-Qaradawi, S.Y. Enhanced photocatalytic performance of WON@porous TiO2 nanofibers towards sunlight-assisted degradation of organic contaminants. RSC Adv. 2018, 8, 32747–32755. [Google Scholar] [CrossRef] [PubMed] [Green Version]
  12. Gang, R.; Xia, Y.; Xu, L.; Zhang, L.; Ju, S.; Wang, Z.; Koppala, S. Size controlled Ag decorated TiO2 plasmonic photocatalysts for tetracycline degradation under visible light. Surf. Interfaces 2022, 31, 102018. [Google Scholar] [CrossRef]
  13. Qureshi, A.A.; Javed, H.M.A.; Javed, S.; Bashir, A.; Usman, M.; Akram, A.; Ahmad, M.I.; Ali, U.; Shahid, M.; Rizwan, M.; et al. Incorporation of Zr-doped TiO2 nanoparticles in electron transport layer for efficient planar perovskite solar cells. Surf. Interfaces 2021, 25, 101299. [Google Scholar] [CrossRef]
  14. Jakobsson, A.-M. Measurement and Modeling of Th Sorption onto TiO2. J. Colloid Interface Sci. 1999, 220, 367–373. [Google Scholar] [CrossRef] [PubMed]
  15. Tan, X.; Fang, M.; Li, J.; Lu, Y.; Wang, X. Adsorption of Eu(III) onto TiO2: Effect of pH, concentration, ionic strength and soil fulvic acid. J. Hazard. Mater. 2009, 168, 458–465. [Google Scholar] [CrossRef]
  16. Fan, J.; Cai, W.; Yu, J. Adsorption of N719 Dye on Anatase TiO2 Nanoparticles and Nanosheets with Exposed (001) Facets: Equilibrium, Kinetic, and Thermodynamic Studies. Chem. Asian J. 2011, 6, 2481–2490. [Google Scholar] [CrossRef]
  17. Sivachandiran, L.; Thevenet, F.; Gravejat, P.; Rousseau, A. Investigation of NO and NO2 adsorption mechanisms on TiO2 at room temperature. Appl. Catal. B Environ. 2013, 142–143, 196–204. [Google Scholar] [CrossRef]
  18. Pettibone, J.M.; Cwiertny, D.M.; Scherer, M.; Grassian, V.H. Adsorption of Organic Acids on TiO2 Nanoparticles: Effects of pH, Nanoparticle Size, and Nanoparticle Aggregation. Langmuir 2008, 24, 6659–6667. [Google Scholar] [CrossRef]
  19. Yoong, L.S.; Chong, F.K.; Dutta, B.K. Development of copper-doped TiO2 photocatalyst for hydrogen production under visible light. Energy 2009, 34, 1652–1661. [Google Scholar] [CrossRef]
  20. Liu, Z.; Chen, W.-F.; Zhang, X.; Zhang, J.; Koshy, P.; Sorrell, C.C. Structural and microstructural effects of Mo3+/Mo5+ codoping on properties and photocatalytic performance of nanostructured TiO2 Thin films. J. Phys. Chem. C 2019, 123, 11781–11790. [Google Scholar] [CrossRef]
  21. Sreedhar, M.; Brijitta, J.; Reddy, I.N.; Cho, M.; Shim, J.; Bera, P.; Joshi, B.N.; Yoon, S.S. Dye degradation studies of Mo-doped TiO2 thin films developed by reactive sputtering. Surf. Interface Anal. 2018, 50, 171–179. [Google Scholar] [CrossRef]
  22. Mardare, D.; Cornei, N.; Luca, D.; Dobromir, M.; Irimiciuc, Ş.A.; Pungă, L.; Pui, A.; Adomniţei, C. Synthesis and hydrophilic properties of Mo doped TiO2 thin films. J. Appl. Phys. 2014, 115, 213501. [Google Scholar] [CrossRef]
  23. Tsai, M.-C.; Nguyen, T.-T.; Akalework, N.G.; Pan, C.-J.; Rick, J.; Liao, Y.-F.; Su, W.-N.; Hwang, B.-J. Interplay between molybdenum dopant and oxygen vacancies in a TiO2 support enhances the oxygen reduction reaction. ACS Catal. 2016, 6, 6551–6559. [Google Scholar] [CrossRef]
  24. Liao, H.; Xie, L.; Zhang, Y.; Qiu, X.; Li, S.; Huang, Z.; Hou, H.; Ji, X. Mo-doped gray anatase TiO2: Lattice expansion for enhanced sodium storage. Electrochim. Acta 2016, 219, 227–234. [Google Scholar] [CrossRef]
  25. Feng, S.; Zhao, J.; Bai, Y.; Liang, X.; Wang, T.; Wang, C. Facile synthesis of Mo-doped TiO2 for selective photocatalytic CO2 reduction to methane: Promoted H2O dissociation by Mo doping. J. CO2 Util. 2020, 38, 1–9. [Google Scholar] [CrossRef]
  26. Esposito, S.; Ditaranto, N.; Dell’Agli, G.; Nasi, R.; Rivolo, P.; Bonelli, B. Effective Inclusion of Sizable Amounts of Mo within TiO2 Nanoparticles Can Be Obtained by Reverse Micelle Sol–Gel Synthesis. ACS Omega 2021, 6, 5379–5388. [Google Scholar] [CrossRef]
  27. Bilecka, I.; Niederberger, M. Microwave chemistry for inorganic nanomaterials synthesis. Nanoscale 2010, 2, 1358–1374. [Google Scholar] [CrossRef]
  28. Yang, Y.; Wang, G.; Deng, Q.; Ng, D.H.L.; Zhao, H. Microwave-Assisted Fabrication of Nanoparticulate TiO2 Microspheres for Synergistic Photocatalytic Removal of Cr(VI) and Methyl Orange. ACS Appl. Mater. Interfaces 2014, 6, 3008–3015. [Google Scholar] [CrossRef]
  29. Kumar, A.; Kuang, Y.; Liang, Z.; Sun, X. Microwave chemistry, recent advancements, and eco-friendly microwave-assisted synthesis of nanoarchitectures and their applications: A review. Mater. Today Nano 2020, 11, 100076. [Google Scholar] [CrossRef]
  30. Cui, L.; Hui, K.N.; Hui, K.S.; Lee, S.K.; Zhou, W.; Wan, Z.P.; Thuc, C.-N.H. Facile microwave-assisted hydrothermal synthesis of TiO2 nanotubes. Mater. Lett. 2012, 75, 175–178. [Google Scholar] [CrossRef]
  31. Ding, K.; Miao, Z.; Liu, Z.; Zhang, Z.; Han, B.; An, G.; Miao, S.; Xie, Y. Facile Synthesis of High Quality TiO2 Nanocrystals in Ionic Liquid via a Microwave-Assisted Process. J. Am. Chem. Soc. 2007, 129, 6362–6363. [Google Scholar] [CrossRef] [PubMed]
  32. Pu, X.; Zhang, D.; Gao, Y.; Shao, X.; Ding, G.; Li, S.; Zhao, S. One-pot microwave-assisted combustion synthesis of graphene oxide–TiO2 hybrids for photodegradation of methyl orange. J. Alloys Compd. 2013, 551, 382–388. [Google Scholar] [CrossRef]
  33. Esquivel, K.; Nava, R.; Zamudio-Méndez, A.; González, M.V.; Jaime-Acuña, O.E.; Escobar-Alarcón, L.; Peralta-Hernández, J.M.; Pawelec, B.; Fierro, J.L.G. Microwave-assisted synthesis of (S)Fe/TiO2 systems: Effects of synthesis conditions and dopant concentration on photoactivity. Appl. Catal. B Environ. 2013, 140–141, 213–224. [Google Scholar] [CrossRef]
  34. Suwarnkar, M.B.; Dhabbe, R.S.; Kadam, A.N.; Garadkar, K.M. Enhanced photocatalytic activity of Ag doped TiO2 nanoparticles synthesized by a microwave assisted method. Ceram. Int. 2014, 40, 5489–5496. [Google Scholar] [CrossRef]
  35. Calleja, G.; Serrano, D.P.; Sanz, R.; Pizarro, P.; García, A. Study on the synthesis of high-surface-area mesoporous TiO2 in the presence of nonionic surfactants. Ind. Eng. Chem. Res. 2004, 43, 2485–2492. [Google Scholar] [CrossRef]
  36. Kluson, P.; Kacer, P.; Cajthaml, T.; Kalaji, M. Preparation of titania mesoporous materials using a surfactant-mediated sol–gel method. J. Mater. Chem. 2001, 11, 644–651. [Google Scholar] [CrossRef]
  37. Lee, D.-U.; Jang, S.-R.; Vittal, R.; Lee, J.; Kim, K.-J. CTAB facilitated spherical rutile TiO2 particles and their advantage in a dye-sensitized solar cell. Sol. Energy 2008, 82, 1042–1048. [Google Scholar] [CrossRef]
  38. Tian, G.; Fu, H.; Jing, L.; Xin, B.; Pan, K. Preparation and Characterization of Stable Biphase TiO2 Photocatalyst with High Crystallinity, Large Surface Area, and Enhanced Photoactivity. J. Phys. Chem. C 2008, 112, 3083–3089. [Google Scholar] [CrossRef]
  39. Thommes, M.; Kaneko, K.; Neimark, A.V.; Olivier, J.P.; Rodriguez-Reinoso, F.; Rouquerol, J.; Sing, K.S.W. Physisorption of gases, with special reference to the evaluation of surface area and pore size distribution (IUPAC Technical Report). Pure Appl. Chem. 2015, 87, 1051–1069. [Google Scholar] [CrossRef] [Green Version]
  40. Huang, C.-Y.; Guo, R.-T.; Pan, W.-G.; Tang, J.-Y.; Zhou, W.-G.; Liu, X.-Y.; Qin, H.; Jia, P.-Y. One-dimension TiO2 nanostructures with enhanced activity for CO2 photocatalytic reduction. Appl. Surf. Sci. 2019, 464, 534–543. [Google Scholar] [CrossRef]
  41. Bregani, F.; Casale, C.; Depero, L.; Natali-Sora, I.; Robba, D.; Sangaletti, L.; Toledo, G. Temperature effects on the size of anatase crystallites in Mo-TiO2 and W-TiO2 powders. Sens. Actuat. B Chem. 1996, 31, 25–28. [Google Scholar] [CrossRef]
  42. Nasi, R.; Esposito, S.; Freyria, F.S.; Armandi, M.; Gadhi, T.A.; Hernandez, S.; Rivolo, P.; Ditaranto, N.; Bonelli, B. Application of Reverse Micelle Sol–Gel Synthesis for Bulk Doping and Heteroatoms Surface Enrichment in Mo-Doped TiO2 Nanoparticles. Materials 2019, 12, 937. [Google Scholar] [CrossRef] [PubMed] [Green Version]
  43. Wang, S.; Bai, L.; Sun, H.; Jiang, Q.; Lian, J. Structure and photocatalytic property of Mo-doped TiO2 nanoparticles. Powder Technol. 2013, 244, 9–15. [Google Scholar] [CrossRef]
  44. Li, J.; Wang, D.; Liu, H.; Zhu, Z. Multilayered Mo-doped TiO2 nanofibers and enhanced photocatalytic activity. Mater. Manuf. Process 2012, 27, 631–635. [Google Scholar] [CrossRef]
  45. Avilés-García, O.; Espino-Valencia, J.; Romero, R.; Rico-Cerda, J.L.; Arroyo-Albiter, M.; Natividad, R. W and Mo doped TiO2: Synthesis, characterization and photocatalytic activity. Fuel 2017, 198, 31–41. [Google Scholar] [CrossRef]
  46. Zhang, X.; Chen, W.-F.; Bahmanrokh, G.; Kumar, V.; Ho, N.; Koshy, P.; Sorrell, C.C. Synthesis of V- and Mo-doped/codoped TiO2 powders for photocatalytic degradation of methylene blue. Nano-Struct. Nano-Objects 2020, 24, 100557. [Google Scholar] [CrossRef]
  47. Luo, S.-Y.; Yan, B.-X.; Shen, J. Enhancement of photoelectric and photocatalytic activities: Mo doped TiO2 thin films deposited by sputtering. Thin Solid Film. 2012, 522, 361–365. [Google Scholar] [CrossRef]
  48. Liu, G.; Wang, L.; Yang, H.G.; Cheng, H.-M.; Lu, G.Q. Titania-based photocatalysts—crystal growth, doping and heterostructuring. J. Mater. Chem. 2010, 20, 831–843. [Google Scholar] [CrossRef]
  49. Štengl, V.; Bakardjieva, S. Molybdenum-Doped Anatase and Its Extraordinary Photocatalytic Activity in the Degradation of Orange II in the UV and vis Regions. J. Phys. Chem. C 2010, 114, 19308–19317. [Google Scholar] [CrossRef]
  50. Khan, H.; Berk, D. Characterization and mechanistic study of Mo+6 and V+5 codoped TiO2 as a photocatalyst. J. Photochem. Photobiol. A Chem. 2014, 294, 96–109. [Google Scholar] [CrossRef]
  51. Zhang, Z.; Yang, X.; Hedhili, M.N.; Ahmed, E.; Shi, L.; Wang, P. Microwave-Assisted Self-Doping of TiO2 Photonic Crystals for Efficient Photoelectrochemical Water Splitting. ACS Appl. Mater. Interfaces 2014, 6, 691–696. [Google Scholar] [CrossRef] [PubMed]
  52. Jiang, Y.; Chen, W.-F.; Koshy, P.; Sorrell, C.C. Enhanced photocatalytic performance of nanostructured TiO2 thin films through combined effects of polymer conjugation and Mo-doping. J. Mater. Sci. 2019, 54, 5266–5279. [Google Scholar] [CrossRef]
  53. Niu, X.; Yan, W.; Shao, C.; Zhao, H.; Yang, J. Hydrothermal synthesis of Mo-C co-doped TiO2 and coupled with fluorine-doped tin oxide (FTO) for high-efficiency photodegradation of methylene blue and tetracycline: Effect of donor-acceptor passivated co-doping. Appl. Surf. Sci. 2019, 466, 882–892. [Google Scholar] [CrossRef]
  54. Wang, D.-H.; Jia, L.; Wu, X.-L.; Lu, L.-Q.; Xu, A.-W. One-step hydrothermal synthesis of N-doped TiO2/C nanocomposites with high visible light photocatalytic activity. Nanoscale 2012, 4, 576–584. [Google Scholar] [CrossRef]
  55. Tian, F.; Zhang, Y.; Zhang, J.; Pan, C. Raman Spectroscopy: A New Approach to Measure the Percentage of Anatase TiO2 Exposed (001) Facets. J. Phys. Chem. C 2012, 116, 7515–7519. [Google Scholar] [CrossRef]
  56. Zhang, J.; Li, M.; Feng, Z.; Chen, J.; Li, C. UV Raman Spectroscopic Study on TiO2. I. Phase Transformation at the Surface and in the Bulk. J. Phys. Chem. B 2006, 110, 927–935. [Google Scholar] [CrossRef]
  57. Hu, H.; Wachs, I.E.; Bare, S.R. Surface Structures of Supported Molybdenum Oxide Catalysts: Characterization by Raman and Mo L3-Edge XANES. J. Phys. Chem. 1995, 99, 10897–10910. [Google Scholar] [CrossRef]
  58. Stampfl, S.R.; Chen, Y.; Dumesic, J.; Niu, C.; Hill Jr, C. Interactions of molybdenum oxide with various oxide supports: Calcination of mechanical mixtures. J. Catal. 1987, 105, 445–454. [Google Scholar] [CrossRef]
  59. Shimada, T.; Yamazaki, H.; Mimura, M.; Inui, Y.; Guengerich, F.P. Interindividual variations in human liver cytochrome P-450 enzymes involved in the oxidation of drugs, carcinogens and toxic chemicals: Studies with liver microsomes of 30 Japanese and 30 Caucasians. J. Pharmacol. Exp. Ther. 1994, 270, 414. [Google Scholar]
  60. Alakhras, F.; Alhajri, E.; Haounati, R.; Ouachtak, H.; Addi, A.A.; Saleh, T.A. A comparative study of photocatalytic degradation of Rhodamine B using natural-based zeolite composites. Surf. Interfaces 2020, 20, 100611. [Google Scholar] [CrossRef]
  61. Li, Z.; Meng, X.; Zhang, Z. Equilibrium and kinetic modelling of adsorption of Rhodamine B on MoS2. Mater. Res. Bull. 2019, 111, 238–244. [Google Scholar] [CrossRef]
  62. Ding, L.; Zou, B.; Gao, W.; Liu, Q.; Wang, Z.; Guo, Y.; Wang, X.; Liu, Y. Adsorption of Rhodamine-B from aqueous solution using treated rice husk-based activated carbon. Colloids Surf. A Physicochem. Eng. Asp. 2014, 446, 1–7. [Google Scholar] [CrossRef]
  63. Liu, X.; Guo, Y.; Zhang, C.; Huang, X.; Ma, K.; Zhang, Y. Preparation of graphene oxide/4A molecular sieve composite and evaluation of adsorption performance for Rhodamine B. Sep. Purif. Technol. 2022, 286, 120400. [Google Scholar] [CrossRef]
  64. Cheng, Z.-L.; Li, Y.-X.; Liu, Z. Study on adsorption of rhodamine B onto Beta zeolites by tuning SiO2/Al2O3 ratio. Ecotoxicol. Environ. Saf. 2018, 148, 585–592. [Google Scholar] [CrossRef]
  65. Khan, T.A.; Dahiya, S.; Ali, I. Use of kaolinite as adsorbent: Equilibrium, dynamics and thermodynamic studies on the adsorption of Rhodamine B from aqueous solution. Appl. Clay Sci. 2012, 69, 58–66. [Google Scholar] [CrossRef]
  66. Mittal, H.; Mishra, S.B. Gum ghatti and Fe3O4 magnetic nanoparticles based nanocomposites for the effective adsorption of rhodamine B. Carbohydr. Polym. 2014, 101, 1255–1264. [Google Scholar] [CrossRef]
  67. Cui, W.; Kang, X.; Zhang, X.; Cui, X. Gel-like ZnO/Zr-MOF(bpy) nanocomposite for highly efficient adsorption of Rhodamine B dye from aqueous solution. J. Phys. Chem. Solids 2019, 134, 165–175. [Google Scholar] [CrossRef]
Scheme 1. The synthesis procedure of Mo-TiO2.
Nanomaterials 12 02051 sch001
Scheme 2. Schematic diagram for the formation mechanism of Mo-TiO2.
Nanomaterials 12 02051 sch002
Figure 1. TEM micrographs and the corresponding particle size distribution of (a) TiO2, (b) TiO2-Mo-0.9, (c) TiO2-Mo-1.5, (d) TiO2-Mo-2.2, and (e) TiO2-Mo-3.1.
Nanomaterials 12 02051 g001
Figure 2. (a) High magnification TEM image, (b) HRTEM image, and (c) SAED pattern of TiO2-Mo-3.1.
Nanomaterials 12 02051 g002
Figure 3. N2 physisorption isotherms of (a) TiO2, (b) TiO2-Mo-0.9, (c) TiO2-Mo-1.5, (d) TiO2-Mo-2.2, and (e) TiO2-Mo-3.1. The inset figures represent the pore sizes distribution curves.
Nanomaterials 12 02051 g003
Figure 5. Deconvoluted XPS high-resolution spectra of (a) Ti 2p, (b) Mo 3d, and (c) O 1s in Mo-TiO2-3.1.
Nanomaterials 12 02051 g005
Figure 6. (a) Raman spectra of investigated TiO2-based materials and (b) the variation of zeta-potential of investigated nanomaterials with the pH.
Nanomaterials 12 02051 g006
Figure 7. (a) Effect of contact time on the adsorption of RhB on different adsorbents (Co = 10 mg L−1, temperature = 298 K), (b) Effect of initial concentration and contact time on the adsorption of RhB on TiO2-Mo-3.1 at 293 K, and (c) Effect of the initial concentration on the removal efficiency of RhB at 293 K.
Nanomaterials 12 02051 g007
Figure 8. Fitting of equilibrium data to the different adsorption isotherms; (a) Langmuir, (b) Freundlich, (c) Temkin, and (d) Dubinin–Radushkevich.
Nanomaterials 12 02051 g008
Figure 9. Fitting of adsorption data to (a) pseudo-first order model and (b) pseudo-second order model.
Nanomaterials 12 02051 g009
Figure 10. Particle diffusion model of RhB on TiO2-Mo-3.1 at different RhB concentrations.
Nanomaterials 12 02051 g010
Table 1. The textural properties of investigated samples as evaluated from EDX analysis, XRD, and N2 physisorption experiments at −196 °C.
SampleAtomic Ratio of Mo from EDXAtomic Ratio of Mo from XPSL (Crystallite Size, nm)ε (Lattice Strain)Specific Surface Area (m2 g−1)Pore Volume (cm3 g−1)Pore Radius (nm)
TiO2--13.712.53 × 10−291.70.357.6
TiO2-Mo-0.90.931.2310.743.23 × 10−2173.70.627.2
TiO2-Mo-1.51.451.929.943.49 × 10−2191.70.363.7
TiO2-Mo-2.22.232.758.963.87 × 10−2206.60.333.2
TiO2-Mo-3.13.094.467.934.37 × 10−2256.50.413.2
Table 3. Summary of isotherms parameters.
IsothermParameterValue
Langmuirqmax69.01
K (L mg−1)0.288
R20.981
Freundlichn2.09
Kf (L g−1)17.273
R20.943
TemkinB15.054
AT (L g−1)1.053
bT (J mol−1)162.374
R20.971
Dubinin–Radushkevichqs (mg g−1)45.403
R20.881
Table 4. The kinetic parameters calculated from the pseudo first- and the second-order models.
Co (ppm)Pseudo-First Order ModelPseudo-Second Order Model
k1 (min−1)qe (mg g−1)R2k2 (g mg−1 min−1)qe (mg g−1)R2
150.05681.4680.83990.091614.1380.9999
200.04741.8070.84550.054218.6150.9999
250.02122.5150.77260.012624.0730.9998
300.05413.6110.82720.008427.1150.9997
400.05793.8630.95810.007437.7790.9998
500.06413.8460.97970.007145.1670.9994
600.06303.4720.96030.010950.5050.9999
700.06305.8840.94550.013657.2080.9999
Table 5. Previously reported pseudo-second order rate constants for RhB onto other adsorbents.
AdsorbentRhB Concentration, mg L−1Temperature (K)Rate Constant, k2 × 10−3
(g mg−1 min−1)
Reference
MoS2 mesoporous microspheres prepared using CH4N2S10
15
20
2933.0
3.0
1.0
[61]
treated rice husk-based activated carbon1002931.68[62]
graphene oxide/4A molecular sieve composite1029823.0[63]
Beta zeolites (SiO2/Al2O3 = 18.4)2029561.0[64]
Kaolinite20
40
60
3034.69
2.30
1.26
[65]
Gum ghatti/Fe3O4 nanocomposite5029867.0[66]
ZnO/Zr-MOF(bpy) nanocomposite10
30
50
2982.69
1.06
0.334
[67]
TiO2-Mo-3.115
20
40
50
60
29391.6
54.2
8.40
7.40
7.10
This work
Publisher’s Note: MDPI stays neutral with regard to jurisdictional claims in published maps and institutional affiliations.

